


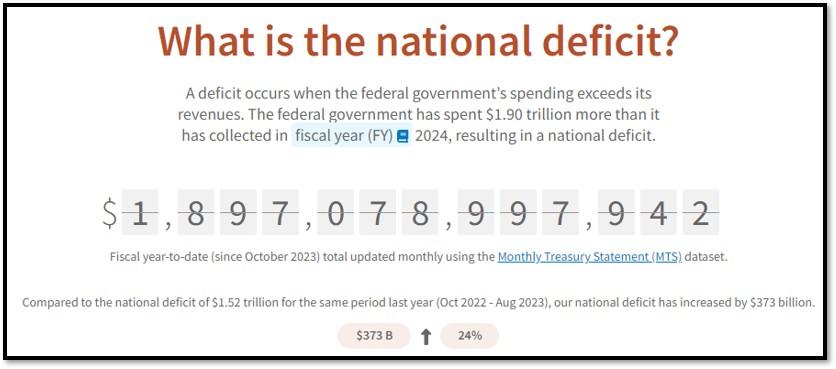
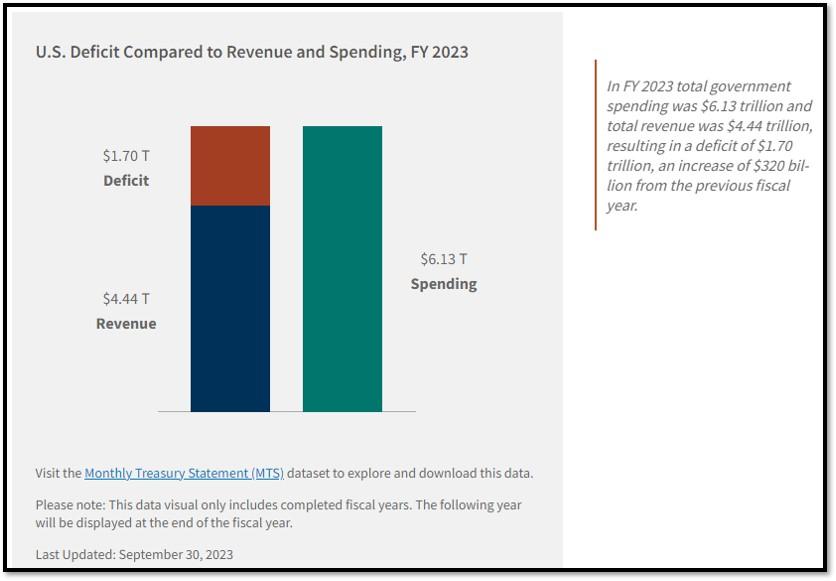
- 1. In his most recent weekly article titled “The Budget Blowout,” Brian Wesbury of First Trust highlights the alarming growth of the U.S. federal budget deficit, which reached $1.9 trillion in 2024, accounting for 6.7% of GDP.
- 2. Revisiting Cloud Computing – The case for cloud computing is far from overdone; in fact, it appears to be just beginning.
- With the current macro-economic backdrop, below are areas we currently favor:
- 3. This week’s main story is Microsoft’s partnership with Constellation to secure renewable energy for AI expansion reflects a broader trend of tech companies seeking sustainable energy sources to power their growing AI operations.
- 4. World Watch
- 5. Quant & Technical Corner
1. In his most recent weekly article titled “The Budget Blowout,” Brian Wesbury of First Trust highlights the alarming growth of the U.S. federal budget deficit, which reached $1.9 trillion in 2024, accounting for 6.7% of GDP.
He compares this deficit to previous years, noting that it is unusually high despite the absence of a major war or recession. Wesbury attributes the growing deficit to rising interest payments on federal debt, increased healthcare costs, and spending on student loan forgiveness, emphasizing the need for structural reforms to address long-term fiscal challenges. I strongly recommend you read it. Here is the link to access the piece. REF: FirstTrust, FiscalData
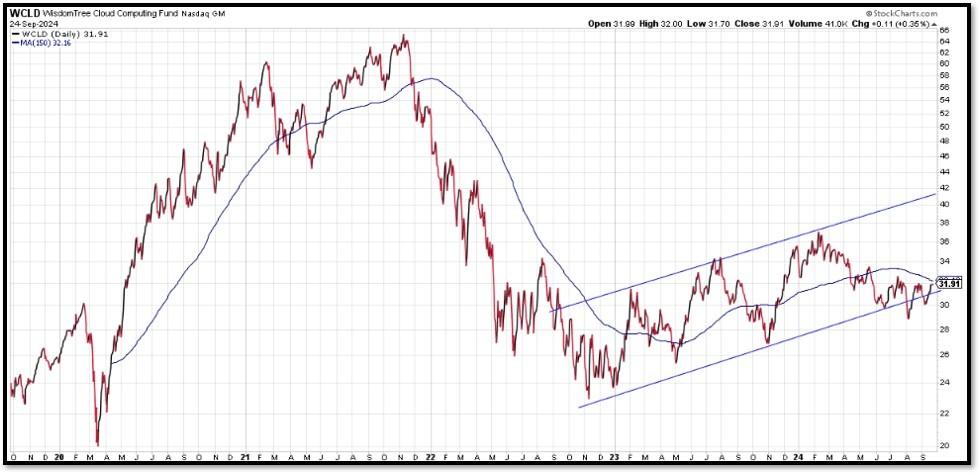
2. Revisiting Cloud Computing – The case for cloud computing is far from overdone; in fact, it appears to be just beginning.
As industries increasingly integrate technologies like artificial intelligence (AI) and machine learning, cloud computing is becoming essential for handling the growing demands of data processing and storage. Major players like Amazon Web Services (AWS), Microsoft Azure, and Google Cloud are investing heavily in AI-driven cloud platforms, which continue to gain importance across industries.
Moreover, despite the growth seen in cloud adoption, many enterprises are still in the early stages of migrating their workloads to the cloud. This points to a large untapped potential for further growth. Additionally, the rise of hybrid and multi-cloud strategies—where businesses utilize a mix of private and public clouds—shows that cloud computing is not a temporary solution but a long-term shift in IT infrastructure. Other emerging technologies, such as edge computing and the Internet of Things (IoT), further extend the relevance of cloud computing. As edge devices generate massive amounts of data, cloud infrastructure provides the necessary scalability and analytics capabilities to handle these demands. REF: CableLabs, Qualys, Gartner
I use (WCLD) to get exposure to Cloud Computing. REF: The Wisdom Tree Cloud Computing ETF (WCLD)
*With the current macro-economic backdrop, below are areas we currently favor:
- Fixed Income – Short-term (Low-Beta)
- Fixed Income – Adding Duration, preferred stocks & High Yield as Opportunistic Allocation (Low-Beta)
- Businesses that contribute to and benefit from AI & Automation (Market-Risk)
- Mid Cap Stocks, Small Cap Stocks & European Stocks (Market-Risk)
- Industrials (Market-Risk)
- Clean Energy / Solar / Utilities (Market-Risk)
- Healthcare & Biotechnology (Market-Risk)
- Gold (Market-Risk)
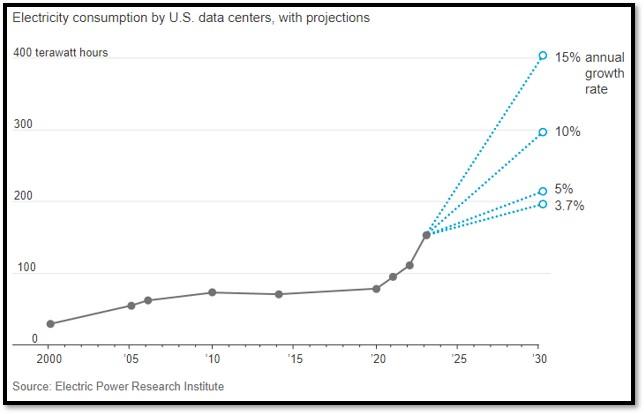
3. This week’s main story is Microsoft’s partnership with Constellation to secure renewable energy for AI expansion reflects a broader trend of tech companies seeking sustainable energy sources to power their growing AI operations.
As AI models require massive computational resources, energy demand is increasing, driving the need for renewable, reliable power to meet sustainability goals. Other tech giants like Google, Amazon, and Meta are also making similar moves, aiming to reduce their carbon footprint while ensuring enough energy to support AI-driven data centers and operations. This trend aligns with the global shift towards green energy in tech.
Another example of companies securing energy capacity is Google, which has committed to powering its data centers with 100% renewable energy. To achieve this, Google signs long-term power purchase agreements (PPAs) with renewable energy providers, including solar and wind farms with (Engie, EDF Renewables, Orsted, Iberdrola, and Sol Systems). They have also invested in energy storage technologies and are working on matching their energy consumption with renewable energy every hour of every day. This approach ensures reliable energy supply while meeting sustainability goals, helping to balance growing AI and cloud computing energy demands. Click onto pictures below to access videos. REF: Bloomberg, ConstellationEnergy, DCD, WSJ


4. World Watch
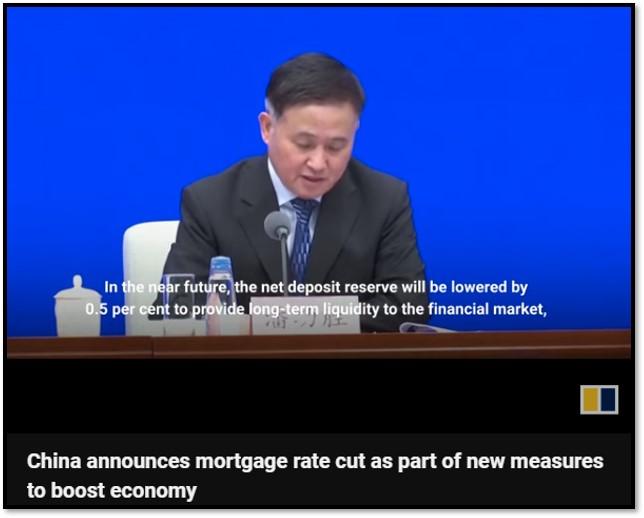
4A. The People’s Bank of China (PBoC) plans to cut interest rates and reduce the reserve requirement ratio (RRR)—the amount of cash banks must hold in reserve. This dual measure aims to inject more liquidity into the financial system, encouraging banks to lend more, which can stimulate consumer spending, business investment, and overall economic activity. These moves are intended to support China’s slowing economy, which has been facing challenges like lower growth, weaker demand, and global uncertainties, thus boosting credit and liquidity in the market. The effort to revive China’s economy is welcomed, but economists say it will not be enough to repair China’s broken housing market or pull the economy out of a deflationary slump. Click onto pictures below to access videos. REF: WSJ, SCMP, Bloomberg

4B. Sam Altman, CEO of OpenAI, recently pitched the Biden administration on the need for significant investment in massive data centers to support AI development. OpenAI proposed building data centers with a combined power capacity of 5 gigawatts, equivalent to the energy output of five nuclear reactors – or enough to power almost 3 million homes according to Bloomberg. This infrastructure is seen as crucial for maintaining the U.S.’s competitive edge in AI and creating thousands of jobs. Altman emphasized that supportive policies are needed to ensure these data centers can meet the increasing demands of AI innovation.
Meanwhile, Sam Altman released his latest blog dated 9/23/24 titled “The Intelligence Age.” Sam outlined his vision for a future transformed by artificial intelligence. He predicts that superintelligent AI could emerge within the next few thousand days, bringing revolutionary changes to society. Altman envisions AI augmenting human capabilities, with applications like personalized AI assistants, virtual tutors, and breakthroughs in healthcare and software development. He emphasizes that AI will lead to shared global prosperity, improving quality of life on an unprecedented scale. However, he also acknowledges the high stakes and challenges, such as the energy demands and ethical implications, that must be navigated as we approach this new era of superintelligence. Click onto picture below to access video of MIT President talks with Sam Altman about AI. REF: Bloomberg, TheIntelligenceAgeBySamAltman, Sam’sBlog


4C. On Sunday, September 22, 2024, Prime Minister Narendra Modi met with tech leaders in New York, discussing advancements in areas like artificial intelligence, biotechnology, and semiconductors. The roundtable, organized by MIT’s School of Engineering, aimed to explore opportunities for collaboration in emerging technologies. Modi emphasized India’s commitment to innovation, intellectual property protection, and becoming a global tech hub, particularly in semiconductor manufacturing. CEOs from major companies like Google, Adobe, IBM, and NVIDIA expressed interest in working with India’s growing technology sector. The CEOs also discussed how the India-US partnership could advance technology-driven solutions to global challenges, from healthcare to sustainable development. Click onto picture below to access video. REF: CNBC, IndiaNN

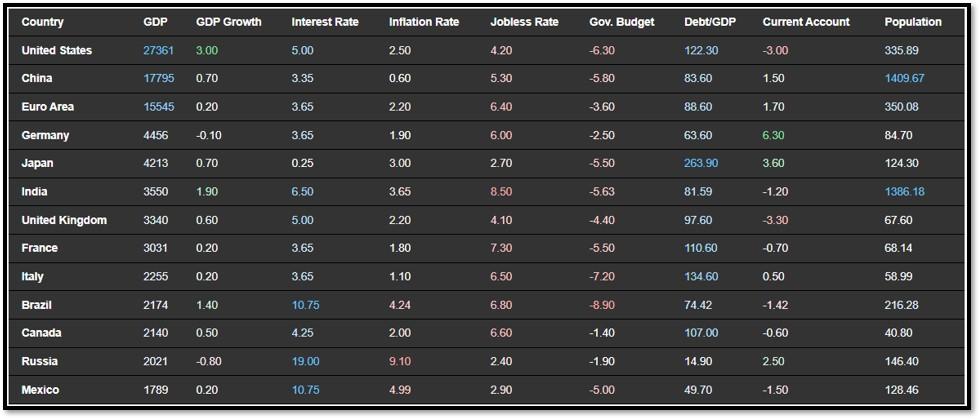
4D. Below is an updated snapshot of the current global state of economy according to TradingEconomics as of 9/23/2024. REF: TradingEconomics
- The annual inflation rate in Japan rose to 3.0% in August 2024 from 2.8% in the prior three months, pointing to the highest level since October 2023.
- People’s Bank of China (PBOC) announced several measures aimed at boosting the country’s economy in response to recent weak data, which raised concerns about China meeting its official growth target of around 5%.
- WTI crude oil futures rose toward $71 per barrel on Tuesday, recouping losses from the previous session as the prospect of supply disruptions outweighed concerns over sluggish demand.
- The au Jibun Bank Japan Services PMI rose to 53.9 in September 2024 from a final 53.7 in the prior month, flash data showed.
5. Quant & Technical Corner
Below is a selection of quantitative & technical data we monitor on a regular basis to help gauge the overall financial market conditions and the investment environment.
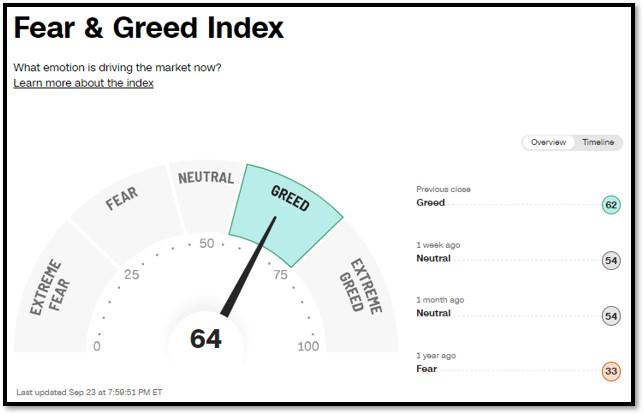
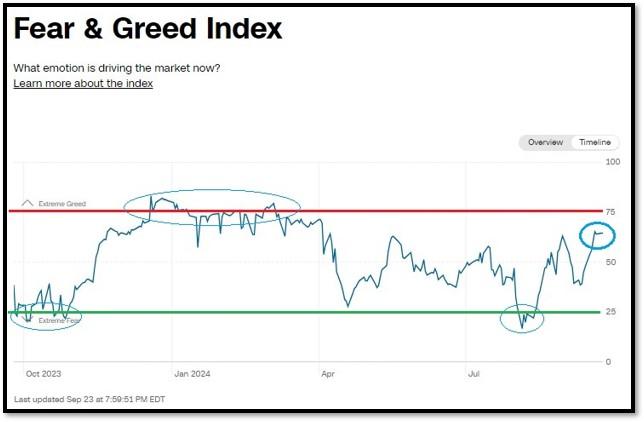
5A. Most recent read on the Fear & Greed Index with data as of 9/23/2024 – 7:59PM-ET is 64 (Greed). Last week’s data was 54 (Neutral) (1-100). CNNMoney’s Fear & Greed index looks at 7 indicators (Stock Price Momentum, Stock Price Strength, Stock Price Breadth, Put and Call Options, Junk Bond Demand, Market Volatility, and Safe Haven Demand). Keep in mind this is a contrarian indicator! REF: Fear&Greed via CNNMoney
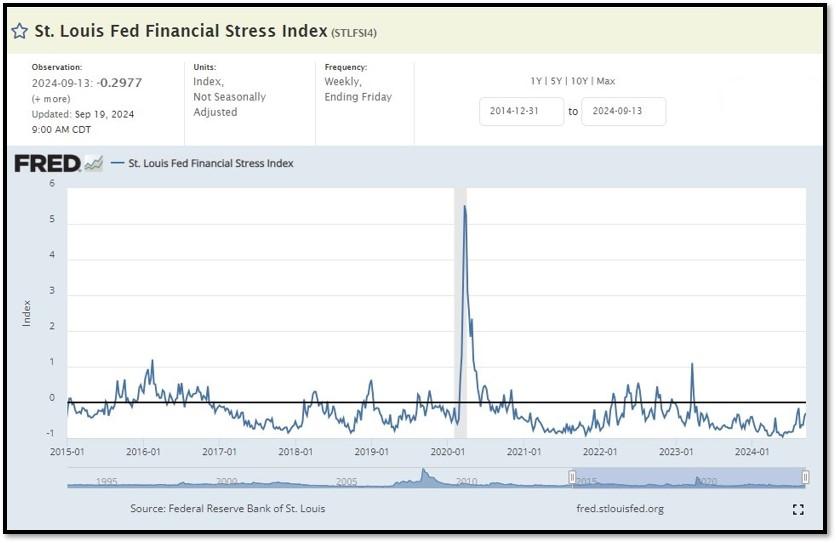
5B. St. Louis Fed Financial Stress Index’s (STLFSI4) most recent read is at –0.2977 as of September 19, 2024. A big spike up from previous readings reflecting the recent turmoil in the banking sector. Previous week’s data was -0.3763. This weekly index is not seasonally adjusted. The STLFSI4 measures the degree of financial stress in the markets and is constructed from 18 weekly data series: seven interest rate series, six yield spreads and five other indicators. Each of these variables captures some aspect of financial stress. Accordingly, as the level of financial stress in the economy changes, the data series are likely to move together. REF: St. Louis Fed
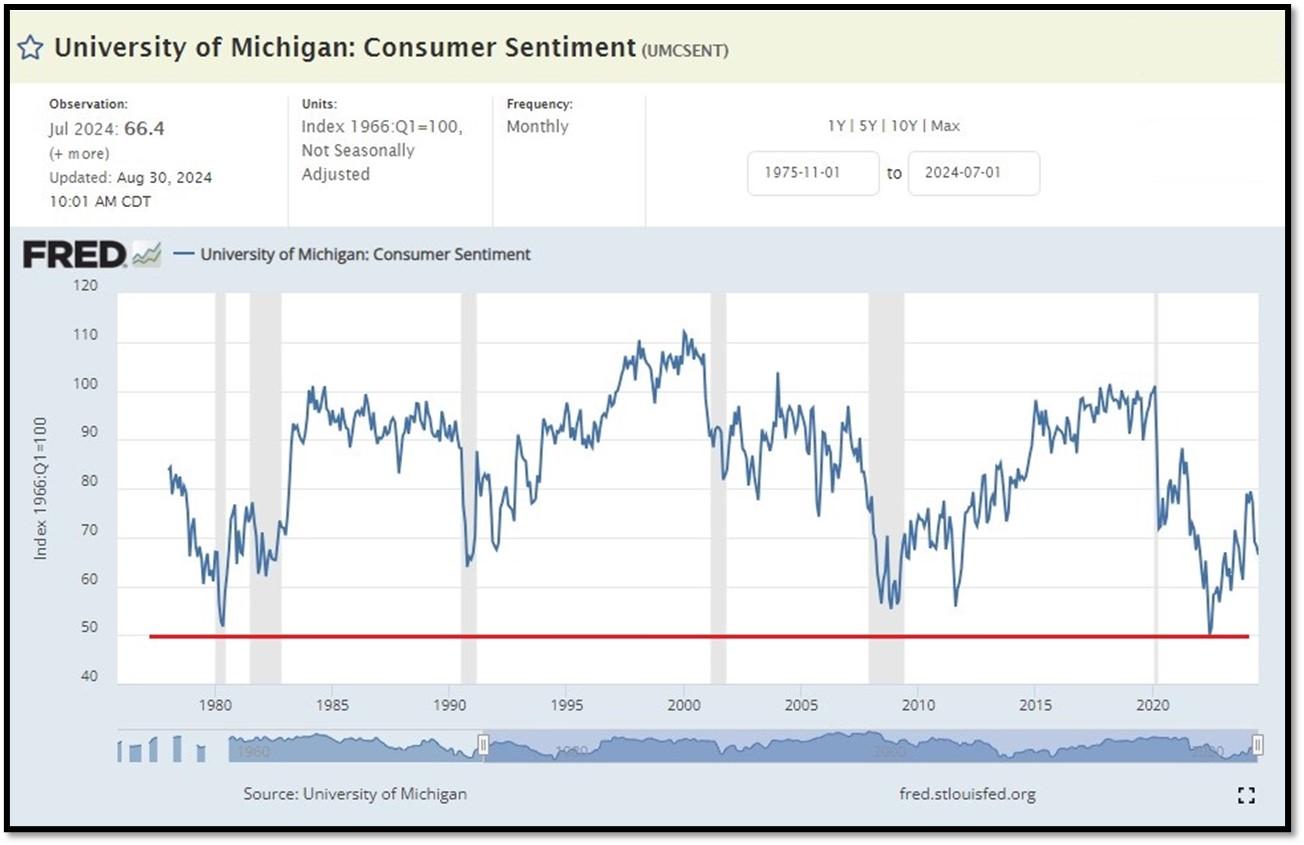
5C. University of Michigan, University of Michigan: Consumer Sentiment for June [UMCSENT] at 66.4 (last month’s data at 68.2), retrieved from FRED, Federal Reserve Bank of St. Louis, August 30, 2024. Back in June 2022, Consumer Sentiment hit a low point going back to April 1980. REF: UofM
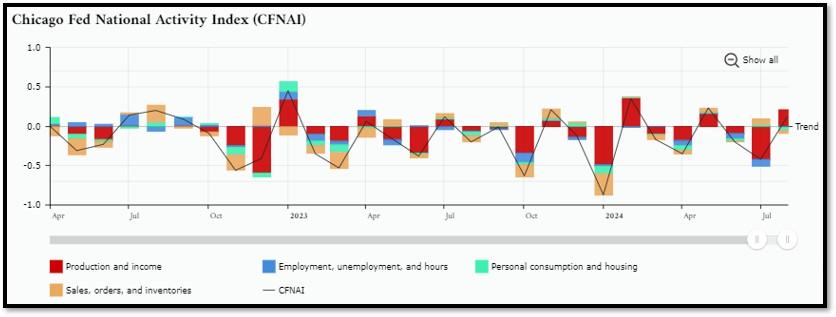
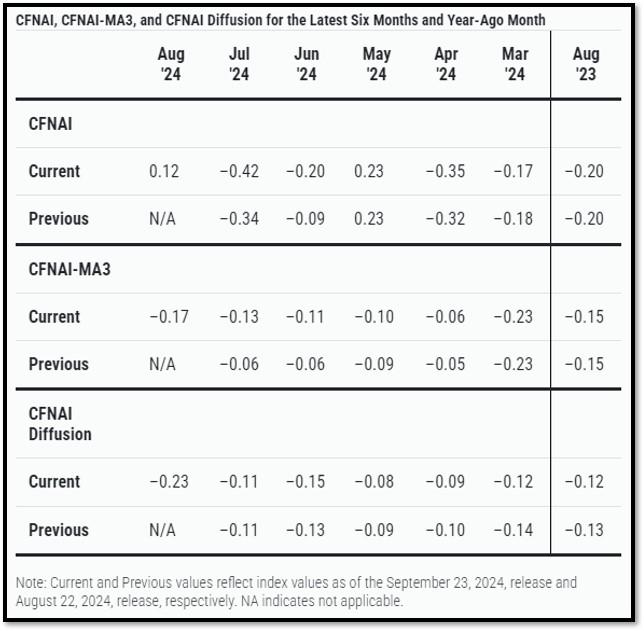
5D. The Chicago Fed National Activity Index (CFNAI) increased to +0.12 in August from –0.42 in July. Two of the four broad categories of indicators used to construct the index increased from July, and one category made a positive contribution in August. The index’s three-month moving average, CFNAI-MA3, decreased to –0.17 in August from –0.13 in July. REF: ChicagoFed, August’s Report
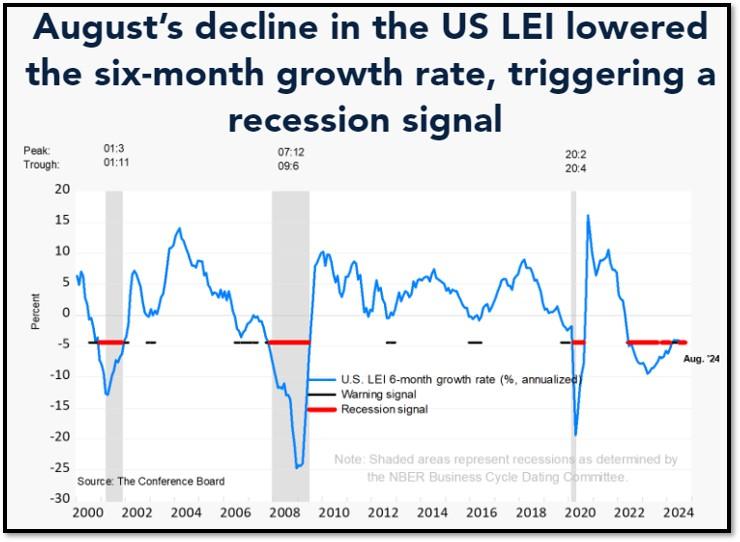
5E. (09/19/2024) The Conference Board Leading Economic Index (LEI) for the U.S. declined by 0.2% in August 2024 to 100.2 (2016=100), following an unrevised 0.6% decline in July. Over the six-month period between February and August 2024, the LEI fell by 2.3%, a smaller rate of decline than the 2.7% drop over the six-month period between August 2023 and February 2024. The composite economic indexes are the key elements in an analytic system designed to signal peaks and troughs in the business cycle. The indexes are constructed to summarize and reveal common turning points in the economy in a clearer and more convincing manner than any individual component. The CEI is highly correlated with real GDP. The LEI is a predictive variable that anticipates (or “leads”) turning points in the business cycle by around 7 months. Shaded areas denote recession periods or economic contractions. The dates above the shaded areas show the chronology of peaks and troughs in the business cycle. The ten components of The Conference Board Leading Economic Index® for the U.S. include: Average weekly hours in manufacturing; Average weekly initial claims for unemployment insurance; Manufacturers’ new orders for consumer goods and materials; ISM® Index of New Orders; Manufacturers’ new orders for nondefense capital goods excluding aircraft orders; Building permits for new private housing units; S&P 500® Index of Stock Prices; Leading Credit Index™; Interest rate spread (10-year Treasury bonds less federal funds rate); Average consumer expectations for business conditions. REF: ConferenceBoard, LEI Report for July (Released on 8/30/2024)
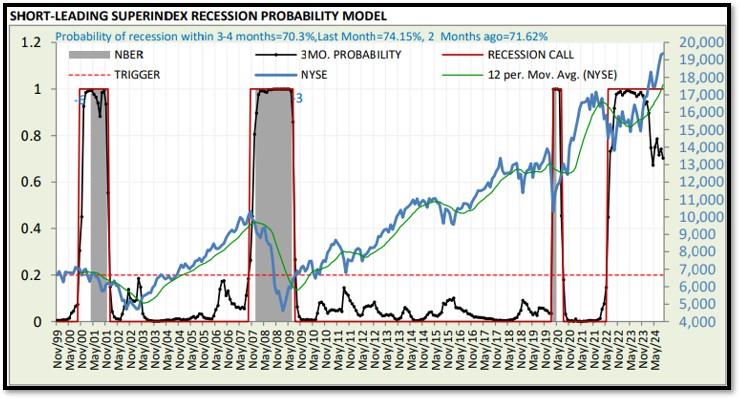
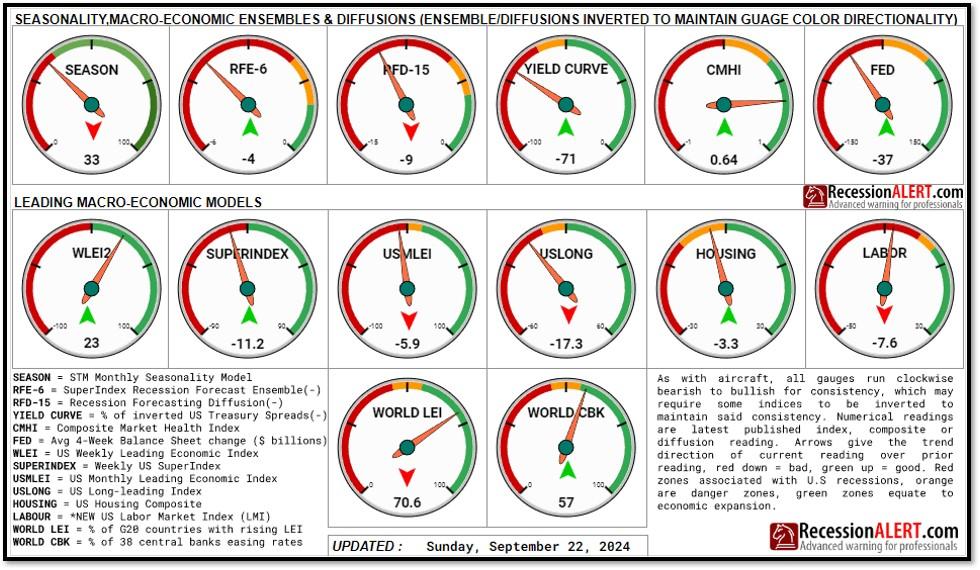
5F. Probability of U.S. falling into Recession within 3 to 4 months is currently at 70.3% (with data as of 09/22/2024 – Next Report 10/06/2024) according to RecessionAlert Research. Last release’s data was at 82.23%. This report is updated every two weeks. REF: RecessionAlertResearch, Gauges
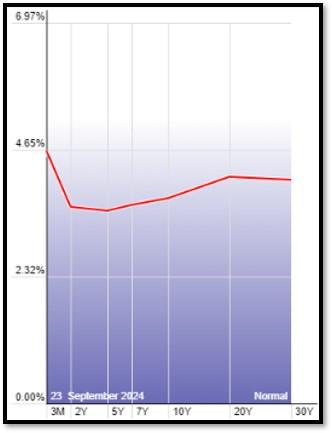
5G. Yield Curve as of 9/23/2024 is showing Inversion to Flattening. Spread on the 10-yr Treasury Yield (3.76%) minus yield on the 2-yr Treasury Yield (3.58%) is currently at 18 bps. REF: Stockcharts The yield curve—specifically, the spread between the interest rates on the ten-year Treasury note and the three-month Treasury bill—is a valuable forecasting tool. It is simple to use and significantly outperforms other financial and macroeconomic indicators in predicting recessions two to six quarters ahead. REF: NYFED
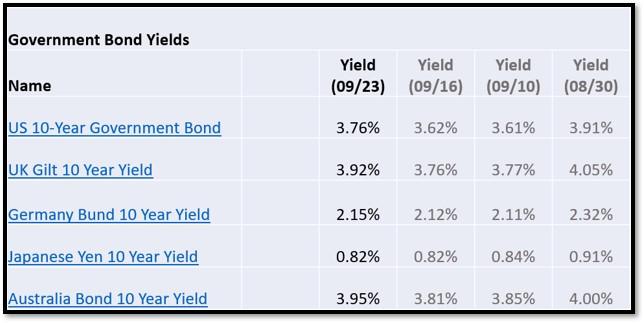
5H. Recent Yields in 10-Year Government Bonds. REF: Source is from Bloomberg.com, dated 9/23/2024, rates shown below are as of 9/23/2024, subject to change.
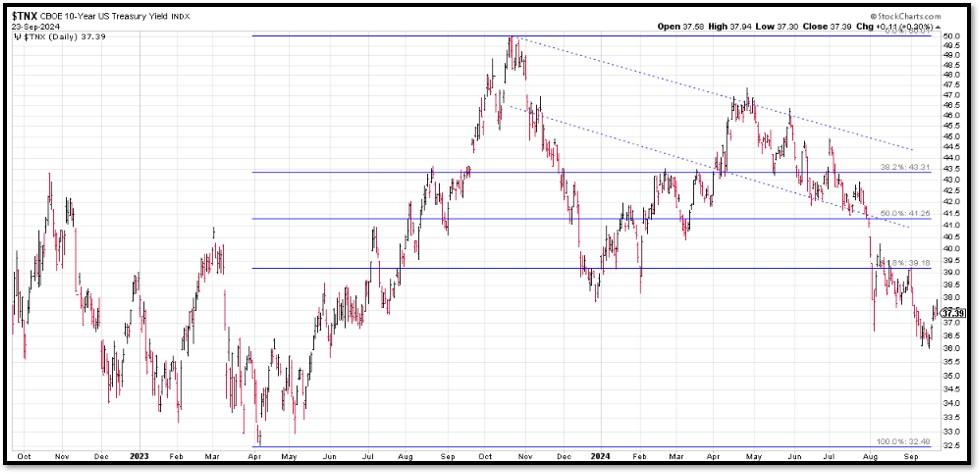
The 10-Year US Treasury Yield… REF: StockCharts1, StockCharts2
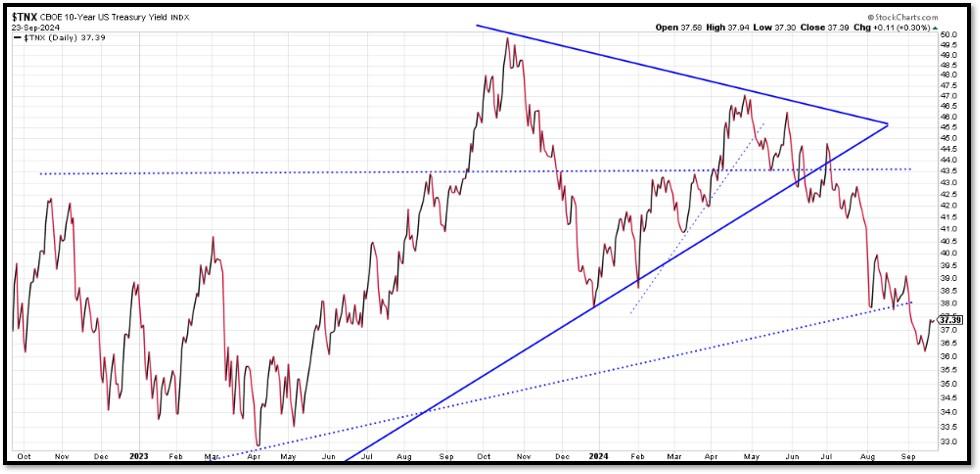
The 10-year yield – Headed lower…
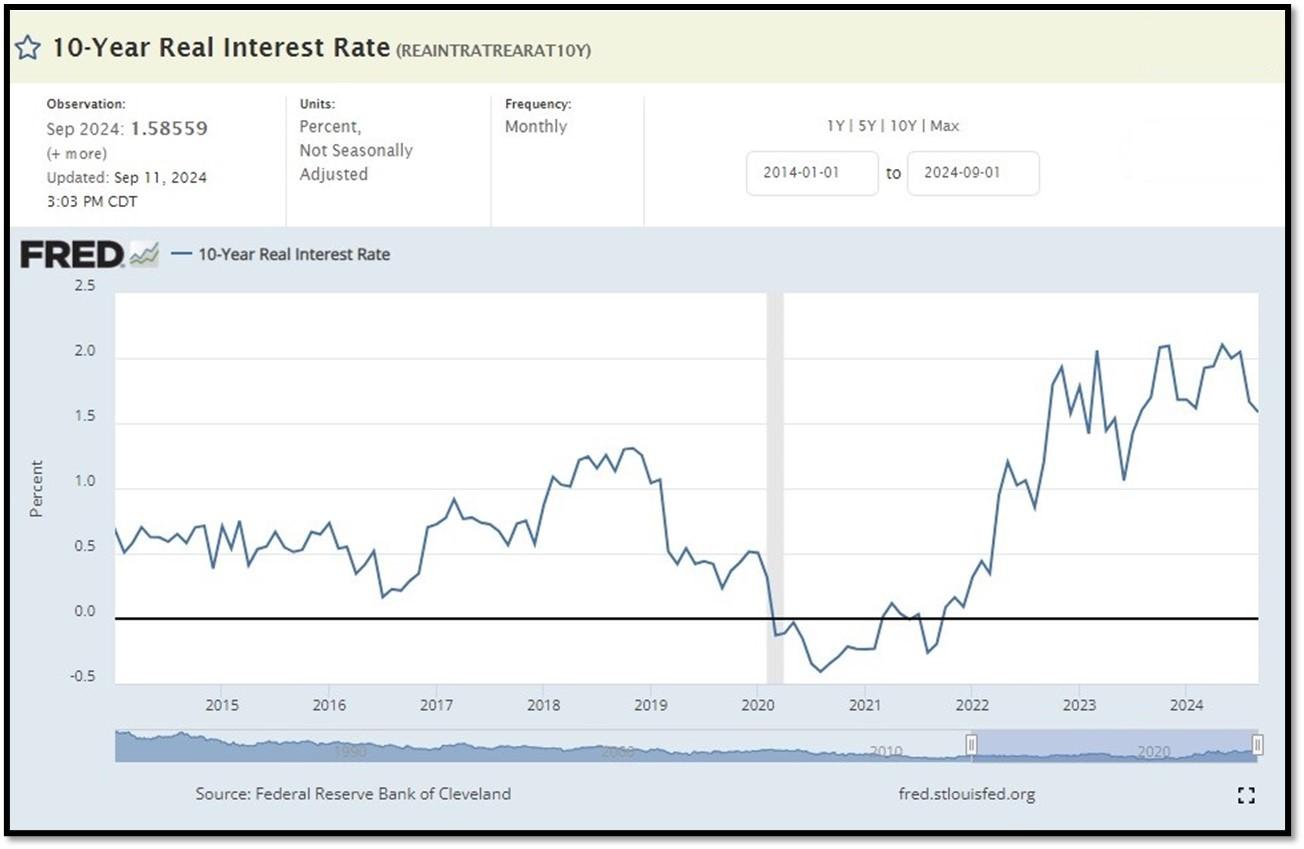
10-Year Real Interest Rate at 1.85% as of 9/11/24. It continues to climb even when Fed stopped raising interest rates. REF: REAINTRATREARAT10Y
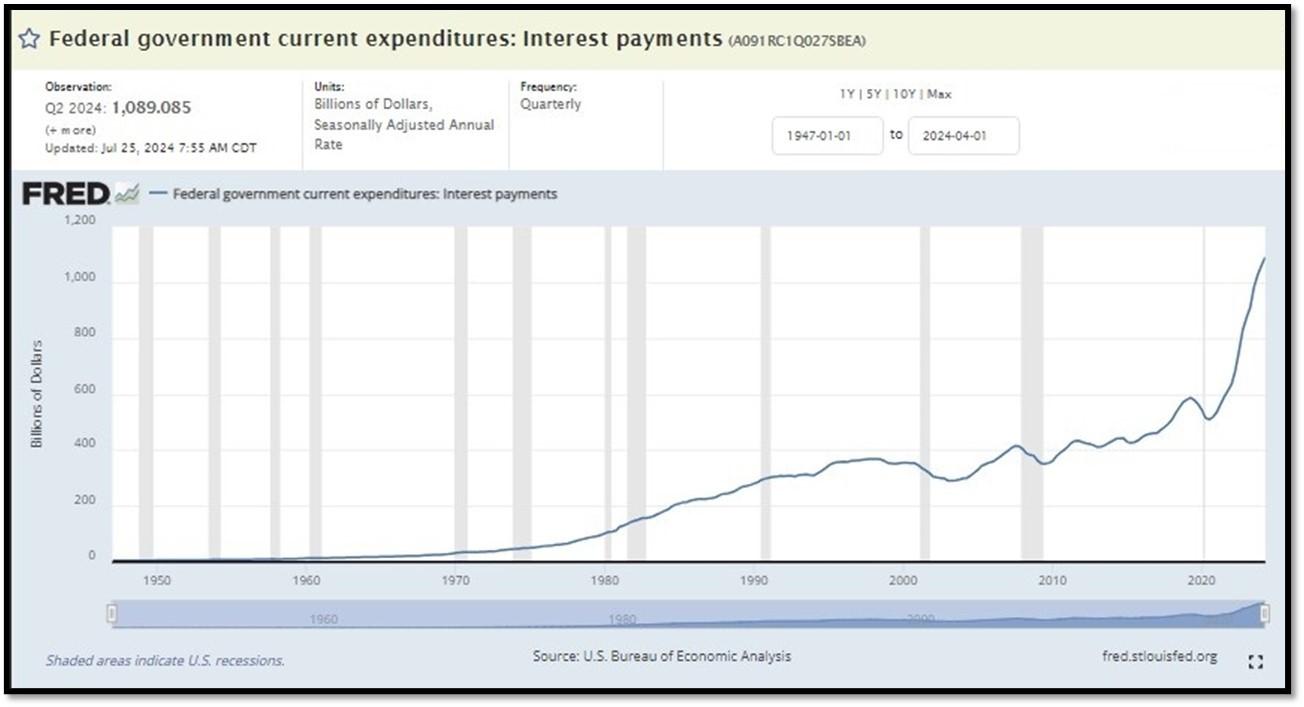
Federal government Interest Payments increased $30B to $1.089 T as of Q2-2024. REF: FRED-A091RC1Q027SBEA
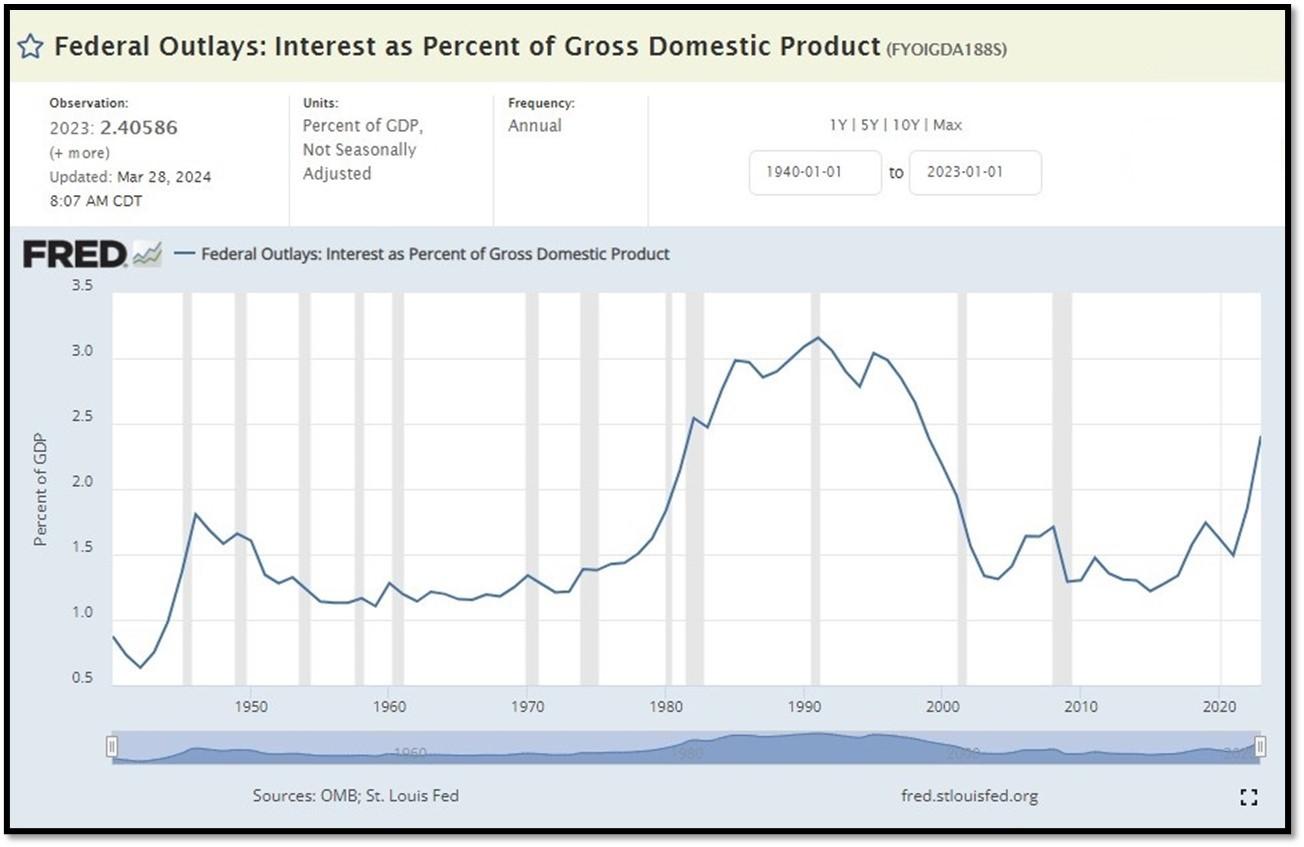
Interest payments as a percentage of GDP increased from 1.84853 in 2022 to 2.40586 as of 3/28/24. REF: FRED-FYOIGDA188S
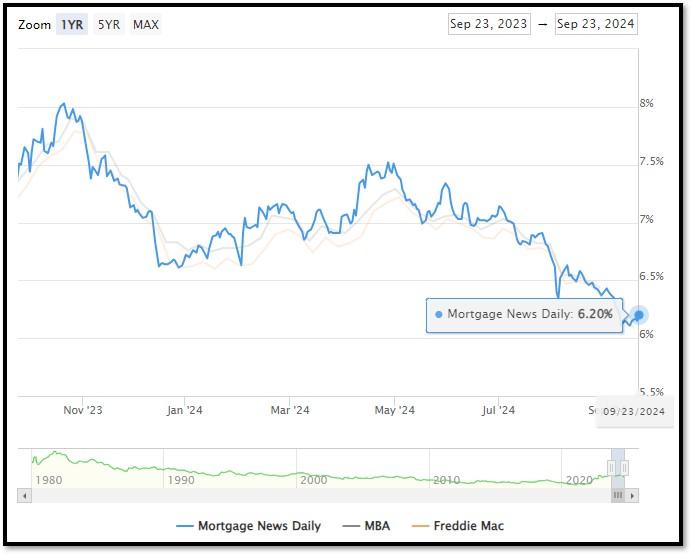
5I. (09/23/2024) Today’s National Average 30-Year Fixed Mortgage Rate is 6.20% (All Time High was 8.03% on 10/19/23). Last week’s data was 6.12%. This rate is the average 30-year fixed mortgage rates from several different surveys including Mortgage News Daily (daily index), Freddie Mac (weekly survey), Mortgage Bankers Association (weekly survey) and FHFA (monthly survey). REF: MortgageNewsDaily, Today’s Average Rate
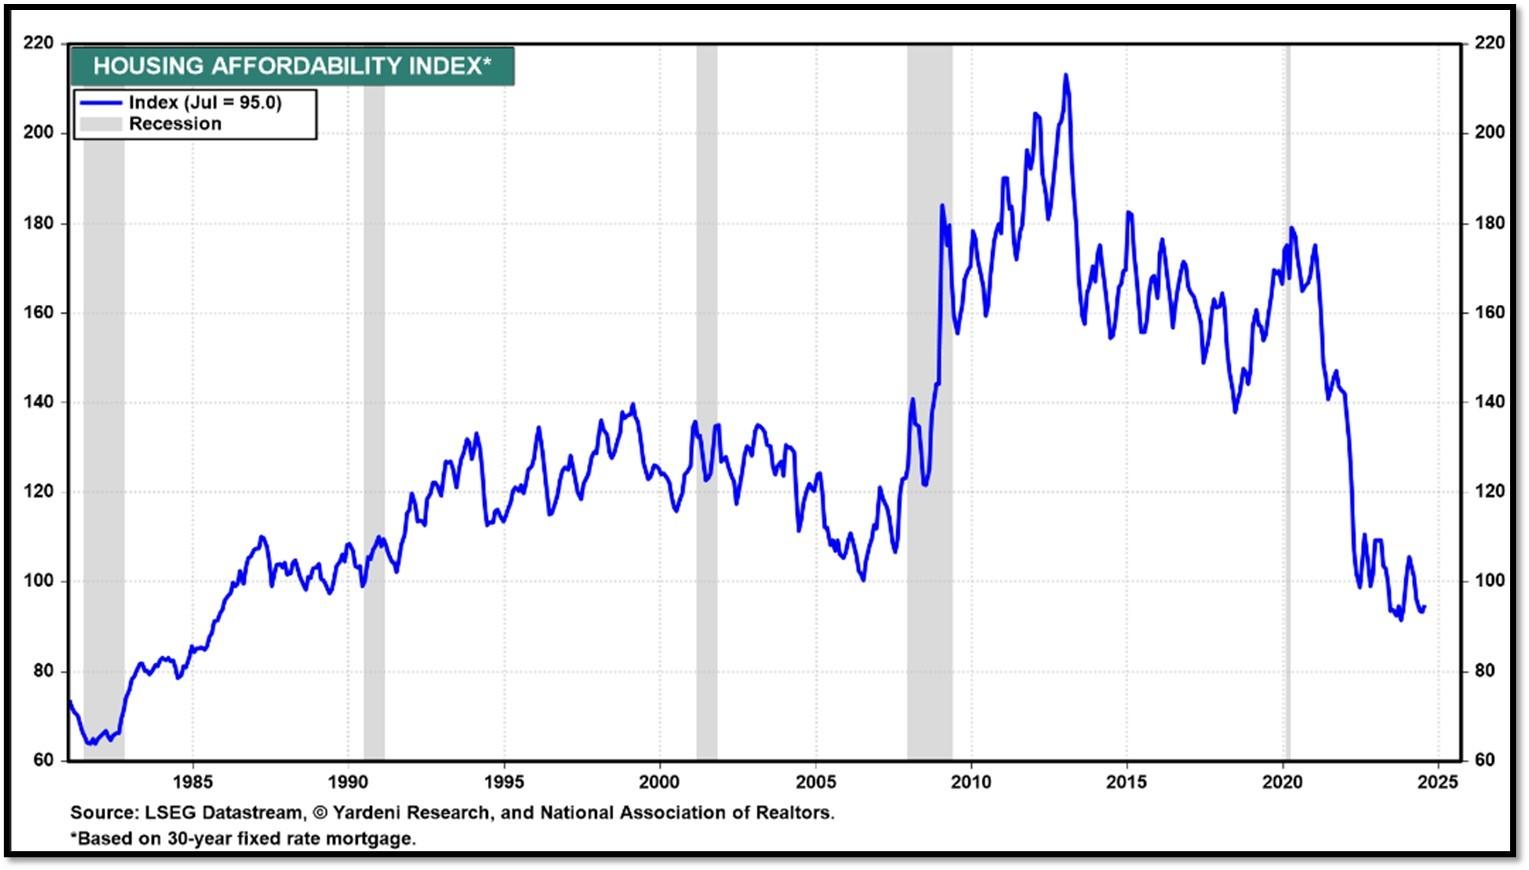
(09/16/24) Housing Affordability Index for July = 95 // June = 93.3 // May = 93.1 // April = 95.9 // March = 101.1 // February = 103.0. Data provided by Yardeni Research. REF: Yardeni
5J. Velocity of M2 Money Stock (M2V) with current read at 1.368 as of (Q2-2024 updated 8/29/2024). Previous quarter’s data was 1.367. The velocity of money is the frequency at which one unit of currency is used to purchase domestically- produced goods and services within a given time period. In other words, it is the number of times one dollar is spent to buy goods and services per unit of time. If the velocity of money is increasing, then more transactions are occurring between individuals in an economy. Current Money Stock (M2) report can be viewed in the reference link. REF: St.LouisFed-M2V
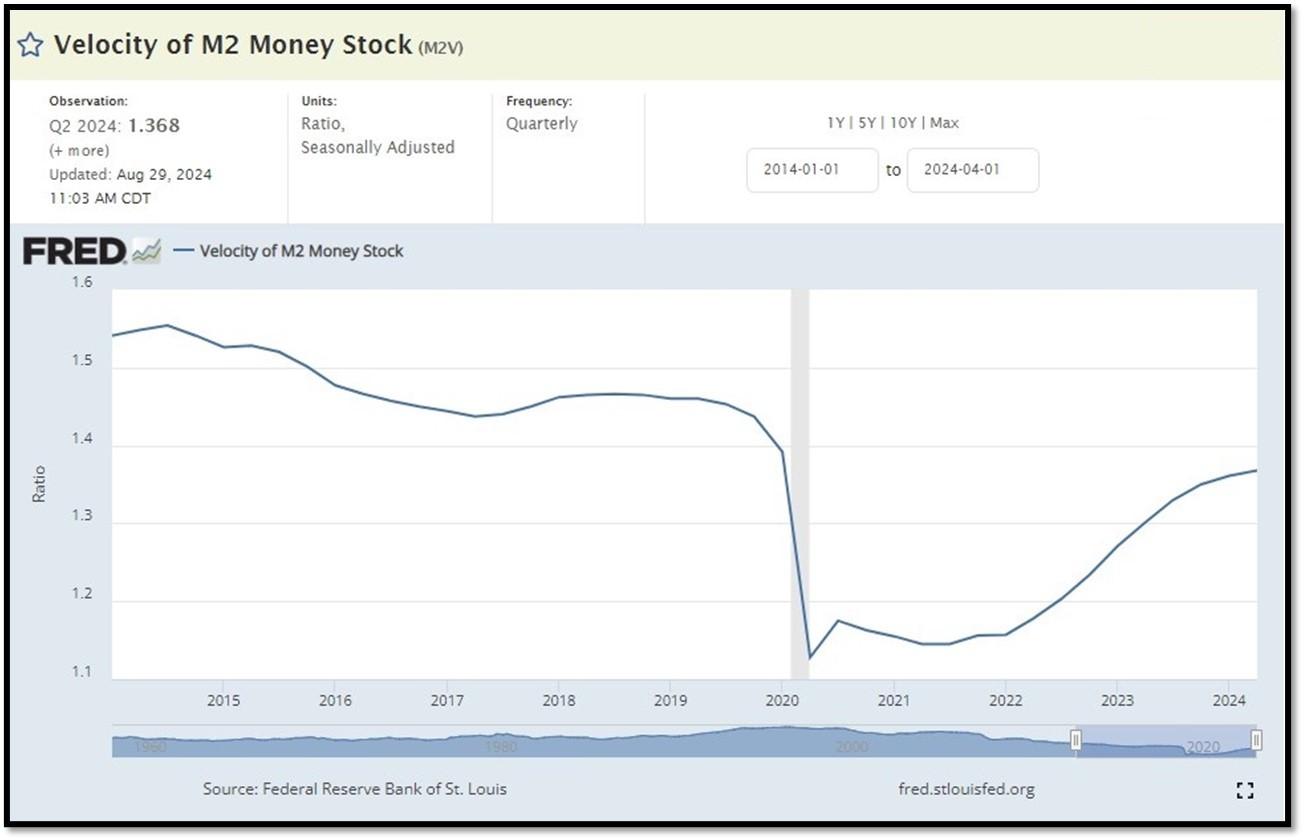
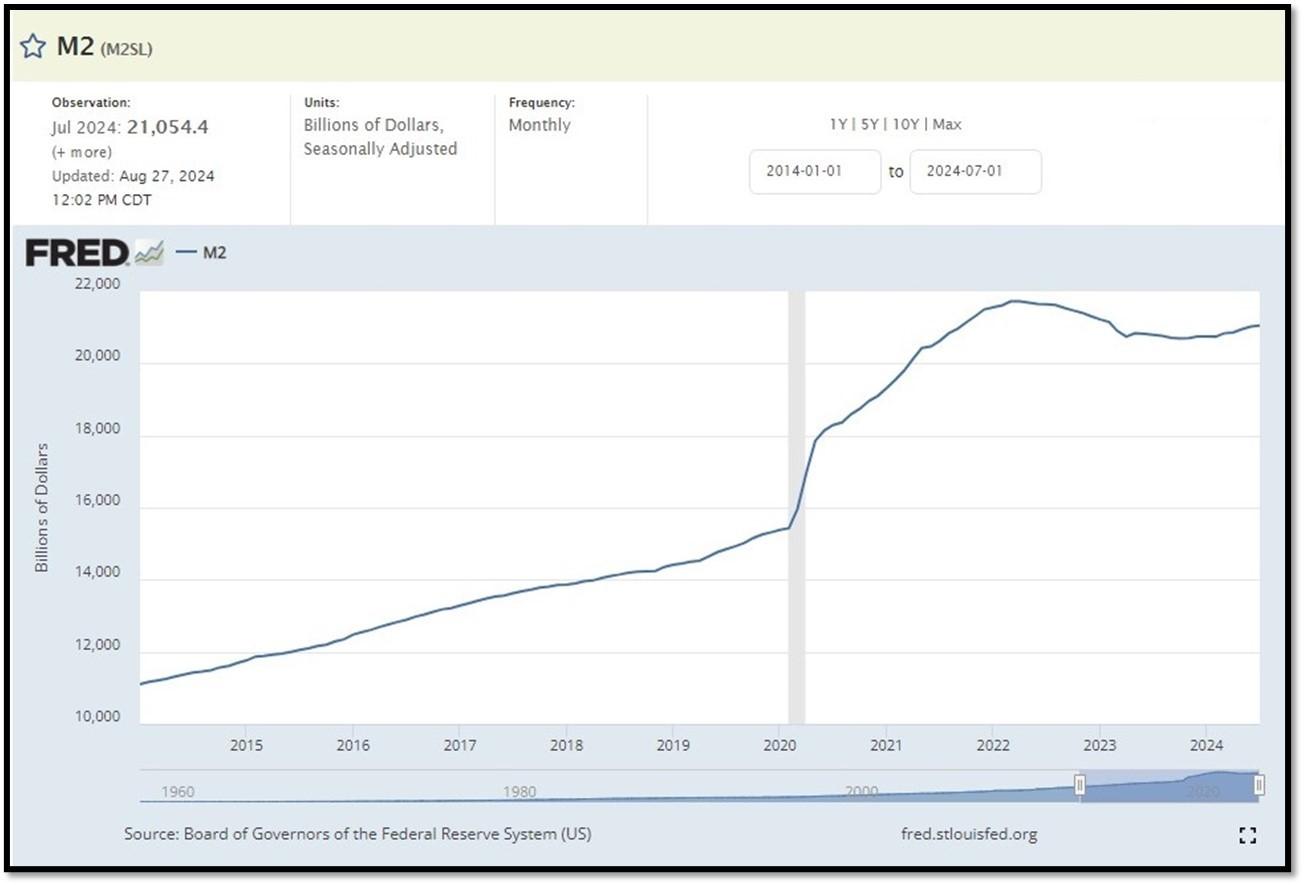
M2 consists of M1 plus (1) small-denomination time deposits (time deposits in amounts of less than $100,000) less IRA and Keogh balances at depository institutions; and (2) balances in retail MMFs less IRA and Keogh balances at MMFs. Seasonally adjusted M2 is constructed by summing savings deposits (before May 2020), small-denomination time deposits, and retail MMFs, each seasonally adjusted separately, and adding this result to seasonally adjusted M1. Board of Governors of the Federal Reserve System (US), M2 [M2SL], retrieved from FRED, Federal Reserve Bank of St. Louis; Updated on August 27, 2024. REF: St.LouisFed-M2
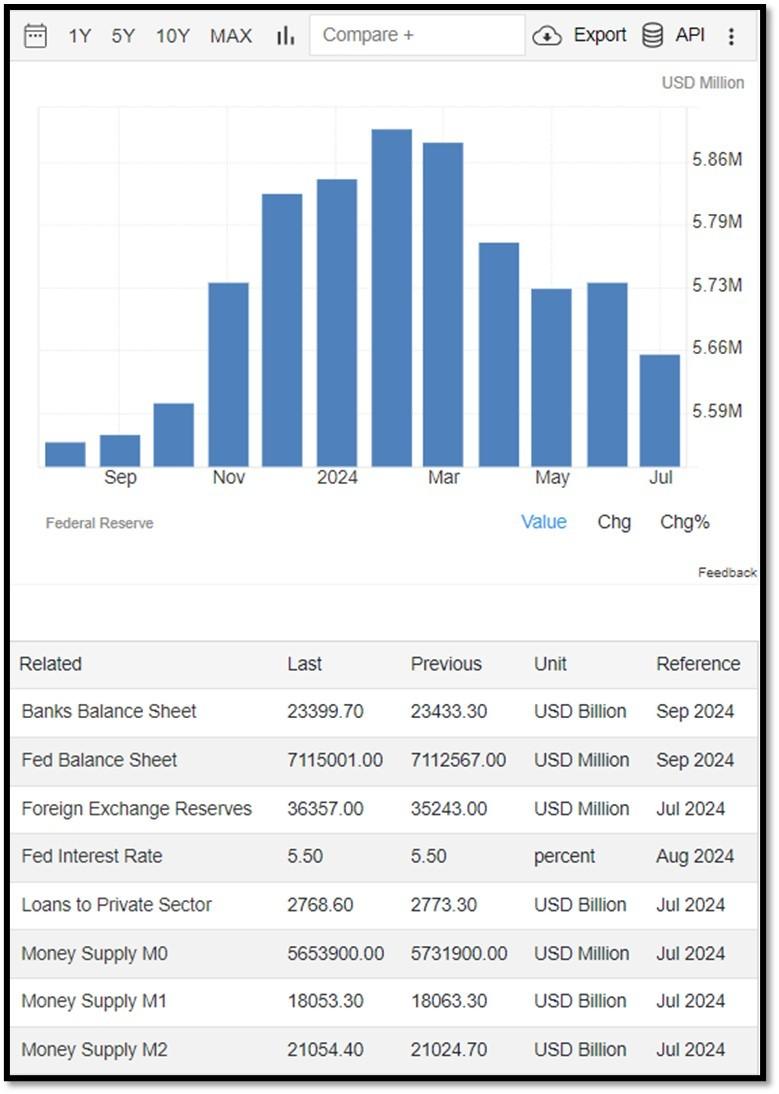
Money Supply M0 in the United States decreased to 5,653,900 USD Million in July from 5,731,900 USD Million in June of 2024. Money Supply M0 in the United States averaged 1138055.78 USD Million from 1959 until 2024, reaching an all-time high of 6,413,100.00 USD Million in December of 2021 and a record low of 48,400.00 USD Million in February of 1961. REF: TradingEconomics, M0
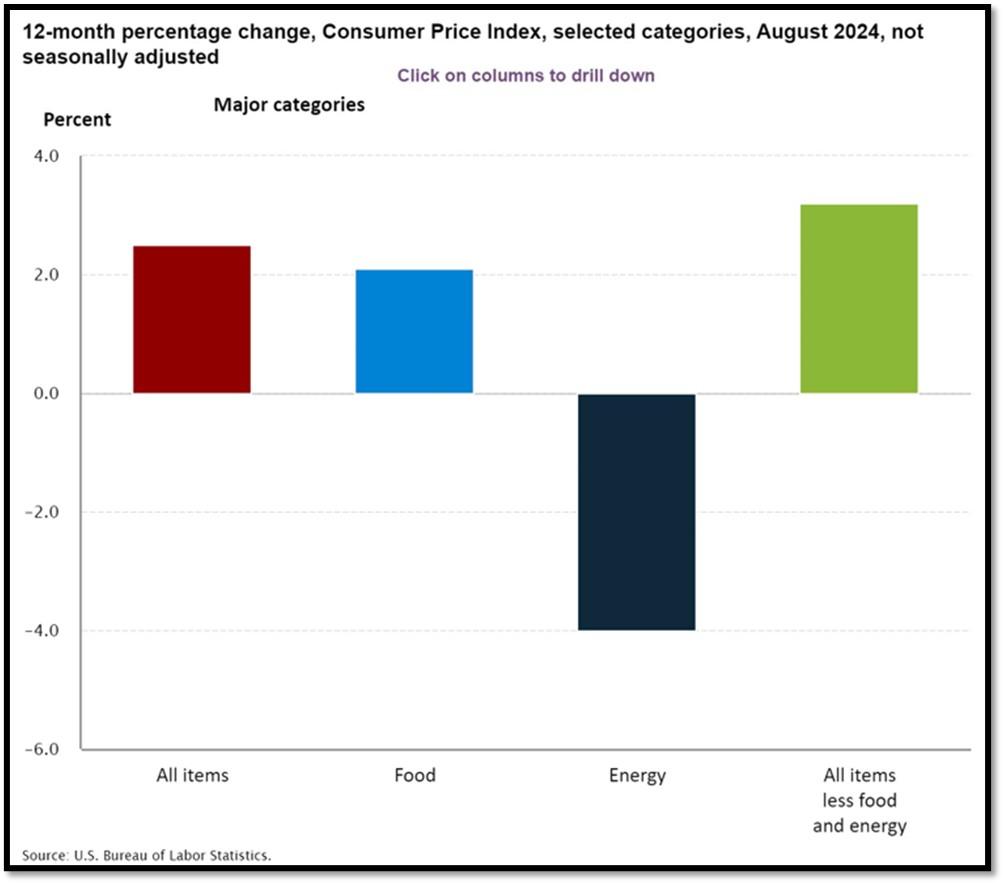
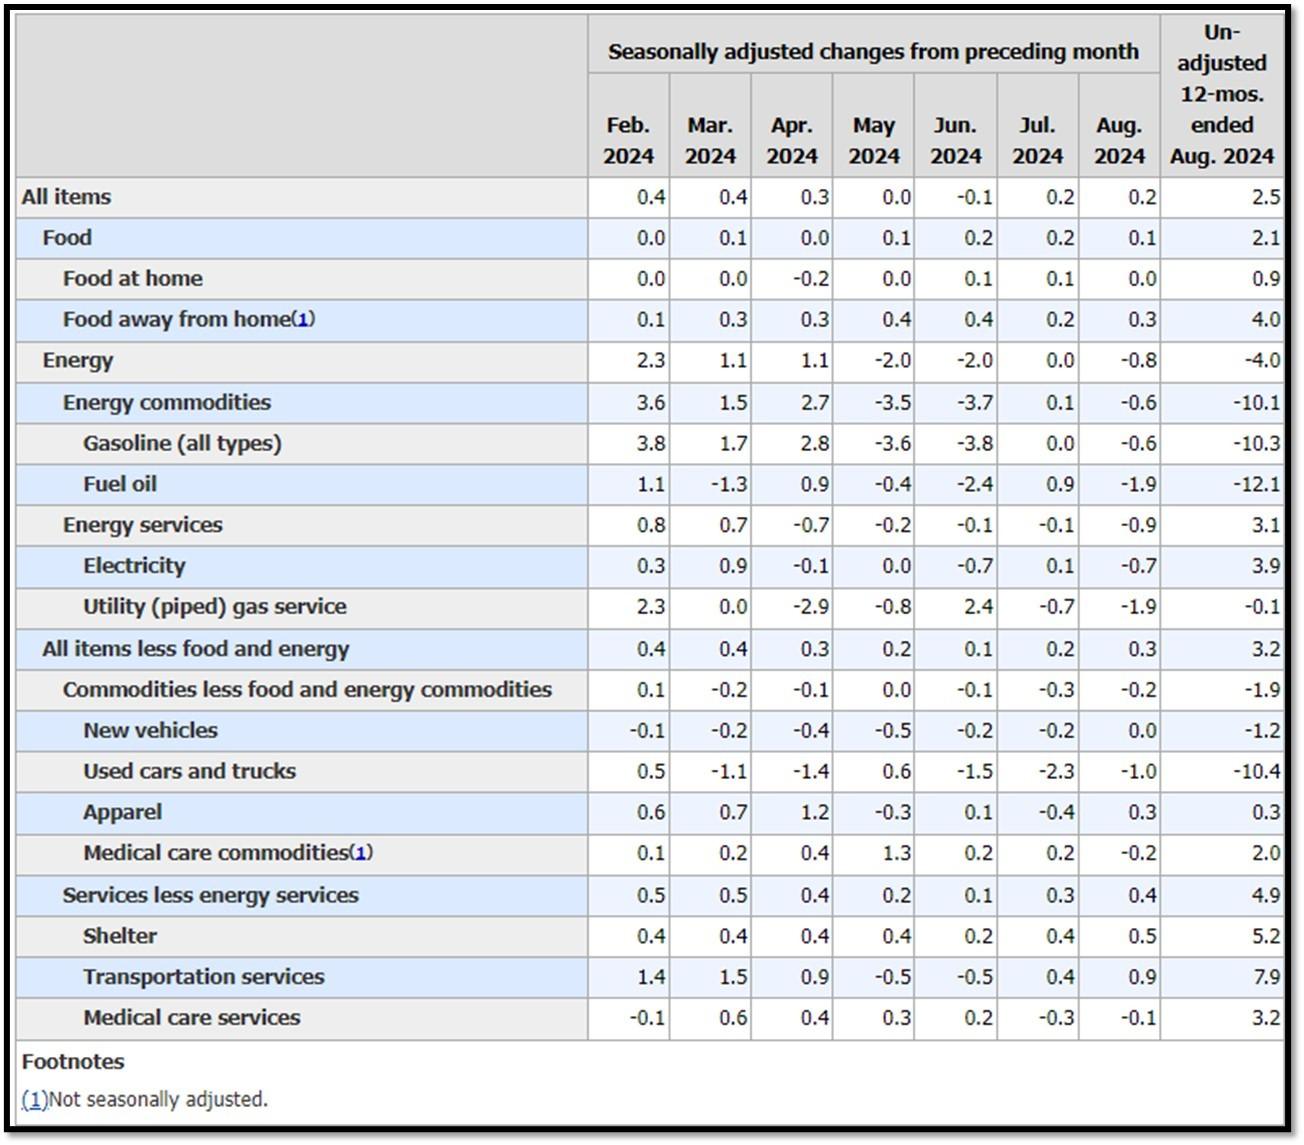
5K. In August, the Consumer Price Index for All Urban Consumers rose 0.2 percent, seasonally adjusted, and rose 2.5 percent over the last 12 months, not seasonally adjusted. The index for all items less food and energy increased 0.3 percent in August (SA); up 3.2 percent over the year (NSA). September 2024 CPI data are scheduled to be released on October 10, 2024, at 8:30AM-ET. REF: BLS, BLS.GOV
5L. Technical Analysis of the S&P500 Index. Click onto reference links below for images.
- Short-term Chart: Bottoming on 9/23/2024 – REF: Short-term S&P500 Chart by Marc Slavin (Click Here to Access Chart)
- Medium-term Chart: Bullish on 9/23/2024 – REF: Medium-term S&P500 Chart by Marc Slavin (Click Here to Access Chart)
- Market Timing Indicators – S&P500 Index as of 9/23/2024 – REF: S&P500 Charts (7 of them) by Joanne Klein’s Top 7 (Click Here to Access Updated Charts)
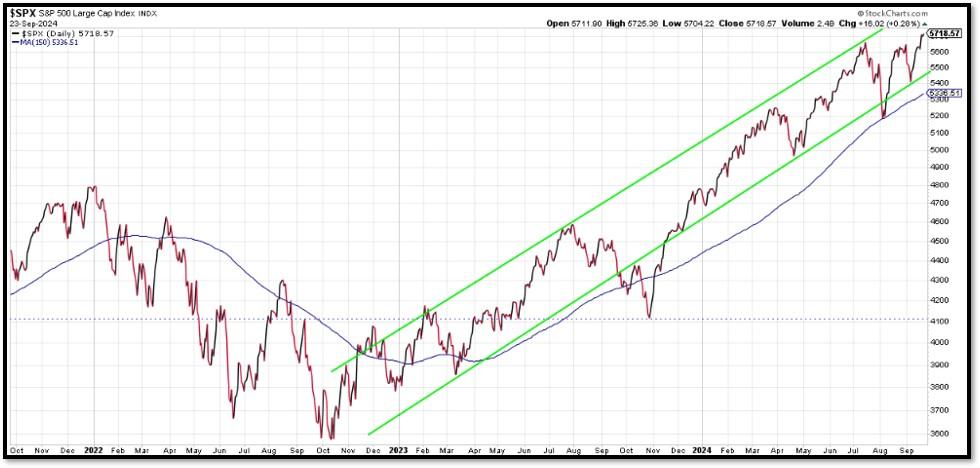
- A well-defined uptrend channel shown in green with S&P500 getting back on trend. REF: Stockcharts
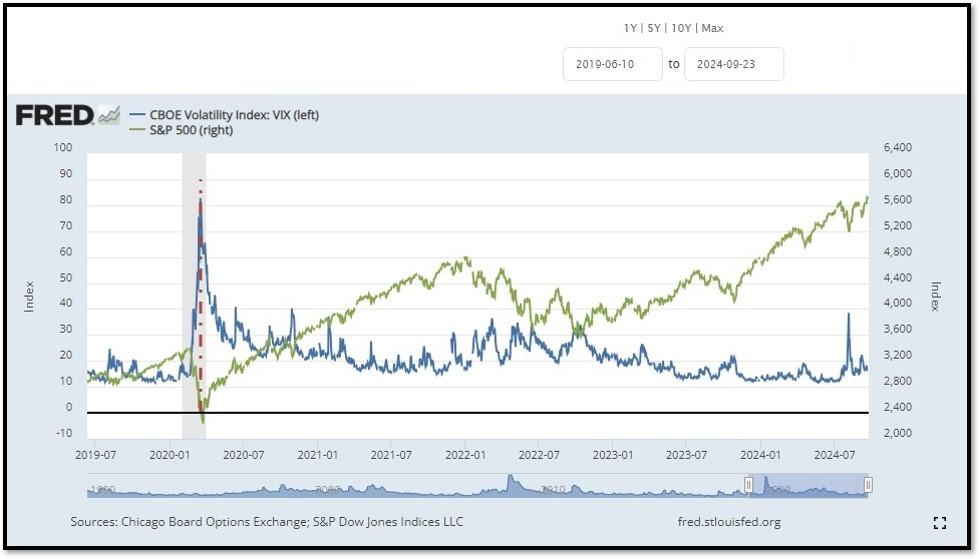
- S&P500 and CBOE Volatility Index (VIX) as of 9/23/2024. REF: FRED, Today’s Print
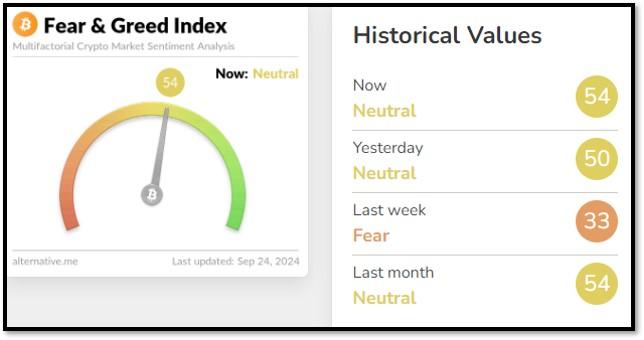
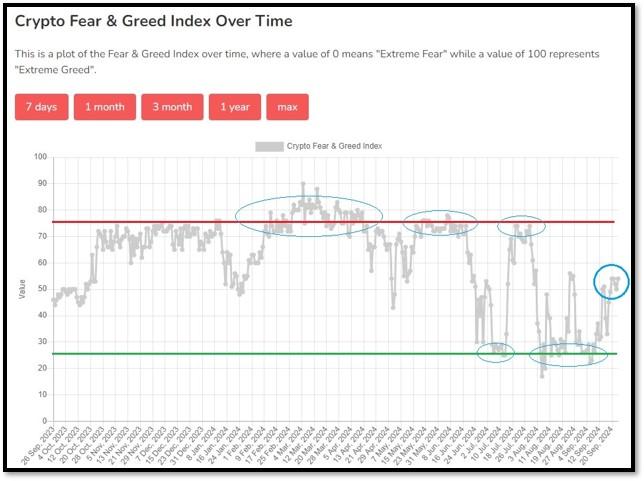
5M. Most recent read on the Crypto Fear & Greed Index with data as of 9/24/2024au is 54 (Neutral). Last week’s data was 33 (Fear) (1-100). Fear & Greed Index – A Contrarian Data. The crypto market behavior is very emotional. People tend to get greedy when the market is rising which results in FOMO (Fear of missing out). Also, people often sell their coins in irrational reaction of seeing red numbers. With the Crypto Fear and Greed Index, the data try to help save investors from their own emotional overreactions. There are two simple assumptions:
- Extreme fear can be a sign that investors are too worried. That could be a buying opportunity.
- When Investors are getting too greedy, that means the market is due for a correction.
Therefore, the program for this index analyzes the current sentiment of the Bitcoin market and crunch the numbers into a simple meter from 0 to 100. Zero means “Extreme Fear”, while 100 means “Extreme Greed”. REF: Alternative.me, Today’sReading
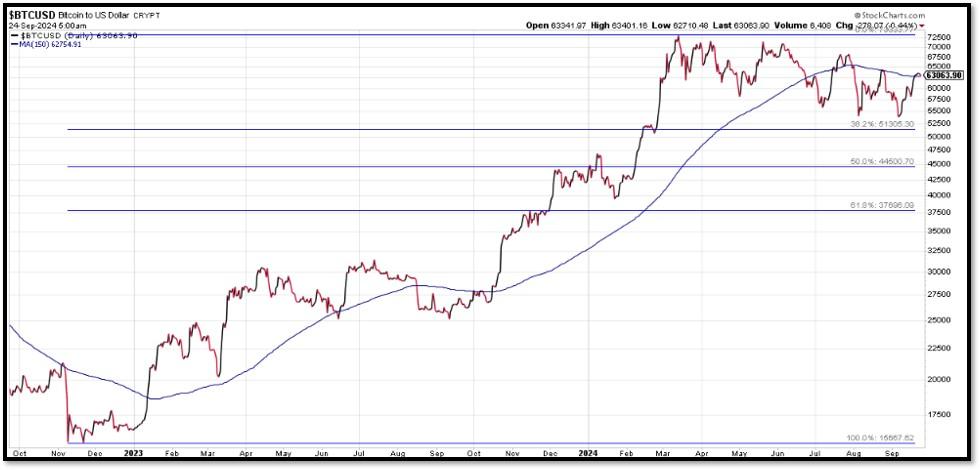
Bitcoin currently below the 150-day moving average. REF: Stockcharts

Len writes much of his own content, and also shares helpful content from other trusted providers like Turner Financial Group (TFG).
The material contained herein is intended as a general market commentary, solely for informational purposes and is not intended to make an offer or solicitation for the sale or purchase of any securities. Such views are subject to change at any time without notice due to changes in market or economic conditions and may not necessarily come to pass. This information is not intended as a specific offer of investment services by Dedicated Financial and Turner Financial Group, Inc.
Dedicated Financial and Turner Financial Group, Inc., do not provide tax, legal or accounting advice. You should consult your own tax, legal and accounting advisors before engaging in any transaction.
Any hyperlinks in this document that connect to Web Sites maintained by third parties are provided for convenience only. Turner Financial Group, Inc. has not verified the accuracy of any information contained within the links and the provision of such links does not constitute a recommendation or endorsement of the company or the content by Dedicated Financial or Turner Financial Group, Inc. The prices/quotes/statistics referenced herein have been obtained from sources verified to be reliable for their accuracy or completeness and may be subject to change.
Past performance is no guarantee of future returns. Investing involves risk and possible loss of principal capital. The views and strategies described herein may not be suitable for all investors. To the extent referenced herein, real estate, hedge funds, and other private investments can present significant risks, including loss of the original amount invested. All indexes are unmanaged, and an individual cannot invest directly in an index. Index returns do not include fees or expenses.
Turner Financial Group, Inc. is an Investment Adviser registered with the United States Securities and Exchange Commission however, such registration does not imply a certain level of skill or training and no inference to the contrary should be made. Additional information about Turner Financial Group, Inc. is also available at www.adviserinfo.sec.gov. Advisory services are only offered to clients or prospective clients where Turner Financial Group, Inc. and its representatives are properly licensed or exempt from licensure. No advice may be rendered by Turner Financial Group, Inc. unless a client service agreement is in place.