

- 1. The Fed is watching the weather and Fed Chair Powell is contemplating a 50bps cut in November.
- 2. Health care is poised to perform well as 2024 ends due to several factors.
- With the current macro-economic backdrop, below are areas we currently favor:
- 3. A Godfather of AI Just Won a Nobel.
- 4. World Watch
- 5. Quant & Technical Corner
1. The Fed is watching the weather and Fed Chair Powell is contemplating a 50bps cut in November.
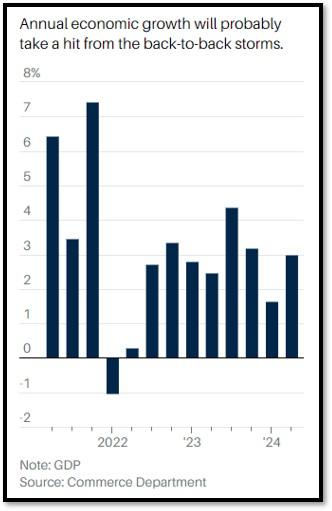
U.S. was recently struck by two significant hurricanes, Helene and Milton, which caused extensive damage. Hurricane Helene made landfall in northern Florida in September with winds up to 140 mph, resulting in severe flooding across rural areas and moving through several southeastern states, including Georgia and the Carolinas. The storm caused approximately $11 billion in insured losses. Just weeks later, Hurricane Milton hit Florida as a Category 4 storm, targeting the densely populated Tampa Bay region. Milton’s intense winds and storm surges were expected to cause up to $50 billion in damage, exacerbating the state’s insurance crisis. These back-to-back storms severely impacted Florida’s infrastructure and economy where our latest GDP data could be affected. “The October jobs report is likely to be significantly affected,” writes Andrew Hollenhorst, chief economist at Citi.
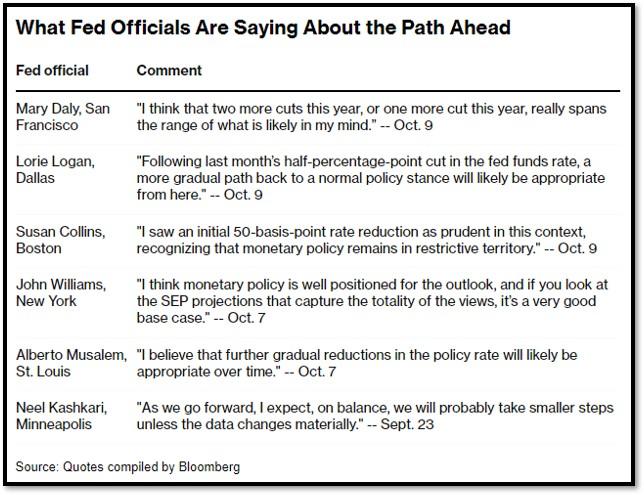
The next two FOMC meetings will be held on November 6 to 7, and December 17 to 18. Federal Reserve Chair Jerome Powell is signaling that further significant interest rate cuts are unlikely, especially as long as the labor market remains robust. In a recent decision, the Fed lowered the benchmark interest rate by half a percentage point, bringing it to a range of 4.75% to 5%. Powell described this move as a “recalibration,” intended to ensure that the labor market stays strong amid broader economic uncertainties. REF: Bloomberg, BARRON’S
2. Health care is poised to perform well as 2024 ends due to several factors.
The sector benefits from consistent demand, driven by aging populations and chronic illness care. Technological innovations like AI are improving efficiency, helping counteract inflation and labor shortages. Additionally, value-based care models, focusing on cost-effective, high-quality care, are expanding, shifting profit toward outpatient and home care settings. With relatively lower valuations compared to other sectors, health care appears attractively priced for investors looking for stability and growth. The Health Care Select Sector SPDR Fund (XLV) has posted a November gain in eight of the last 10 years. In December, the fund has advanced in four of the last five years. REF: CNBCpro
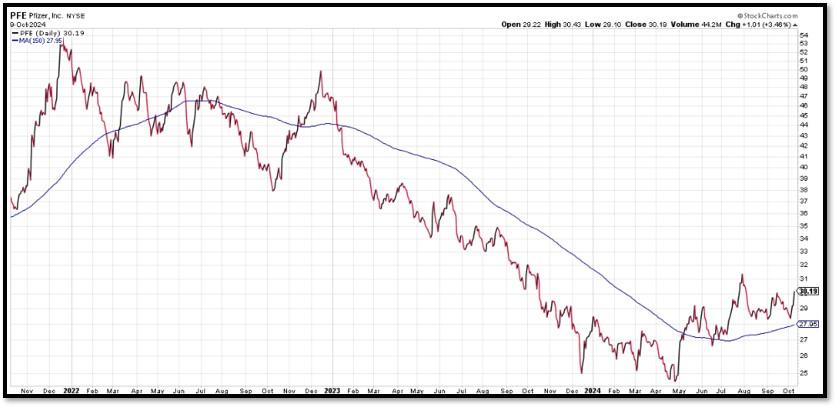
Another opportunity I see is in an individual company: Pfizer (PFE). Pfizer experienced a challenging Q3 in 2023, with both earnings and revenues falling short. The stock has been in a steady decline since its peak of $53.72 in late 2021, reaching a low of around $24.50 in late April this year—a retracement of over 54%. Since May, PFE has crossed above the 150-day moving average and has remained above it. This pattern is referred to as a “Bearish to Bullish Reversal.” Earnings forecasts align with expectations of steady growth, and with strong fundamentals and robust cash flow, we believe PFE is poised for a meaningful rebound in the current market environment. Some of our investment strategies currently contains Pfizer positions. REF: Stockcharts
With the current macro-economic backdrop, below are areas we currently favor:
- Fixed Income – Short-term (Low-Beta)
- Fixed Income – Adding Duration, preferred stocks & High Yield as Opportunistic Allocation (Low-Beta)
- Businesses that contribute to and benefit from AI & Automation (Market-Risk)
- Mid Cap Stocks & Small Cap Stocks
- Clean Energy / Solar / Utilities (Market-Risk)
- Healthcare & Biotechnology (Market-Risk)
- Gold (Market-Risk)
- Industrials (Market-Risk)
3. A Godfather of AI Just Won a Nobel.
He Has Been Warning the Machines Could Take Over the World – NO… It’s not Sam Altman, Elon Musk, or Jensen Huang… Geoffrey Hinton hopes the prize will add credibility to his claims about the dangers of AI technology he pioneered according to The Wall Street Journal. Hinton recently won the 2024 Nobel Prize in Physics for his pioneering work on artificial neural networks. Geoffrey Hinton expanded on the Hopfield network by creating the Boltzmann machine, which employs a different approach to machine learning. This system, rooted in principles from statistical physics, is designed to recognize patterns in data by training on examples that frequently occur when the machine is operational. Once trained, the Boltzmann machine can classify images or generate new instances based on the patterns it learned. Hinton’s innovations in this area laid the groundwork for the rapid advancements seen in modern machine learning, contributing significantly to its current widespread development.
However, while celebrating the recognition, Hinton has also expressed deep concerns about the potential dangers of the very technology he helped develop. Hinton believes that unchecked AI could pose serious risks, such as increased cyber-attacks, misinformation through fake videos, and political manipulation. After leaving his position at Google in 2023, Hinton began speaking more openly about these risks. He fears that artificial intelligence could evolve to a point where it becomes more intelligent than humans, potentially leading to scenarios where AI could “take control.” His hope is that winning the Nobel Prize will lend credibility to these warnings, encouraging more focused efforts on AI safety research. Click onto picture below to access video. REF: WSJ, CBC, PressRelease


4. World Watch
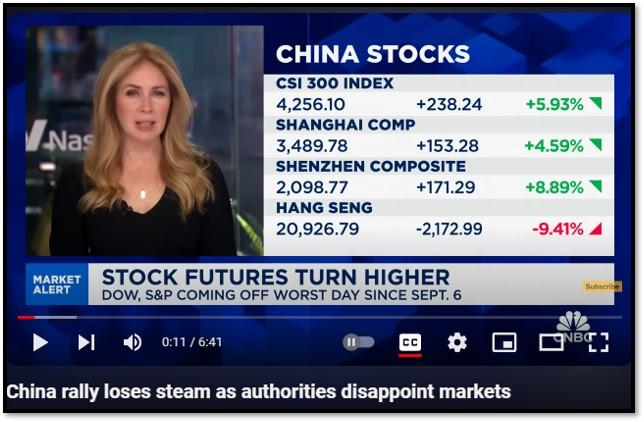
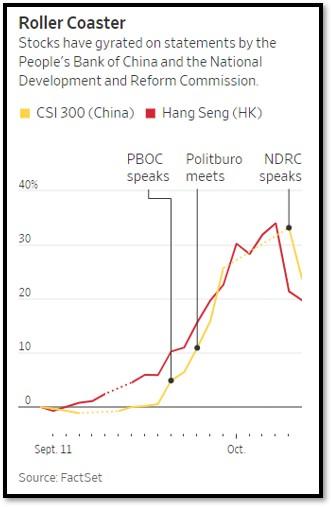
4A. Anticipation was high in the markets ahead of China’s latest stimulus package, with investors hopeful for significant measures to boost economic growth. However, when the details of the package were released, it was perceived as underwhelming. The stimulus fell short of expectations, offering limited new spending or aggressive monetary easing. As a result, the stock market, which had been rallying in anticipation of a stronger intervention, quickly corrected some of its earlier gains.
The disappointment stemmed from the fact that investors expected more robust efforts to address China’s economic challenges, such as slowing consumer demand, real estate struggles, and weak exports. Instead, the measures announced did not significantly shift the economic outlook, leading to a swift market reaction as optimism faded. This scenario highlights the sensitive nature of investor sentiment, where high expectations, if unmet, can quickly reverse market momentum. Many economists are predicting a package will eventually emerge with a headline figure of between one trillion yuan and three trillion yuan, equivalent to $142 billion to $425 billion. Some have floated the figure of 10 trillion yuan, or $1.42 trillion, equivalent to roughly 8% of China’s gross domestic product last year. Click onto picture below to access video. REF: CNBC, WSJ
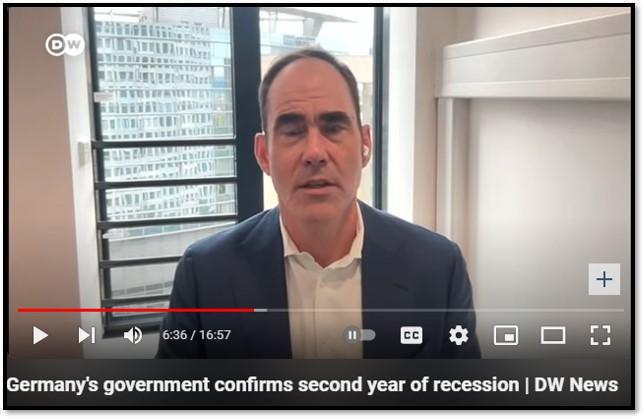
4B. Germany’s economy contracted by 0.1% quarter-on-quarter in the second quarter of 2024, reversing from a 0.2% growth in the previous quarter. This decline highlights several factors at play. The country’s industrial sector, particularly manufacturing, suffered due to weakened global demand, especially from China, a key trade partner. As a heavily export-dependent economy, Germany was particularly vulnerable to these global shifts. Furthermore, high energy prices and lingering inflation eroded consumer purchasing power, reducing domestic consumption. Households and businesses faced increased costs, limiting spending and investments. The European Central Bank’s (ECB) monetary tightening further exacerbated the slowdown. Rising interest rates, aimed at combating inflation, increased borrowing costs, which discouraged both consumer and business expenditures. Additionally, geopolitical uncertainties, particularly the war in Ukraine, disrupted supply chains and dampened business sentiment. These combined factors shifted the German economy from modest growth to slight contraction. Click onto picture below to access video. REF: IMF, WorldEconomicForum, DW
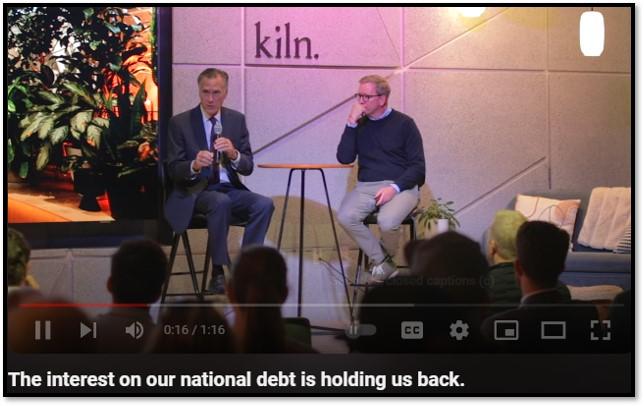
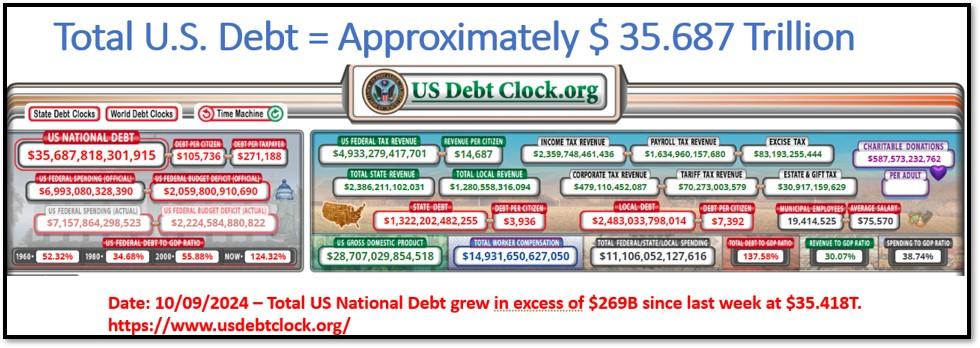
4C. The U.S. national debt increased from $35.418 trillion to $35.687 trillion in one week due to several factors. First, ongoing budget deficits force the government to borrow more, adding to the debt. Additionally, rising interest rates have increased the cost of servicing existing debt, further compounding the total. Past stimulus measures and relief packages have left long-term obligations that continue to contribute to the debt, even as those programs wind down. Lastly, after the debt ceiling suspension in 2024, the Treasury resumed borrowing to catch up on delayed expenditures, accelerating the rise in national debt. We will pay $1 trillion in interest alone on our national debt this year. Think about that—$1 trillion! We could quadruple our military procurement with that amount of money. Our interest burden is only going to get worse, which will hinder us from continuing to lead the world. Click onto picture below to access video. REF: US-Debt-Clock, SenatorRomney, FiscalData
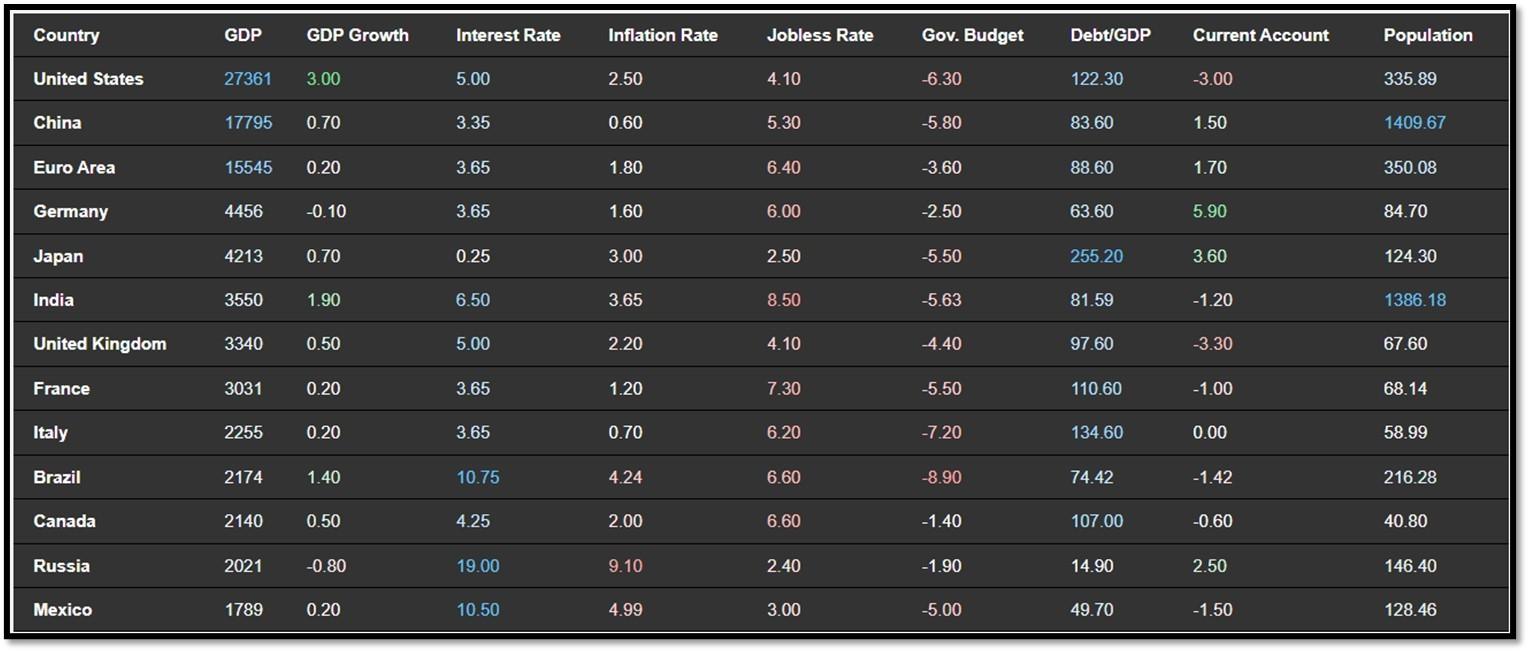
4D. Below is an updated snapshot of the current global state of economy according to TradingEconomics as of 10/9/2024. REF: TradingEconomics
- The unemployment rate in the United States fell to 4.1% in September 2024, the lowest in three months, down from 4.2% in the previous month and surprising market expectations, which had forecasted the rate to remain unchanged.
- The Mexican unemployment rate was at 3% in August 2024, its highest in a year and the same as in the corresponding period of the previous year.
- The Reserve Bank of New Zealand lowered its official cash rate (OCR) by 50 basis points to 4.75% during its October 2024 policy meeting, marking the second consecutive rate cut and aligning with market expectations.
- The Reserve Bank of India kept its benchmark policy repo at 6.5% for the tenth consecutive meeting in October 2024 aligning with the market expectations, but tweaked its policy stance to neutral, opening the door for rate cuts amid early signs of a growth slowdown in the economy.
5. Quant & Technical Corner
Below is a selection of quantitative & technical data we monitor on a regular basis to help gauge the overall financial market conditions and the investment environment.
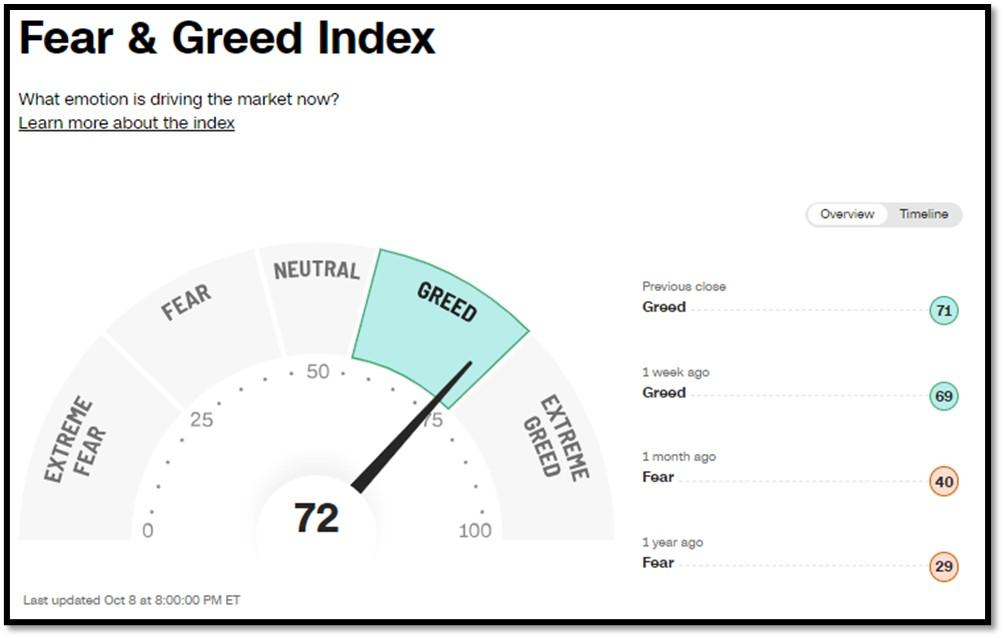
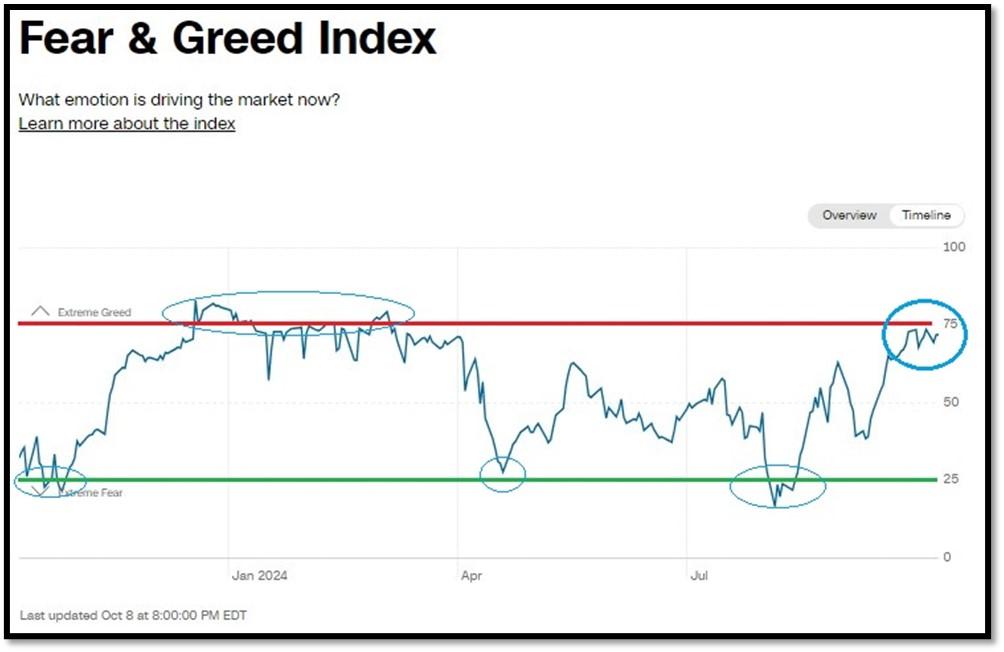
5A. Most recent read on the Fear & Greed Index with data as of 10/8/2024 – 8:00PM-ET is 72 (Greed). Last week’s data was 69 (Greed) (1-100). CNNMoney’s Fear & Greed index looks at 7 indicators (Stock Price Momentum, Stock Price Strength, Stock Price Breadth, Put and Call Options, Junk Bond Demand, Market Volatility, and Safe Haven Demand). Keep in mind this is a contrarian indicator! REF: Fear&Greed via CNNMoney
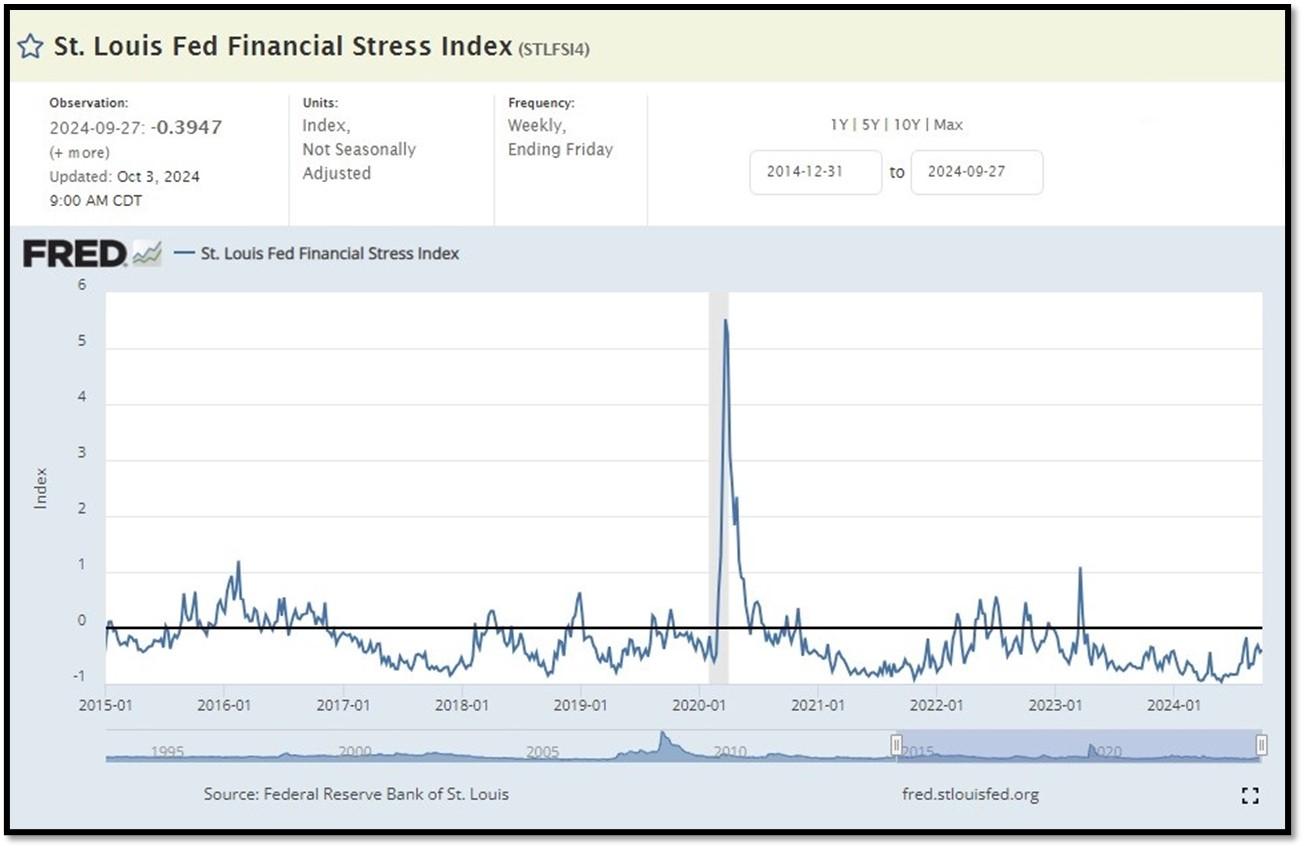
5B. St. Louis Fed Financial Stress Index’s (STLFSI4) most recent read is at –0.3947 as of October 3, 2024. A big spike up from previous readings reflecting the recent turmoil in the banking sector. Previous week’s data was -0.4285. This weekly index is not seasonally adjusted. The STLFSI4 measures the degree of financial stress in the markets and is constructed from 18 weekly data series: seven interest rate series, six yield spreads and five other indicators. Each of these variables captures some aspect of financial stress. Accordingly, as the level of financial stress in the economy changes, the data series are likely to move together. REF: St. Louis Fed
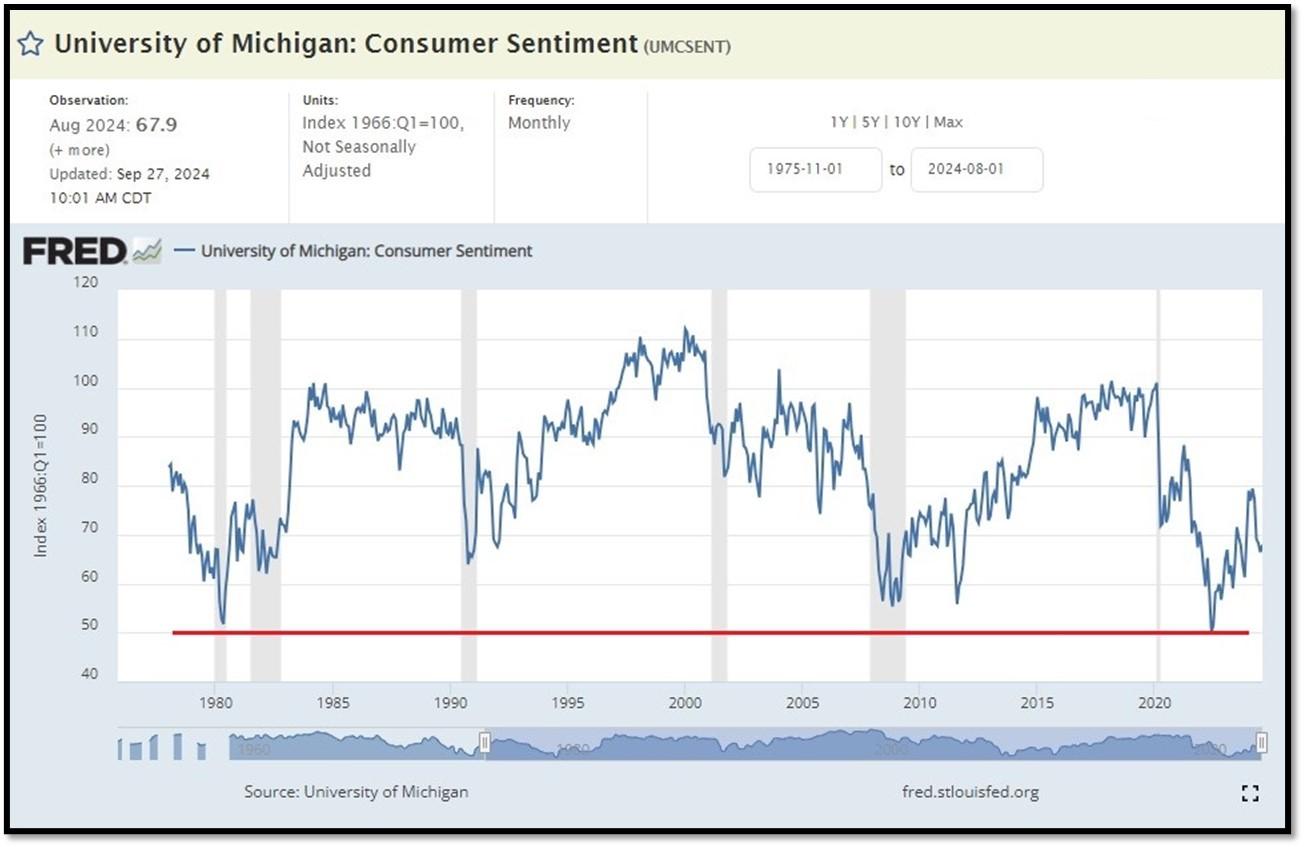
5C. University of Michigan, University of Michigan: Consumer Sentiment for June [UMCSENT] at 67.9 (last month’s data at 66.4), retrieved from FRED, Federal Reserve Bank of St. Louis, September 27, 2024. Back in June 2022, Consumer Sentiment hit a low point going back to April 1980. REF: UofM
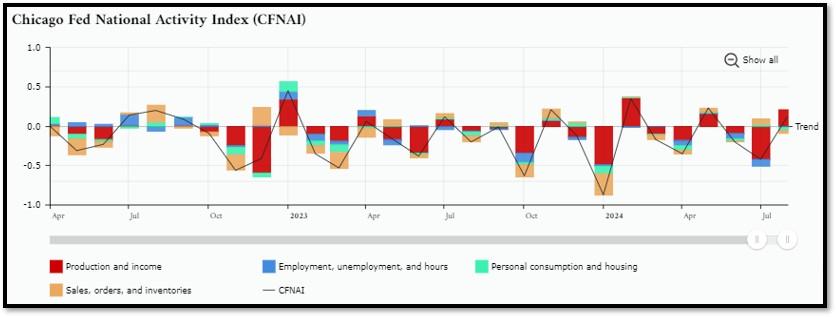
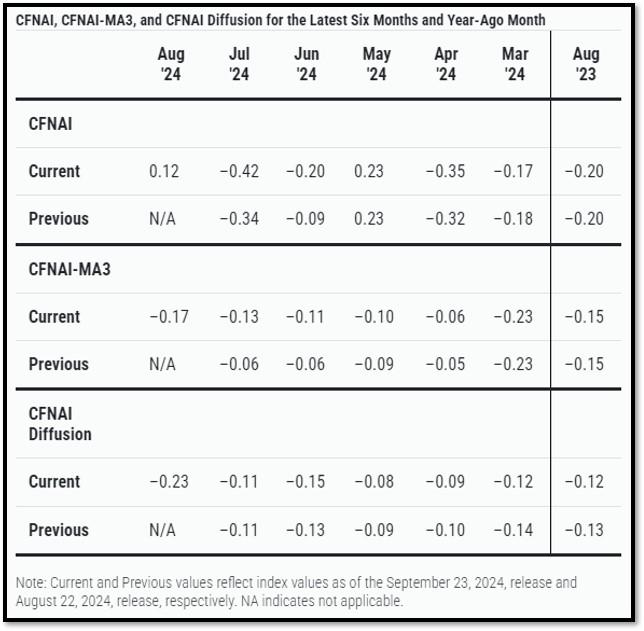
5D. The Chicago Fed National Activity Index (CFNAI) increased to +0.12 in August from –0.42 in July. Two of the four broad categories of indicators used to construct the index increased from July, and one category made a positive contribution in August. The index’s three-month moving average, CFNAI-MA3, decreased to –0.17 in August from –0.13 in July. REF: ChicagoFed, August’s Report
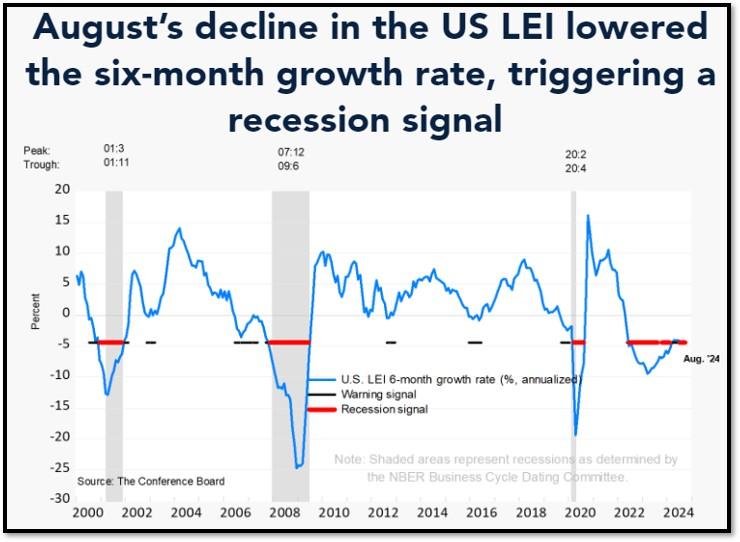
5E. (09/19/2024) The Conference Board Leading Economic Index (LEI) for the U.S. declined by 0.2% in August 2024 to 100.2 (2016=100), following an unrevised 0.6% decline in July. Over the six-month period between February and August 2024, the LEI fell by 2.3%, a smaller rate of decline than the 2.7% drop over the six-month period between August 2023 and February 2024. The composite economic indexes are the key elements in an analytic system designed to signal peaks and troughs in the business cycle. The indexes are constructed to summarize and reveal common turning points in the economy in a clearer and more convincing manner than any individual component. The CEI is highly correlated with real GDP. The LEI is a predictive variable that anticipates (or “leads”) turning points in the business cycle by around 7 months. Shaded areas denote recession periods or economic contractions. The dates above the shaded areas show the chronology of peaks and troughs in the business cycle. The ten components of The Conference Board Leading Economic Index® for the U.S. include: Average weekly hours in manufacturing; Average weekly initial claims for unemployment insurance; Manufacturers’ new orders for consumer goods and materials; ISM® Index of New Orders; Manufacturers’ new orders for nondefense capital goods excluding aircraft orders; Building permits for new private housing units; S&P 500® Index of Stock Prices; Leading Credit Index™; Interest rate spread (10-year Treasury bonds less federal funds rate); Average consumer expectations for business conditions. REF: ConferenceBoard, LEI Report for August (Released on 9/27/2024)
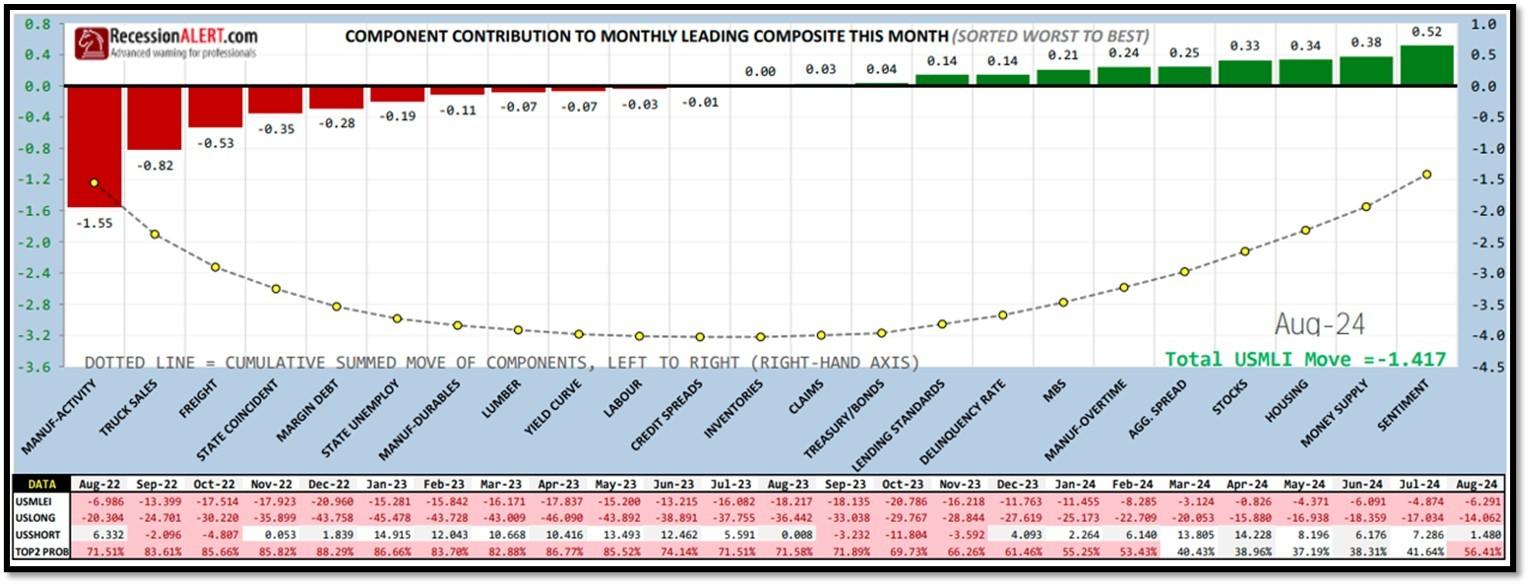
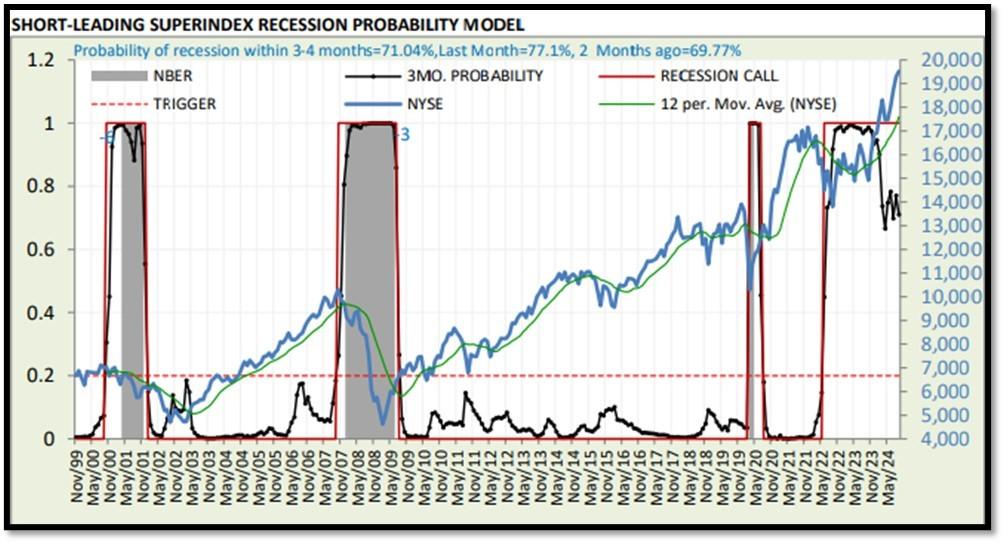
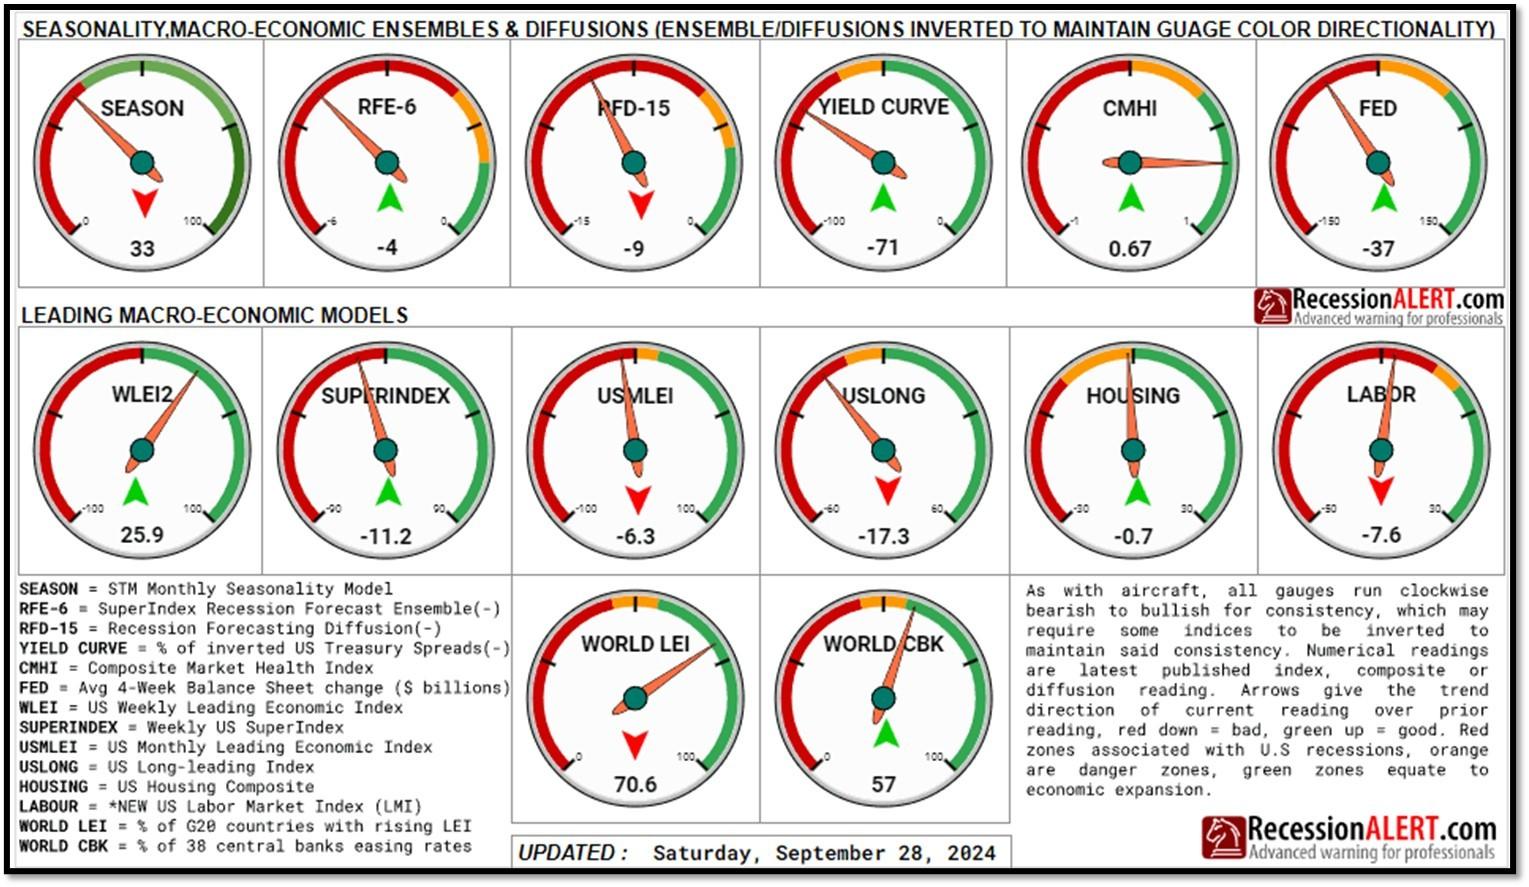
5F. Probability of U.S. falling into Recession within 3 to 4 months is currently at 71.04% (with data as of 10/6/2024 – Next Report 10/20/2024) according to RecessionAlert Research. Last release’s data was at 70.3%. This report is updated every two weeks. REF: RecessionAlertResearch, Gauges
5G. Yield Curve as of 10/8/2024 is showing Inversion to Flattening. Spread on the 10-yr Treasury Yield (4.02%) minus yield on the 2-yr Treasury Yield (3.96%) is currently at 6 bps. REF: Stockcharts The yield curve—specifically, the spread between the interest rates on the ten-year Treasury note and the three-month Treasury bill—is a valuable forecasting tool. It is simple to use and significantly outperforms other financial and macroeconomic indicators in predicting recessions two to six quarters ahead. REF: NYFED
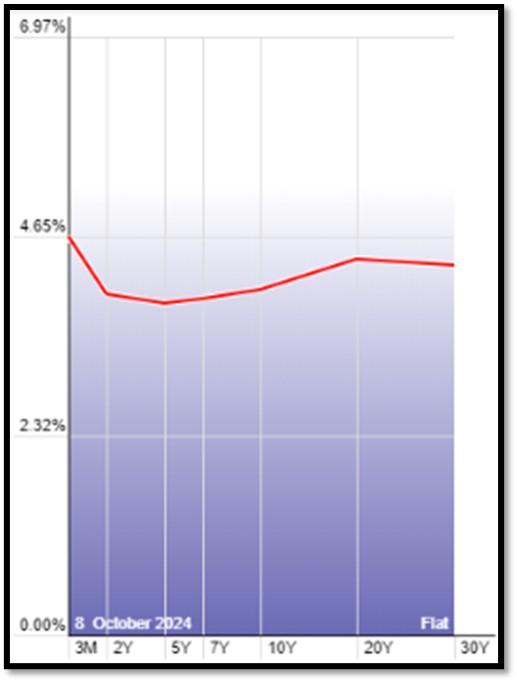
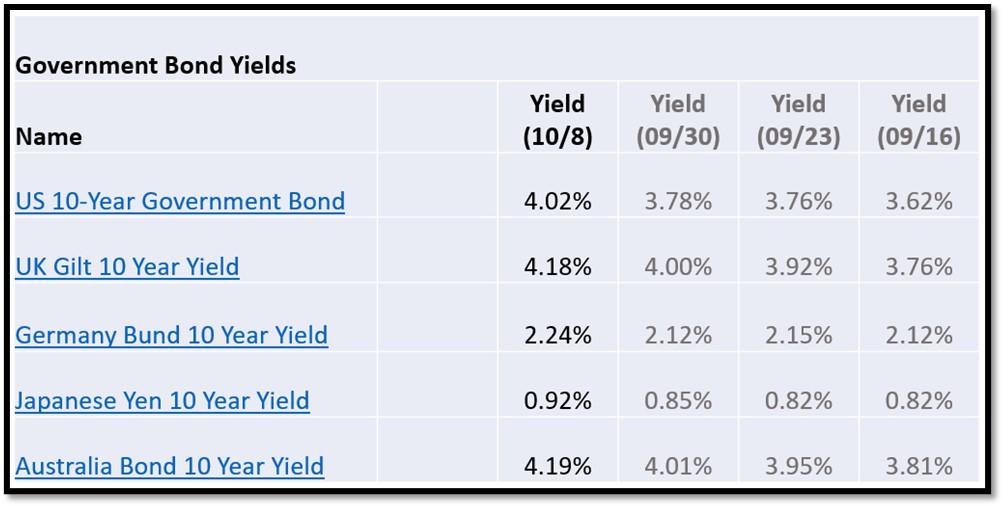
5H. Recent Yields in 10-Year Government Bonds. REF: Source is from Bloomberg.com, dated 10/8/2024, rates shown below are as of 10/8/2024, subject to change.
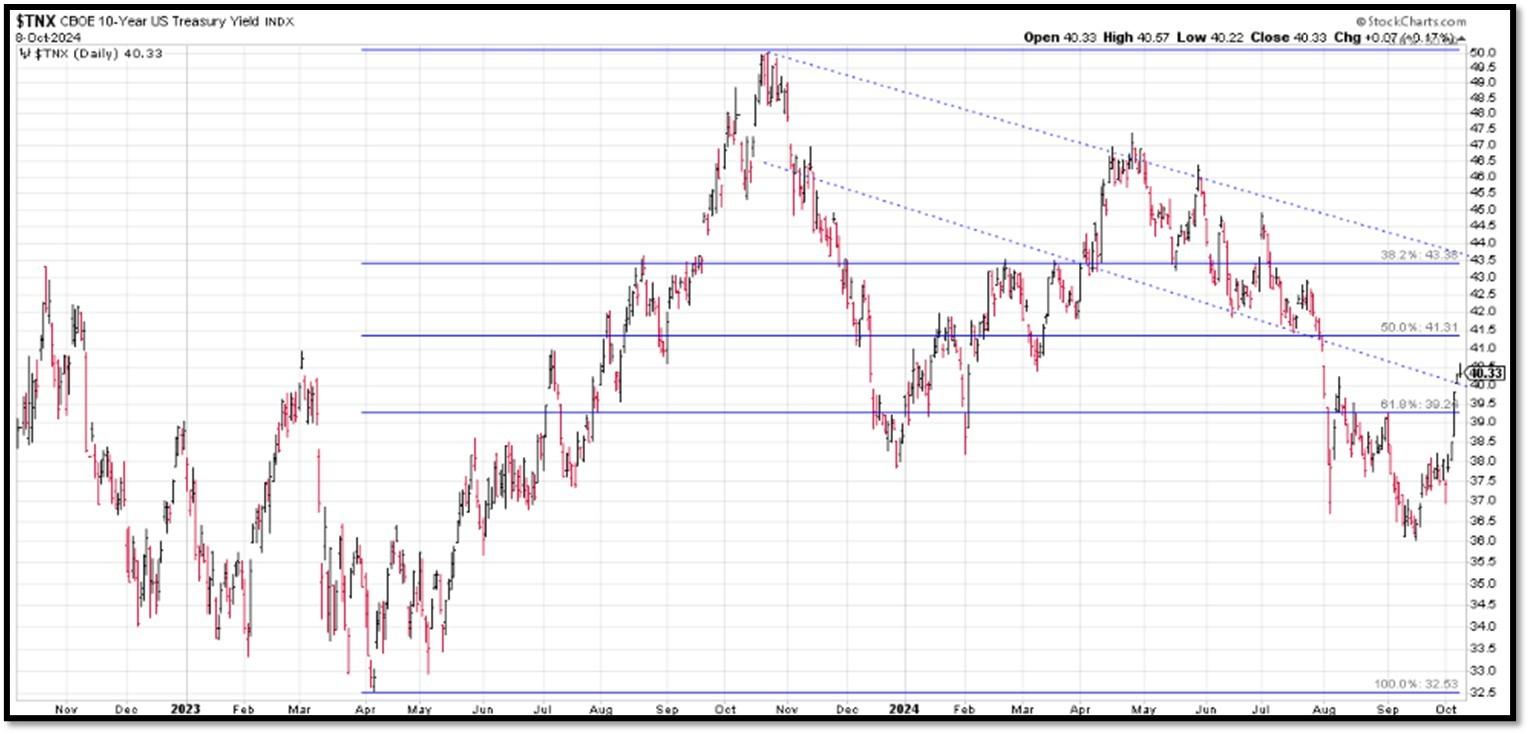
The 10-Year US Treasury Yield… REF: StockCharts1, StockCharts2
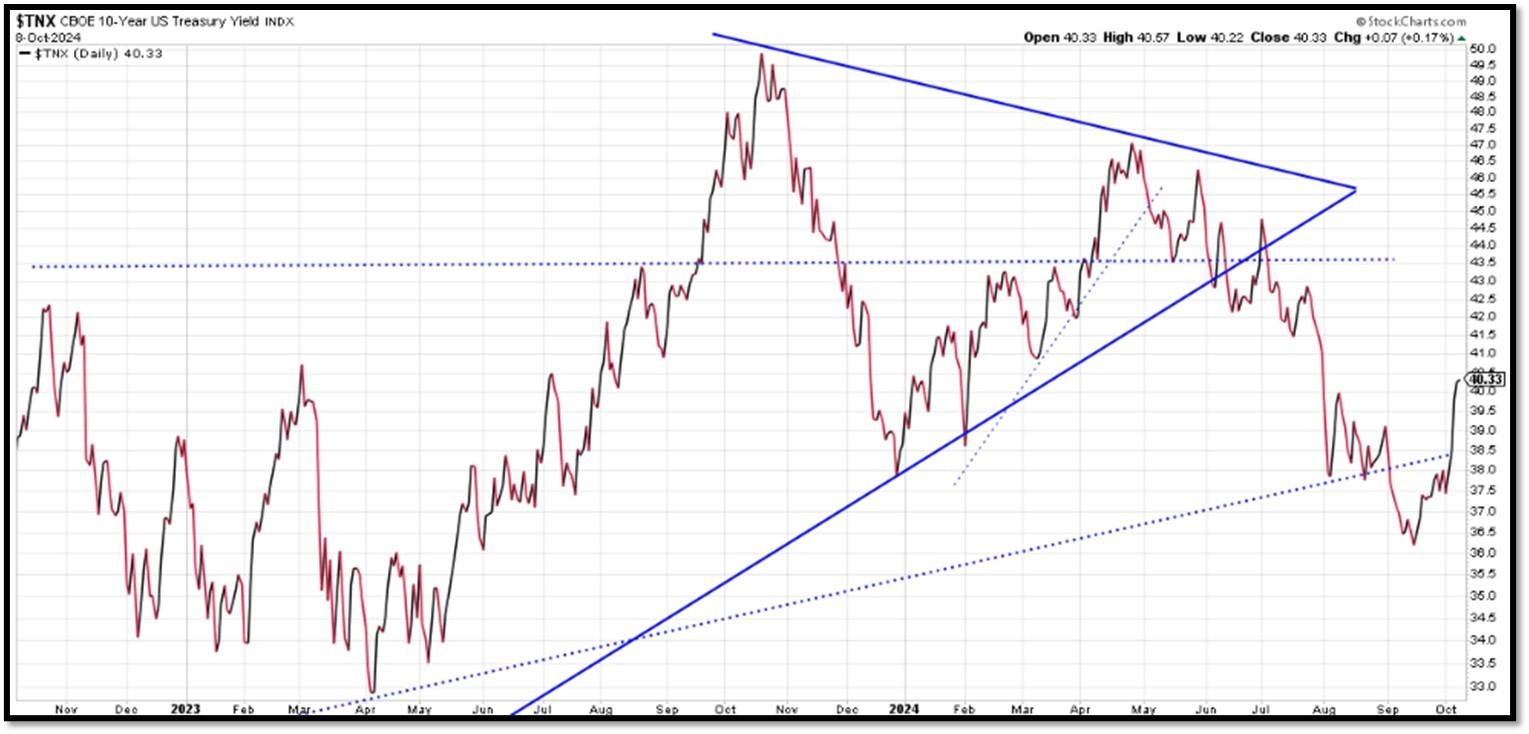
The 10-year yield – Spiked back to trend…
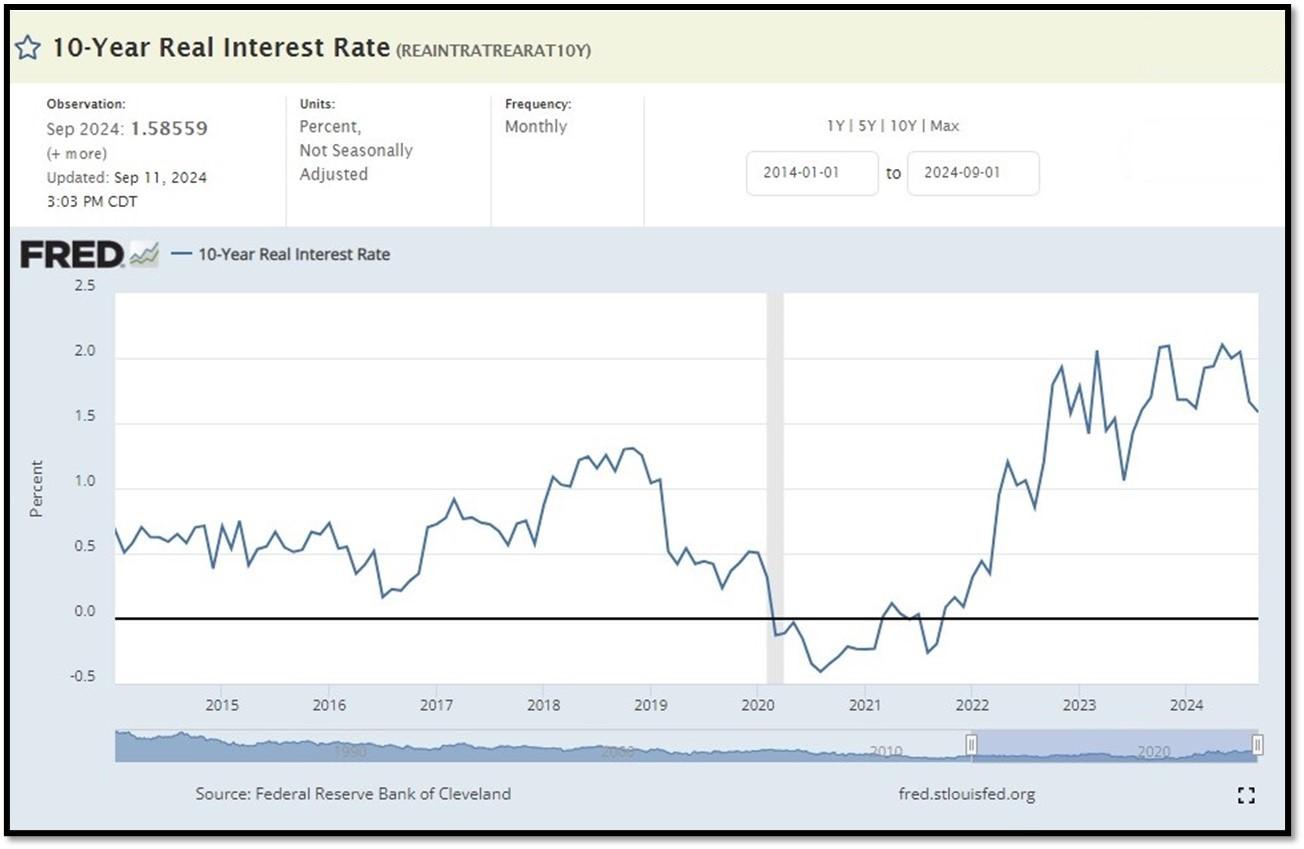
10-Year Real Interest Rate at 1.85% as of 9/11/24. It continues to climb even when Fed stopped raising interest rates. REF: REAINTRATREARAT10Y
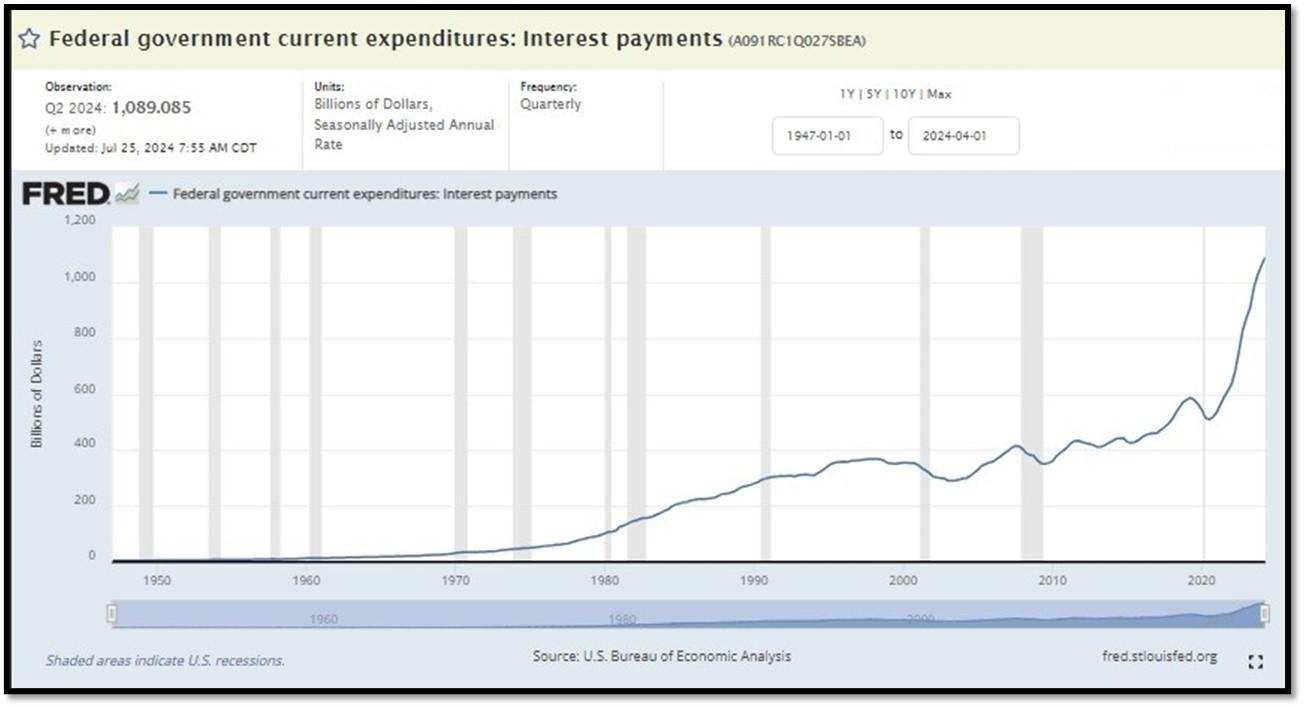
Federal government Interest Payments increased $30B to $1.089 T as of Q2-2024. REF: FRED-A091RC1Q027SBEA
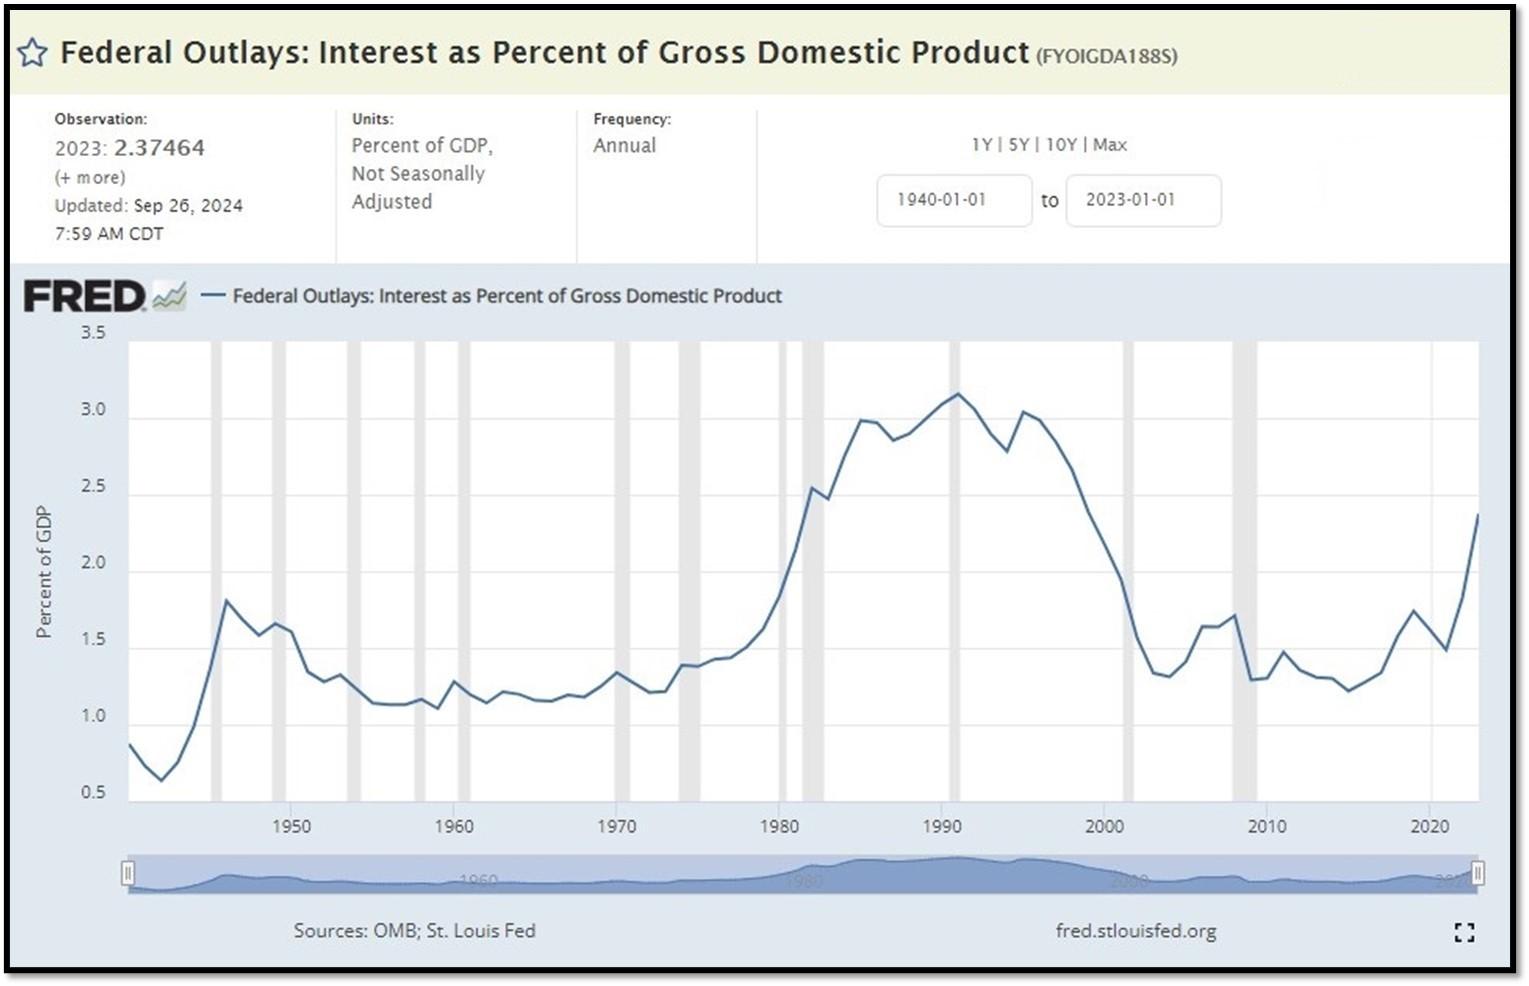
Interest payments as a percentage of GDP increased from 1.84853 in 2022 to 2.37464 as of 9/26/24. REF: FRED-FYOIGDA188S
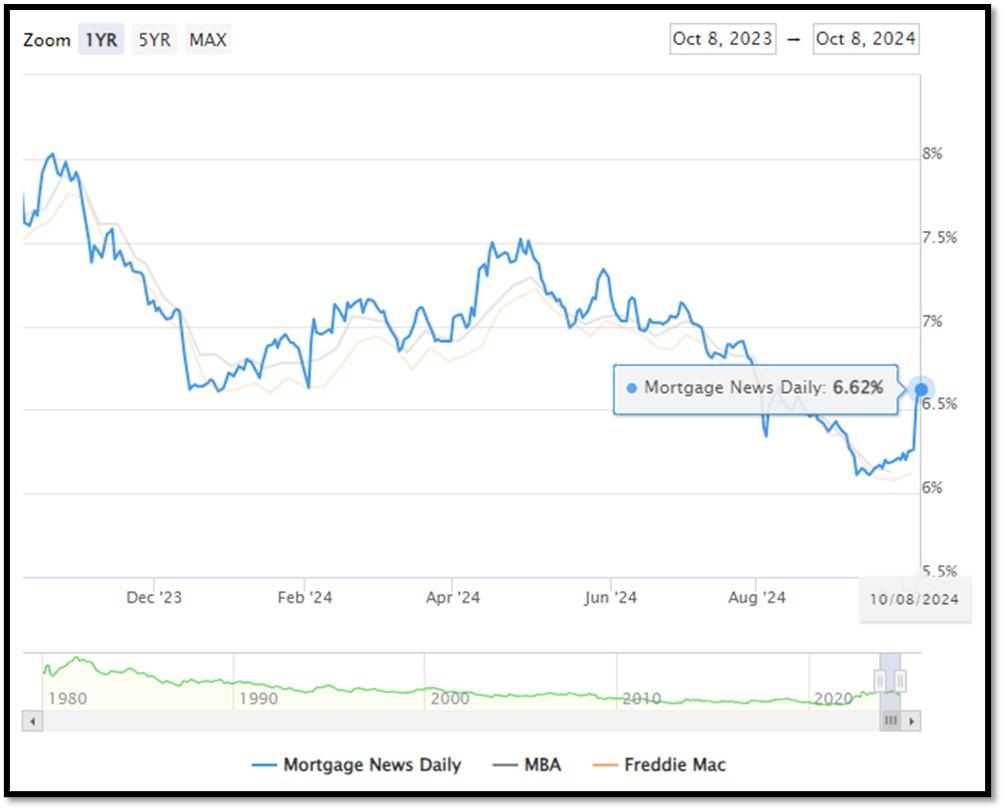
5I. (10/8/2024) Today’s National Average 30-Year Fixed Mortgage Rate is 6.62% (All Time High was 8.03% on 10/19/23). Last week’s data was 6.24%. This rate is the average 30-year fixed mortgage rates from several different surveys including Mortgage News Daily (daily index), Freddie Mac (weekly survey), Mortgage Bankers Association (weekly survey) and FHFA (monthly survey). REF: MortgageNewsDaily, Today’s Average Rate
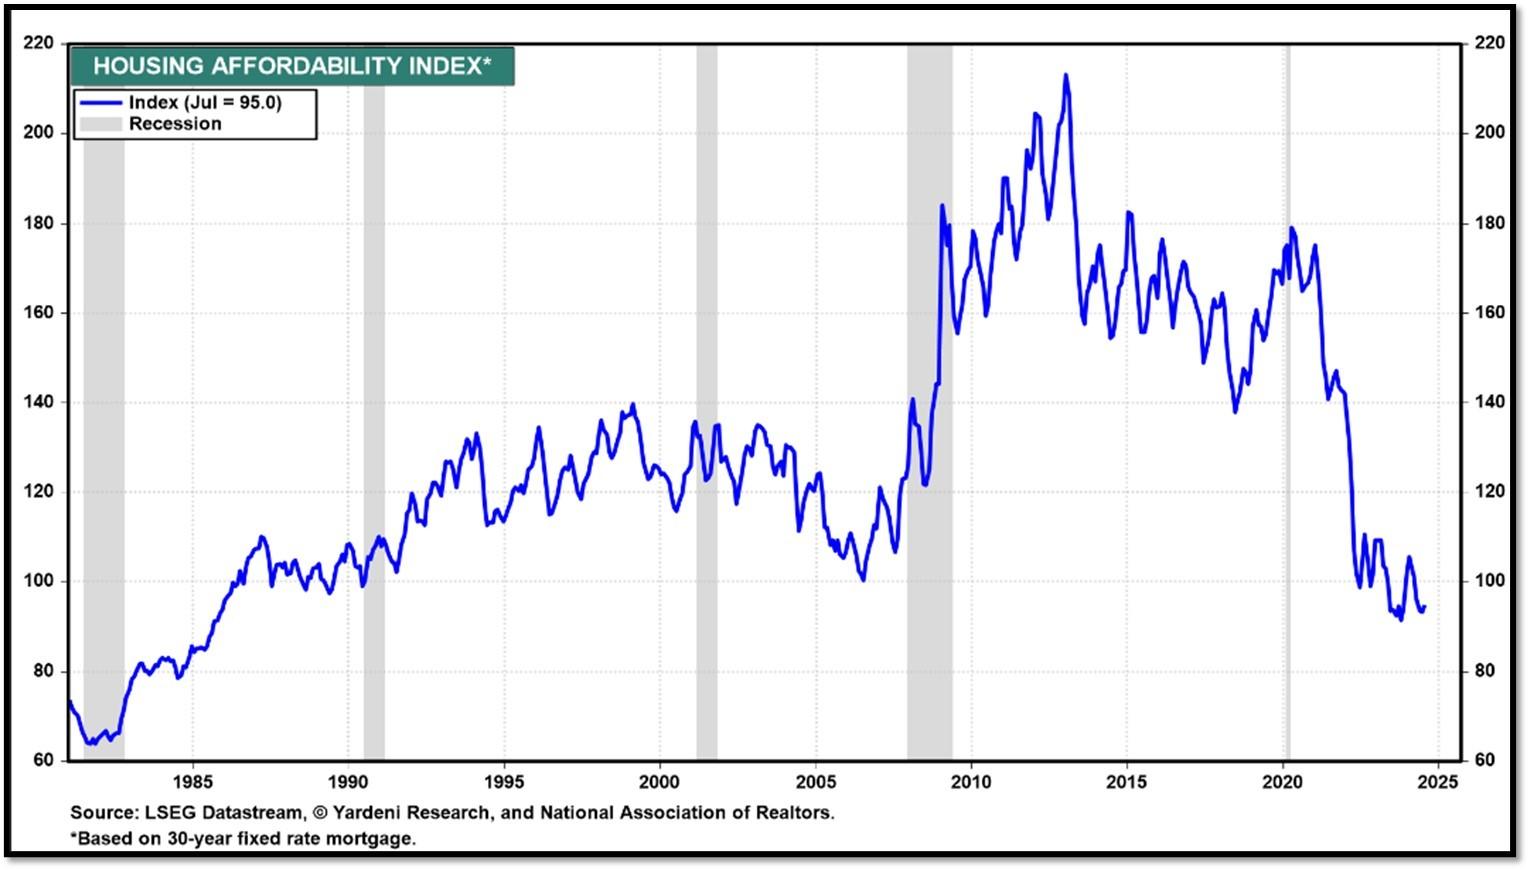
(09/16/24) Housing Affordability Index for July = 95 // June = 93.3 // May = 93.1 // April = 95.9 // March = 101.1 // February = 103.0. Data provided by Yardeni Research. REF: Yardeni
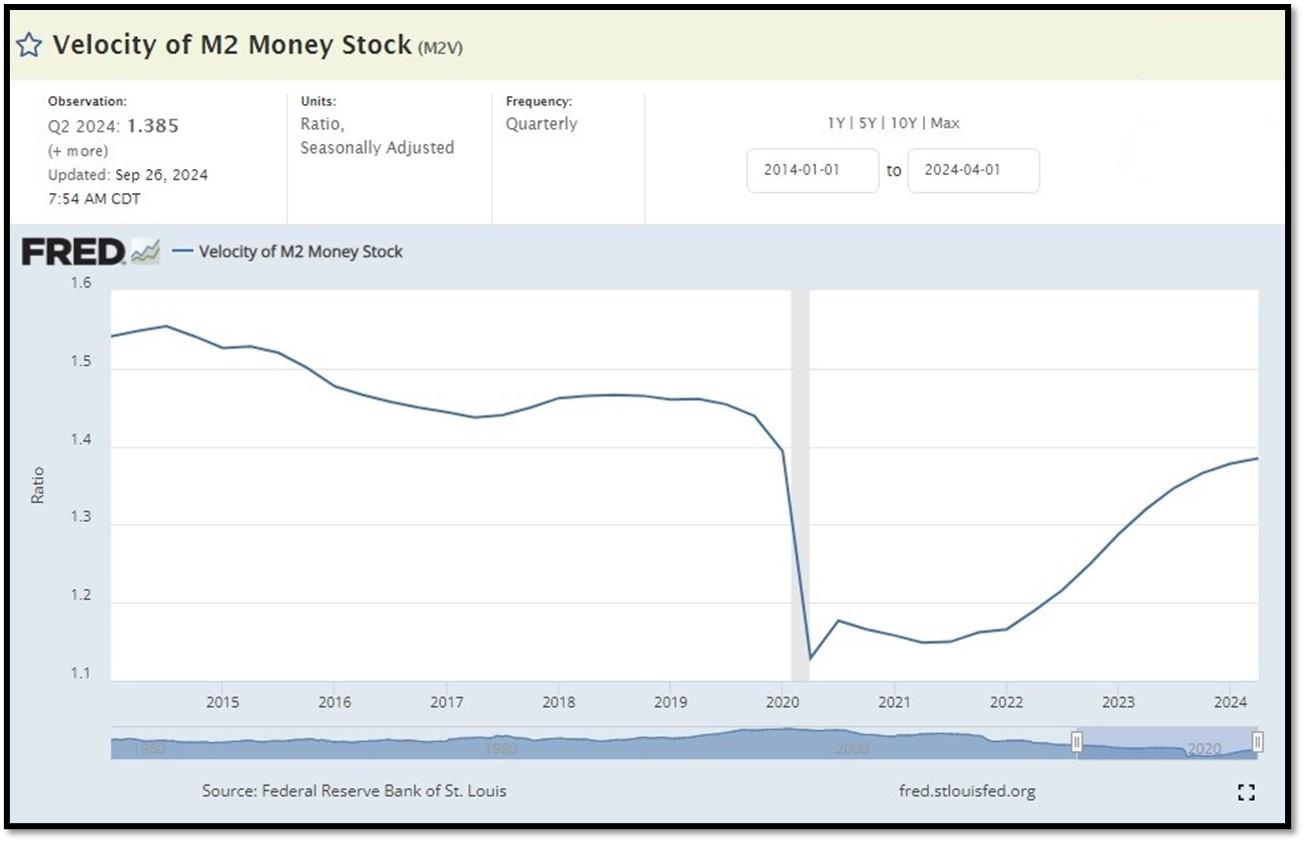
5J. Velocity of M2 Money Stock (M2V) with current read at 1.385 as of (Q2-2024 updated 9/26/2024). Previous quarter’s data was 1.368. The velocity of money is the frequency at which one unit of currency is used to purchase domestically- produced goods and services within a given time period. In other words, it is the number of times one dollar is spent to buy goods and services per unit of time. If the velocity of money is increasing, then more transactions are occurring between individuals in an economy. Current Money Stock (M2) report can be viewed in the reference link. REF: St.LouisFed-M2V
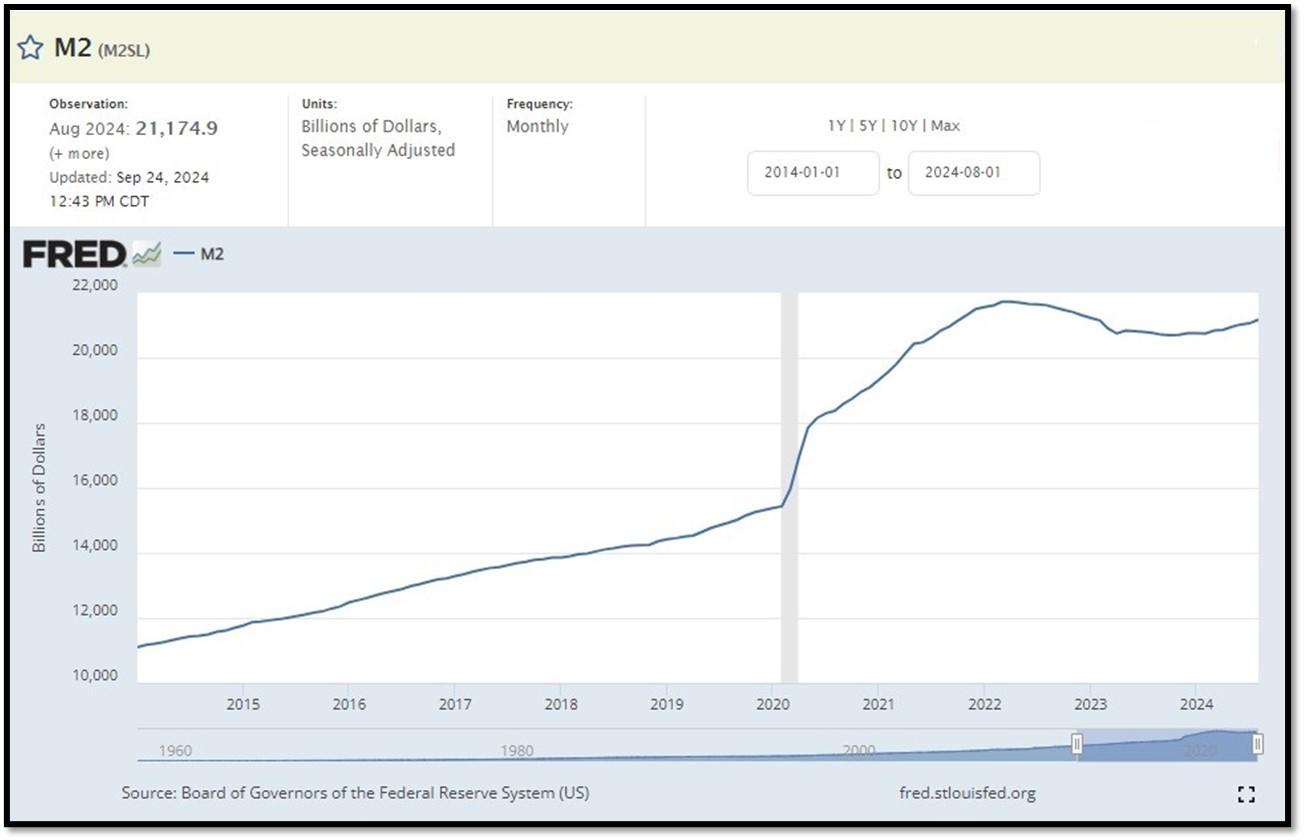
M2 consists of M1 plus (1) small-denomination time deposits (time deposits in amounts of less than $100,000) less IRA and Keogh balances at depository institutions; and (2) balances in retail MMFs less IRA and Keogh balances at MMFs. Seasonally adjusted M2 is constructed by summing savings deposits (before May 2020), small-denomination time deposits, and retail MMFs, each seasonally adjusted separately, and adding this result to seasonally adjusted M1. Board of Governors of the Federal Reserve System (US), M2 [M2SL], retrieved from FRED, Federal Reserve Bank of St. Louis; Updated on August 27, 2024. REF: St.LouisFed-M2
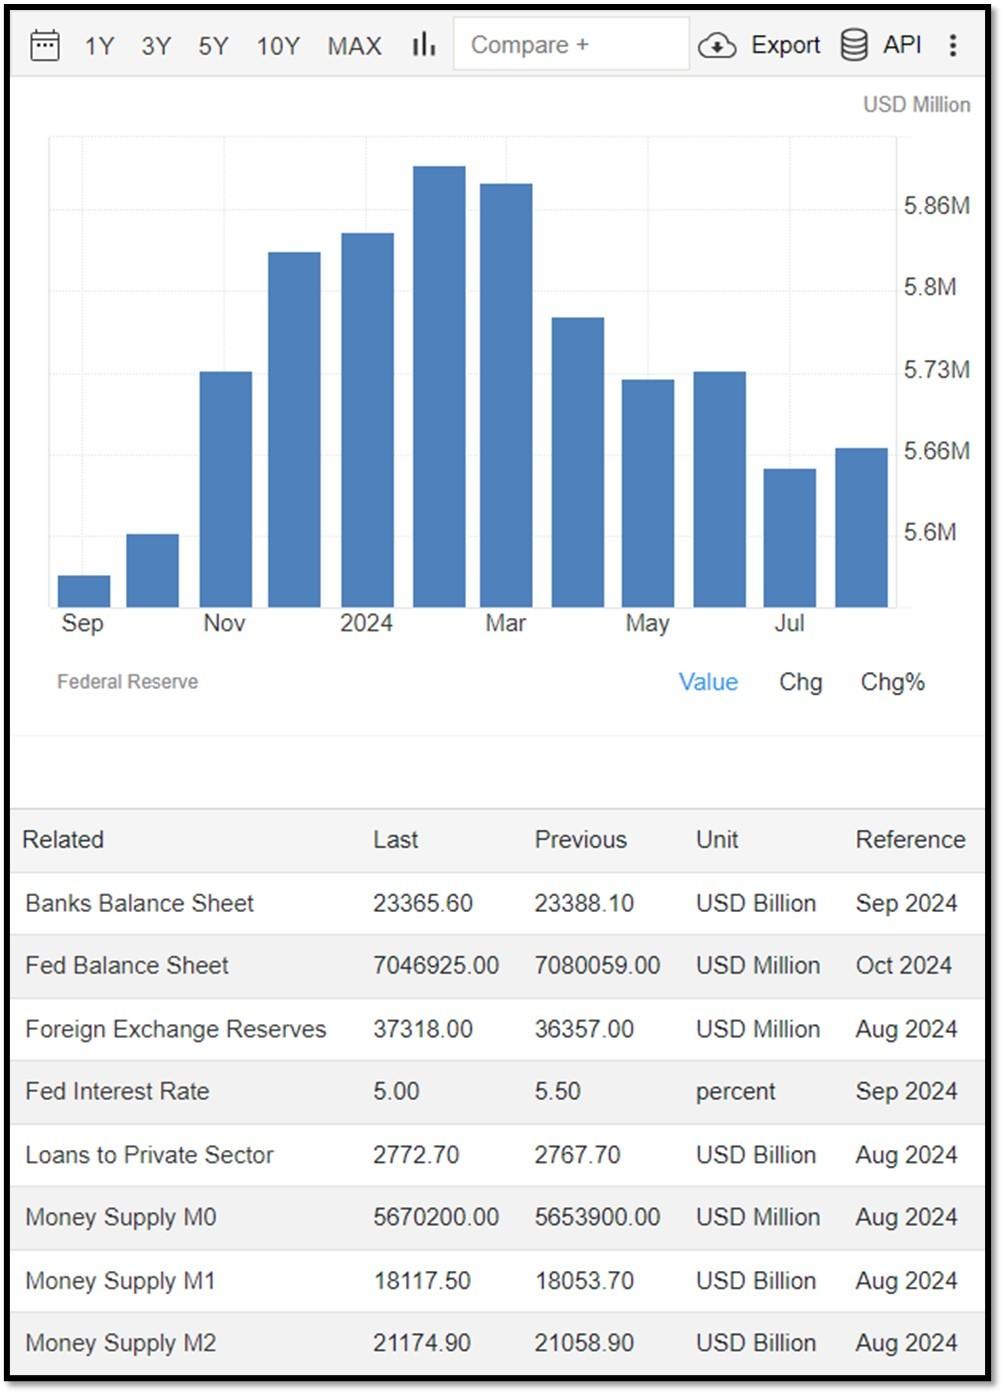
Money Supply M0 in the United States increased to 5,670,200 USD Million in August from 5,653,900 USD Million in July of 2024. Money Supply M0 in the United States averaged 1,143,807.23 USD Million from 1959 until 2024, reaching an all-time high of 6,413,100.00 USD Million in December of 2021 and a record low of 48,400.00 USD Million in February of 1961. REF: TradingEconomics, M0
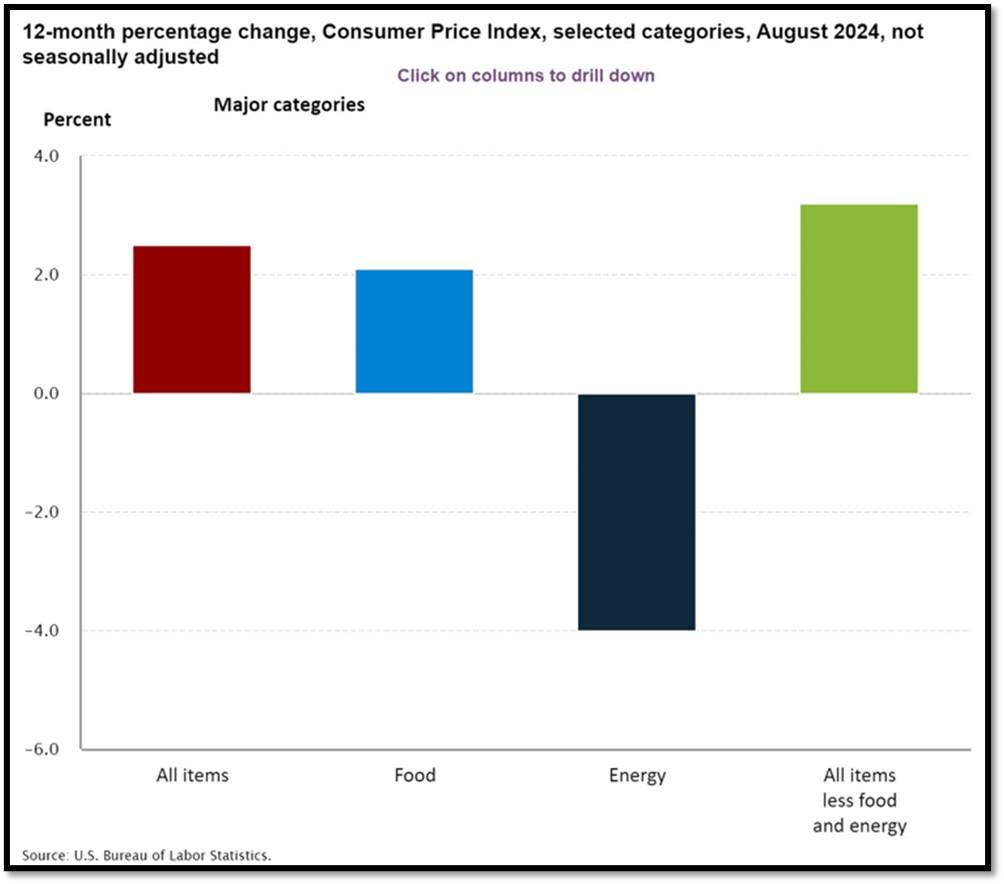
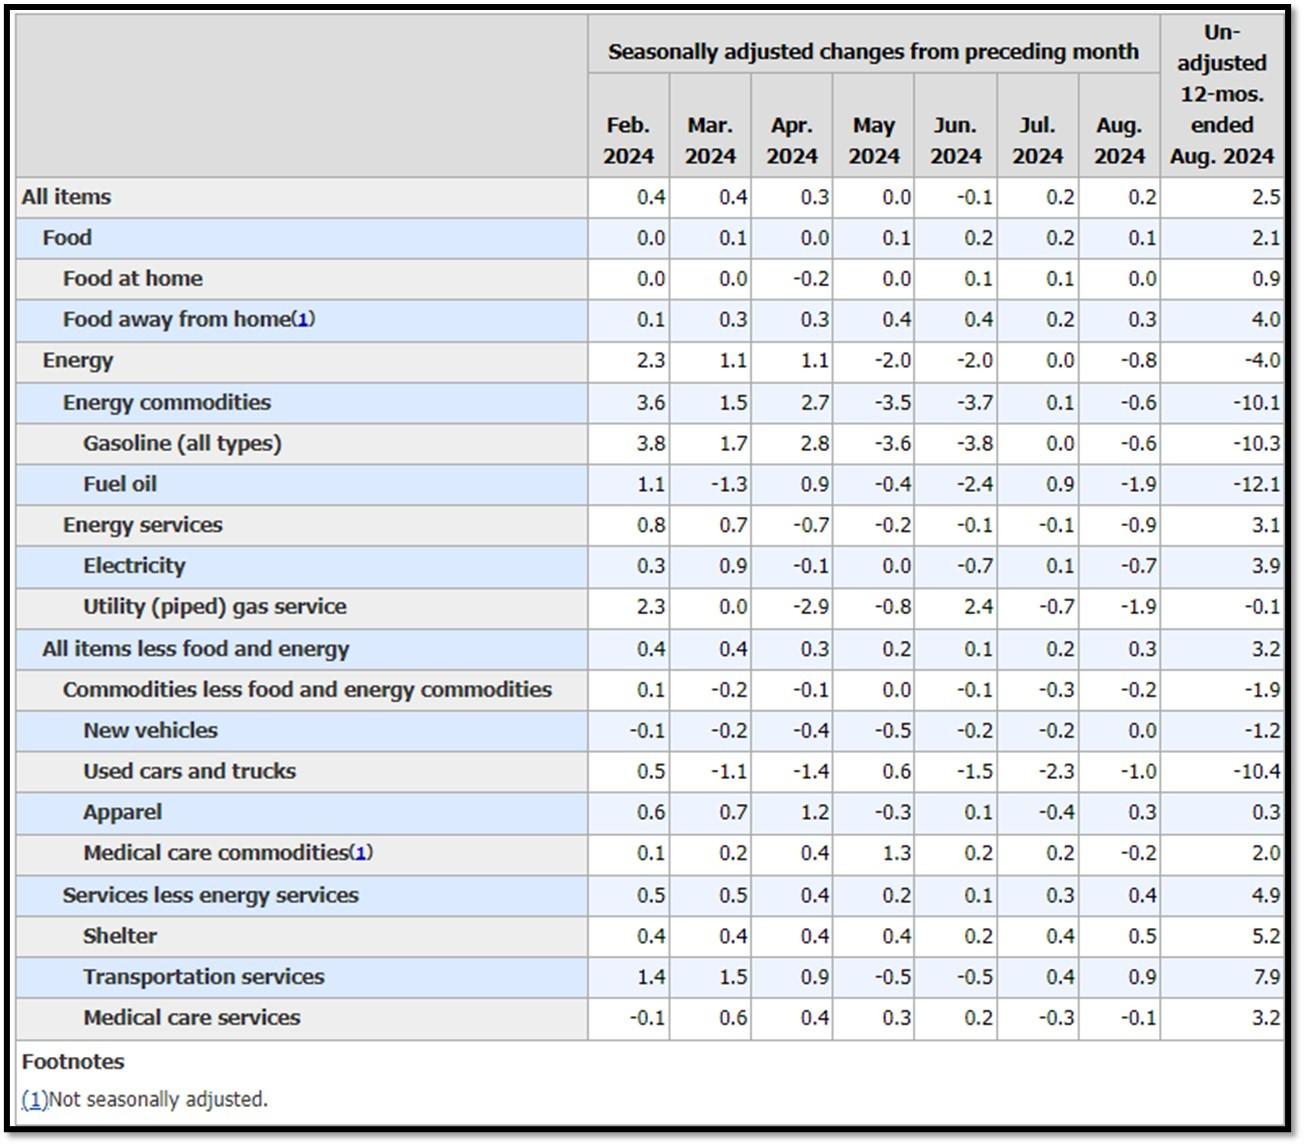
5K. In August, the Consumer Price Index for All Urban Consumers rose 0.2 percent, seasonally adjusted, and rose 2.5 percent over the last 12 months, not seasonally adjusted. The index for all items less food and energy increased 0.3 percent in August (SA); up 3.2 percent over the year (NSA). September 2024 CPI data are scheduled to be released on October 10, 2024, at 8:30AM-ET. REF: BLS, BLS.GOV
5L. Technical Analysis of the S&P500 Index. Click onto reference links below for images.
- Short-term Chart: Bullish on 10/8/2024 – REF: Short-term S&P500 Chart by Marc Slavin (Click Here to Access Chart)
- Medium-term Chart: Bullish on 10/8/2024 – REF: Medium-term S&P500 Chart by Marc Slavin (Click Here to Access Chart)
- Market Timing Indicators – S&P500 Index as of 10/8/2024 – REF: S&P500 Charts (7 of them) by Joanne Klein’s Top 7 (Click Here to Access Updated Charts)
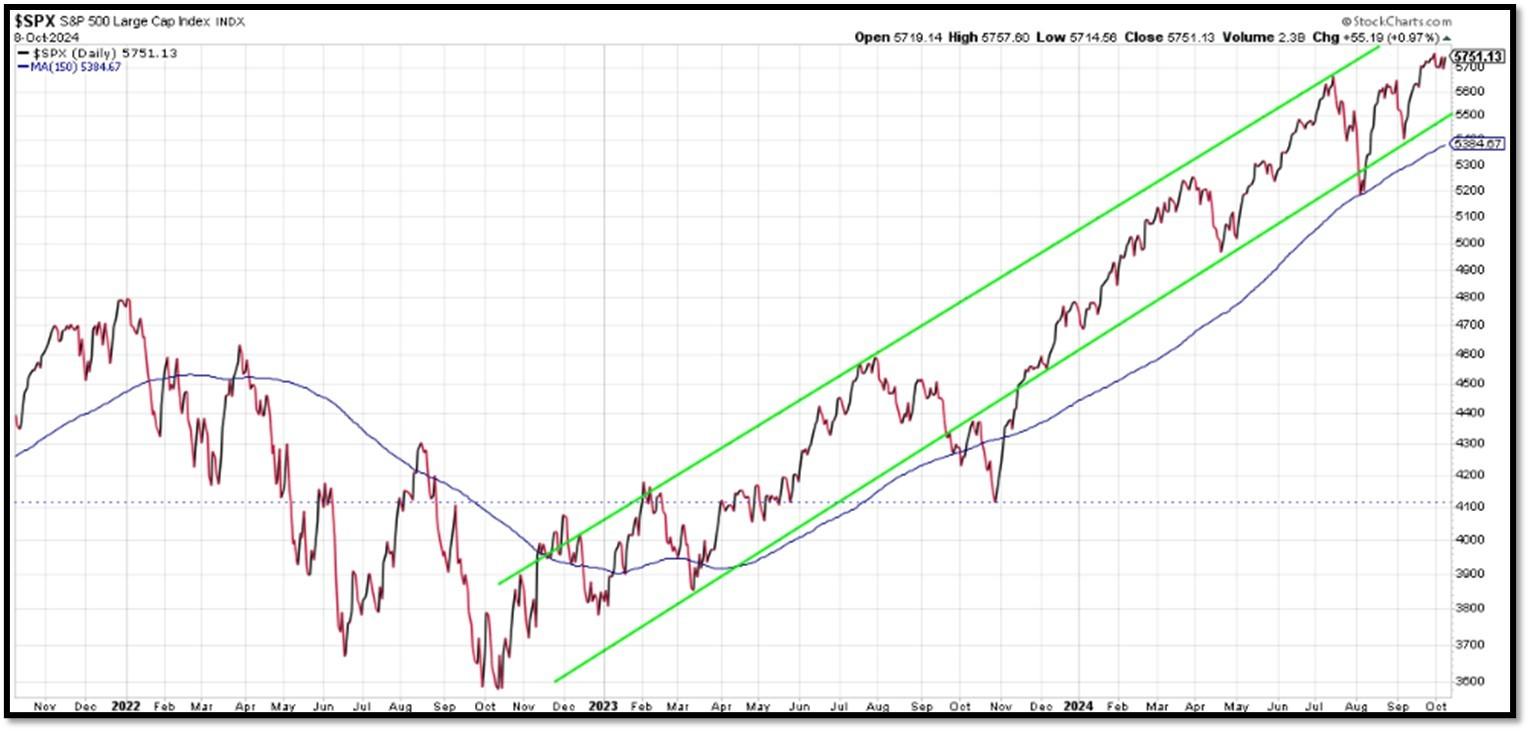
- A well-defined uptrend channel shown in green with S&P500 getting back on trend. REF: Stockcharts
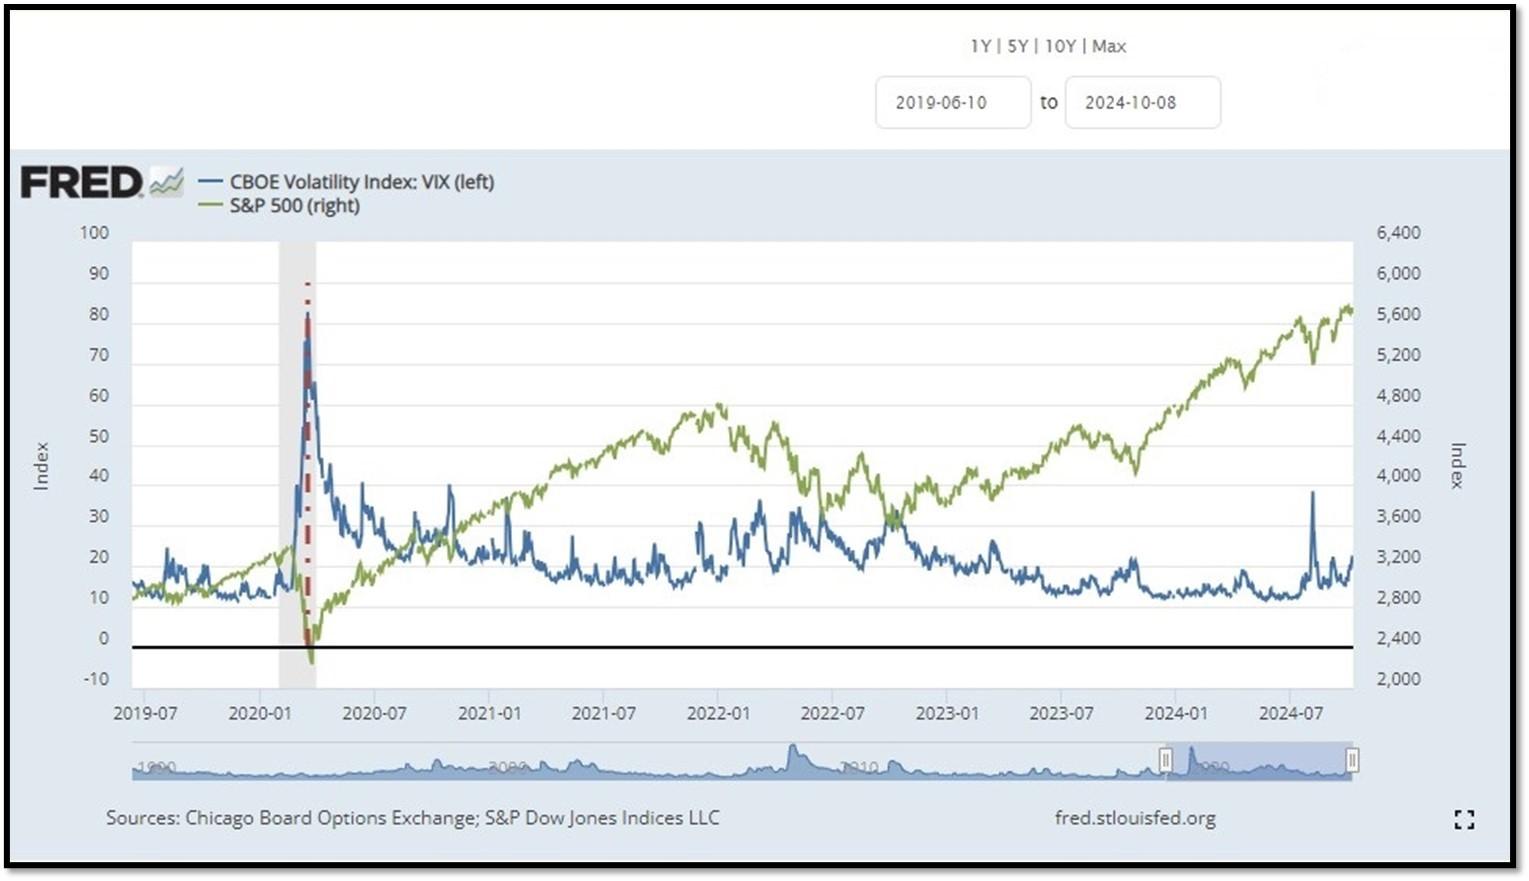
- S&P500 and CBOE Volatility Index (VIX) as of 10/8/2024. REF: FRED, Today’s Print
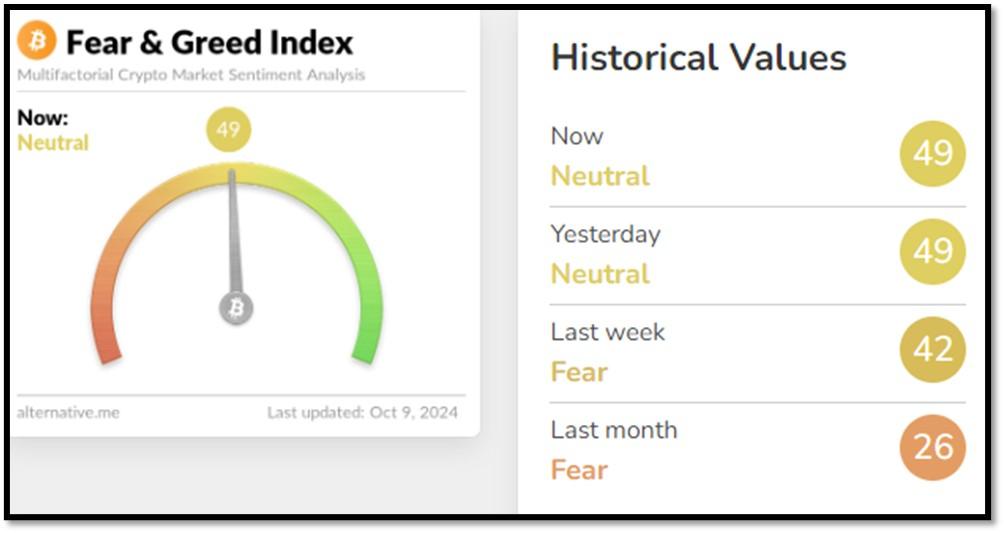
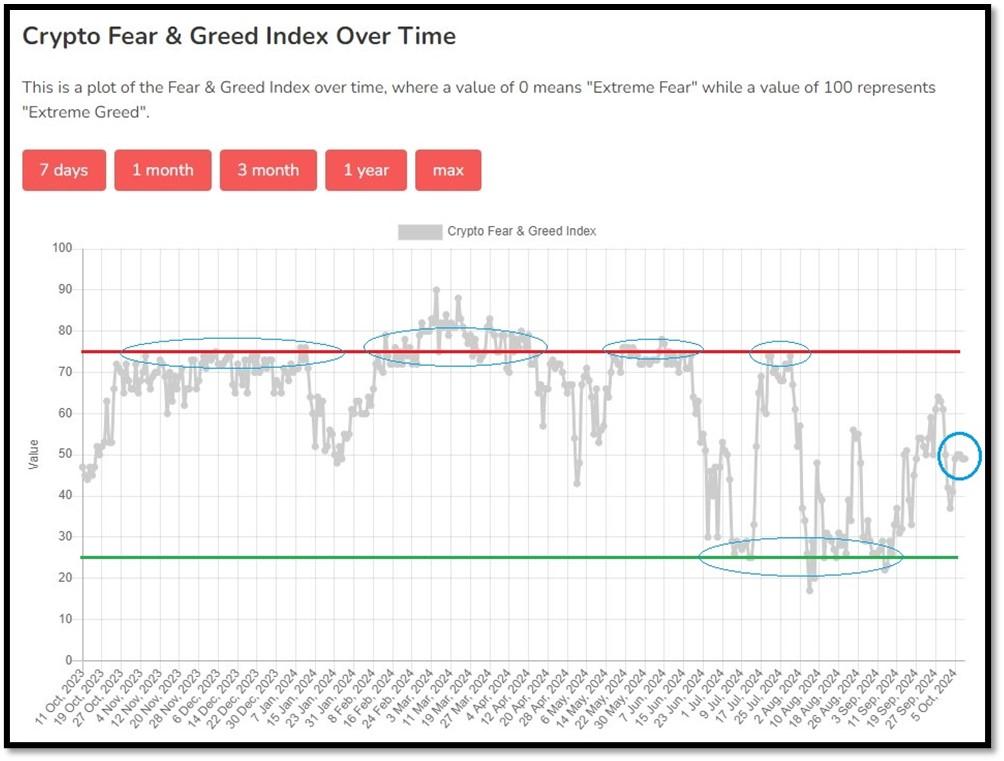
5M. Most recent read on the Crypto Fear & Greed Index with data as of 10/9/2024au is 49 (Neutral). Last week’s data was 42 (Neutral) (1-100). Fear & Greed Index – A Contrarian Data. The crypto market behavior is very emotional. People tend to get greedy when the market is rising which results in FOMO (Fear of missing out). Also, people often sell their coins in irrational reaction of seeing red numbers. With the Crypto Fear and Greed Index, the data try to help save investors from their own emotional overreactions. There are two simple assumptions:
- Extreme fear can be a sign that investors are too worried. That could be a buying opportunity.
- When Investors are getting too greedy, that means the market is due for a correction.
Therefore, the program for this index analyzes the current sentiment of the Bitcoin market and crunch the numbers into a simple meter from 0 to 100. Zero means “Extreme Fear”, while 100 means “Extreme Greed”. REF: Alternative.me, Today’sReading
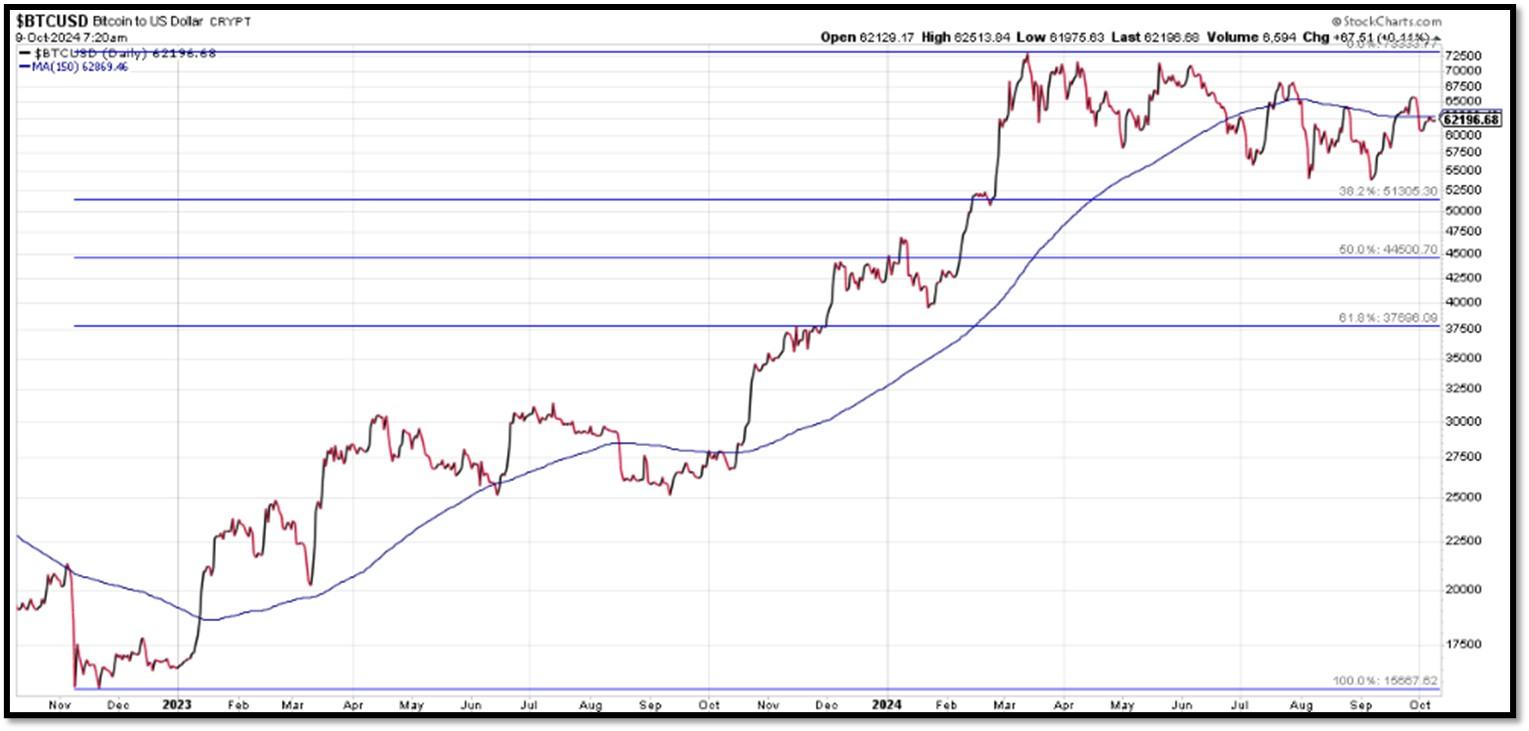
Bitcoin currently hugging the 150-day moving average. REF: Stockcharts
From the desk of our Chief Investment Officer
As an investment professional with over twenty-six years of experience in the financial services industry, Andrew helps clients to protect, grow and transfer wealth during their lifetime with objective, unbiased, customized and efficient strategies.
Education, Professional Licenses Acquired & Affiliations
- Series 7, 63, 65 and 24 Licensed.
- Currently holding Series 65 License registered with SEC
- BA in Economics – Boston University (Boston, MA) 1993
- Certificate in Commodities Trading – New York University (New York, NY) 1991
- Certificate in Financial Planning – New York University (New York, NY) April 2011
With extensive experience in the Financial Services Industry, Andrew Tang and Turner Financial Group provides disciplined wealth management with an intelligent caring approach to each and every client that compliments the Dedicated Financial offering.


Len writes much of his own content, and also shares helpful content from other trusted providers like Turner Financial Group (TFG).
The material contained herein is intended as a general market commentary, solely for informational purposes and is not intended to make an offer or solicitation for the sale or purchase of any securities. Such views are subject to change at any time without notice due to changes in market or economic conditions and may not necessarily come to pass. This information is not intended as a specific offer of investment services by Dedicated Financial and Turner Financial Group, Inc.
Dedicated Financial and Turner Financial Group, Inc., do not provide tax, legal or accounting advice. You should consult your own tax, legal and accounting advisors before engaging in any transaction.
Any hyperlinks in this document that connect to Web Sites maintained by third parties are provided for convenience only. Turner Financial Group, Inc. has not verified the accuracy of any information contained within the links and the provision of such links does not constitute a recommendation or endorsement of the company or the content by Dedicated Financial or Turner Financial Group, Inc. The prices/quotes/statistics referenced herein have been obtained from sources verified to be reliable for their accuracy or completeness and may be subject to change.
Past performance is no guarantee of future returns. Investing involves risk and possible loss of principal capital. The views and strategies described herein may not be suitable for all investors. To the extent referenced herein, real estate, hedge funds, and other private investments can present significant risks, including loss of the original amount invested. All indexes are unmanaged, and an individual cannot invest directly in an index. Index returns do not include fees or expenses.
Turner Financial Group, Inc. is an Investment Adviser registered with the United States Securities and Exchange Commission however, such registration does not imply a certain level of skill or training and no inference to the contrary should be made. Additional information about Turner Financial Group, Inc. is also available at www.adviserinfo.sec.gov. Advisory services are only offered to clients or prospective clients where Turner Financial Group, Inc. and its representatives are properly licensed or exempt from licensure. No advice may be rendered by Turner Financial Group, Inc. unless a client service agreement is in place.


