

- 1. Recent data presents a moderate expansion in the U.S. economy, with manufacturing rebounding, job openings declining, and services growth slowing.
- 2. U.S. Bitcoin Reserve Speculation Strengthens Adoption Conviction – Speculation that the U.S. may establish a Strategic Bitcoin Reserve has reinforced confidence in Bitcoin’s long-term adoption.
- With the current macro-economic backdrop, below are areas we currently favor:
- 3. On February 3, 2025, President Donald Trump signed an executive order establishing the first U.S. Sovereign Wealth Fund (SWF), a state-managed investment fund designed to generate long-term national wealth.
- 4. World Watch
- 5. Quant & Technical Corner
1. Recent data presents a moderate expansion in the U.S. economy, with manufacturing rebounding, job openings declining, and services growth slowing.
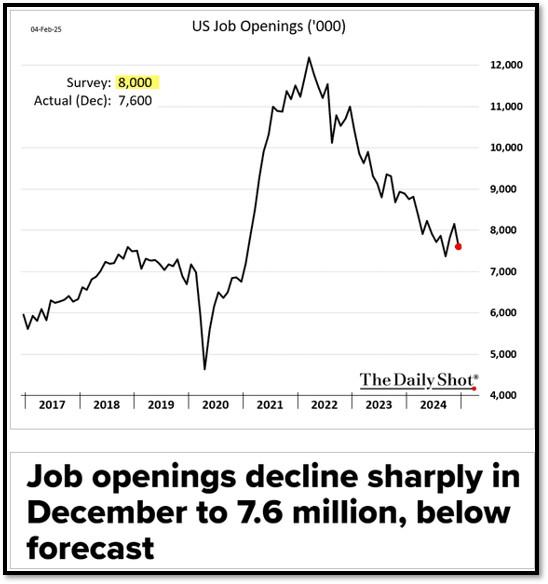
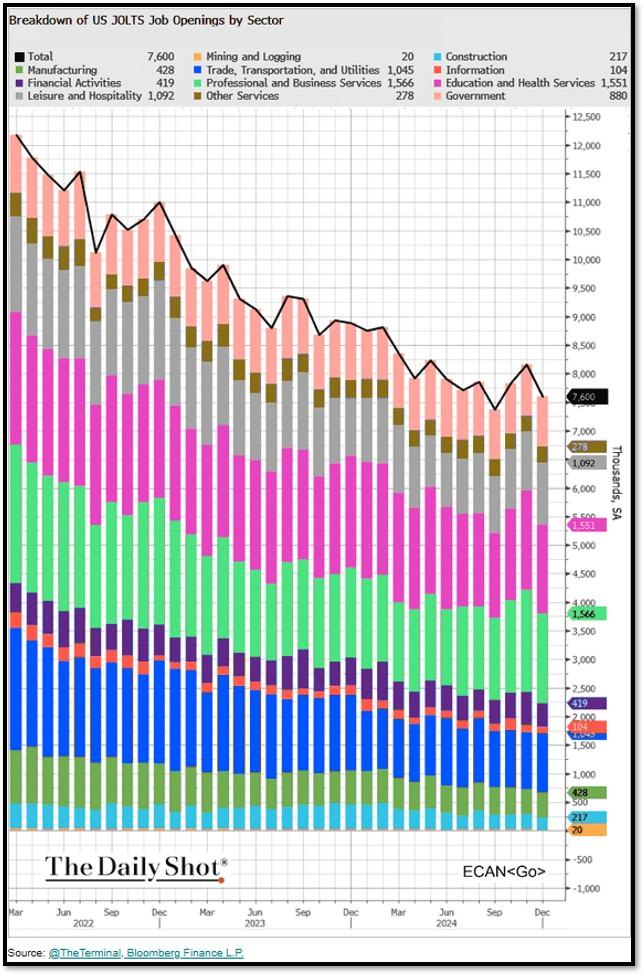
Manufacturing: The ISM Manufacturing PMI rose to 50.9% in January, marking its first expansion in over two years. New orders and production showed strong growth, but tariff-related cost concerns could pose challenges. Labor Market: JOLTS job openings fell to 7.6 million in December, the biggest drop in 14 months, signaling cooling labor demand. However, layoffs remain low, and hiring has slightly increased, suggesting continued job market stability. Services: The ISM Services PMI fell to 52.8%, indicating slower growth. New orders weakened, but employment expanded for the fourth straight month. Price pressures eased, hinting at lower inflation risks. Overall, the economy shows gradual growth with challenges ahead, particularly from trade tariffs and a softening labor market. REF: BLS, ISM-January, DailyShot
2. U.S. Bitcoin Reserve Speculation Strengthens Adoption Conviction – Speculation that the U.S. may establish a Strategic Bitcoin Reserve has reinforced confidence in Bitcoin’s long-term adoption.
The U.S. government already holds over 200,000 BTC, primarily seized from criminal cases, making it one of the largest institutional Bitcoin holders. Supporters argue that formalizing Bitcoin as a strategic asset would legitimize it further, drive institutional adoption, and serve as a hedge against inflation. If the U.S. integrates Bitcoin into its reserve strategy, it could trigger a global crypto arms race, encouraging other nations to follow suit. While still speculative, the government’s existing Bitcoin holdings and growing discussions around a strategic reserve highlight Bitcoin’s increasing role in global finance. Click onto picture below to access video. REF: Forbes, CNBC, BARRON’S

With the current macro-economic backdrop, below are areas we currently favor:
- Fixed Income – Short-term Corporates (Low-Beta)
- Fixed Income – Corporates High Yield as Opportunistic Allocation (Low-Beta)
- Businesses that contribute to and benefit from AI & Automation (Market-Risk)
- Financials (Market-Risk)
- Industrials (Market-Risk)
- Small Cap & Mid Cap Stocks (Market-Risk)
- Biotechnology (Market-Risk)
- Gold (Market-Risk)
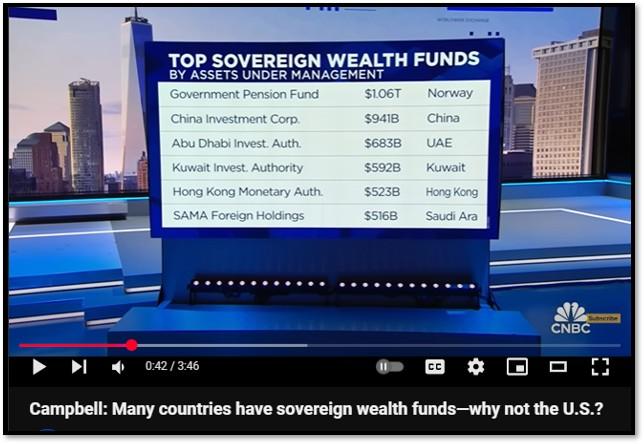
3. On February 3, 2025, President Donald Trump signed an executive order establishing the first U.S. Sovereign Wealth Fund (SWF), a state-managed investment fund designed to generate long-term national wealth.
Unlike traditional sovereign wealth funds, which are often funded by surplus revenue or natural resources, the U.S. plan seeks to monetize federal assets, including real estate and tariffs, to establish the fund. The fund’s primary objectives include enhancing fiscal sustainability, reducing tax burdens, and strengthening economic security through strategic investments in infrastructure, manufacturing, and research and development. President Trump has also hinted at using the fund for acquisitions, such as purchasing TikTok, to address national security concerns while generating revenue.
The administration has tasked Treasury Secretary Scott Bessent and Commerce Secretary Howard Lutnick with developing a detailed implementation plan within 90 days, aiming for full operational status within a year. However, the initiative faces scrutiny. Critics argue that, given the national debt, surplus funds should be allocated toward debt reduction rather than speculative investments. Additionally, concerns over governance, transparency, and political influence raise questions about the fund’s effectiveness and accountability. As the plan unfolds, its success will largely depend on how well it balances strategic investment opportunities with fiscal responsibility and transparent management. If properly structured, the fund could bolster economic strength, but mismanagement could lead to political and financial risks. The coming months will determine whether this bold move can truly reshape America’s financial future. Click onto picture below to access video. REF: WSJ, WhiteHouse, CNBC
4. World Watch
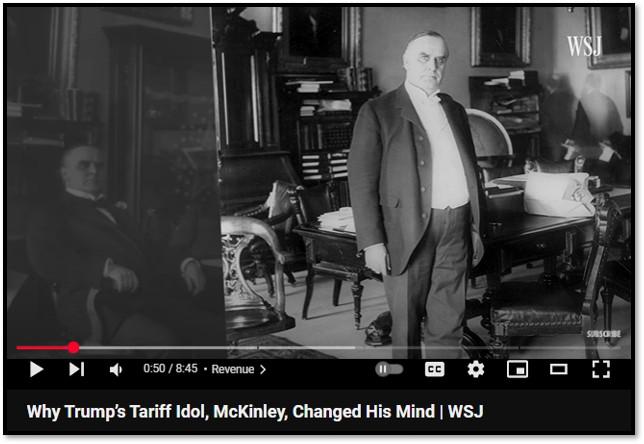
4A. William McKinley, the 25th U.S. president (1897–1901), was a strong advocate of protective tariffs to support American industry. As a congressman, he authored the McKinley Tariff of 1890, raising import duties to protect domestic manufacturers. As president, he reinforced this with the Dingley Tariff of 1897, imposing some of the highest rates in U.S. history. While these tariffs boosted industry, they also raised consumer costs and strained trade relations. Before his assassination in 1901, McKinley began promoting reciprocal trade agreements, signaling a shift toward freer trade. His legacy remains tied to protectionism, influencing U.S. economic policy for years. President Donald Trump often cites the 25th President, William McKinley, as an inspiration for tariffs. The ‘McKinley Tariffs’ were some of the largest hikes in U.S. history, but in his second term, McKinley changed his mind and argued for more free international trade as a way of helping the U.S. economy. Click onto picture below to access video. REF: WSJ, USHOR
4B. Financial markets are increasingly expecting the Bank of England (BoE) to implement multiple interest rates cuts this year, driven by economic stagnation and global uncertainties. Recent data indicates weak UK economic growth, with retail sales declining and GDP showing no growth for the latter half of 2024. As a result, traders are pricing in at least three 0.25% rate cuts, bringing the BoE’s base rate from 4.75% to 4% by year-end. Some investors are even betting on five cuts, reflecting a pessimistic economic outlook. Global factors, particularly U.S. trade tariffs, add further pressure, raising concerns over economic stability and reinforcing expectations for BoE intervention. As the year unfolds, all eyes remain on the BoE’s response to these challenges. REF: Bloomberg
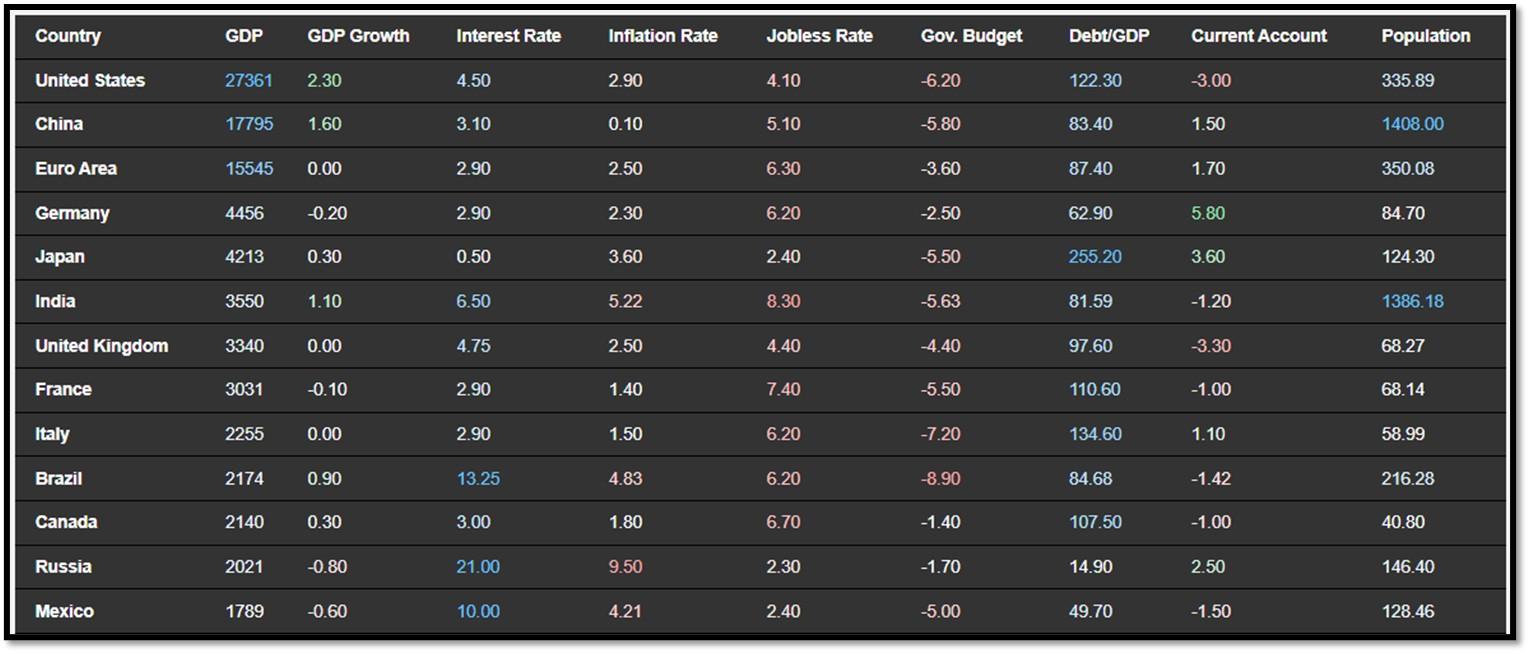
4C. Below is an updated snapshot of the current global state of economy according to TradingEconomics as of 2/4/2025. REF: TradingEconomics
- The US economy expanded an annualized 2.3% in Q4 2024, the slowest growth in three quarters, down from 3.1% in Q3 and forecasts of 2.6%, according to the advance estimate from the BEA.
- The German economy contracted 0.2% on quarter in the last three months of 2024, following a 0.1% expansion in Q3 and worse than forecasts of a 0.1% fall, preliminary estimates showed.
- The benchmark interest rate in Germany is set by the European Central Bank. Interest Rate in Germany averaged 1.86 percent from 1998 until 2025, reaching an all time high of 4.75 percent in October of 2000 and a record low of 0.00 percent in March of 2016.
- Germany’s annual consumer price inflation dropped to 2.3% in January 2025, down from 2.6% in December and below market expectations of 2.6%, a preliminary estimate showed.
5. Quant & Technical Corner
Below is a selection of quantitative & technical data we monitor on a regular basis to help gauge the overall financial market conditions and the investment environment.
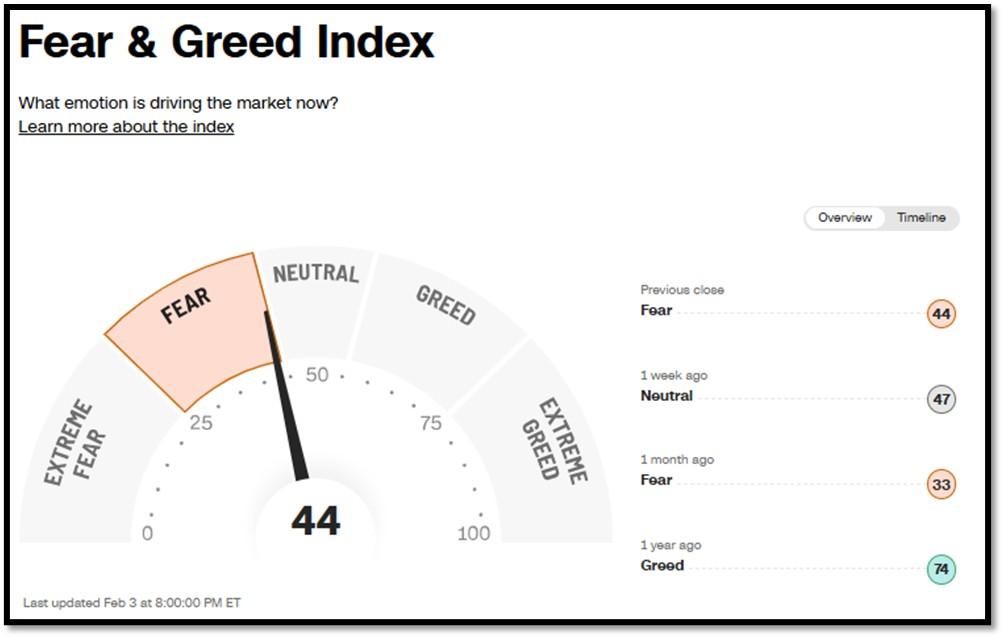
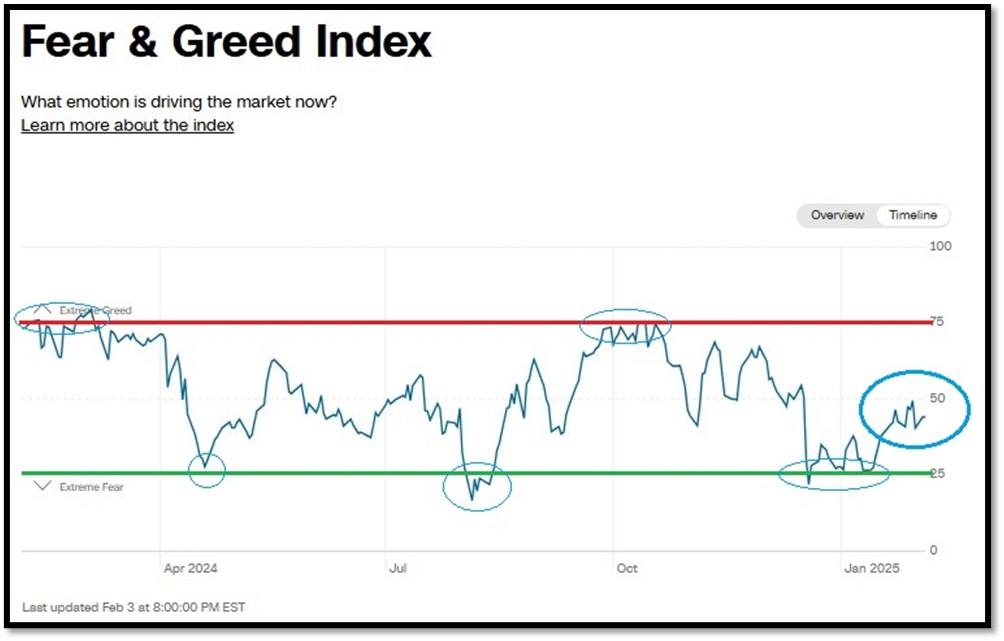
5A. Most recent read on the Fear & Greed Index with data as of 2/3/2025 – 8:00PM-ET is 44 (Fear). Last week’s data was 47 (Neutral) (1-100). CNNMoney’s Fear & Greed index looks at 7 indicators (Stock Price Momentum, Stock Price Strength, Stock Price Breadth, Put and Call Options, Junk Bond Demand, Market Volatility, and Safe Haven Demand). Keep in mind this is a contrarian indicator! REF: Fear&Greed via CNNMoney
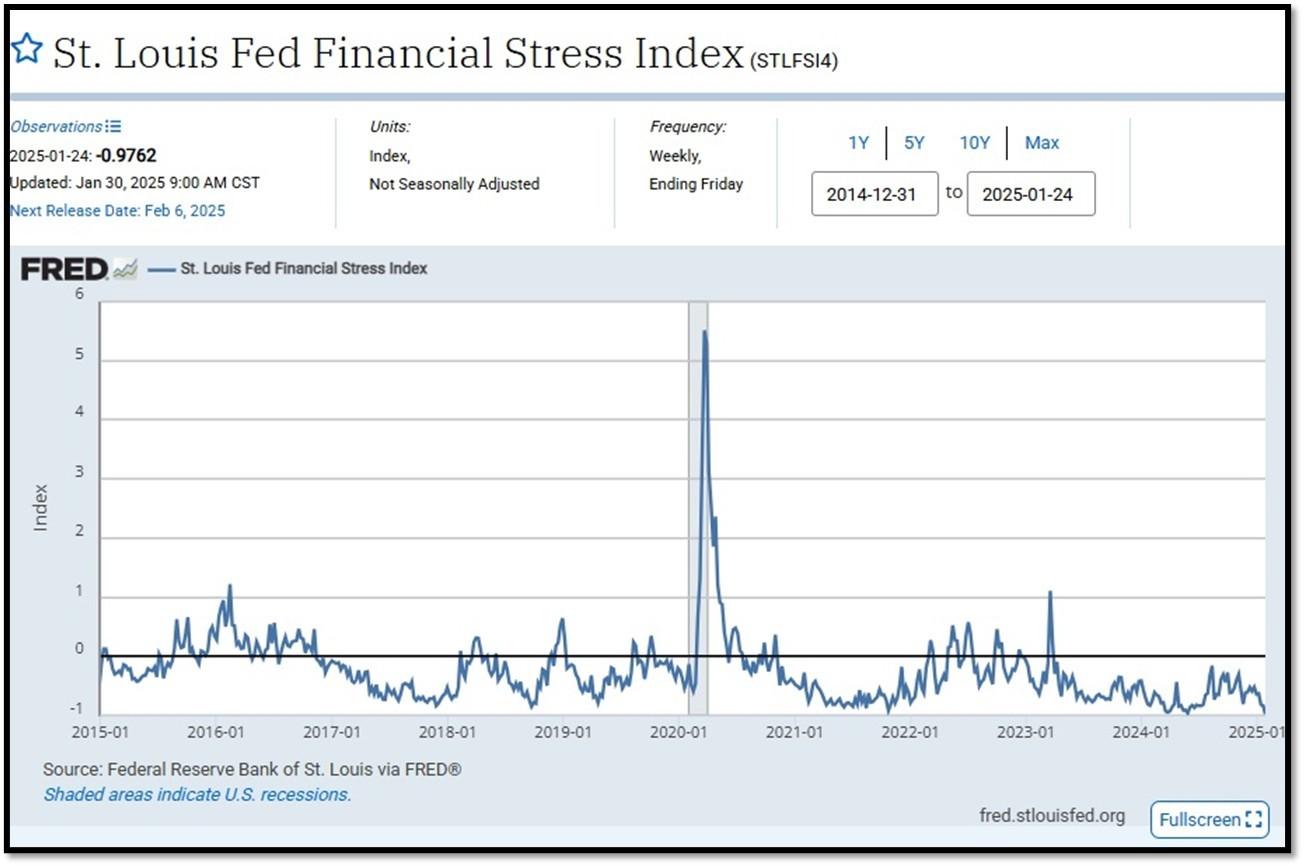
5B. St. Louis Fed Financial Stress Index’s (STLFSI4) most recent read is at –0.9762 as of January 30, 2025. A big spike up from previous readings reflecting the recent turmoil in the banking sector. Previous week’s data was -0.8225. This weekly index is not seasonally adjusted. The STLFSI4 measures the degree of financial stress in the markets and is constructed from 18 weekly data series: seven interest rate series, six yield spreads and five other indicators. Each of these variables captures some aspect of financial stress. Accordingly, as the level of financial stress in the economy changes, the data series are likely to move together. REF: St. Louis Fed
5C. University of Michigan, University of Michigan: Consumer Sentiment for September [UMCSENT] at 74, retrieved from FRED, Federal Reserve Bank of St. Louis, January 24, 2025. Back in June 2022, Consumer Sentiment hit a low point going back to April 1980. REF: UofM
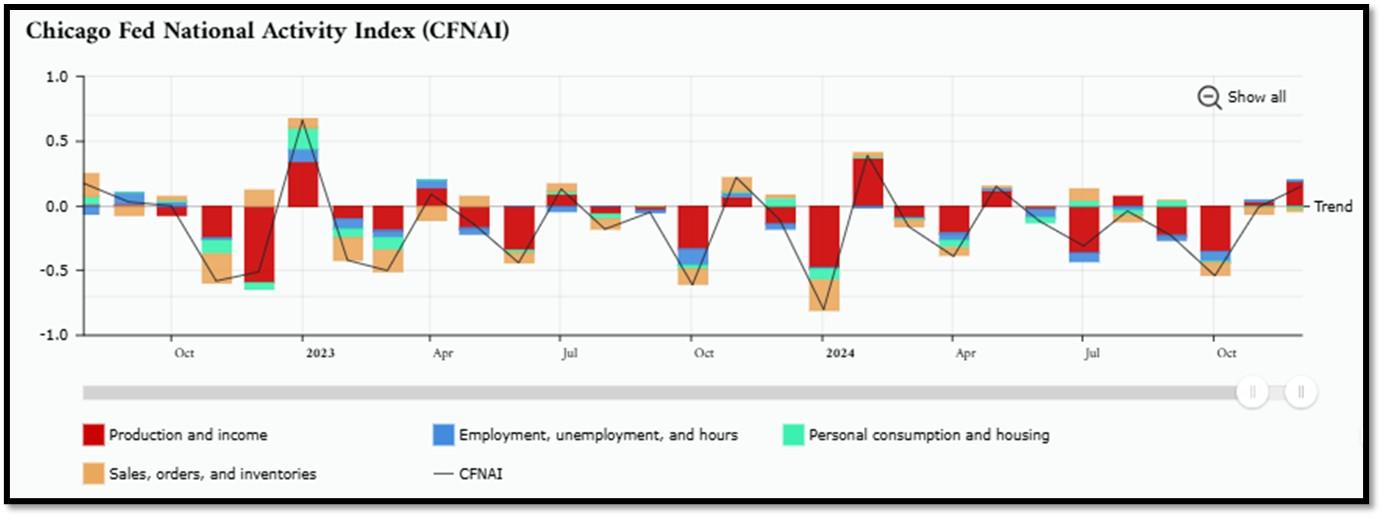
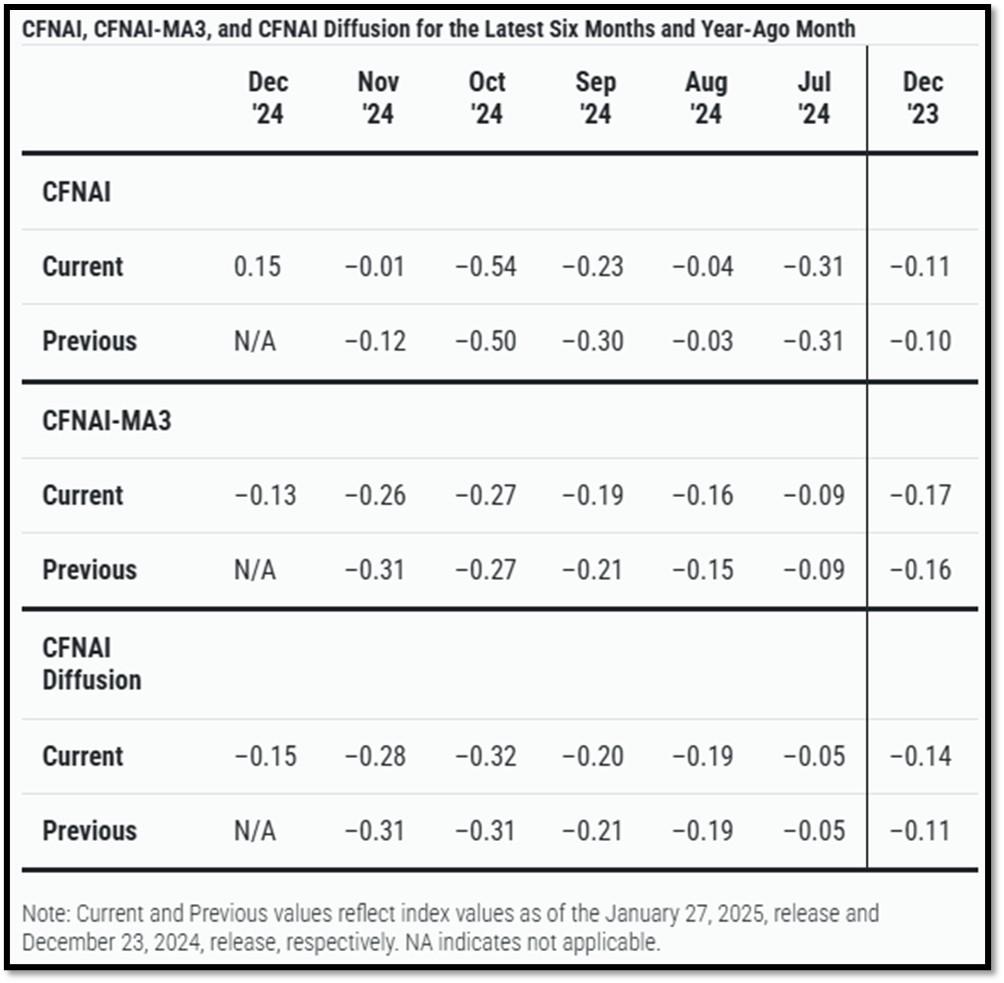
5D. The Chicago Fed National Activity Index (CFNAI) increased to +0.15 in December from –0.01 in November. Two of the four broad categories of indicators used to construct the index increased from November, and two categories made positive contributions in December. The index’s three-month moving average, CFNAI-MA3, increased to –0.13 in December from –0.26 in November. REF: ChicagoFed, December’s Report
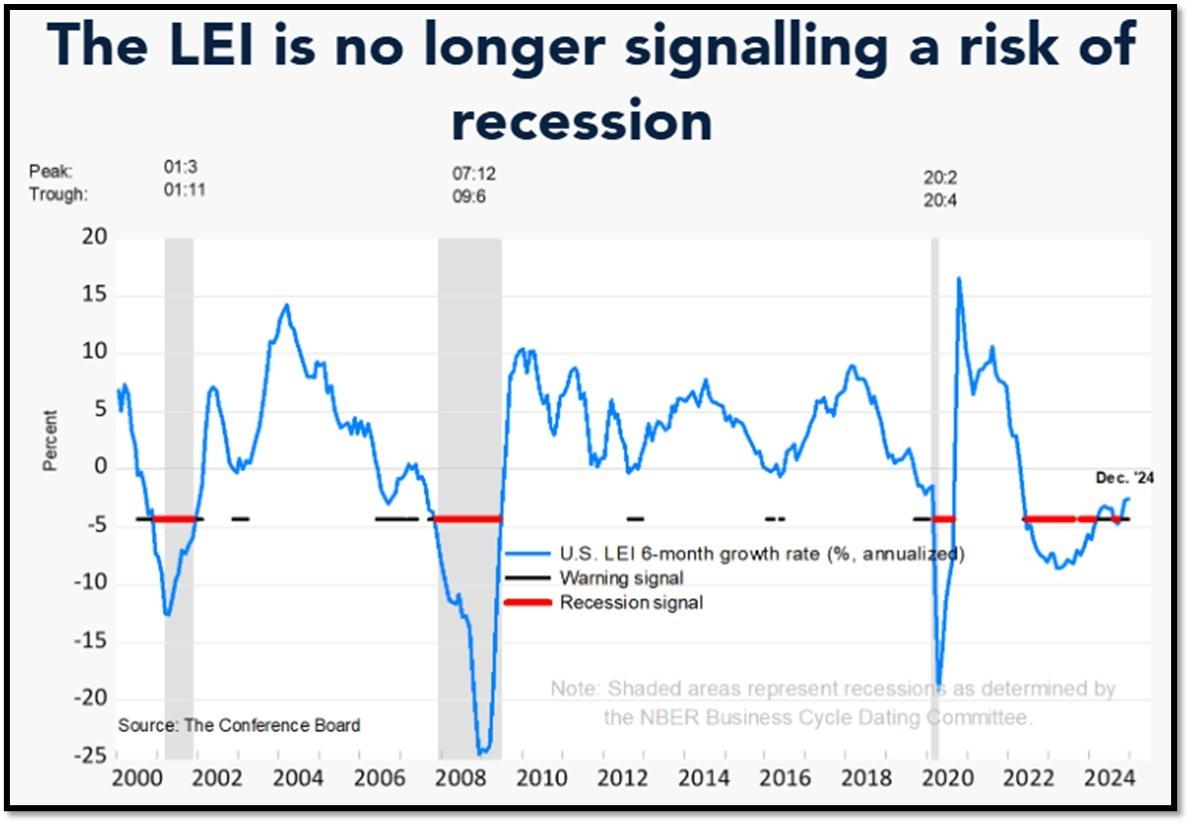
5E. (1/22/2025) The Conference Board Leading Economic Index (LEI) for the US inched down by 0.1% in December 2024 to 101.6 (2016=100), after an upwardly revised increase of 0.4% in November. The LEI declined by 1.3% over the second half of 2024, slightly less than its 1.7% decline over the first half of the last year. The composite economic indexes are the key elements in an analytic system designed to signal peaks and troughs in the business cycle. The indexes are constructed to summarize and reveal common turning points in the economy in a clearer and more convincing manner than any individual component. The CEI is highly correlated with real GDP. The LEI is a predictive variable that anticipates (or “leads”) turning points in the business cycle by around 7 months. Shaded areas denote recession periods or economic contractions. The dates above the shaded areas show the chronology of peaks and troughs in the business cycle. The ten components of The Conference Board Leading Economic Index® for the U.S. include: Average weekly hours in manufacturing; Average weekly initial claims for unemployment insurance; Manufacturers’ new orders for consumer goods and materials; ISM® Index of New Orders; Manufacturers’ new orders for nondefense capital goods excluding aircraft orders; Building permits for new private housing units; S&P 500® Index of Stock Prices; Leading Credit Index™; Interest rate spread (10-year Treasury bonds less federal funds rate); Average consumer expectations for business conditions. REF: ConferenceBoard, LEI Report for December (Released on 2/1/2025)

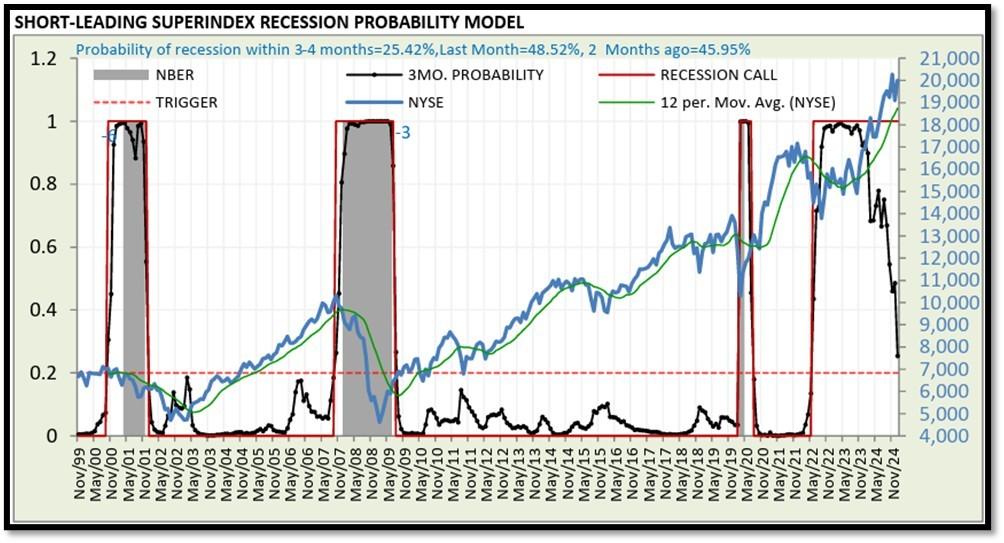
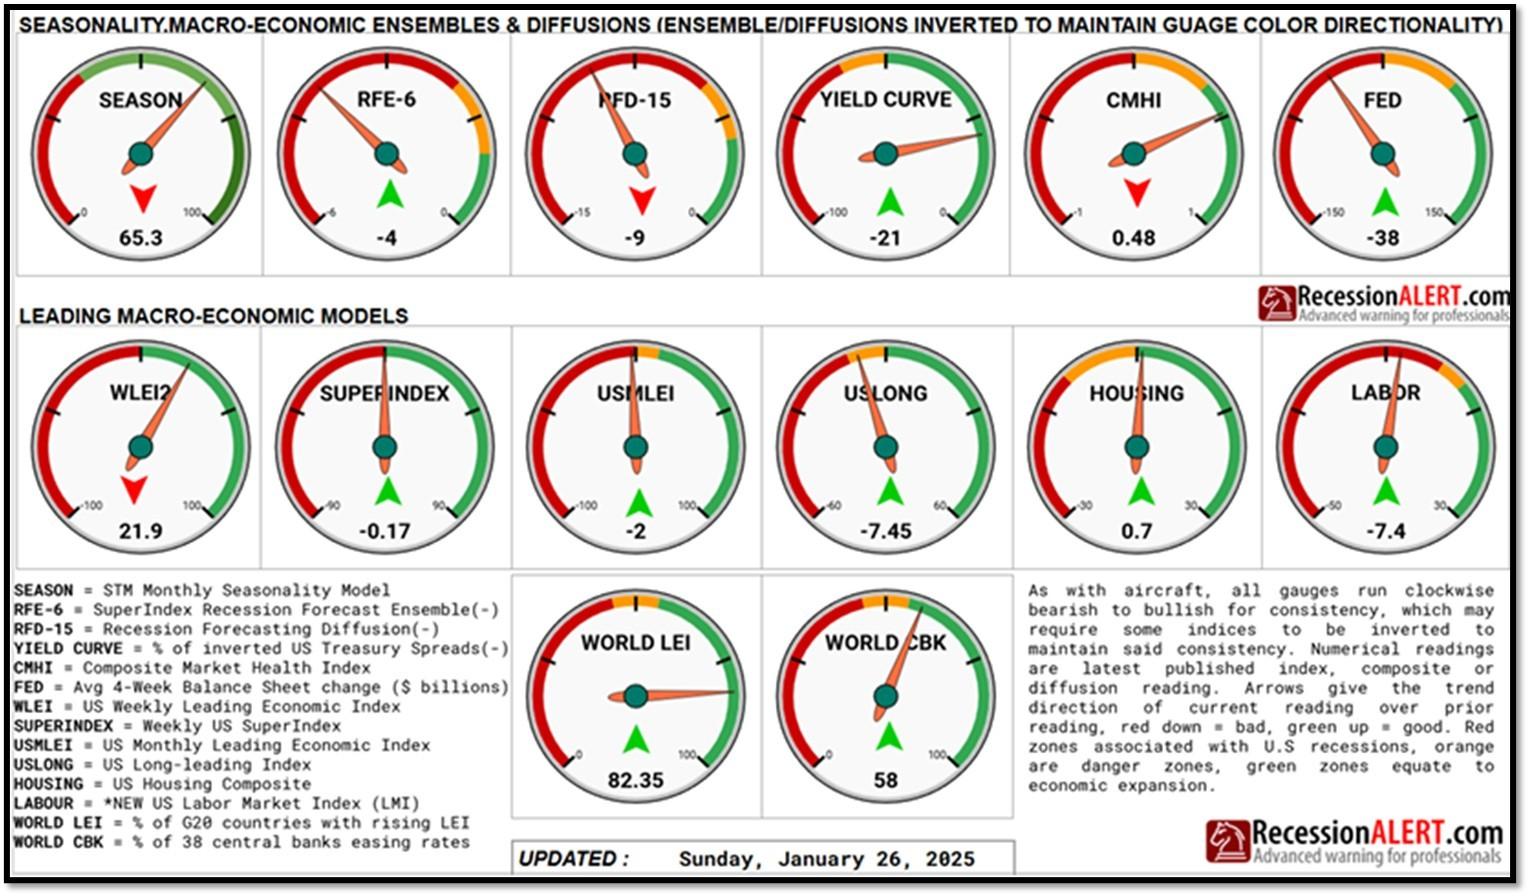
5F. Probability of U.S. falling into Recession within 3 to 4 months is currently at 25.42% (with data as of 01/26/2025 – Next Report 02/10/2025) according to RecessionAlert Research. Last release’s data was at 58.9%. This report is updated every two weeks. REF: RecessionAlertResearch
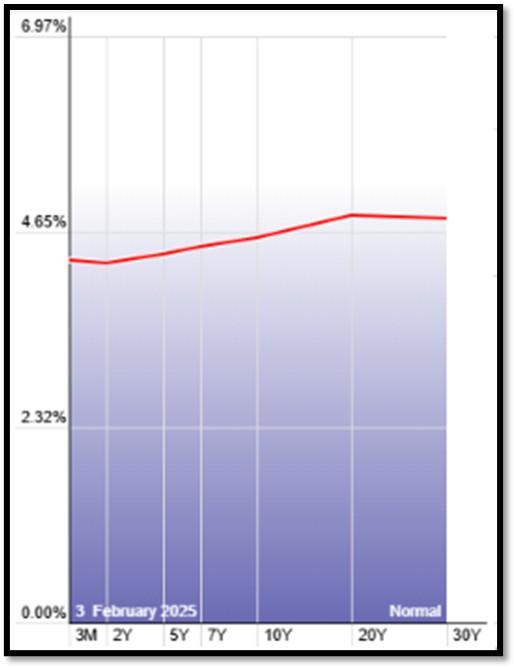
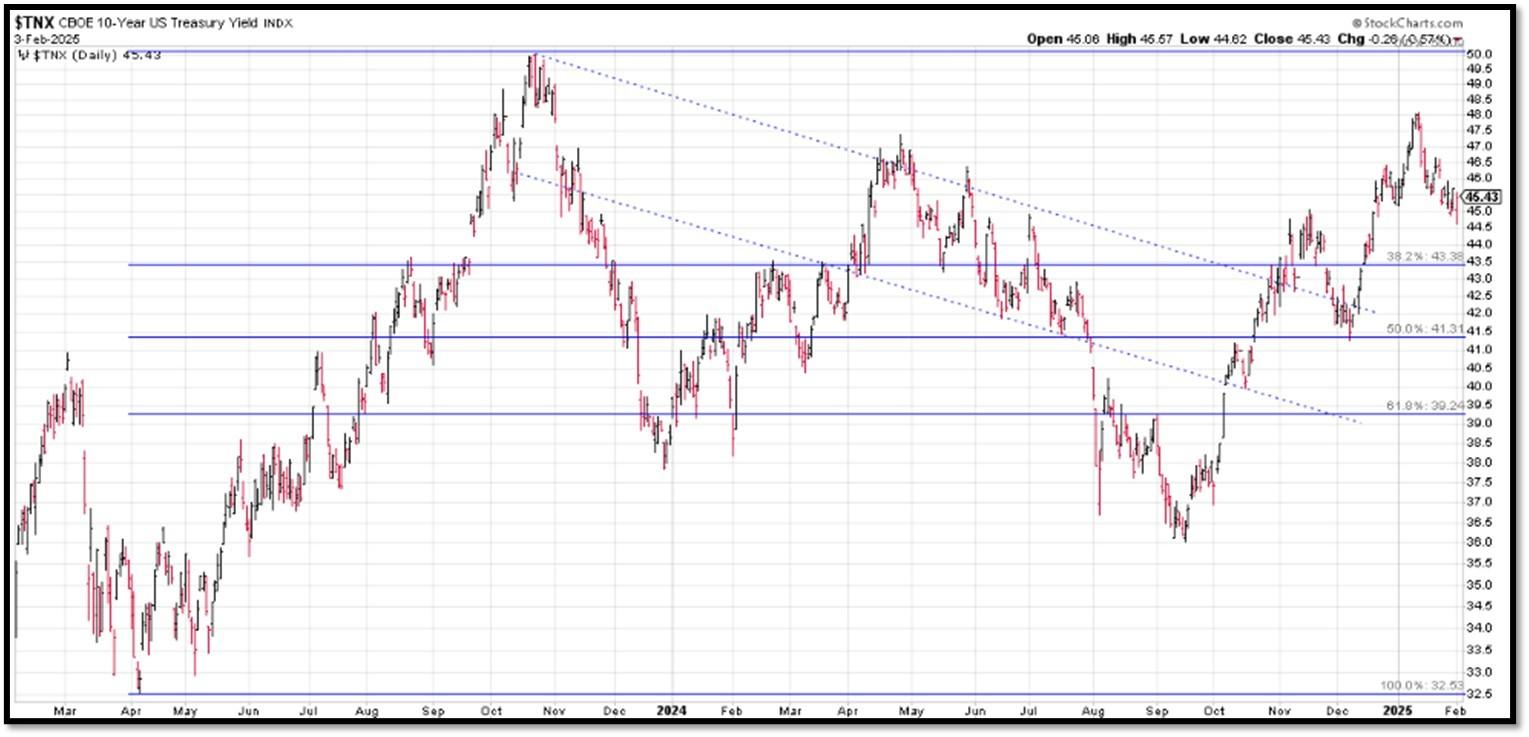
5G. Yield Curve as of 2/3/2025 is showing Normal. Spread on the 10-yr Treasury Yield (4.57%) minus yield on the 2-yr Treasury Yield (4.27%) is currently at 30 bps. REF: Stockcharts The yield curve—specifically, the spread between the interest rates on the ten-year Treasury note and the three-month Treasury bill—is a valuable forecasting tool. It is simple to use and significantly outperforms other financial and macroeconomic indicators in predicting recessions two to six quarters ahead. REF: NYFED
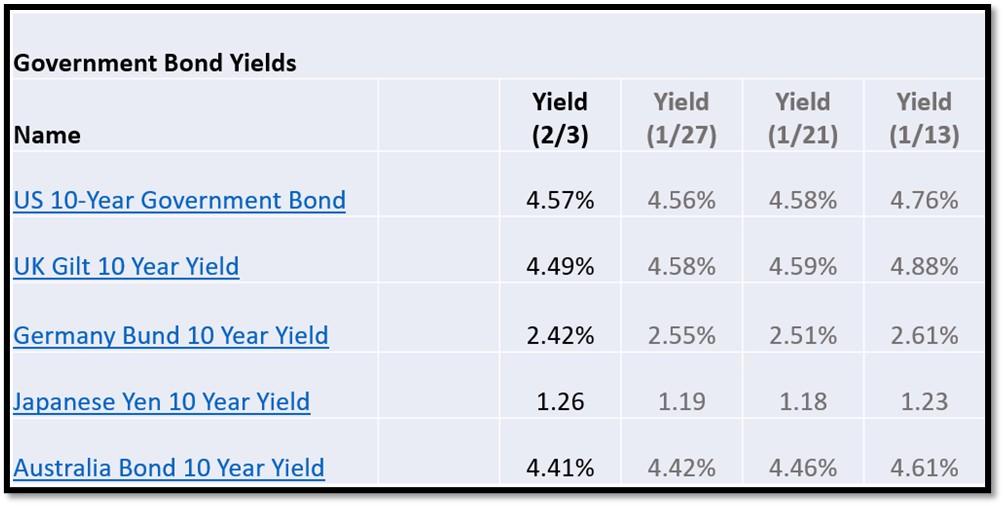
5H. Recent Yields in 10-Year Government Bonds. REF: Source is from Bloomberg.com, dated 2/3/2025, rates shown below are as of 2/3/2025, subject to change.
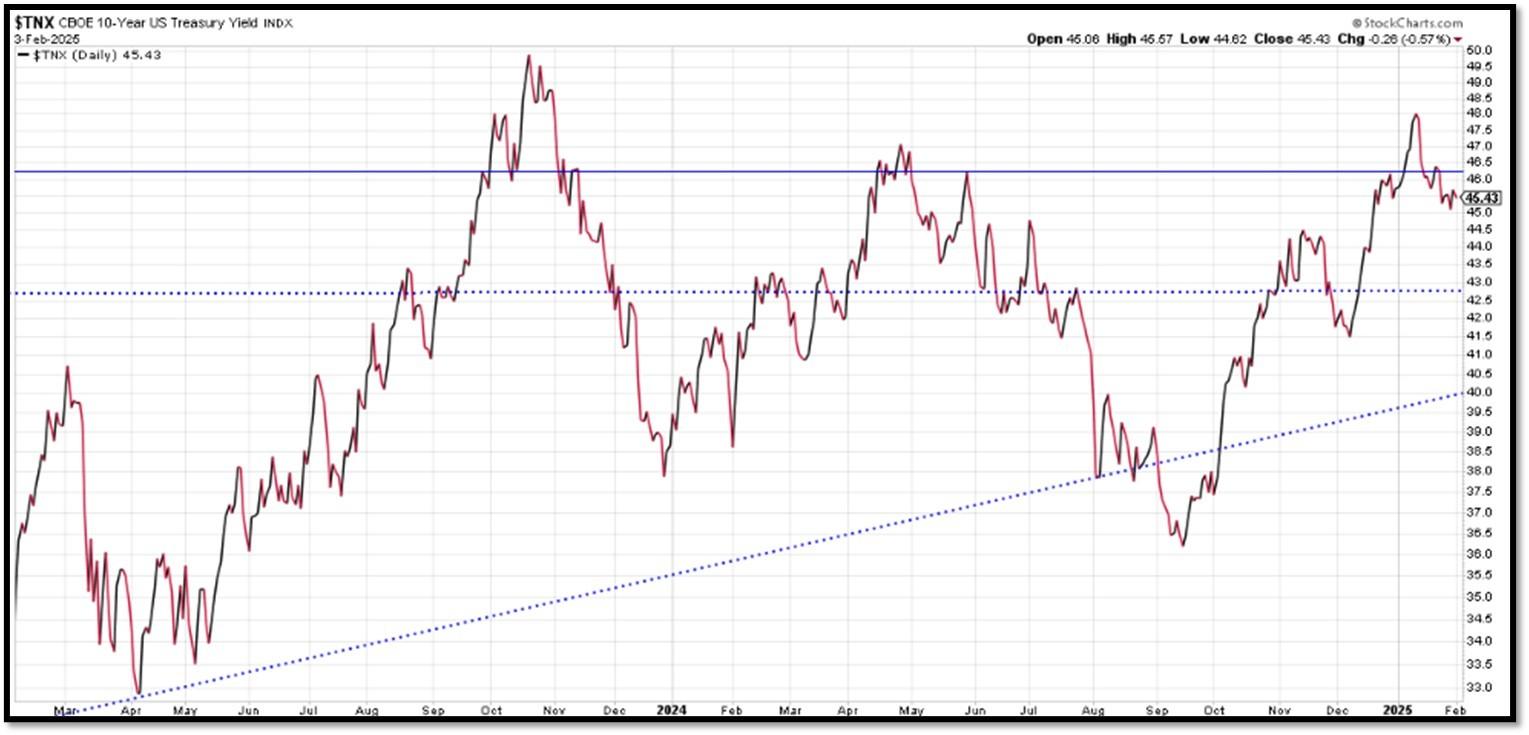
The 10-Year US Treasury Yield… REF: StockCharts1, StockCharts2
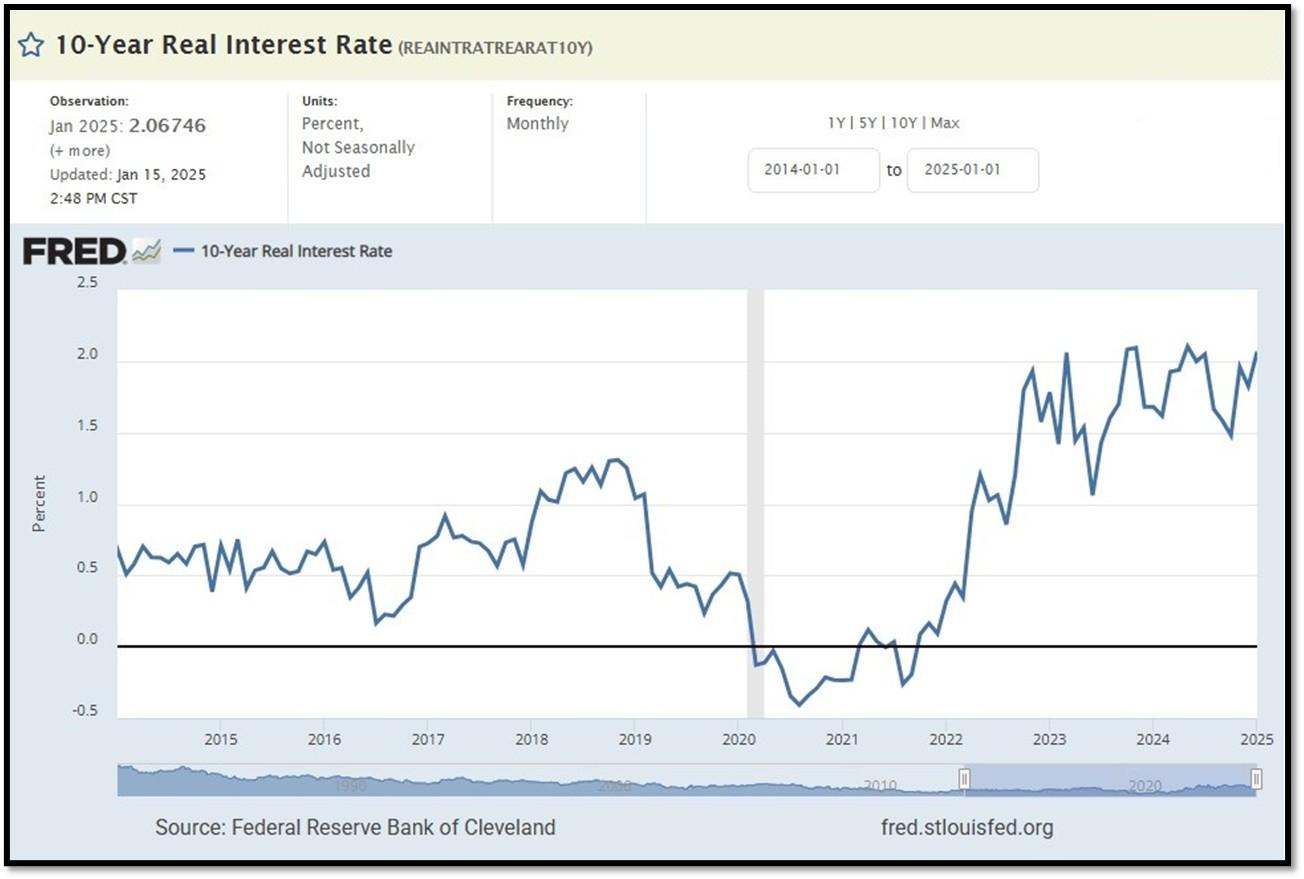
10-Year Real Interest Rate at 2.0674% as of 1/15/25. REF: REAINTRATREARAT10Y
Federal government Interest Payments increased $8B+ to $1.124 Trillion as of Q4-2024. REF: FRED-A091RC1Q027SBEA
Interest payments as a percentage of GDP increased from 2.37794 in 2023 to 3.02152 as of 1/30/25. REF: FRED-FYOIGDA188S
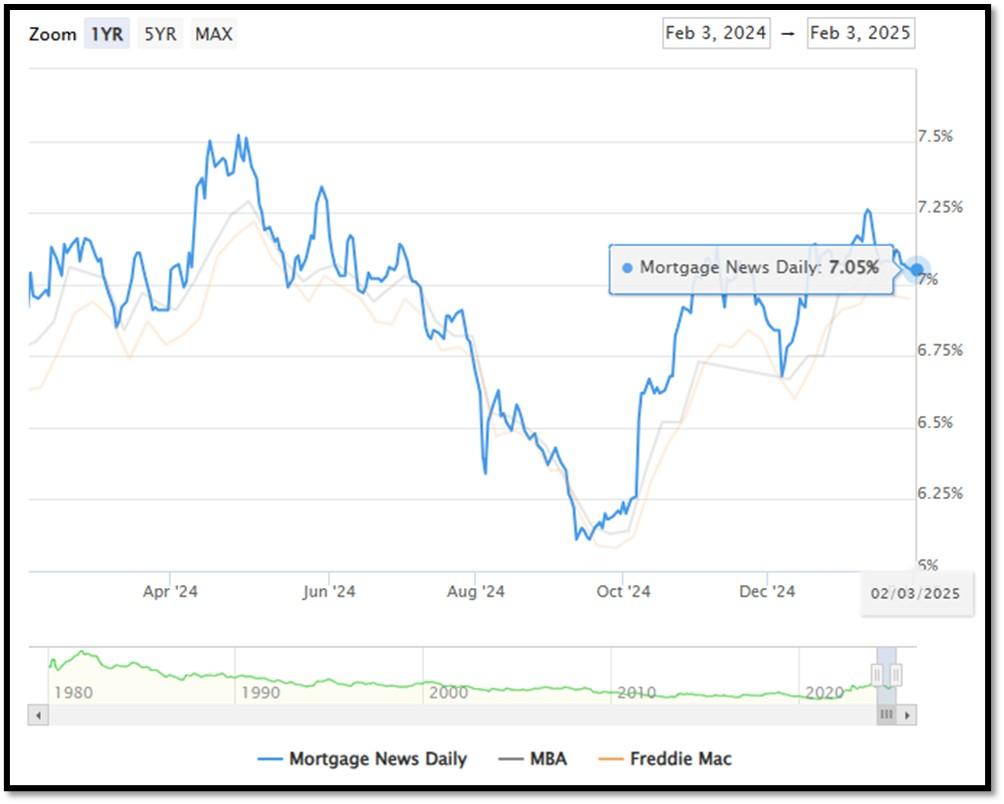
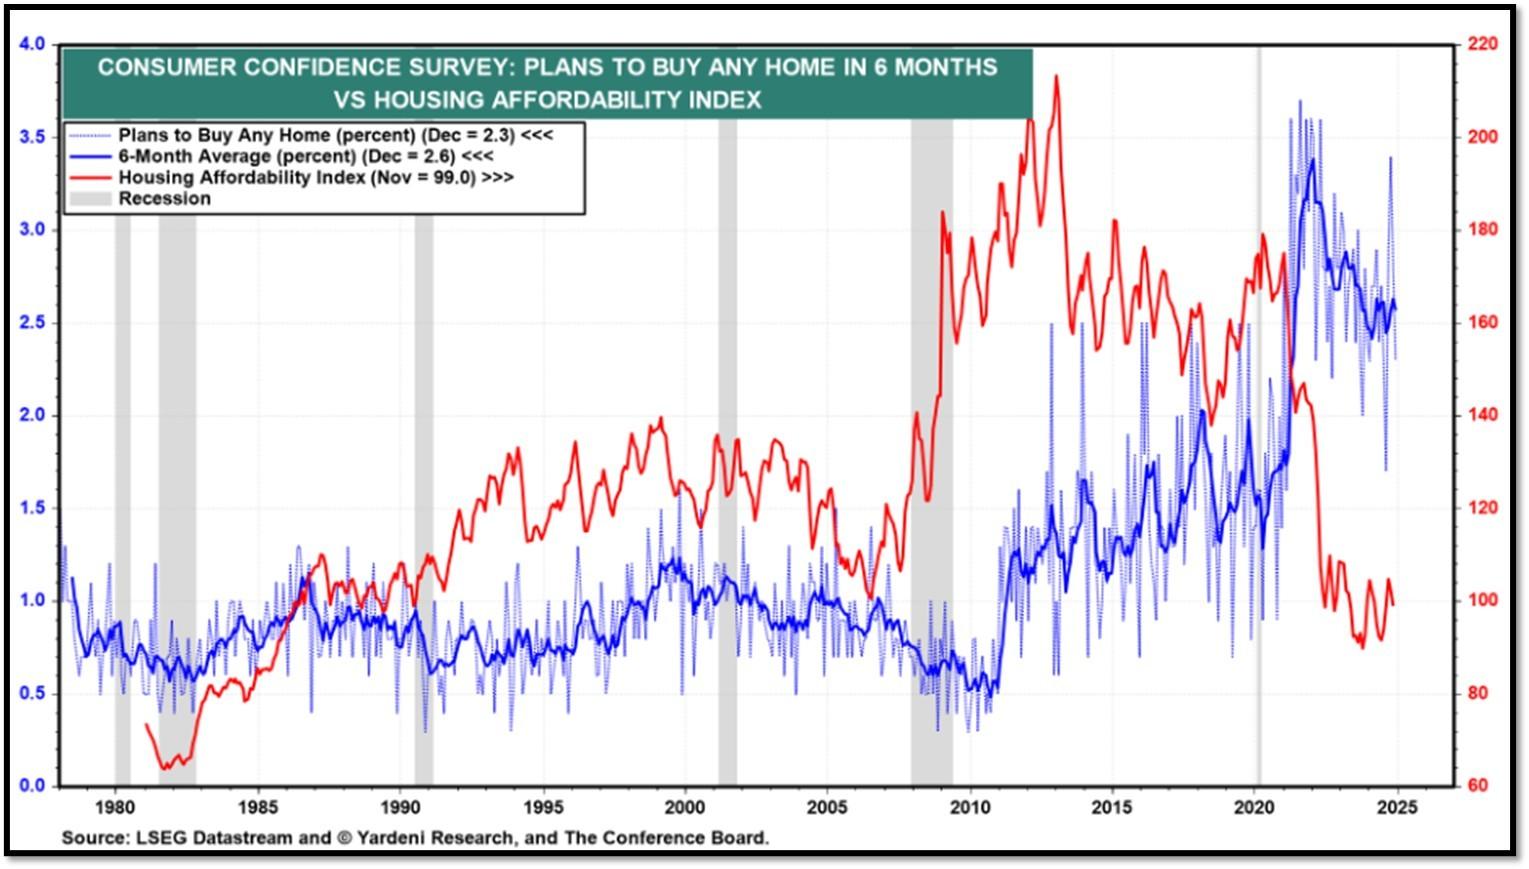
5I. (2/3/2025) Today’s National Average 30-Year Fixed Mortgage Rate is 7.05% (All Time High was 8.03% on 10/19/23). Last week’s data was 7.07%. This rate is the average 30-year fixed mortgage rates from several different surveys including Mortgage News Daily (daily index), Freddie Mac (weekly survey), Mortgage Bankers Association (weekly survey) and FHFA (monthly survey). REF: MortgageNewsDaily, Today’s Average Rate
The recent spike in the 30-year fixed-rate jumbo mortgage to 7.05%, compared to Freddie Mac’s rate at 6.95% and the Mortgage Bankers Association (MBA) rate at 7.02%, highlights key differences in the mortgage market. Jumbo mortgages, which exceed the conforming loan limits set by government agencies like Freddie Mac, typically carry higher interest rates because they are riskier for lenders. These loans are not backed by government entities, which increases the risk for lenders and, consequently, leads to higher rates. In contrast, Freddie Mac and MBA provide averages for conforming loans, which meet federal guidelines and have lower risk due to government backing, keeping their rates lower.
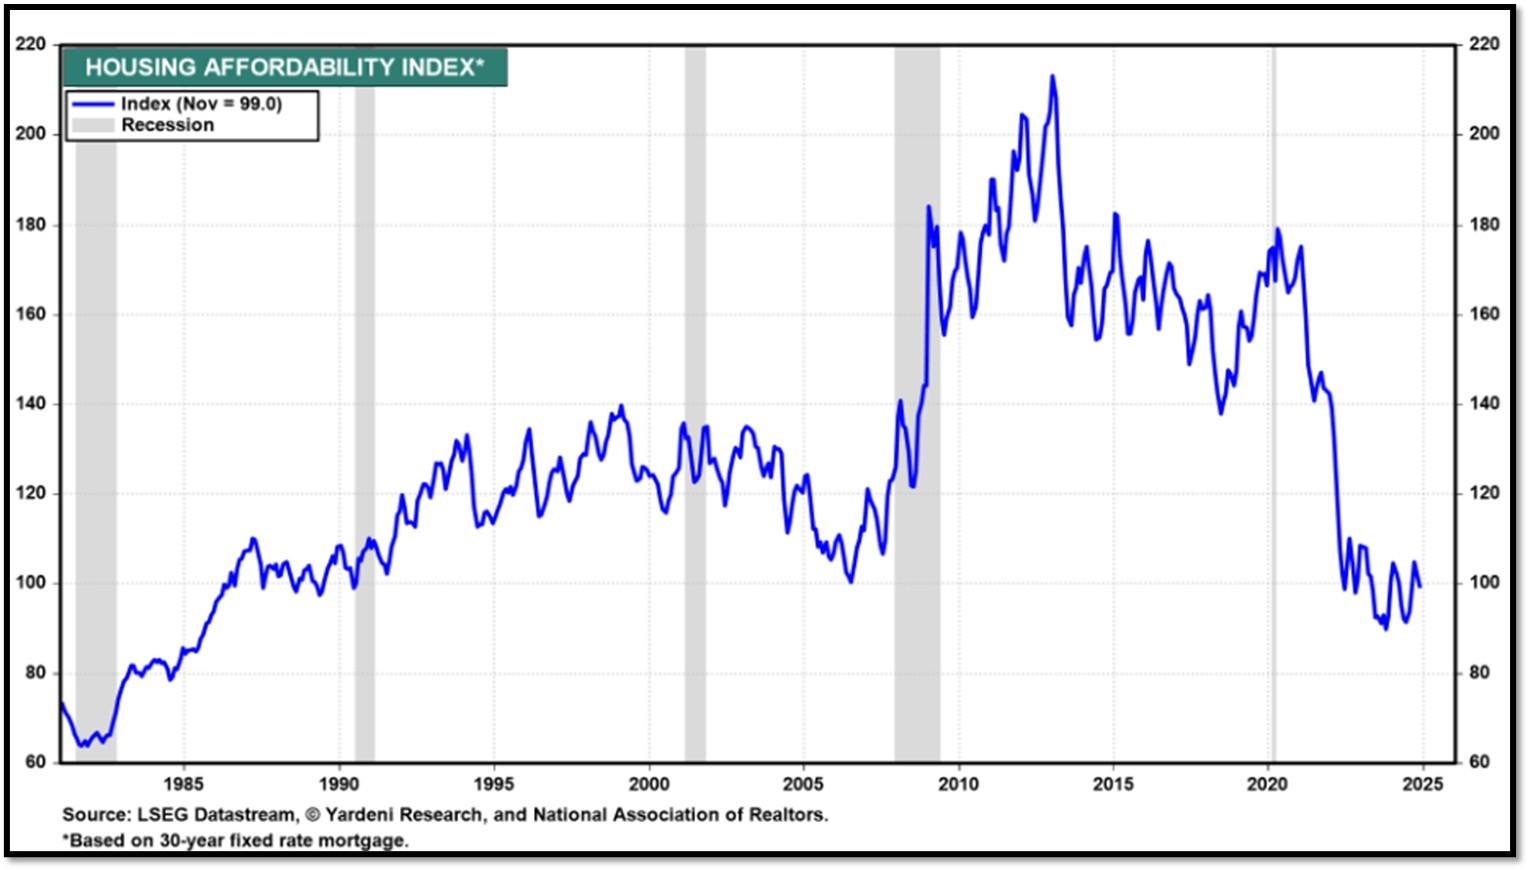
(1/13/25) Housing Affordability Index for Nov = 99 // Oct = 102.3 // Sep = 105.5 // Aug = 98.6 // July = 95 // June = 93.3 // May = 93.1 // April = 95.9 // March = 101.1 // February = 103.0. Data provided by Yardeni Research. REF: Yardeni
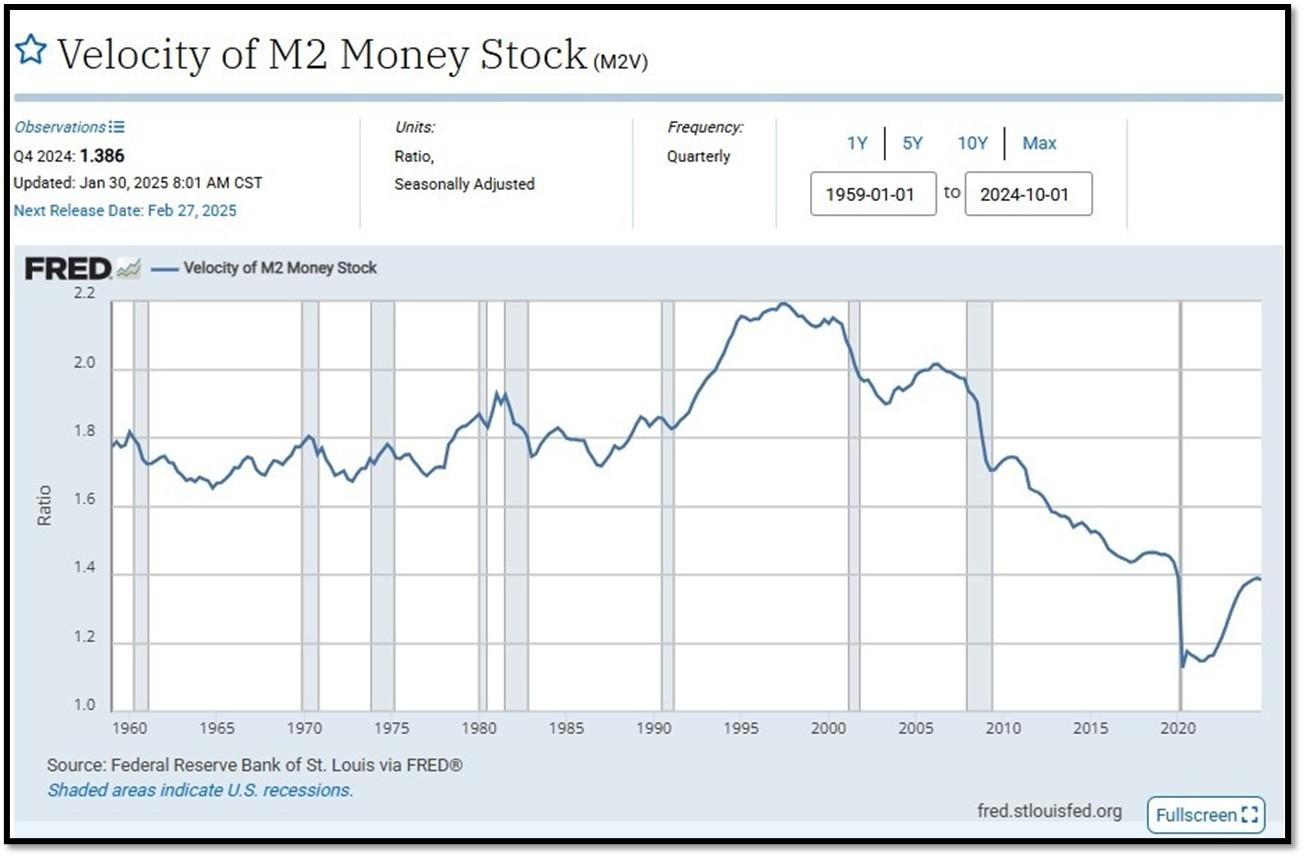
5J. Velocity of M2 Money Stock (M2V) with current read at 1.386 as of (Q4-2024 updated 1/30/2025). Previous quarter’s data was 1.390. The velocity of money is the frequency at which one unit of currency is used to purchase domestically- produced goods and services within a given time period. In other words, it is the number of times one dollar is spent to buy goods and services per unit of time. If the velocity of money is increasing, then more transactions are occurring between individuals in an economy. Current Money Stock (M2) report can be viewed in the reference link. REF: St.LouisFed-M2V
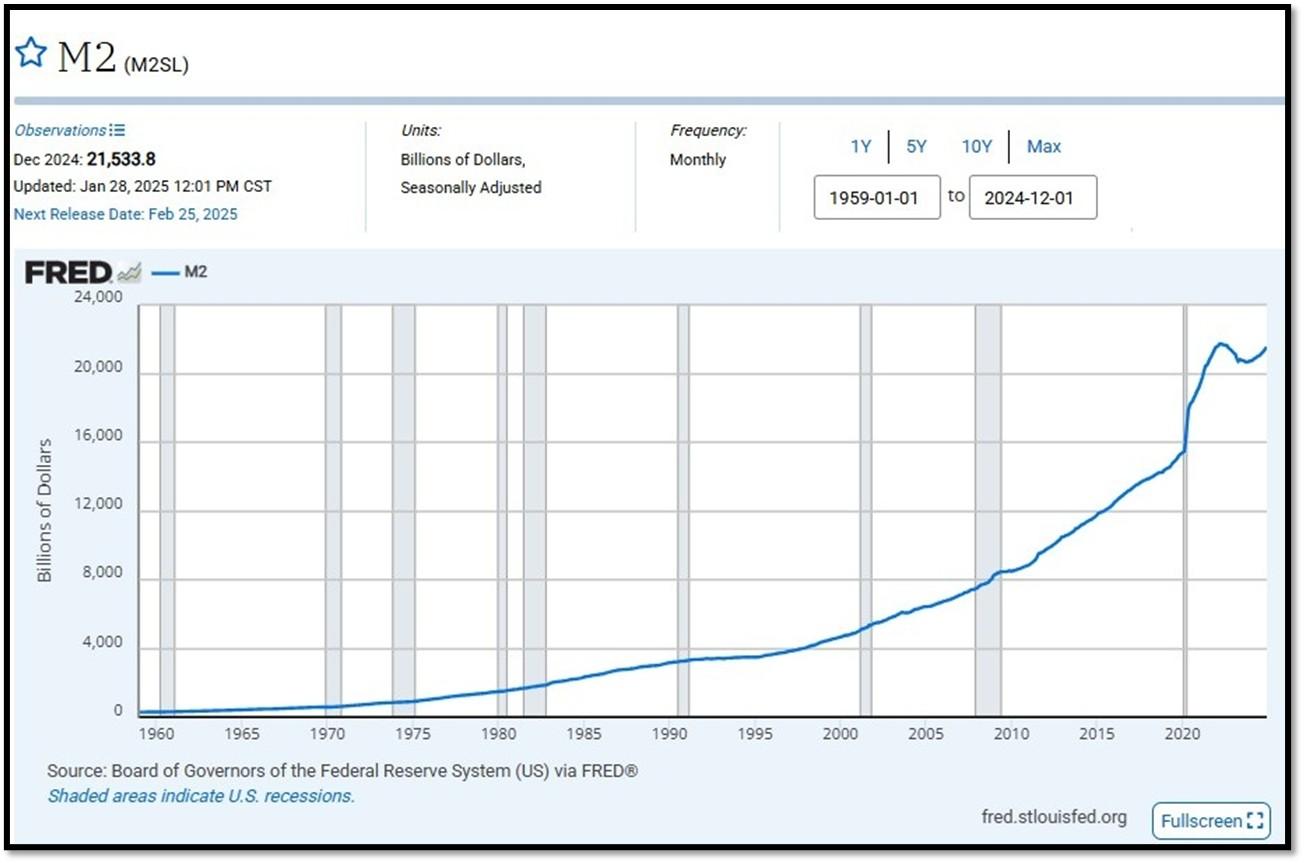
M2 consists of M1 plus (1) small-denomination time deposits (time deposits in amounts of less than $100,000) less IRA and Keogh balances at depository institutions; and (2) balances in retail MMFs less IRA and Keogh balances at MMFs. Seasonally adjusted M2 is constructed by summing savings deposits (before May 2020), small-denomination time deposits, and retail MMFs, each seasonally adjusted separately, and adding this result to seasonally adjusted M1. Board of Governors of the Federal Reserve System (US), M2 [M2SL], retrieved from FRED, Federal Reserve Bank of St. Louis; Updated on January 28, 2025. REF: St.LouisFed-M2
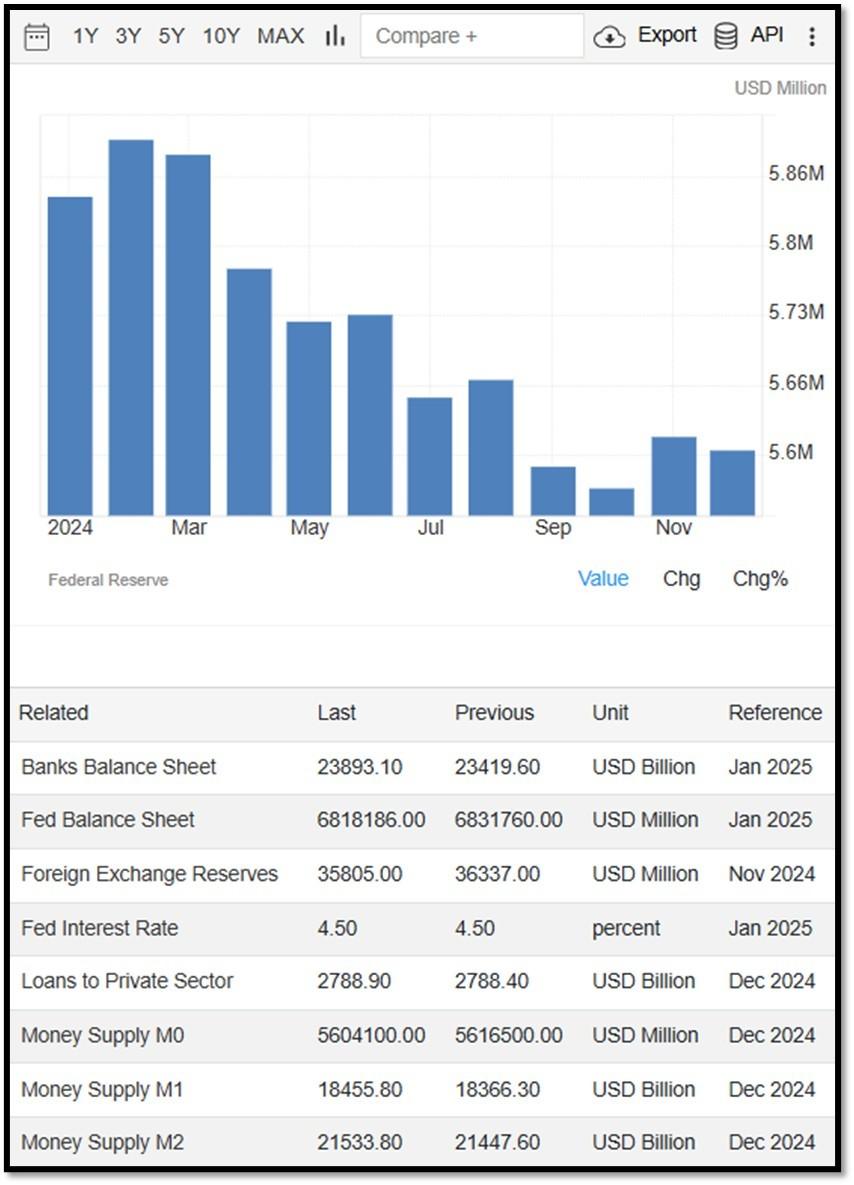
Money Supply M0 in the United States decreased to 5604100 USD Million in December from 5616500 USD Million in November of 2024. Money Supply M0 in the United States averaged 1166283.21 USD Million from 1959 until 2024, reaching an all-time high of 6413100.00 USD Million in December of 2021 and a record low of 48400.00 USD Million in February of 1961. REF: TradingEconomics, M0
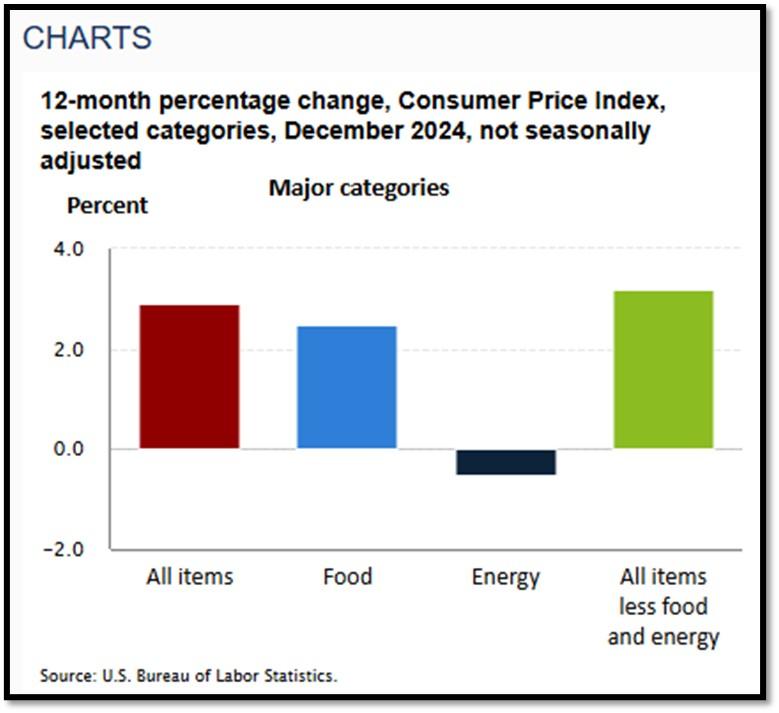
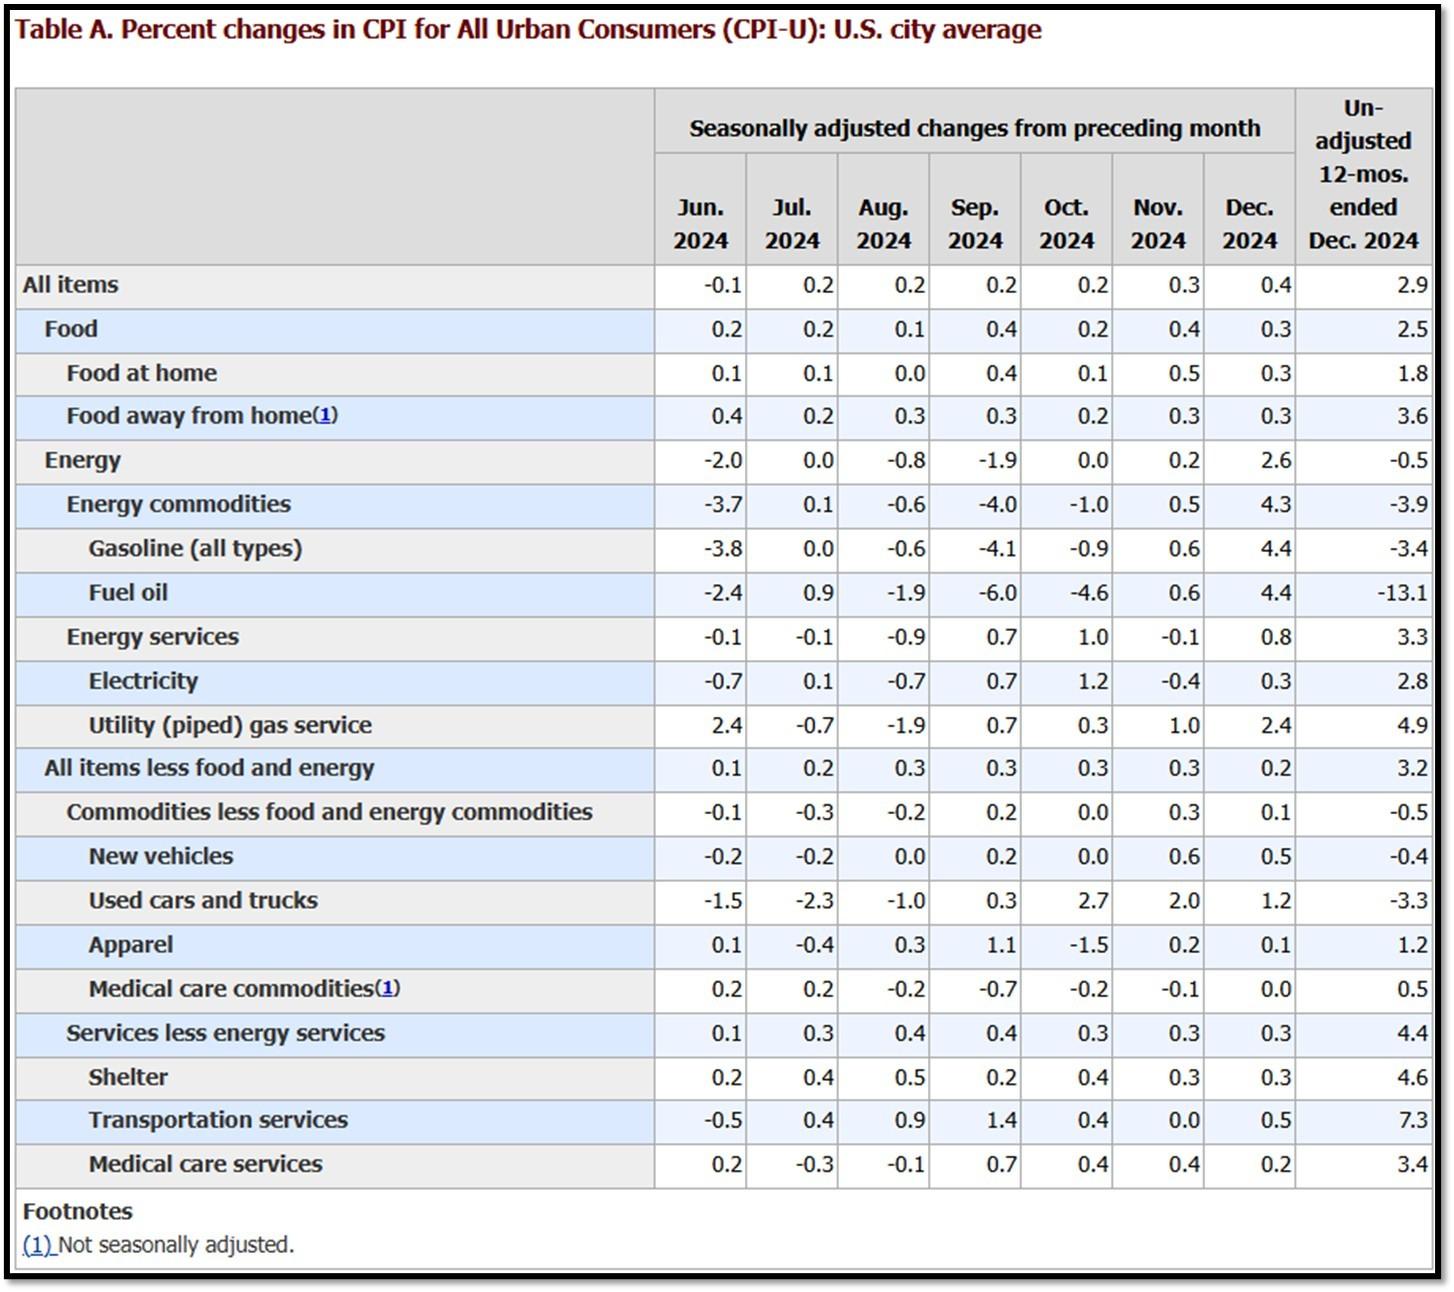
5K. In December, the Consumer Price Index for All Urban Consumers rose 0.4 percent, seasonally adjusted, and rose 2.9 percent over the last 12 months, not seasonally adjusted. The index for all items less food and energy increased 0.2 percent in December (SA); up 3.2 percent over the year (NSA). January 2025 CPI data are scheduled to be released on February 12, 2025, at 8:30AM-ET. REF: BLS, BLS.GOV
5L. Technical Analysis of the S&P500 Index. Click onto reference links below for images.
- Short-term Chart: EMA Line Rising on 2/3/2025 – REF: Short-term S&P500 Chart by Marc Slavin (Click Here to Access Chart)
- Medium-term Chart: Bullish on 2/3/2025 – REF: Medium-term S&P500 Chart by Marc Slavin (Click Here to Access Chart)
- Market Timing Indicators – S&P500 Index as of 2/3/2025 – REF: S&P500 Charts (7 of them) by Joanne Klein’s Top 7 (Click Here to Access Updated Charts)
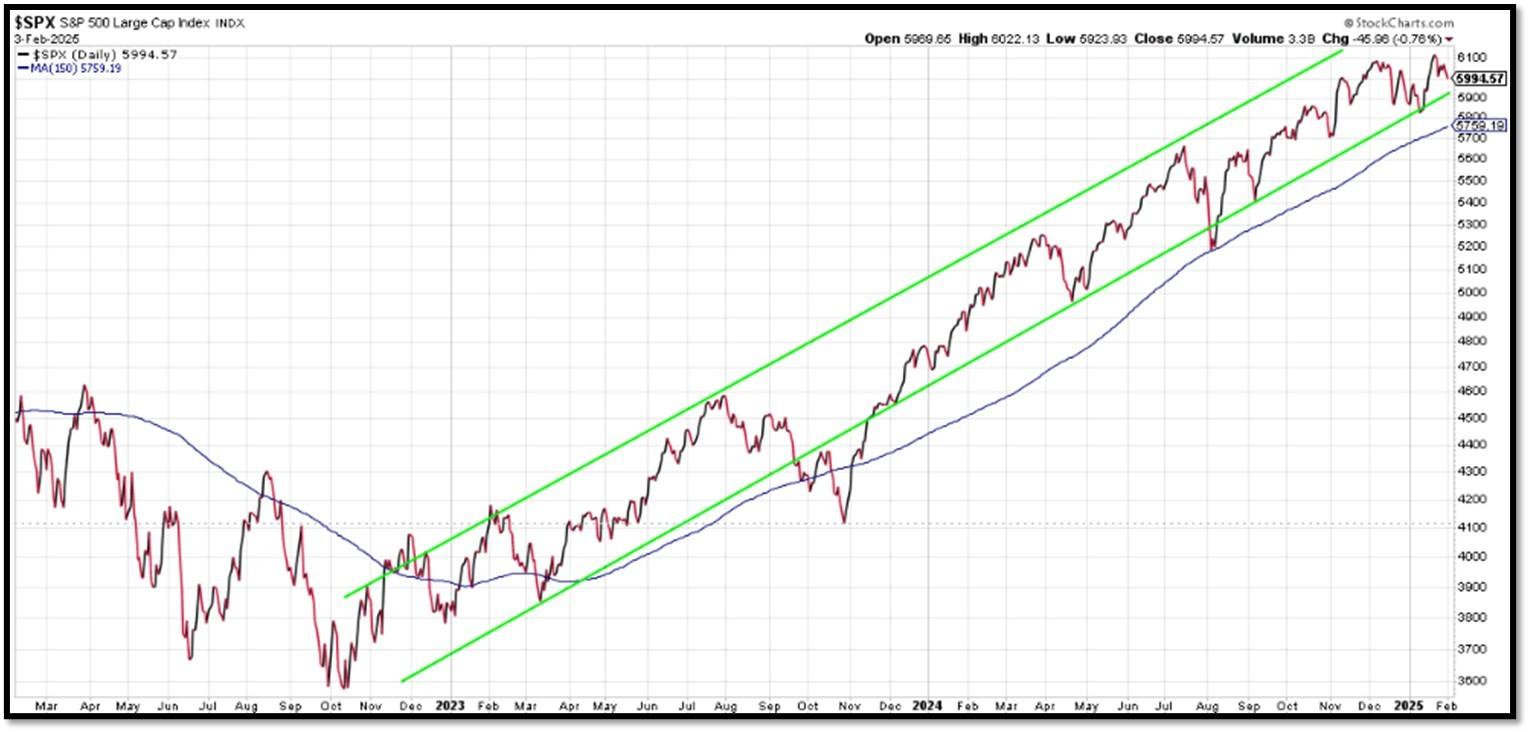
- A well-defined uptrend channel shown in green with S&P500 still on up trend. REF: Stockcharts
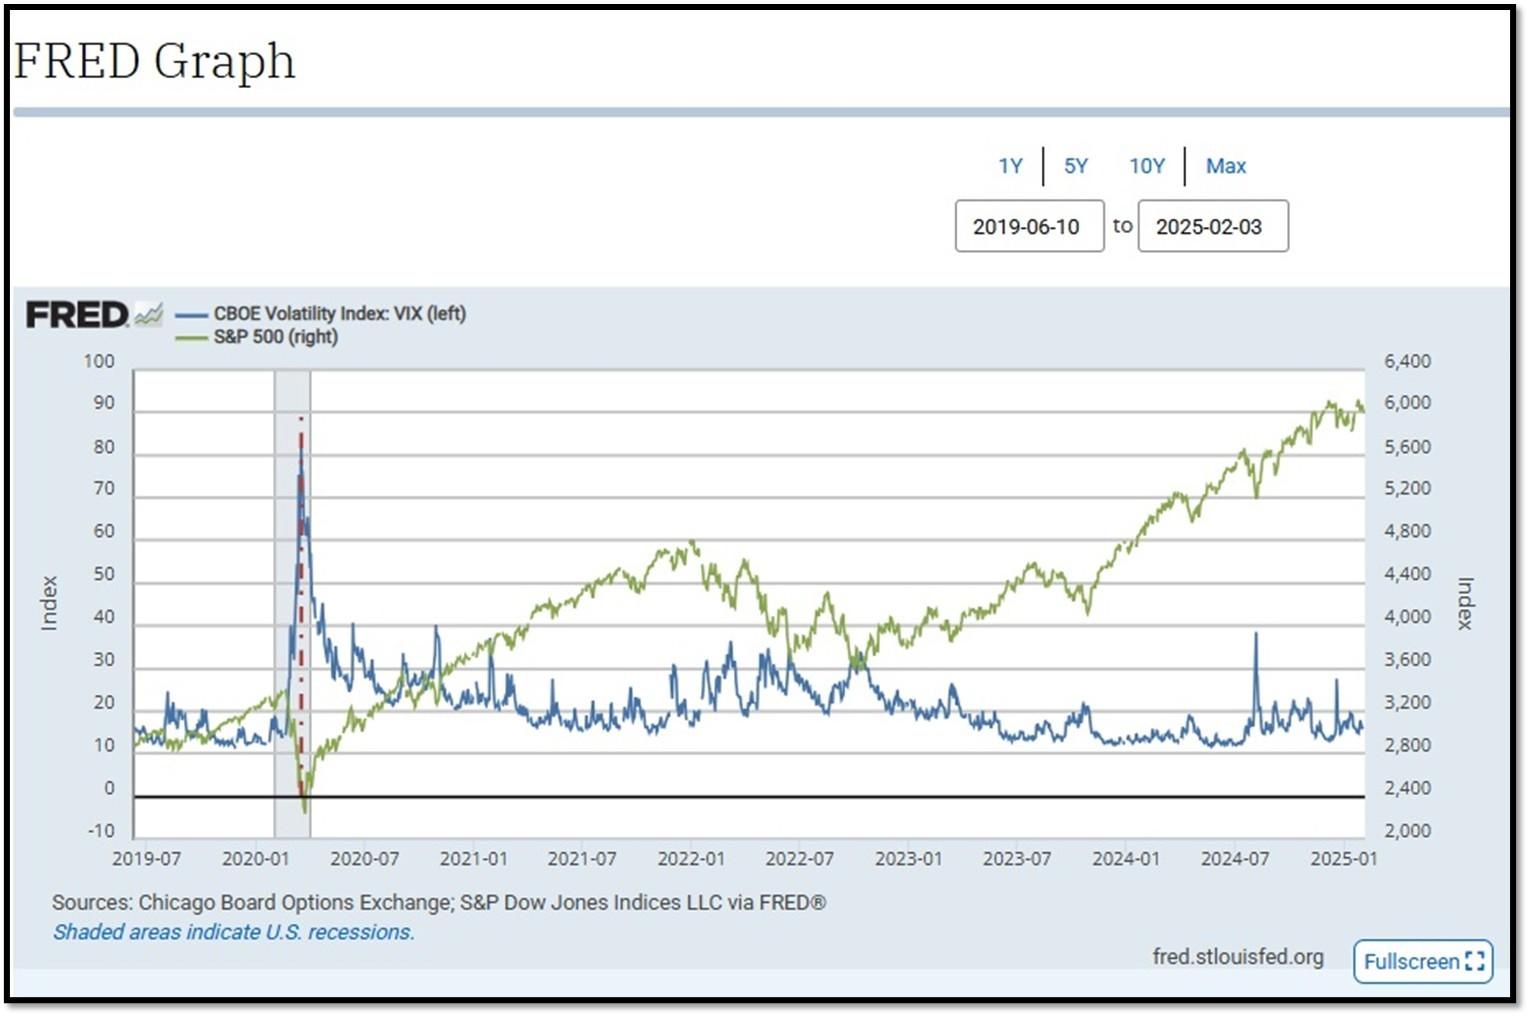
- S&P500 and CBOE Volatility Index (VIX) as of 2/3/2025. REF: FRED, Today’s Print
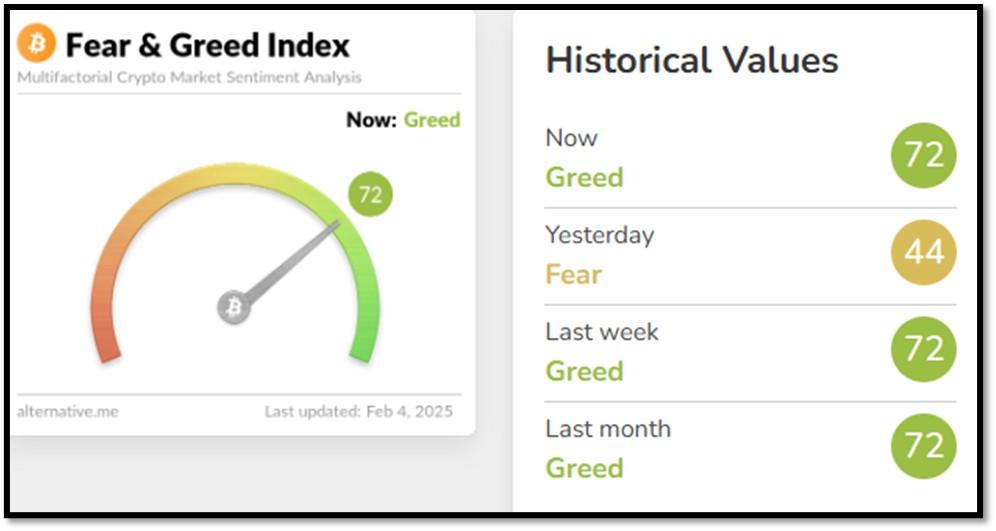
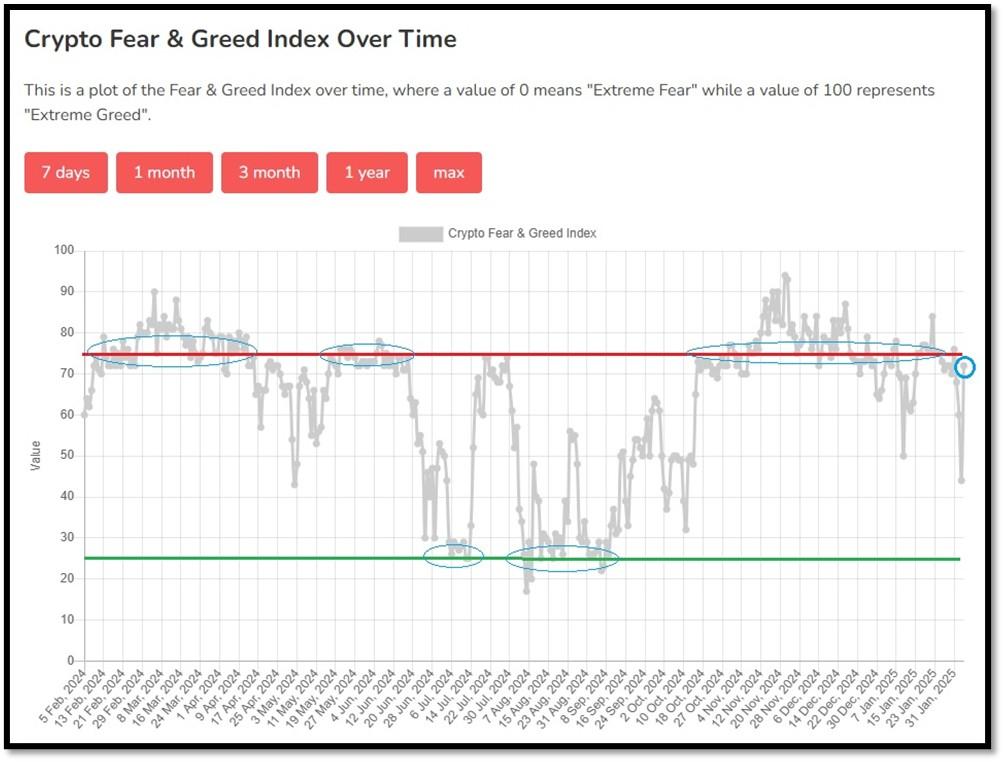
5M. Most recent read on the Crypto Fear & Greed Index with data as of 2/4/2025au is 72 (Greed). Last week’s data was 72 (Greed) (1-100). Fear & Greed Index – A Contrarian Data. The crypto market behavior is very emotional. People tend to get greedy when the market is rising which results in FOMO (Fear of missing out). Also, people often sell their coins in irrational reaction of seeing red numbers. With the Crypto Fear and Greed Index, the data try to help save investors from their own emotional overreactions. There are two simple assumptions:
- Extreme fear can be a sign that investors are too worried. That could be a buying opportunity.
- When Investors are getting too greedy, that means the market is due for a correction.
Therefore, the program for this index analyzes the current sentiment of the Bitcoin market and crunch the numbers into a simple meter from 0 to 100. Zero means “Extreme Fear”, while 100 means “Extreme Greed”. REF: Alternative.me, Today’sReading
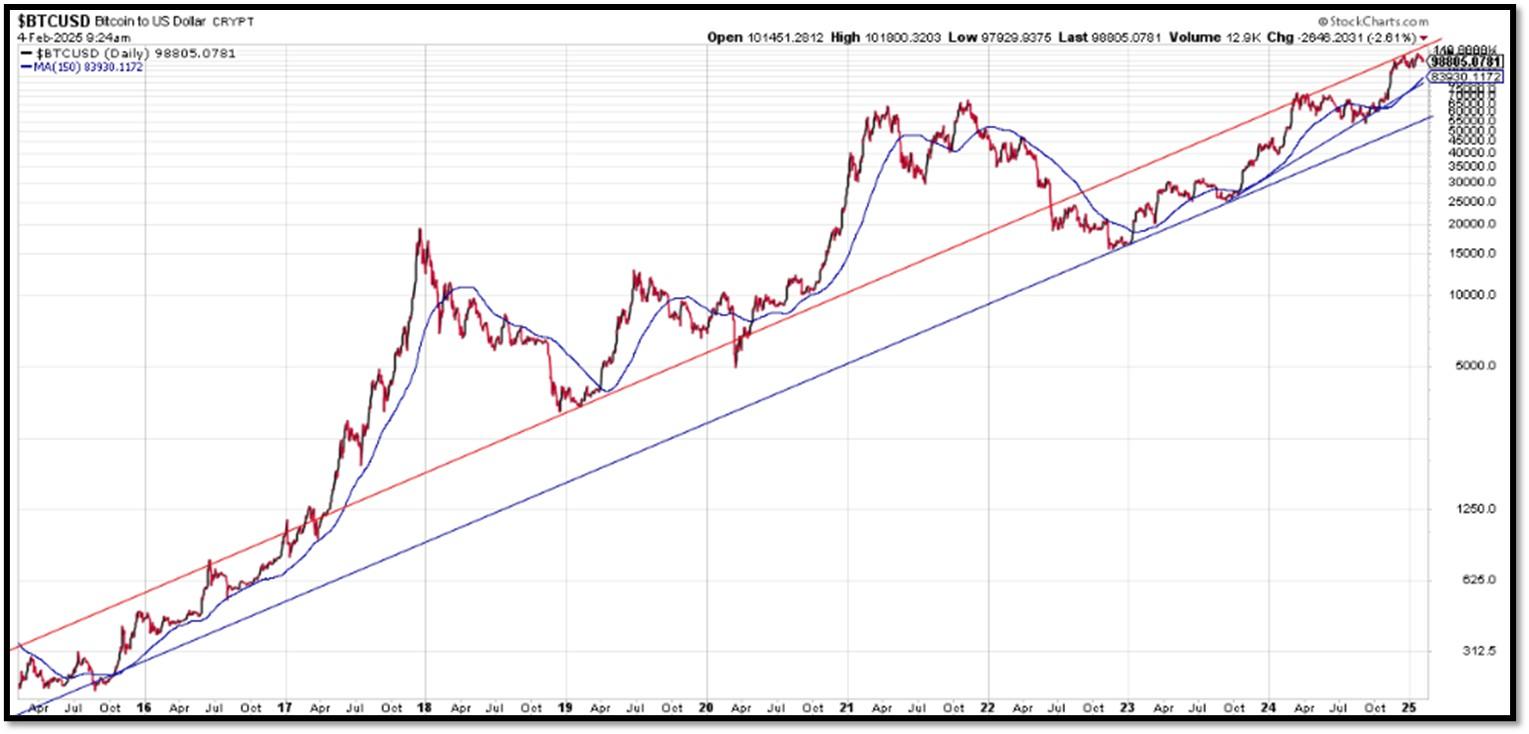
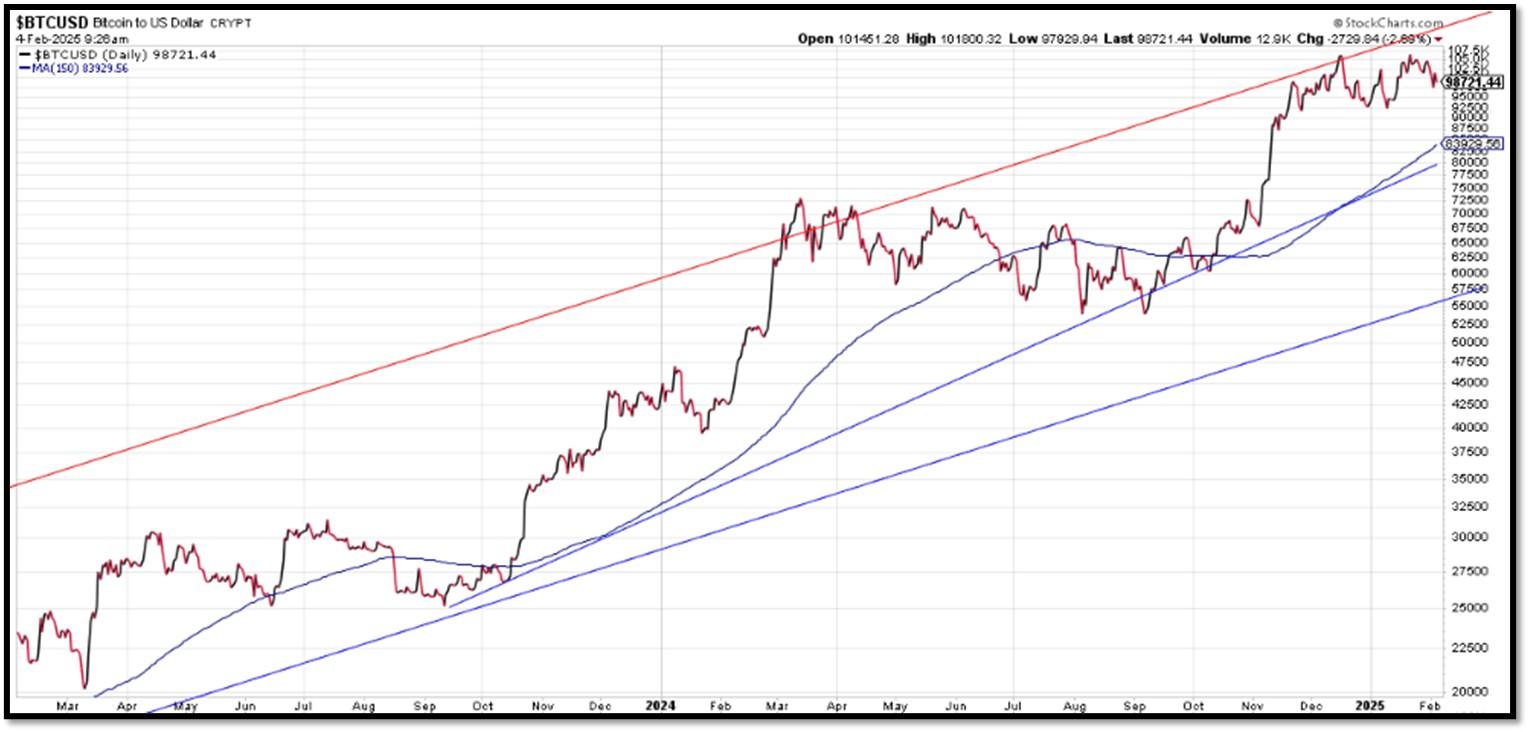
Bitcoin – 10-Year & 2-Year Charts. REF: Stockcharts10Y, Stockcharts2Y
From the desk of our Chief Investment Officer
As an investment professional with over twenty-six years of experience in the financial services industry, Andrew helps clients to protect, grow and transfer wealth during their lifetime with objective, unbiased, customized and efficient strategies.
Education, Professional Licenses Acquired & Affiliations
- Series 7, 63, 65 and 24 Licensed.
- Currently holding Series 65 License registered with SEC
- BA in Economics – Boston University (Boston, MA) 1993
- Certificate in Commodities Trading – New York University (New York, NY) 1991
- Certificate in Financial Planning – New York University (New York, NY) April 2011
With extensive experience in the Financial Services Industry, Andrew Tang and Turner Financial Group provides disciplined wealth management with an intelligent caring approach to each and every client that compliments the Dedicated Financial offering.


Len writes much of his own content, and also shares helpful content from other trusted providers like Turner Financial Group (TFG).
The material contained herein is intended as a general market commentary, solely for informational purposes and is not intended to make an offer or solicitation for the sale or purchase of any securities. Such views are subject to change at any time without notice due to changes in market or economic conditions and may not necessarily come to pass. This information is not intended as a specific offer of investment services by Dedicated Financial and Turner Financial Group, Inc.
Dedicated Financial and Turner Financial Group, Inc., do not provide tax, legal or accounting advice. You should consult your own tax, legal and accounting advisors before engaging in any transaction.
Any hyperlinks in this document that connect to Web Sites maintained by third parties are provided for convenience only. Turner Financial Group, Inc. has not verified the accuracy of any information contained within the links and the provision of such links does not constitute a recommendation or endorsement of the company or the content by Dedicated Financial or Turner Financial Group, Inc. The prices/quotes/statistics referenced herein have been obtained from sources verified to be reliable for their accuracy or completeness and may be subject to change.
Past performance is no guarantee of future returns. Investing involves risk and possible loss of principal capital. The views and strategies described herein may not be suitable for all investors. To the extent referenced herein, real estate, hedge funds, and other private investments can present significant risks, including loss of the original amount invested. All indexes are unmanaged, and an individual cannot invest directly in an index. Index returns do not include fees or expenses.
Turner Financial Group, Inc. is an Investment Adviser registered with the United States Securities and Exchange Commission however, such registration does not imply a certain level of skill or training and no inference to the contrary should be made. Additional information about Turner Financial Group, Inc. is also available at www.adviserinfo.sec.gov. Advisory services are only offered to clients or prospective clients where Turner Financial Group, Inc. and its representatives are properly licensed or exempt from licensure. No advice may be rendered by Turner Financial Group, Inc. unless a client service agreement is in place.


