

- 1. This week’s economic data reveals a mixed outlook for the U.S. economy, with notable developments in the housing market and labor sector, alongside rising inflation concerns impacting financial markets.
- 2. Grok 3: xAI’s Breakthrough in AI – Elon Musk’s xAI has unveiled Grok 3, a major leap in AI technology, positioning it as a strong competitor against OpenAI’s GPT-4o and DeepSeek V3.
- 3. Investing directly in private companies like xAI and SpaceX is typically reserved for institutional and high-net-worth investors due to high minimums and complex processes.
- **With the current macro-economic backdrop, below are areas we currently favor:
- 4. World Watch
- 5. Quant & Technical Corner
1. This week’s economic data reveals a mixed outlook for the U.S. economy, with notable developments in the housing market and labor sector, alongside rising inflation concerns impacting financial markets.
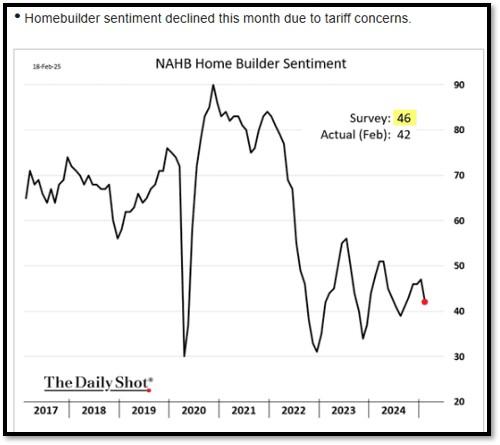
Housing Market Indicators – In January 2025, housing starts declined by 9.8% to a seasonally adjusted annual rate of 1.366 million units, down from December’s 1.515 million units. This downturn is attributed to severe winter weather affecting construction activities, particularly in the Northeast, Midwest, and South. Conversely, building permits—a leading indicator of future construction—edged up by 0.1% to 1.483 million, suggesting potential resilience in upcoming housing projects.
Labor Market Dynamics – The labor market remains relatively stable, with initial jobless claims rising modestly by 5,000 to 219,000 for the week ending February 15, slightly above expectations. Continuing claims also saw a marginal increase to 1.869 million. These figures indicate a steady employment landscape, though recent federal employee layoffs could influence future data.
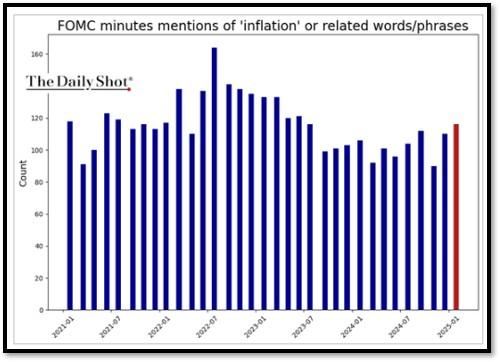
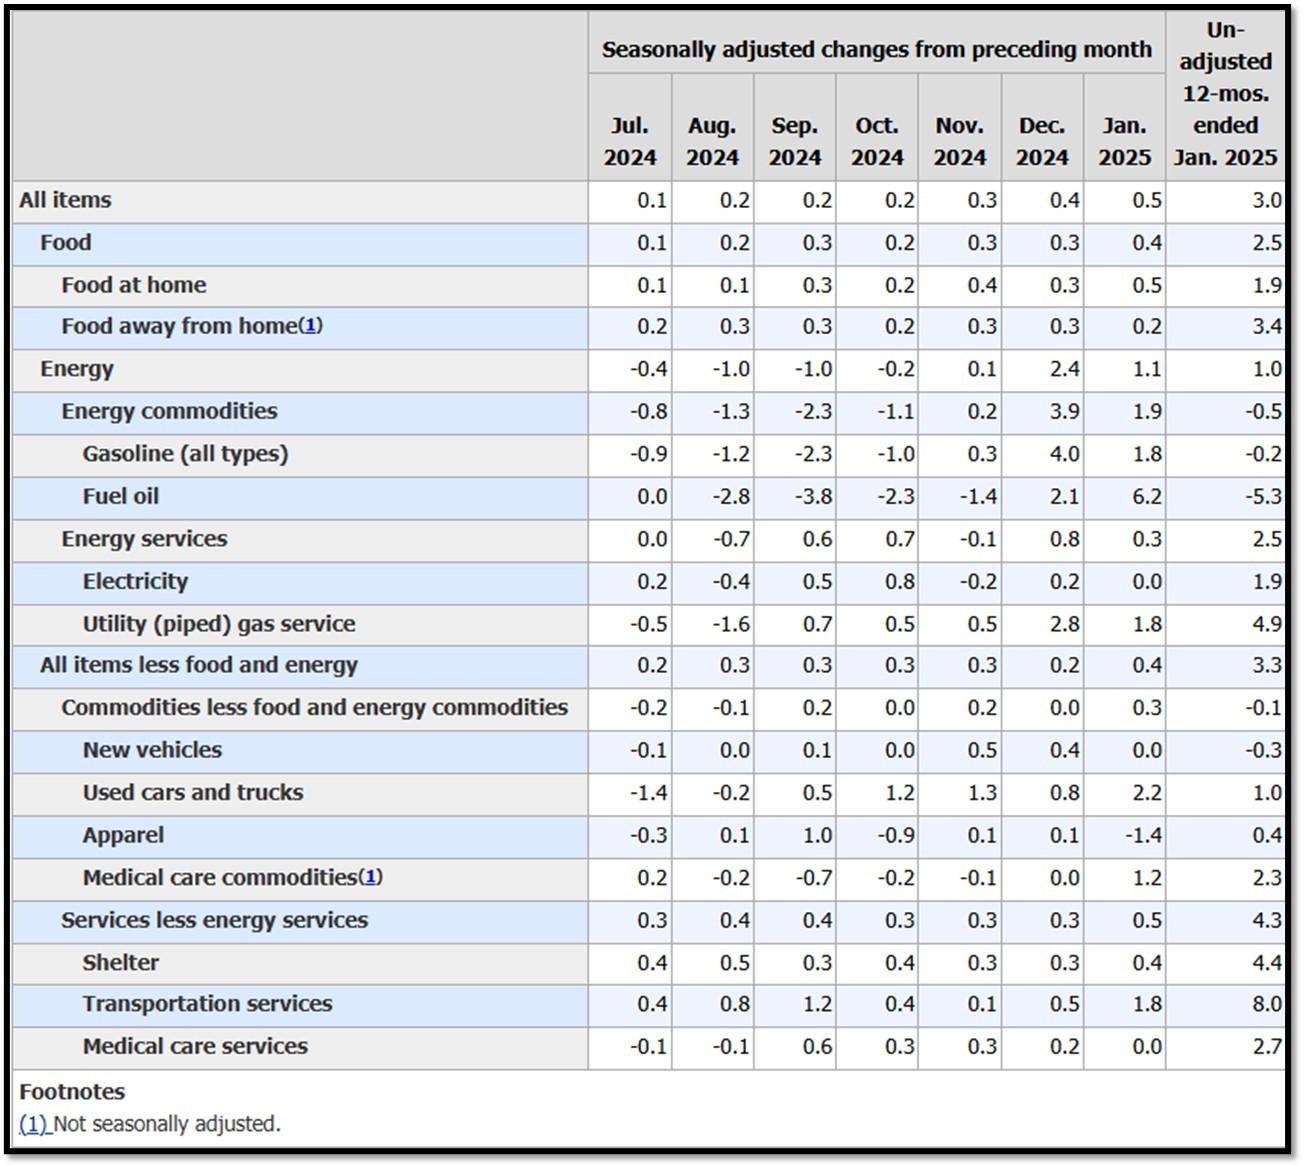
Inflation and Market Reactions – Inflationary pressures are intensifying, with the Consumer Price Index (CPI) rising 3% year-over-year in January, surpassing the Federal Reserve’s 2% target. This uptick is driven by higher costs in transportation, food, and education sectors. The unexpected acceleration in inflation has led to increased volatility in financial markets, as investors reassess monetary policy expectations and potential interest rate adjustments. While the housing and labor markets exhibit signs of resilience, escalating inflation poses challenges, prompting close monitoring of economic indicators and policy responses in the coming months. REF: DailyShot2-19, DailyShot2-20, CensusBureau, REUTERS
2. Grok 3: xAI’s Breakthrough in AI – Elon Musk’s xAI has unveiled Grok 3, a major leap in AI technology, positioning it as a strong competitor against OpenAI’s GPT-4o and DeepSeek V3.
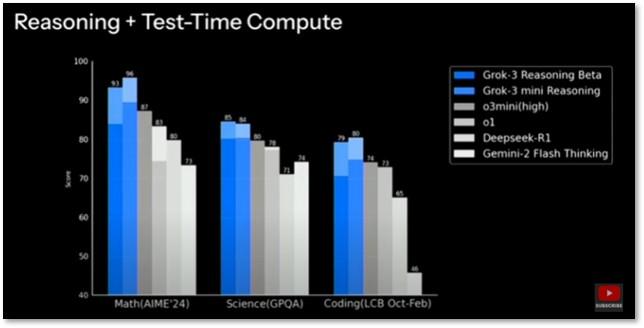
Grok 3 was trained with 10x more computational power than its predecessor, utilizing 200,000 Nvidia GPUs in xAI’s Colossus supercomputer. Benchmark tests show it outperforms rivals in mathematics, coding, and reasoning, demonstrating xAI’s significant investment in AI research and development.
Beyond raw performance, Grok 3 introduces several innovative features designed to enhance user interaction and functionality:
- Advanced Reasoning Modes: Users can engage “Think” mode for step-by-step reasoning or activate “Big Brain” mode for complex problem-solving tasks, utilizing increased computational resources.
- DeepSearch Integration: This AI-powered search engine provides comprehensive analyses of internet and platform data, streamlining research and data analysis processes.
- Voice Interaction: Future updates are set to include voice interaction capabilities, offering a more natural and conversational user experience.
Elon Musk has announced plans to integrate xAI’s advanced language model, Grok 3, into SpaceX operations, aiming to enhance various aspects of space exploration and mission management. This integration is expected to improve decision-making processes, optimize communication systems, and provide advanced data analysis capabilities, thereby increasing the efficiency and safety of SpaceX missions.
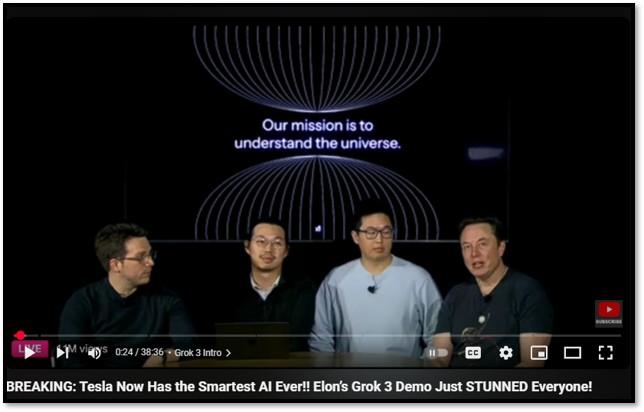
Elon also announced plans to integrate xAI’s advanced language model, Grok 3, into Tesla vehicles, enhancing their voice command capabilities. This integration aims to provide Tesla owners with a more intuitive and dynamic interaction experience, allowing for natural language commands and real-time information retrieval. For instance, drivers could inquire about the least crowded nearby restaurants or adjust in-car settings like climate control through conversational prompts. The integration of Grok 3 is expected to significantly improve Tesla’s existing voice command system. Currently, drivers must use specific syntax for voice commands; however, with Grok 3, the system will understand more natural speech patterns, making interactions more user-friendly. This advancement is part of Tesla’s broader strategy to enhance in-car user experiences through cutting-edge AI technologies. Click onto picture below to access video. REF: X.ai, Nasdaq, REUTERS,
3. Investing directly in private companies like xAI and SpaceX is typically reserved for institutional and high-net-worth investors due to high minimums and complex processes.
However, retail investors can gain exposure to these companies through specialized investment funds such as the ARK Venture Fund (ARKVX) and the Private Shares Fund (PRIVX and PIIVX).
The ARK Venture Fund, managed by ARK Invest under Cathie Wood, is designed to democratize venture capital by allowing retail investors to participate in private and public companies’ growth. The allocation provides investors with access to Musk’s innovative enterprises, which are otherwise inaccessible to the general public. The ARK Venture Fund is available through platforms like SoFi, Titan and Fidelity via Financial Advisors. REF: ARKVX
Similarly, the Private Shares Fund offers exposure to late-stage, venture-backed growth companies, including SpaceX and Xai. Structured as a closed-end interval fund under the 1940 Act, it allows all investors to access private companies with features like daily net asset value (NAV) calculations, quarterly redemption programs, and simplified tax reporting. This structure provides a more liquid and accessible avenue for investing in private companies compared to traditional private equity investments. REF: PRIVX-PIIVX
Important Note: Investor should consider the investment objective, risks, charges and expenses carefully before investing. For prospectus or summary prospectus with this and other information about this Fund, please visit above REF links for additional information about the funds. Read carefully before investing.
**With the current macro-economic backdrop, below are areas we currently favor:
- Fixed Income – Short-term Corporates (Low-Beta)
- Fixed Income – Corporates High Yield as Opportunistic Allocation (Low-Beta)
- Businesses that contribute to and benefit from AI & Automation (Market-Risk)
- Financials (Market-Risk)
- Industrials (Market-Risk)
- Small Cap & Mid Cap Stocks (Market-Risk)
- Biotechnology (Market-Risk)
- Gold & Digital Asset – Bitcoin (Market-Risk/Hedge)
4. World Watch
4A. China’s Shift in Tech Policy: A Call for Private Sector Support – Facing economic challenges, China is reversing its tech crackdown, with President Xi Jinping inviting Alibaba’s Jack Ma and other CEOs to signal renewed support for the private sector. Once heavily regulated, tech giants are now seen as vital for economic recovery amid slowing growth and deflation. By welcoming Ma—previously sidelined—Xi aims to restore business confidence and encourage innovation. While this shift suggests a friendlier stance, skepticism remains. Investors will watch whether it leads to lasting reforms or is merely a short-term strategy to stabilize the economy. Click onto picture below to access video. REF: WSJ, CNA

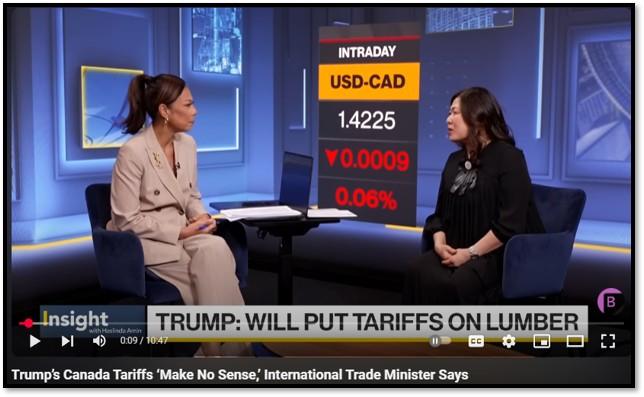
4B. The Trump administration’s tariffs have introduced significant uncertainty in global markets, making investors cautious about Europe and Asia despite cheaper stock valuations. While international equities offer attractive price-to-earnings ratios compared to U.S. stocks, concerns over economic stability and trade tensions keep many investors on edge. European and Asian markets have shown resilience, with indices like the Stoxx Europe 600 and Hong Kong’s Hang Seng posting gains. However, analysts warn that these rallies could be short-lived if trade disputes escalate. European equities trade at near-record discounts compared to U.S. stocks, and some analysts expect stronger earnings growth, particularly in sectors like financials and defense (Financial Times, Barron’s). In Asia, cheaper valuations and government policies promoting domestic consumption have attracted some investor interest, but concerns about potential trade disruptions remain.
Despite the valuation opportunities, investors are wary of broader economic risks. In Europe, potential new tariffs could slow recovery and reignite inflation. In Asia, while some economies have benefited from shifting trade patterns, uncertainty over U.S. trade policies continues to pose a risk to long-term growth. While Europe and Asia present attractive investment opportunities, Trump’s tariff policies create an unpredictable environment that tempers investor enthusiasm. Until trade policies stabilize, global markets will likely remain volatile, requiring a cautious approach from investors. Click onto picture below to access video. REF: BARRON’S, REUTERS, Bloomberg
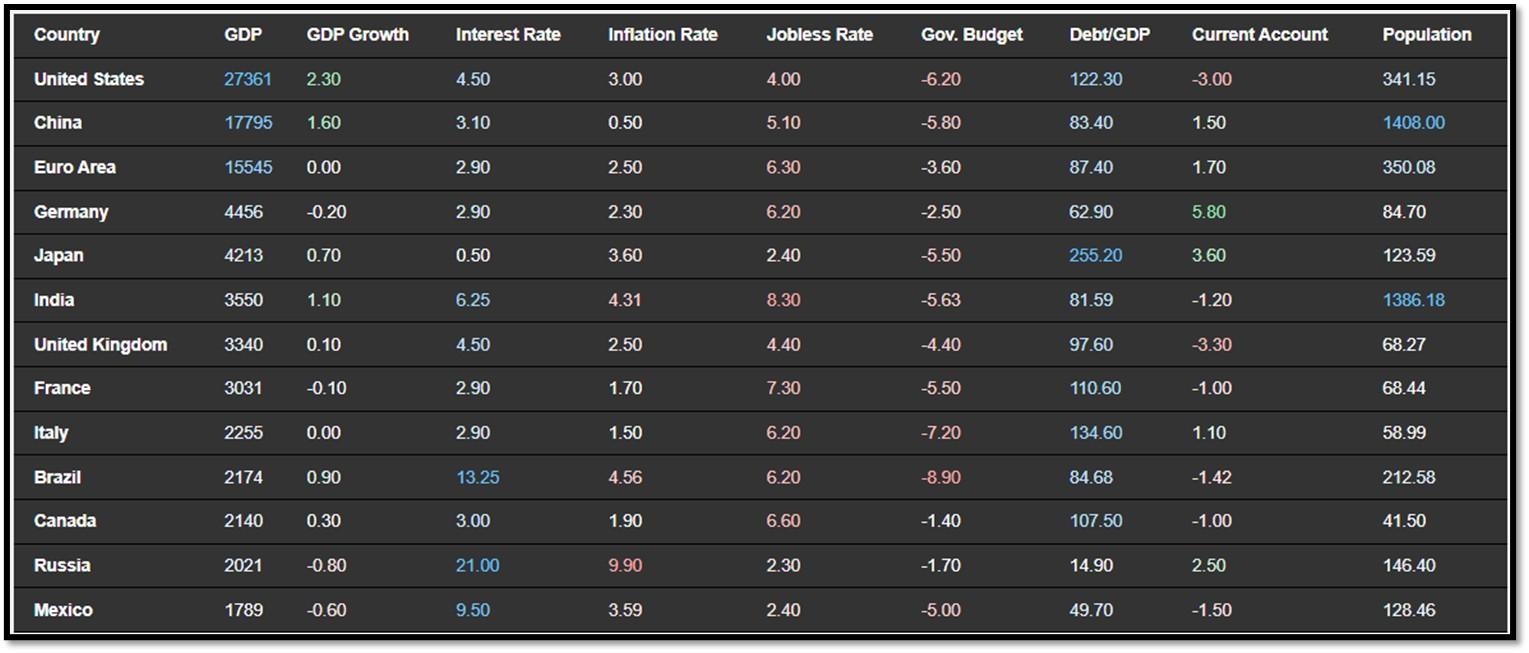
4C. Below is an updated snapshot of the current global state of economy according to TradingEconomics as of 2/18/2025. REF: TradingEconomics
- The annual inflation rate in the US edged up to 3% in January 2025, compared to 2.9% in December 2024, and above market forecasts of 2.9%, indicating stalled progress in curbing inflation.
- Japan’s GDP grew by 0.7% qoq in Q4 of 2024, accelerating from an upwardly revised 0.4% expansion in Q3 and surpassing market expectations of 0.3%, preliminary data showed.
- The annual inflation rate in India fell to 4.31% in January of 2025 from 5.22% in the previous month, sharply below market expectations that it would fall to 4.6% to mark the softest rate of price growth since August of last year.
- The British economy expanded 0.1% on quarter in Q4 2024, following no growth in Q3, and beating forecasts of a 0.1% contraction, according to preliminary estimates.
5. Quant & Technical Corner
Below is a selection of quantitative & technical data we monitor on a regular basis to help gauge the overall financial market conditions and the investment environment.
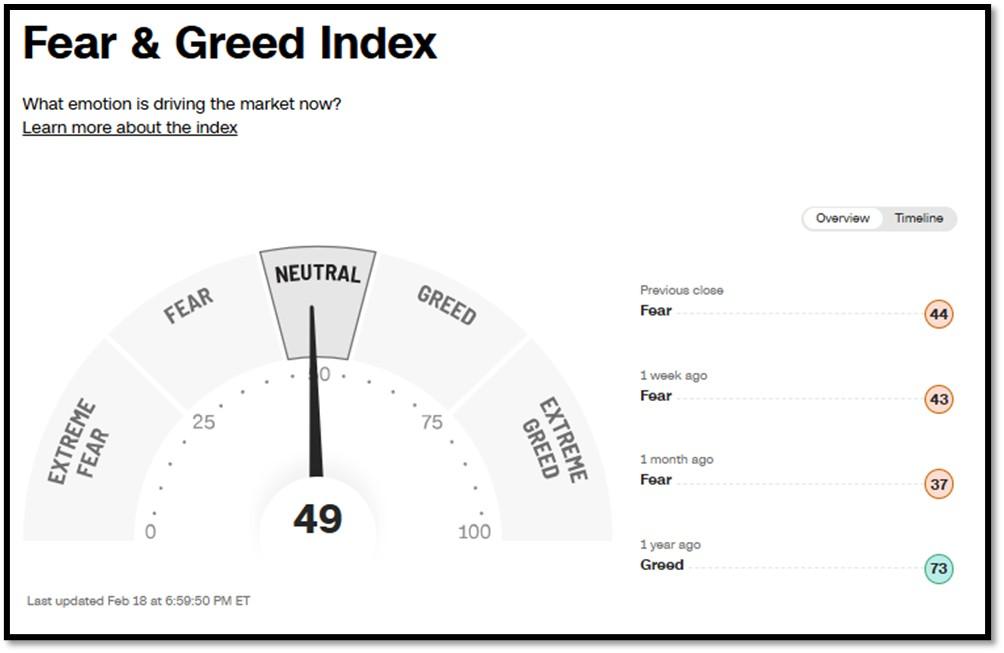
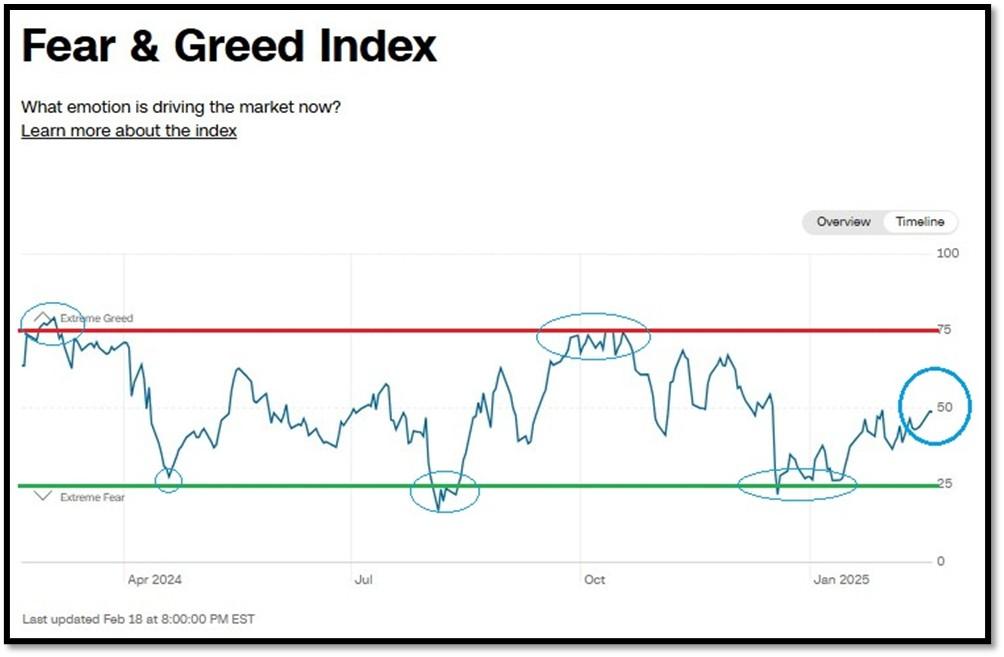
5A. Most recent read on the Fear & Greed Index with data as of 2/17/2025 – 6:59PM-ET is 49 (Neutral). Last week’s data was 43 (Fear) (1-100). CNNMoney’s Fear & Greed index looks at 7 indicators (Stock Price Momentum, Stock Price Strength, Stock Price Breadth, Put and Call Options, Junk Bond Demand, Market Volatility, and Safe Haven Demand). Keep in mind this is a contrarian indicator! REF: Fear&Greed via CNNMoney
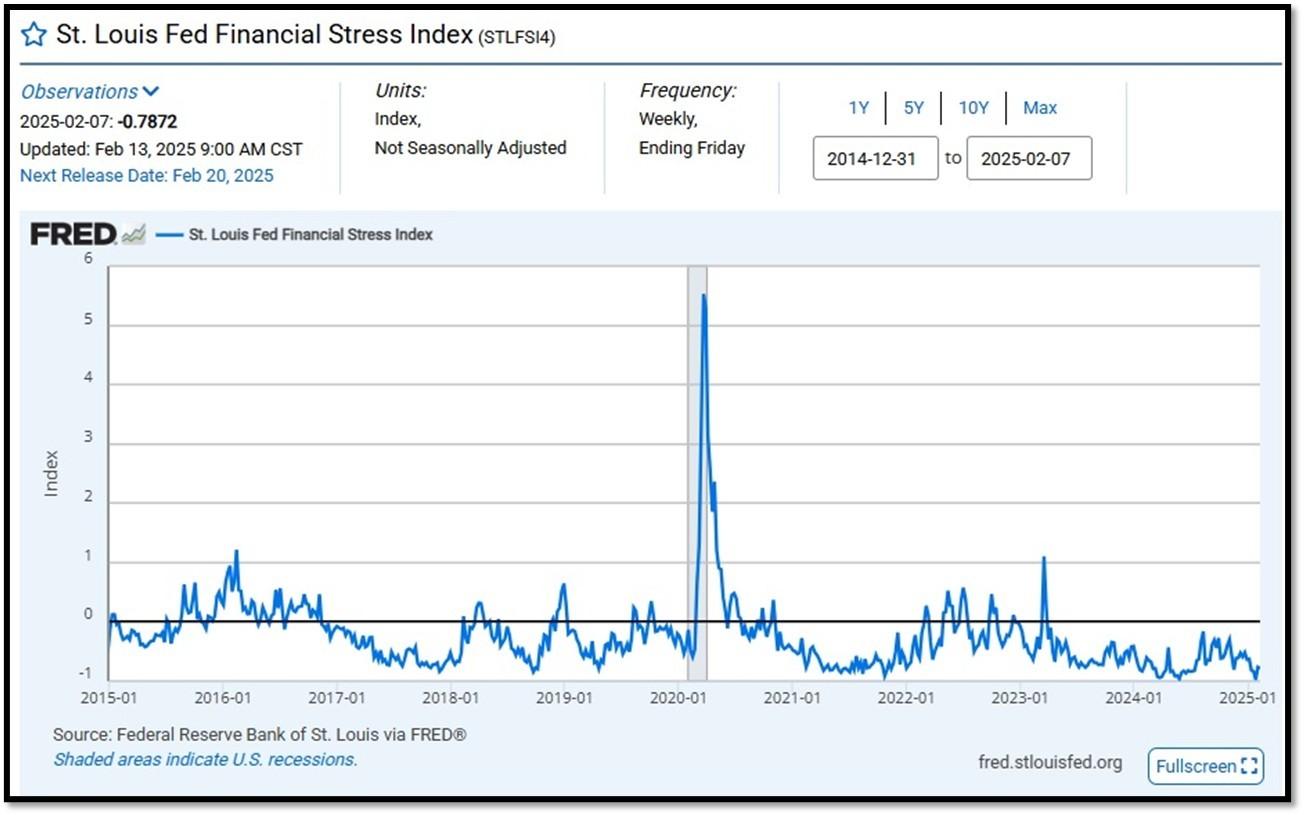
5B. St. Louis Fed Financial Stress Index’s (STLFSI4) most recent read is at –0.7872 as of February 13, 2025. A big spike up from previous readings reflecting the recent turmoil in the banking sector. Previous week’s data was -0.7640. This weekly index is not seasonally adjusted. The STLFSI4 measures the degree of financial stress in the markets and is constructed from 18 weekly data series: seven interest rate series, six yield spreads and five other indicators. Each of these variables captures some aspect of financial stress. Accordingly, as the level of financial stress in the economy changes, the data series are likely to move together. REF: St. Louis Fed
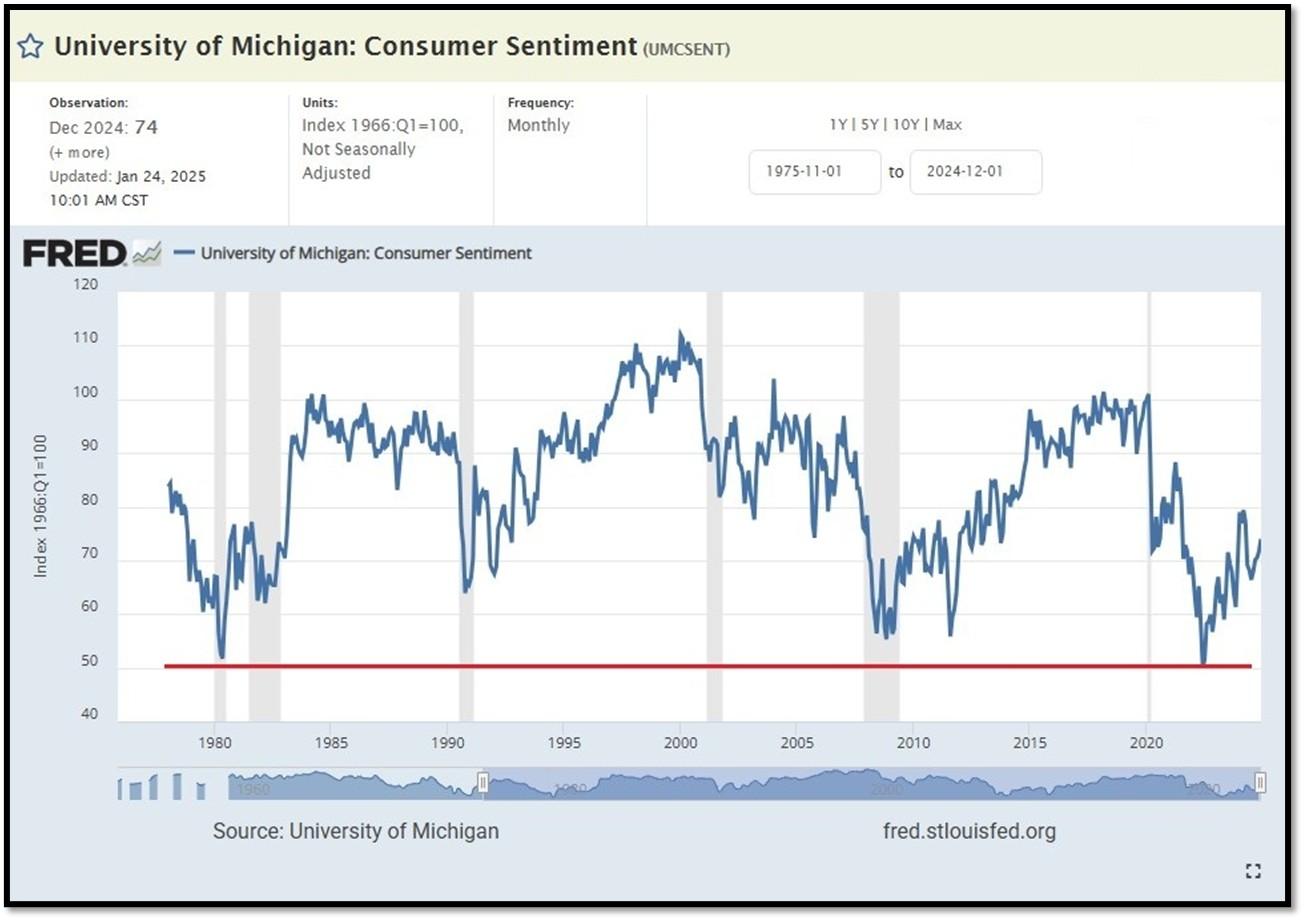
5C. University of Michigan, University of Michigan: Consumer Sentiment for September [UMCSENT] at 74, retrieved from FRED, Federal Reserve Bank of St. Louis, January 24, 2025. Back in June 2022, Consumer Sentiment hit a low point going back to April 1980. REF: UofM
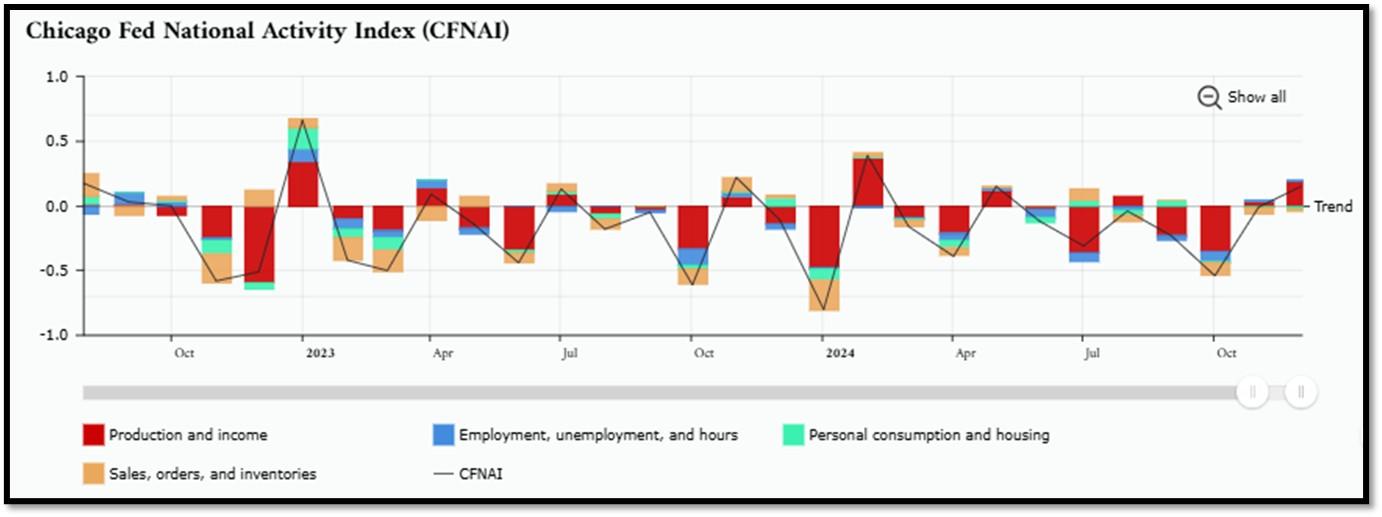
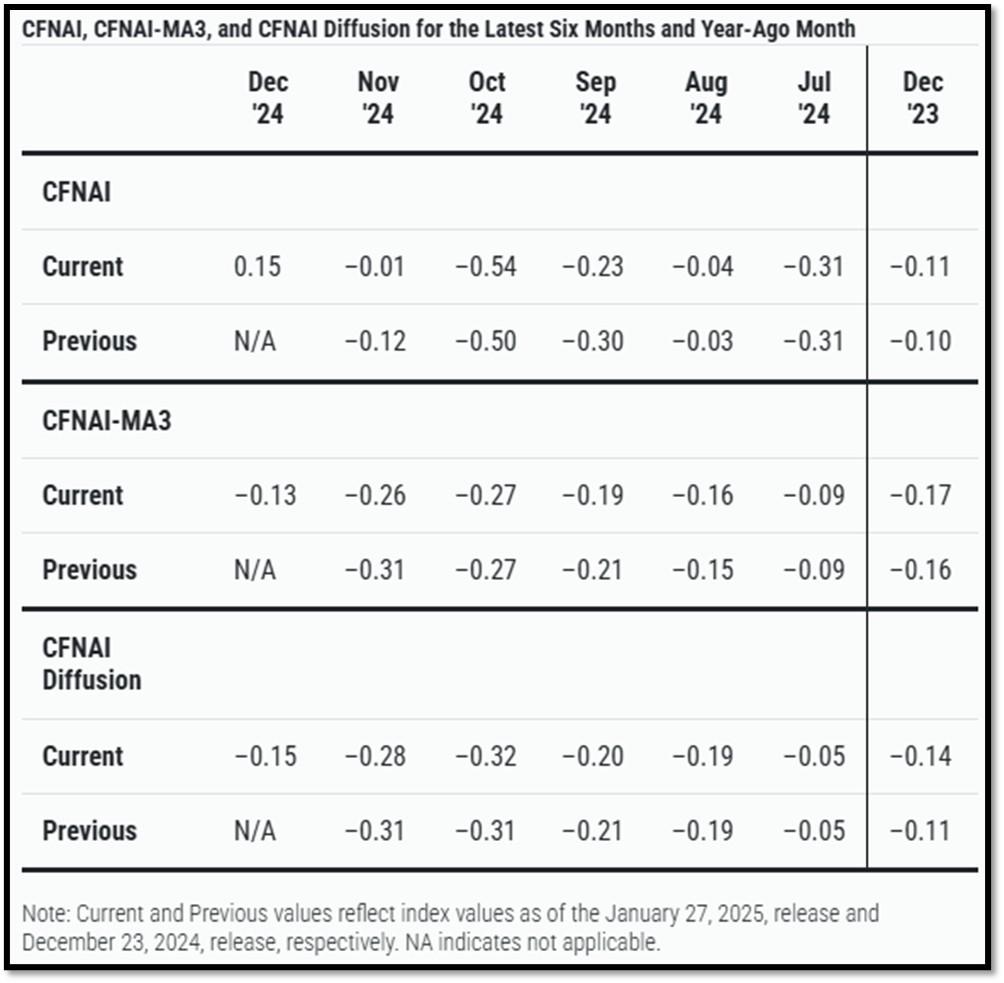
5D. The Chicago Fed National Activity Index (CFNAI) increased to +0.15 in December from –0.01 in November. Two of the four broad categories of indicators used to construct the index increased from November, and two categories made positive contributions in December. The index’s three-month moving average, CFNAI-MA3, increased to –0.13 in December from –0.26 in November. REF: ChicagoFed, December’s Report
5E. (1/22/2025) The Conference Board Leading Economic Index (LEI) for the US inched down by 0.1% in December 2024 to 101.6 (2016=100), after an upwardly revised increase of 0.4% in November. The LEI declined by 1.3% over the second half of 2024, slightly less than its 1.7% decline over the first half of the last year. The composite economic indexes are the key elements in an analytic system designed to signal peaks and troughs in the business cycle. The indexes are constructed to summarize and reveal common turning points in the economy in a clearer and more convincing manner than any individual component. The CEI is highly correlated with real GDP. The LEI is a predictive variable that anticipates (or “leads”) turning points in the business cycle by around 7 months. Shaded areas denote recession periods or economic contractions. The dates above the shaded areas show the chronology of peaks and troughs in the business cycle. The ten components of The Conference Board Leading Economic Index® for the U.S. include: Average weekly hours in manufacturing; Average weekly initial claims for unemployment insurance; Manufacturers’ new orders for consumer goods and materials; ISM® Index of New Orders; Manufacturers’ new orders for nondefense capital goods excluding aircraft orders; Building permits for new private housing units; S&P 500® Index of Stock Prices; Leading Credit Index™; Interest rate spread (10-year Treasury bonds less federal funds rate); Average consumer expectations for business conditions. REF: ConferenceBoard, LEI Report for December (Released on 2/1/2025)

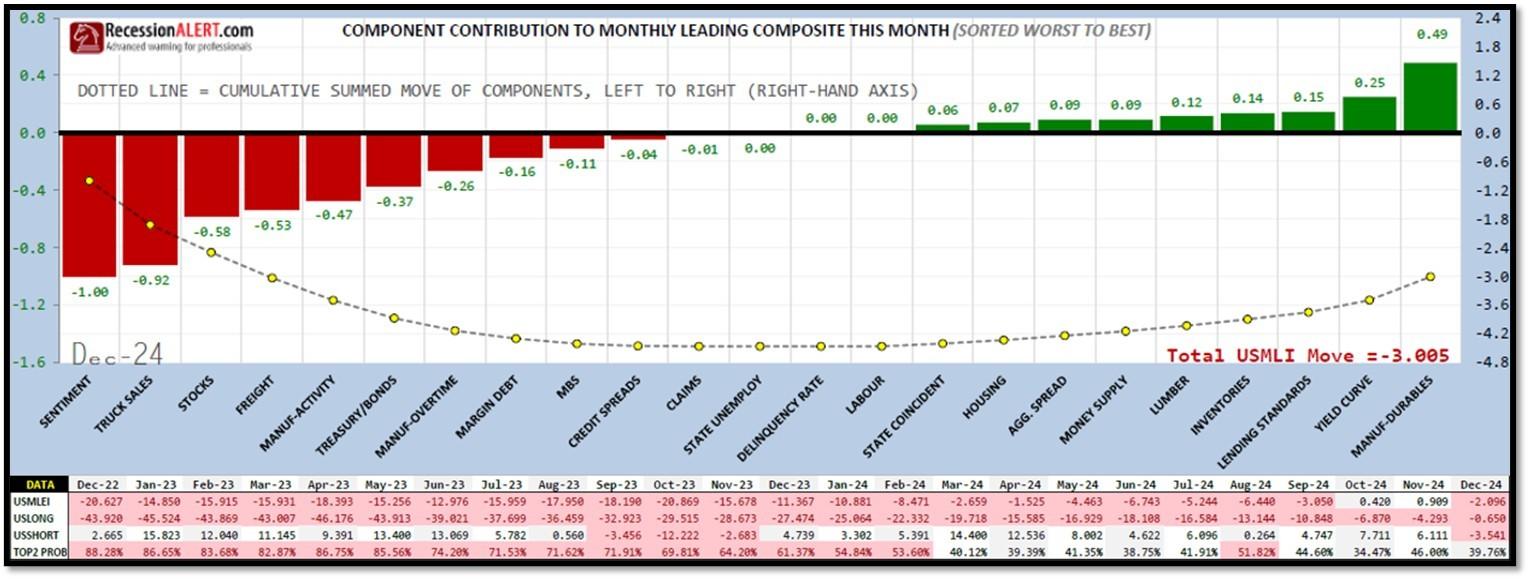
5F. Probability of U.S. falling into Recession within 3 to 4 months is currently at 27.33% (with data as of 02/16/2025 – Next Report 03/03/2025) according to RecessionAlert Research. Last release’s data was at 25.42%. This report is updated every two weeks. REF: RecessionAlertResearch

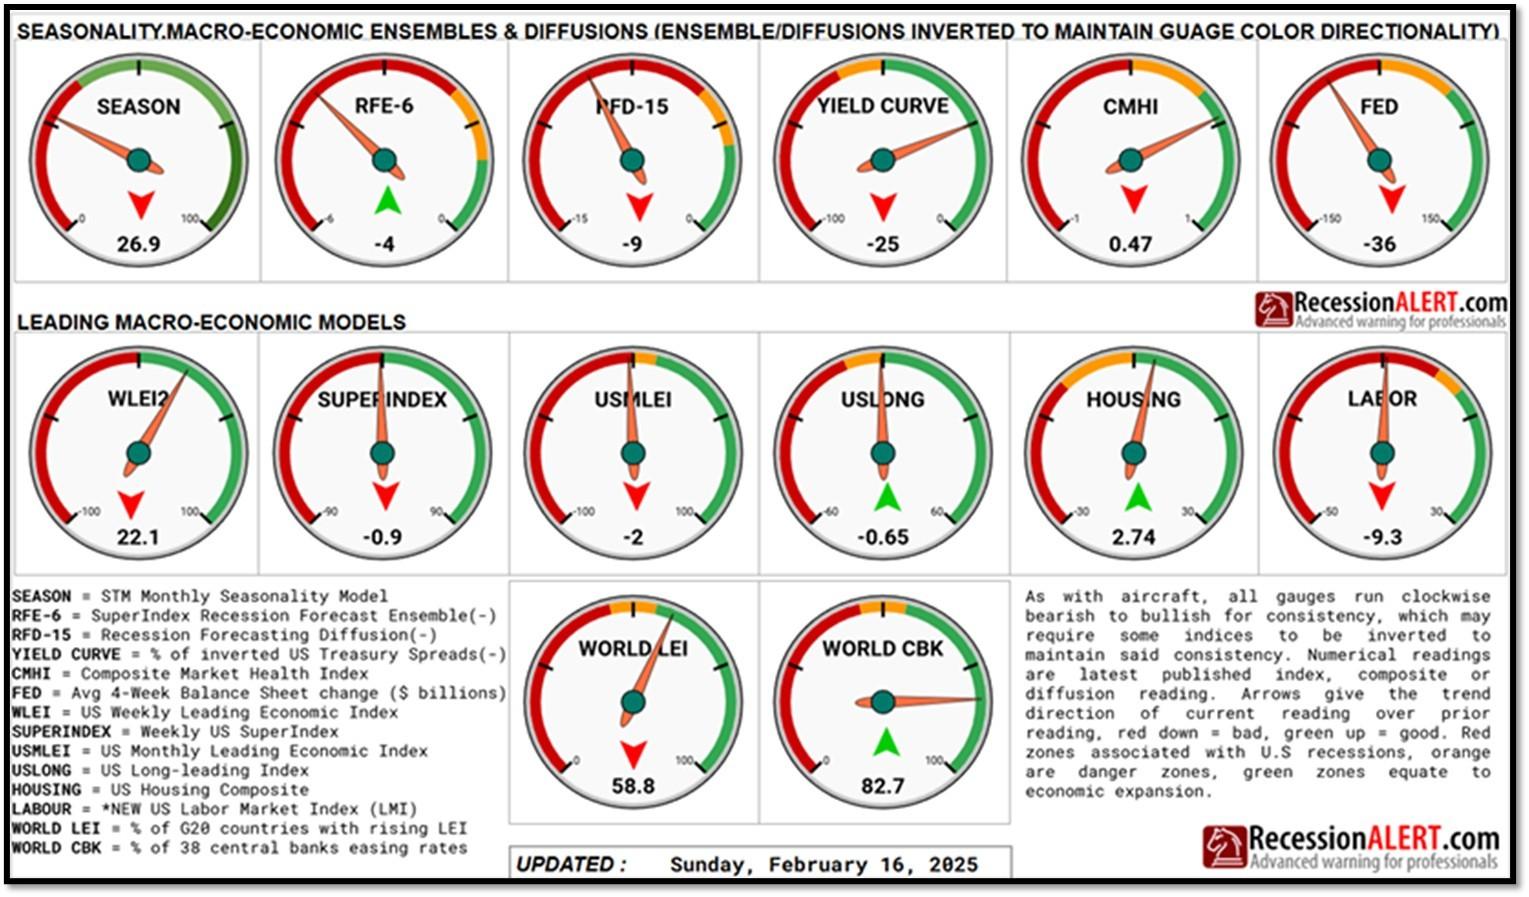
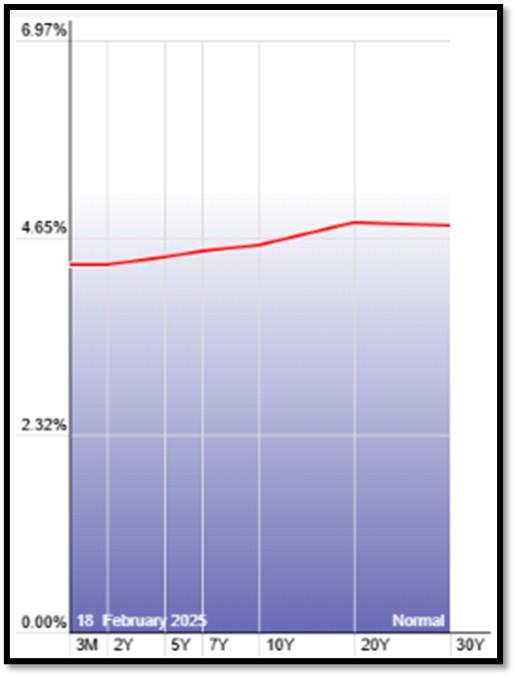
5G. Yield Curve as of 2/18/2025 is showing Normal. Spread on the 10-yr Treasury Yield (4.55%) minus yield on the 2-yr Treasury Yield (4.30%) is currently at 25 bps. REF: Stockcharts The yield curve—specifically, the spread between the interest rates on the ten-year Treasury note and the three-month Treasury bill—is a valuable forecasting tool. It is simple to use and significantly outperforms other financial and macroeconomic indicators in predicting recessions two to six quarters ahead. REF: NYFED
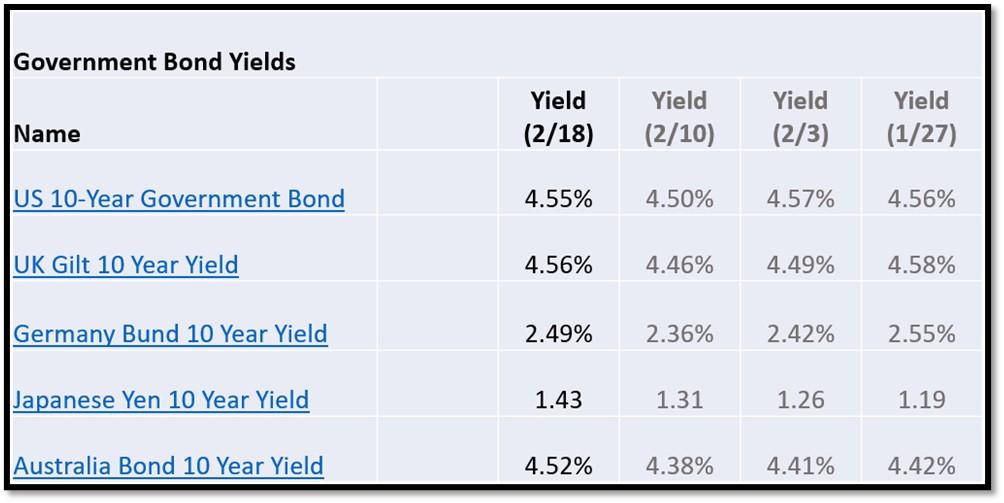
5H. Recent Yields in 10-Year Government Bonds. REF: Source is from Bloomberg.com, dated 2/18/2025, rates shown below are as of 2/18/2025, subject to change.
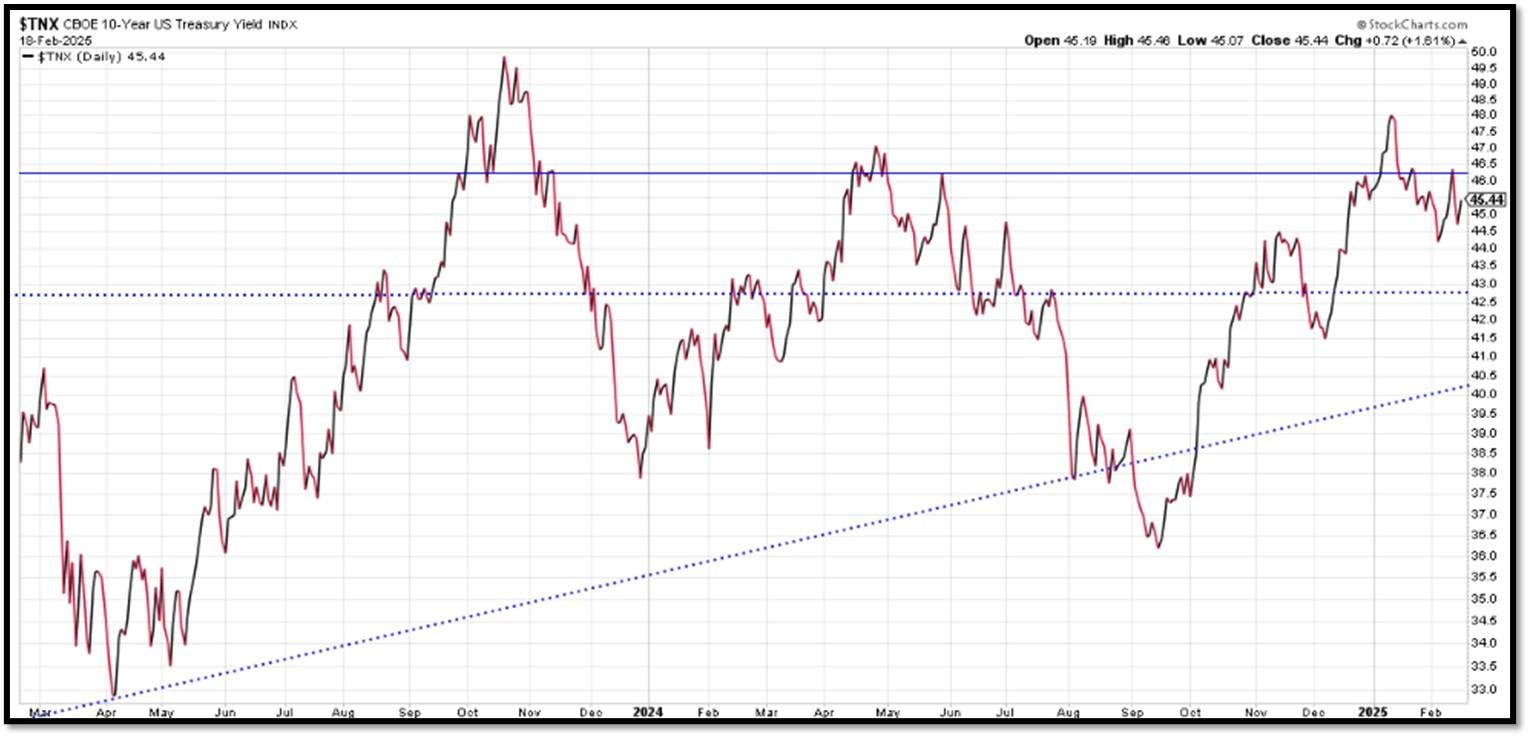
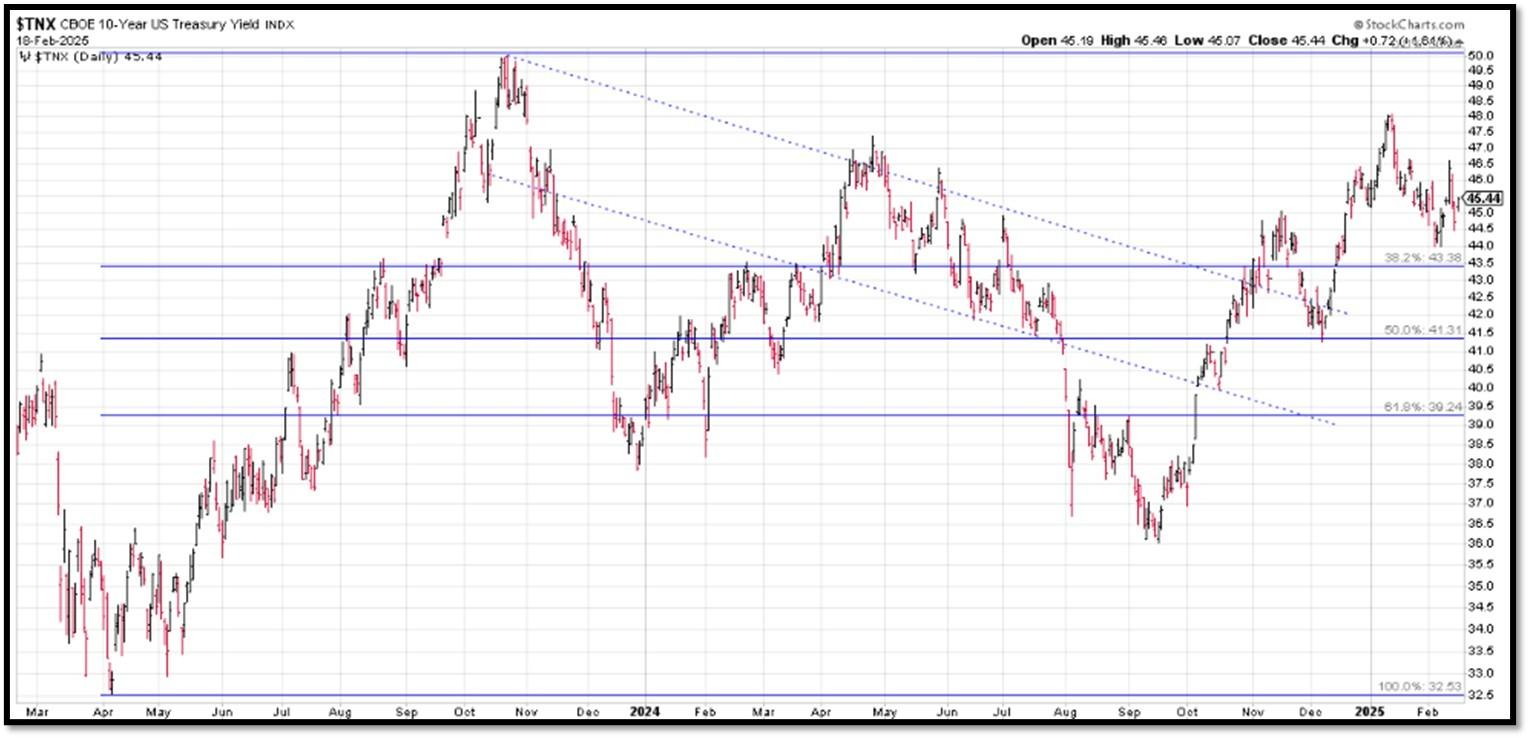
The 10-Year US Treasury Yield… REF: StockCharts1, StockCharts2
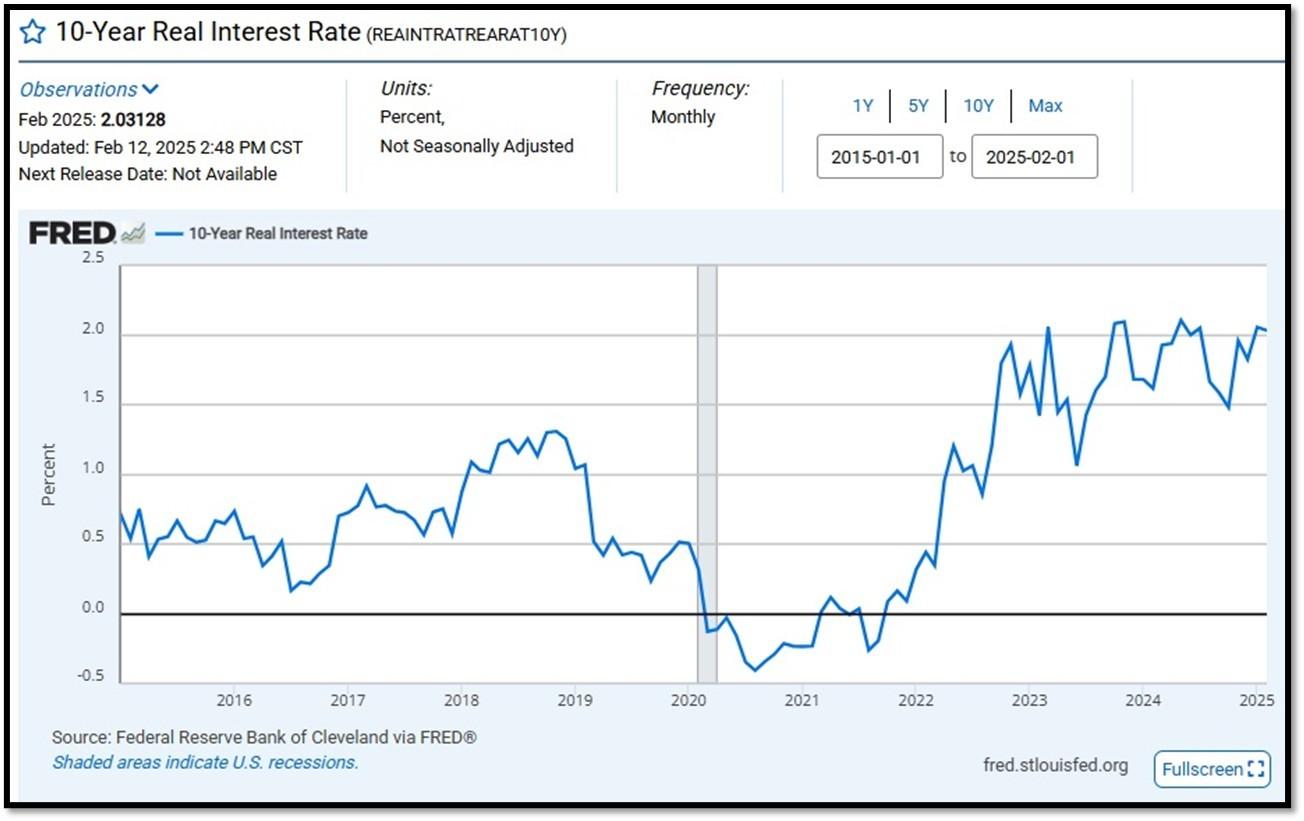
10-Year Real Interest Rate at 2.03128% as of 2/12/25. REF: REAINTRATREARAT10Y
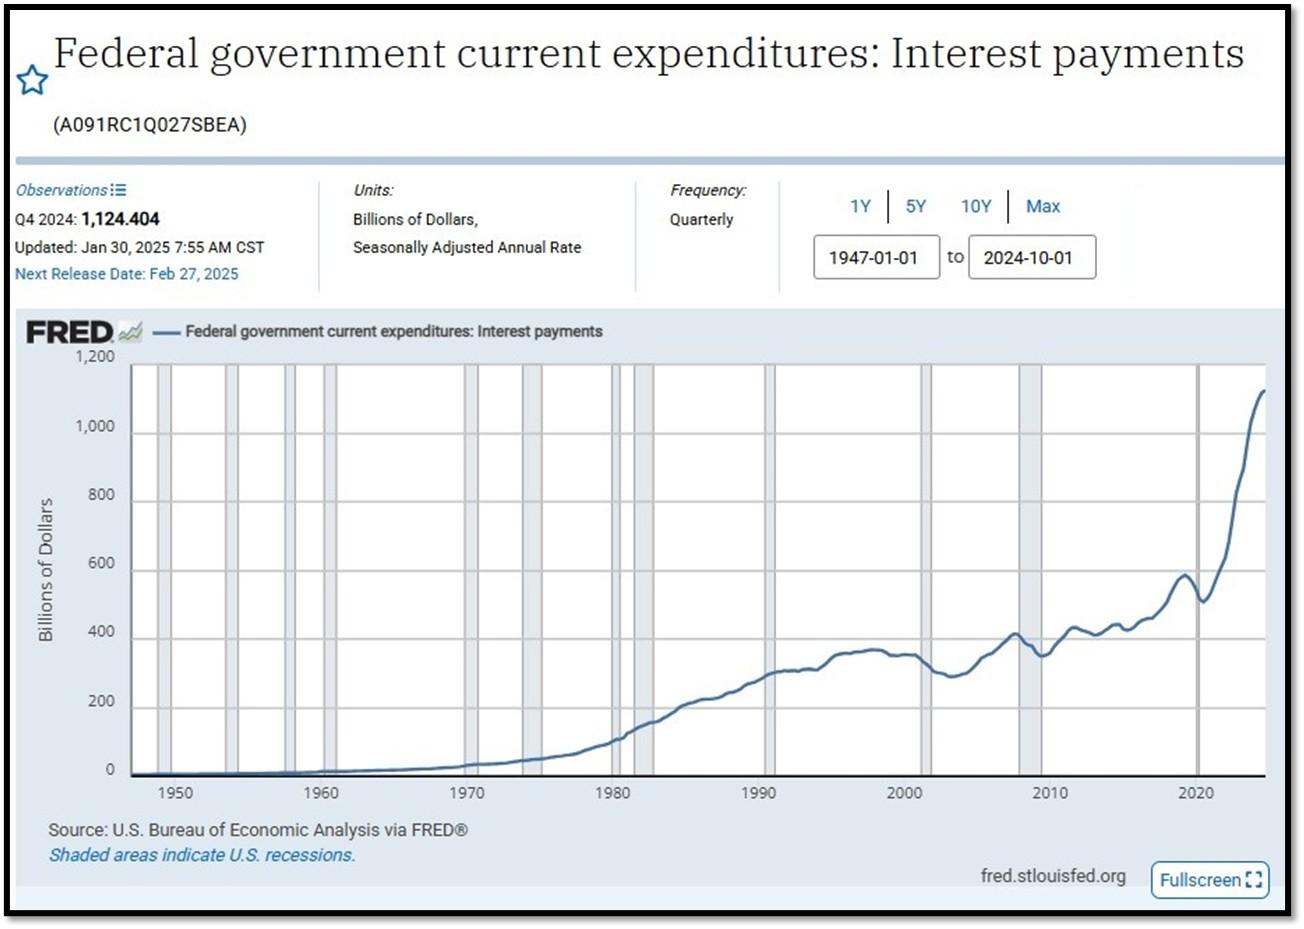
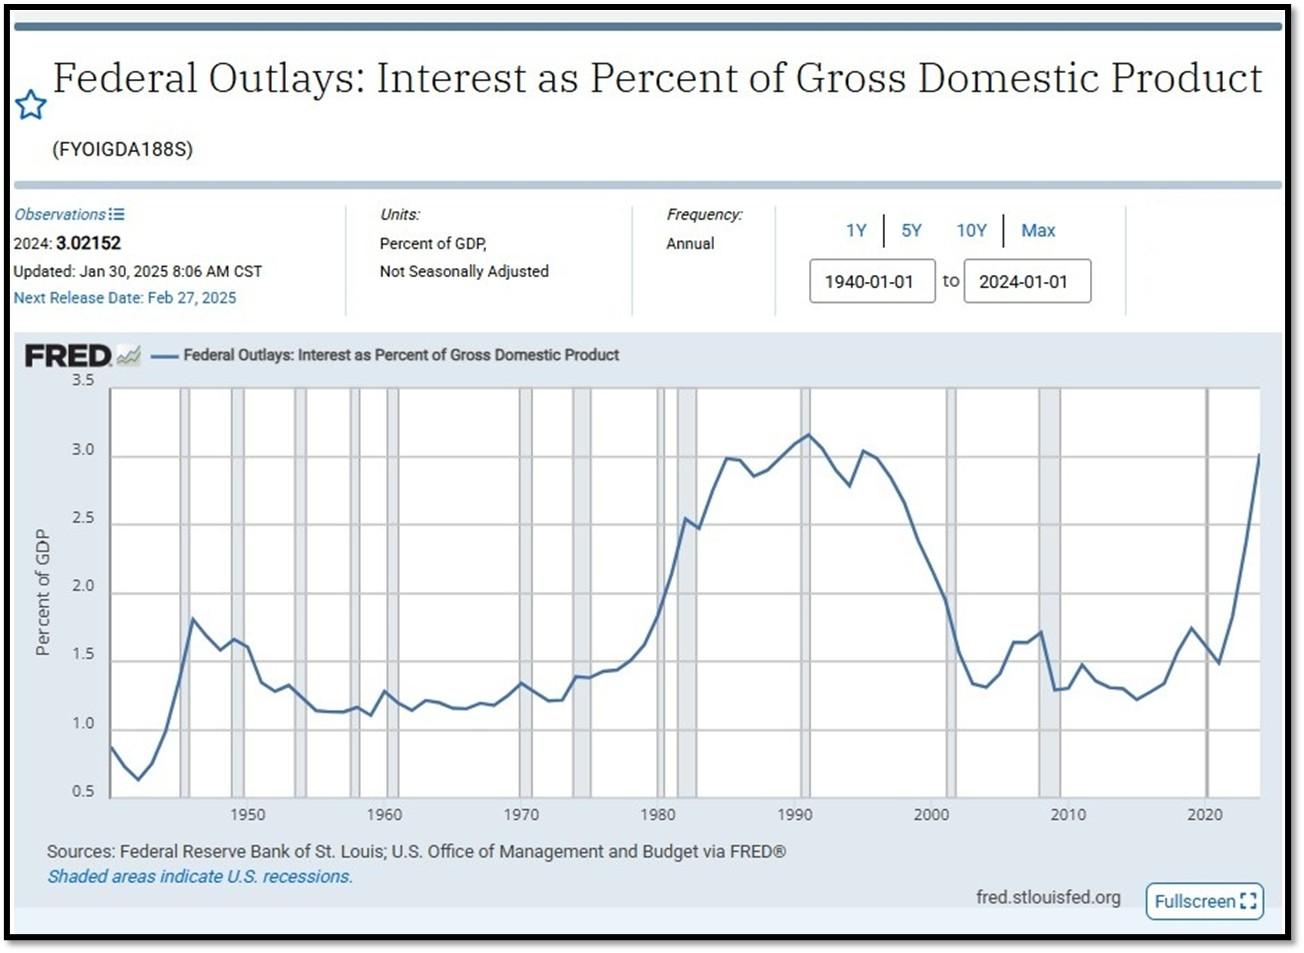
Federal government Interest Payments increased $8B+ to $1.124 Trillion as of Q4-2024. REF: FRED-A091RC1Q027SBEA
Interest payments as a percentage of GDP increased from 2.37794 in 2023 to 3.02152 as of 1/30/25. REF: FRED-FYOIGDA188S
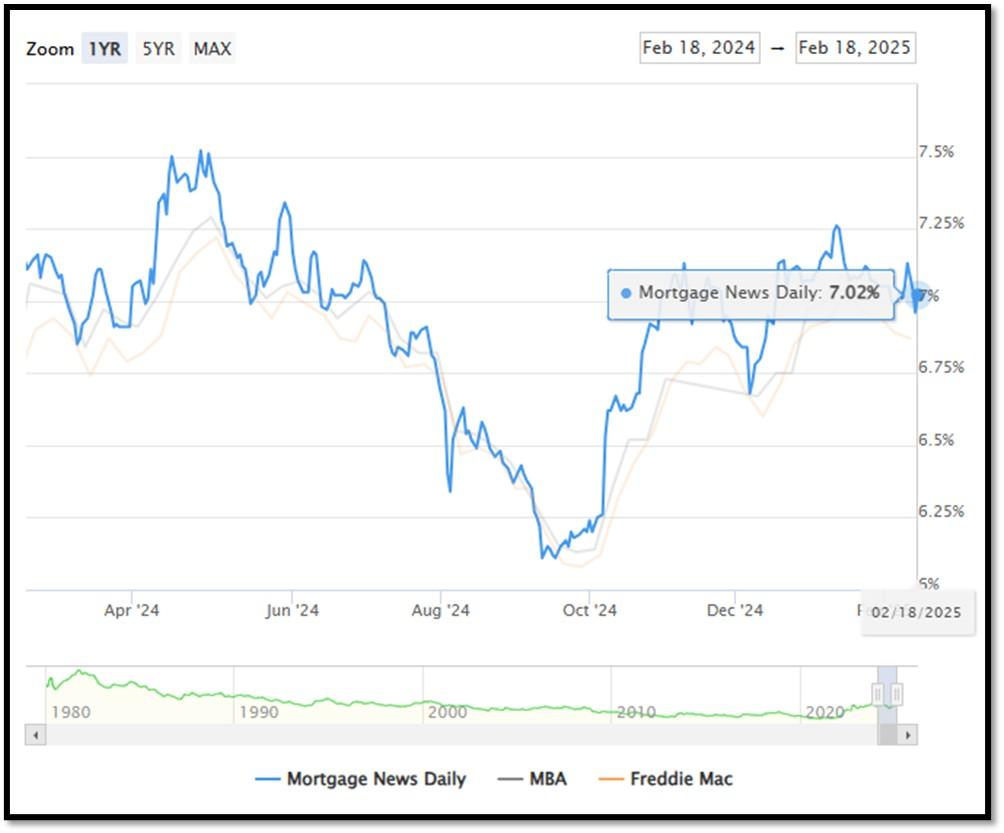
5I. (2/18/2025) Today’s National Average 30-Year Fixed Mortgage Rate is 7.02% (All Time High was 8.03% on 10/19/23). Last week’s data was 7.01%. This rate is the average 30-year fixed mortgage rates from several different surveys including Mortgage News Daily (daily index), Freddie Mac (weekly survey), Mortgage Bankers Association (weekly survey) and FHFA (monthly survey). REF: MortgageNewsDaily, Today’s Average Rate
The recent spike in the 30-year fixed-rate jumbo mortgage to 7.02%, compared to Freddie Mac’s rate at 6.87% and the Mortgage Bankers Association (MBA) rate at 7.02%, highlights key differences in the mortgage market. Jumbo mortgages, which exceed the conforming loan limits set by government agencies like Freddie Mac, typically carry higher interest rates because they are riskier for lenders. These loans are not backed by government entities, which increases the risk for lenders and, consequently, leads to higher rates. In contrast, Freddie Mac and MBA provide averages for conforming loans, which meet federal guidelines and have lower risk due to government backing, keeping their rates lower.
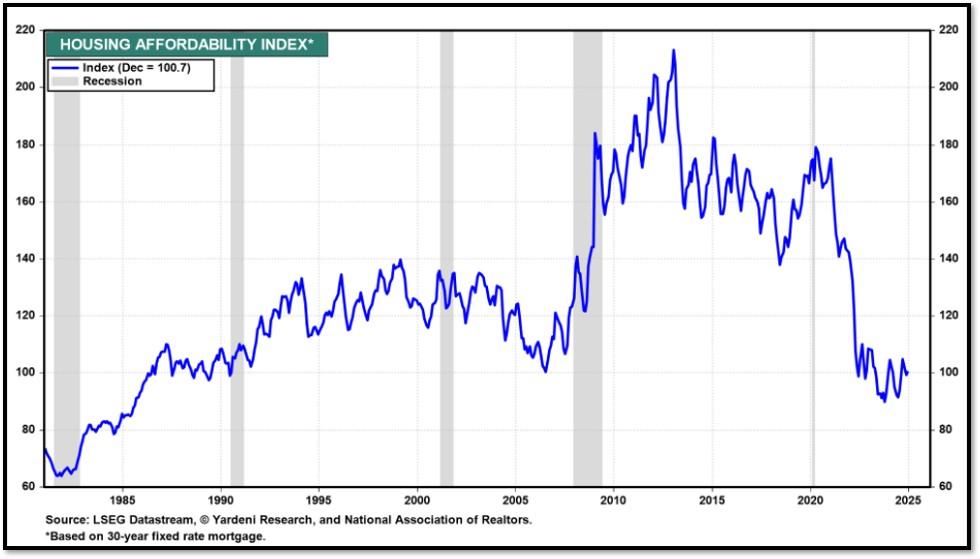
(2/10/25) Housing Affordability Index for Dec = 100.7 // Nov = 99 // Oct = 102.3 // Sep = 105.5 // Aug = 98.6 // July = 95 // June = 93.3 // May = 93.1 // April = 95.9 // March = 101.1 // February = 103.0. Data provided by Yardeni Research. REF: Yardeni

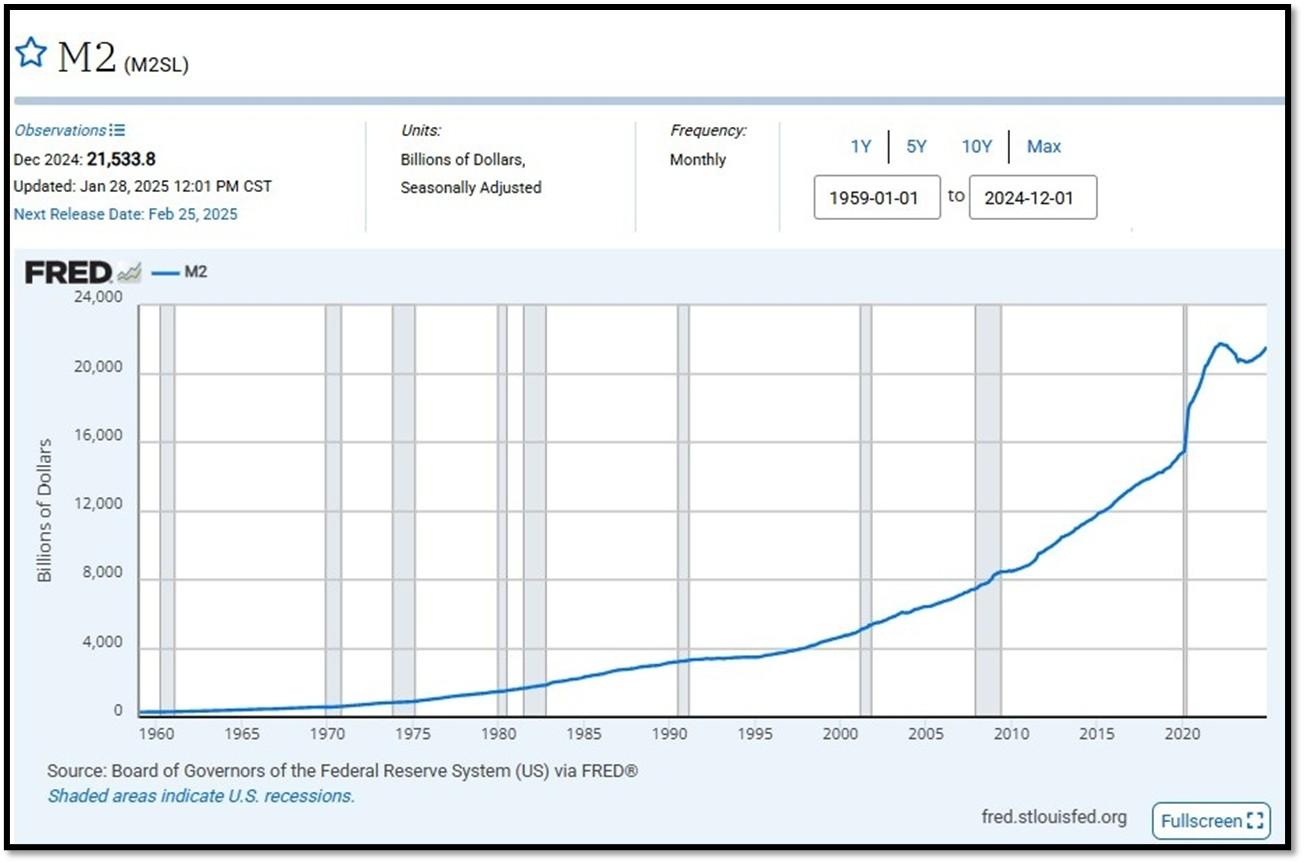
5J. Velocity of M2 Money Stock (M2V) with current read at 1.386 as of (Q4-2024 updated 1/30/2025). Previous quarter’s data was 1.390. The velocity of money is the frequency at which one unit of currency is used to purchase domestically- produced goods and services within a given time period. In other words, it is the number of times one dollar is spent to buy goods and services per unit of time. If the velocity of money is increasing, then more transactions are occurring between individuals in an economy. Current Money Stock (M2) report can be viewed in the reference link. REF: St.LouisFed-M2V
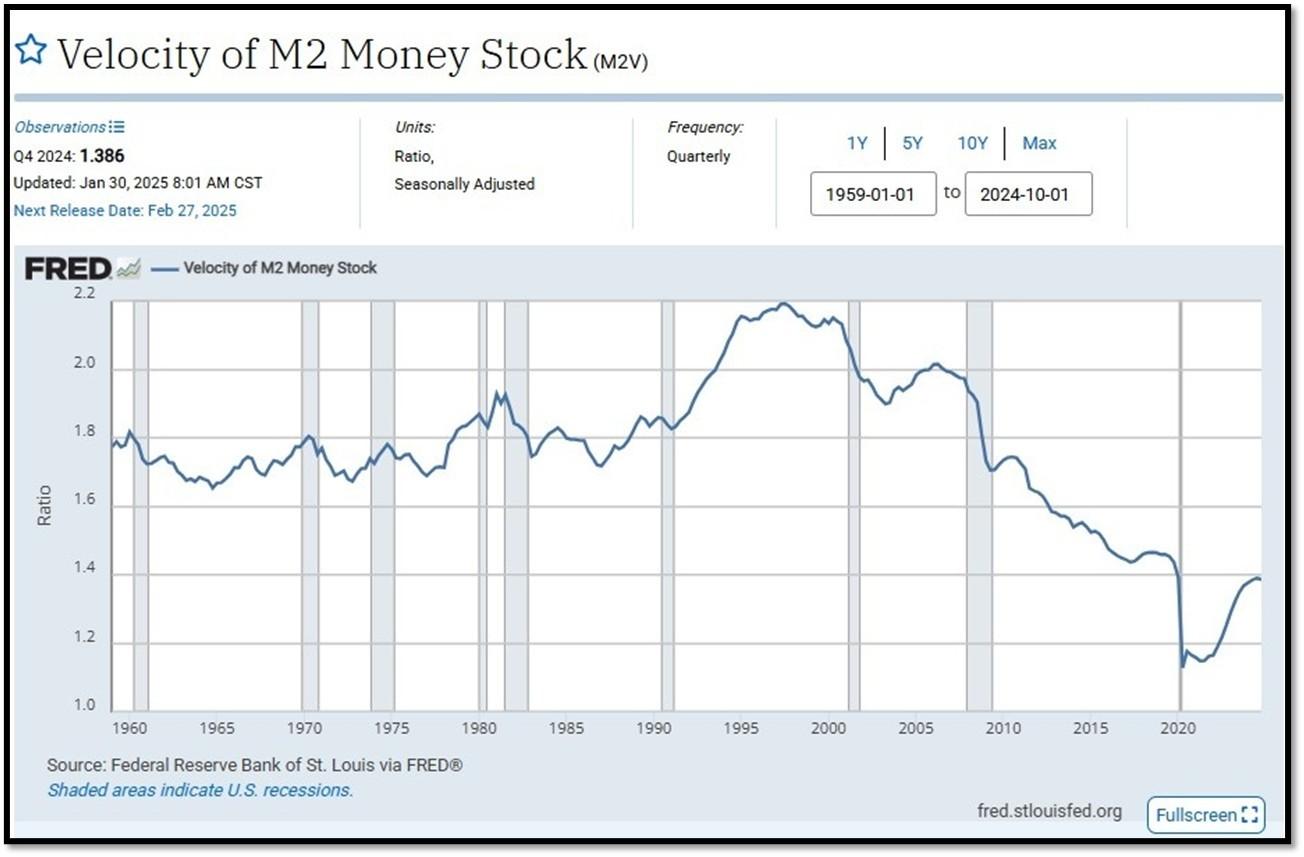
M2 consists of M1 plus (1) small-denomination time deposits (time deposits in amounts of less than $100,000) less IRA and Keogh balances at depository institutions; and (2) balances in retail MMFs less IRA and Keogh balances at MMFs. Seasonally adjusted M2 is constructed by summing savings deposits (before May 2020), small-denomination time deposits, and retail MMFs, each seasonally adjusted separately, and adding this result to seasonally adjusted M1. Board of Governors of the Federal Reserve System (US), M2 [M2SL], retrieved from FRED, Federal Reserve Bank of St. Louis; Updated on January 28, 2025. REF: St.LouisFed-M2
Money Supply M0 in the United States decreased to 5,604,100 USD Million in December from 5,616,500 USD Million in November of 2024. Money Supply M0 in the United States averaged 1,166,283.21 USD Million from 1959 until 2024, reaching an all-time high of 6,413,100.00 USD Million in December of 2021 and a record low of 48,400.00 USD Million in February of 1961. REF: TradingEconomics, M0
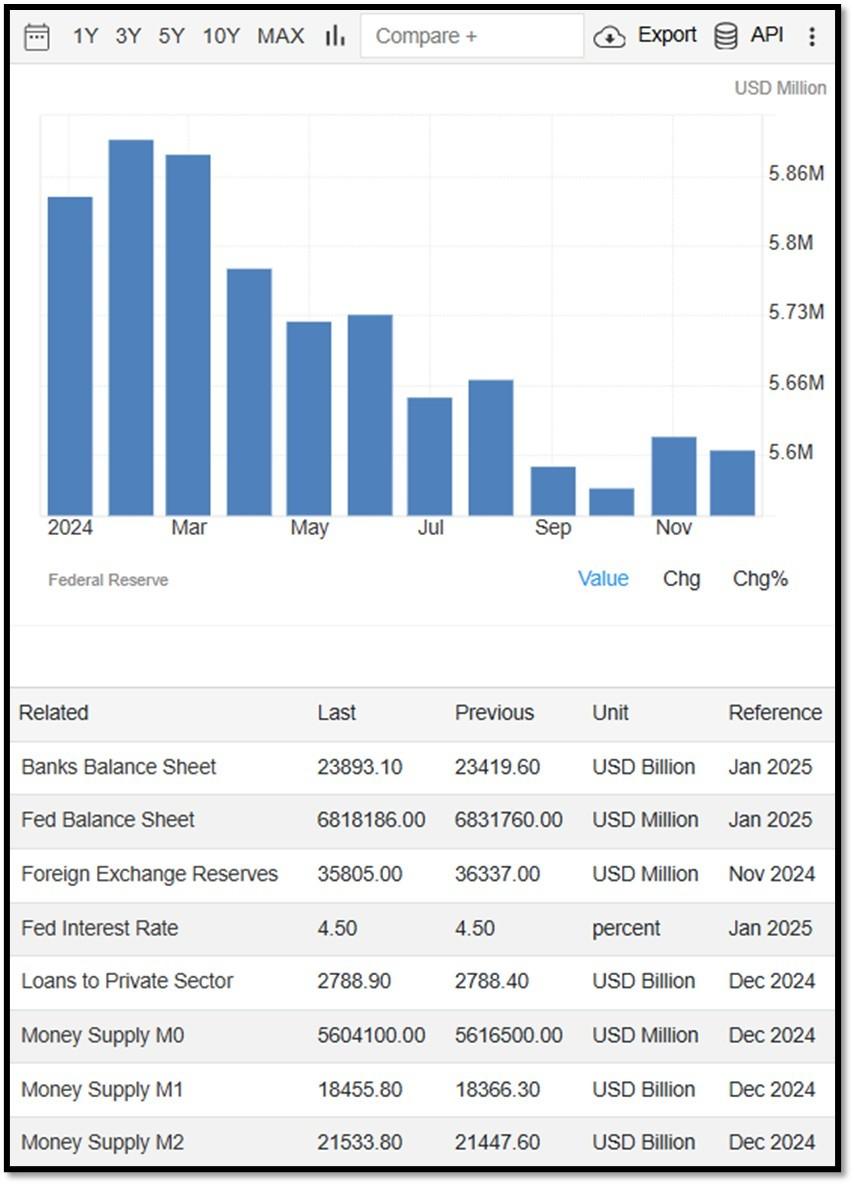
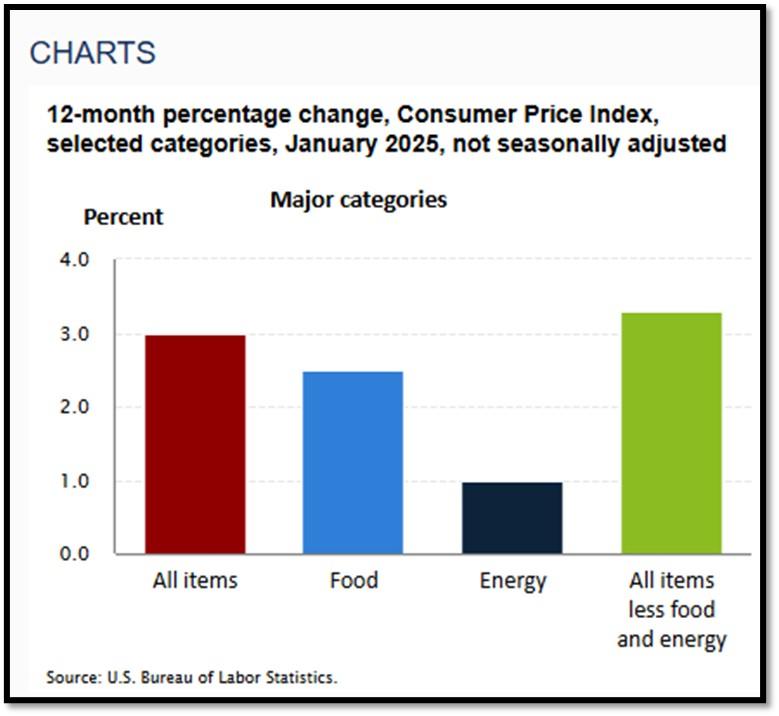
5K. In January, the Consumer Price Index for All Urban Consumers rose 0.5 percent, seasonally adjusted, and rose 3.0 percent over the last 12 months, not seasonally adjusted. The index for all items less food and energy increased 0.4 percent in January (SA); up 3.3 percent over the year (NSA). February 2025 CPI data are scheduled to be released on March 12, 2025, at 8:30AM-ET. REF: BLS, BLS.GOV
5L. Technical Analysis of the S&P500 Index. Click onto reference links below for images.
- Short-term Chart: Neutral on 2/18/2025 – REF: Short-term S&P500 Chart by Marc Slavin (Click Here to Access Chart)
- Medium-term Chart: Bullish on 2/18/2025 – REF: Medium-term S&P500 Chart by Marc Slavin (Click Here to Access Chart)
- Market Timing Indicators – S&P500 Index as of 2/18/2025 – REF: S&P500 Charts (7 of them) by Joanne Klein’s Top 7 (Click Here to Access Updated Charts)
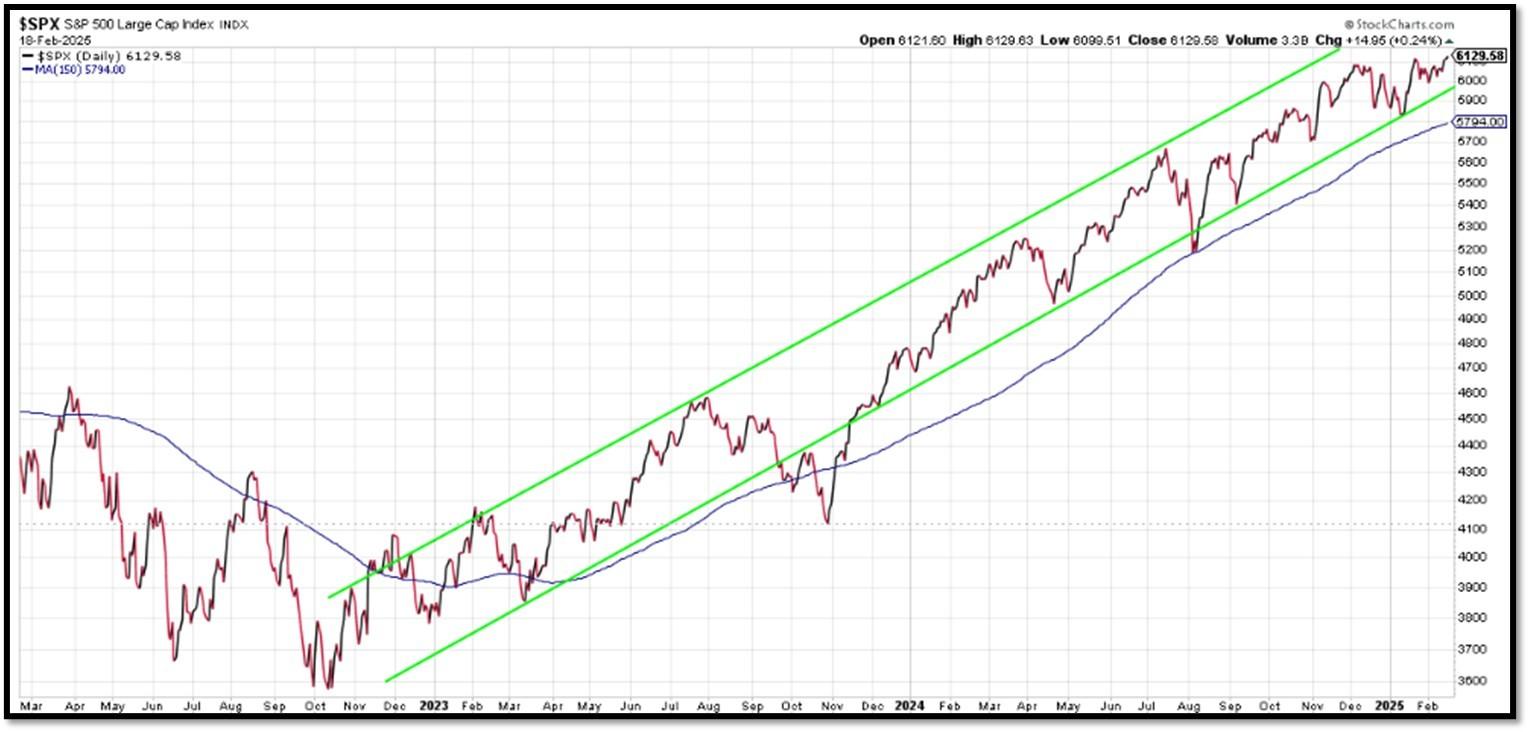
- A well-defined uptrend channel shown in green with S&P500 still on up trend. REF: Stockcharts
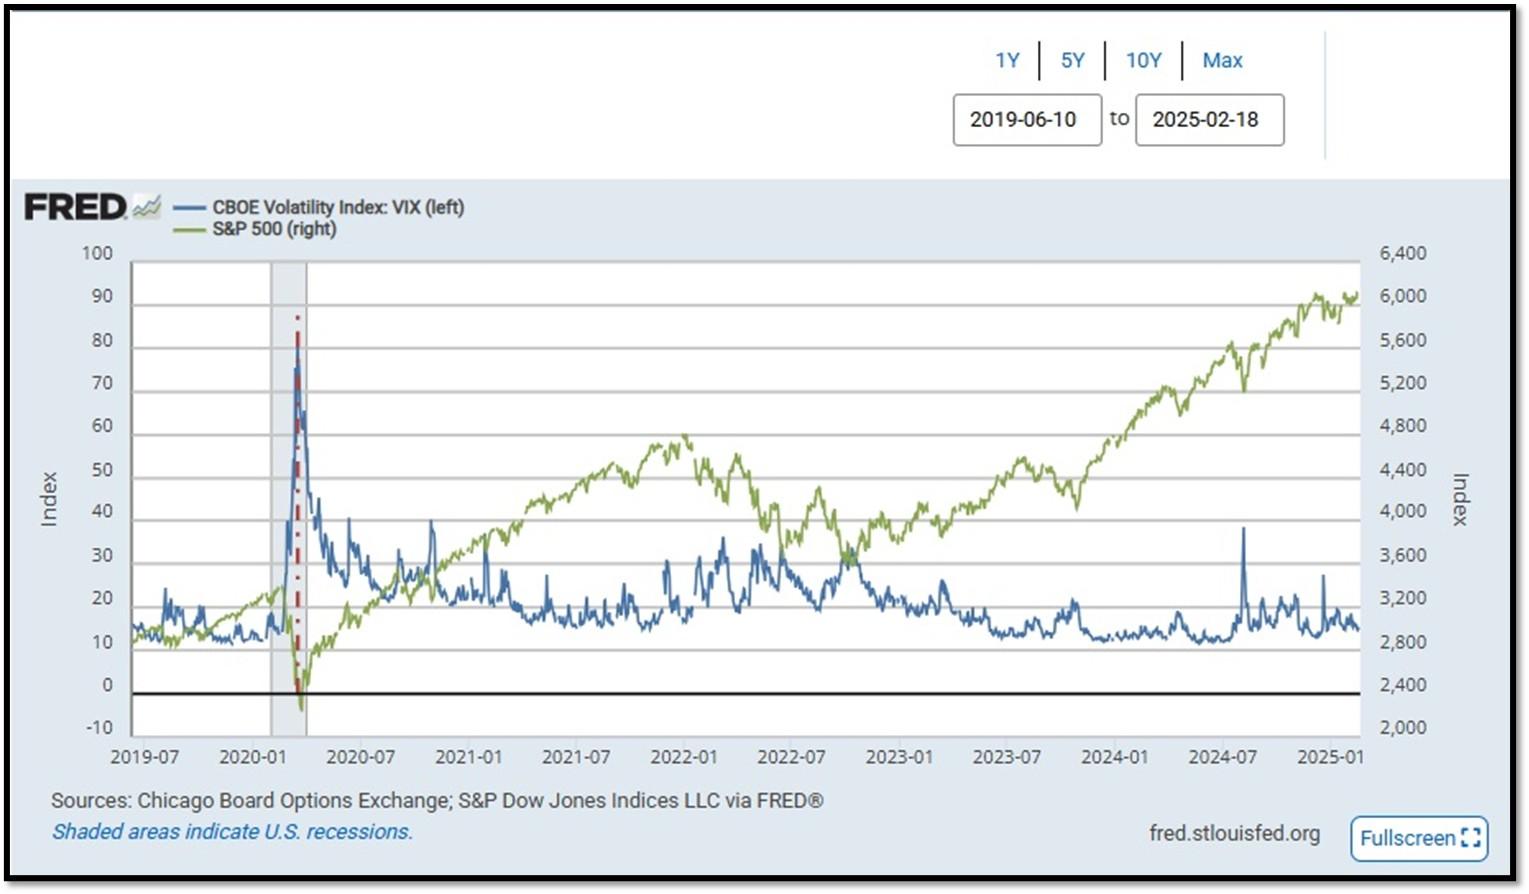
- S&P500 and CBOE Volatility Index (VIX) as of 2/18/2025. REF: FRED, Today’s Print
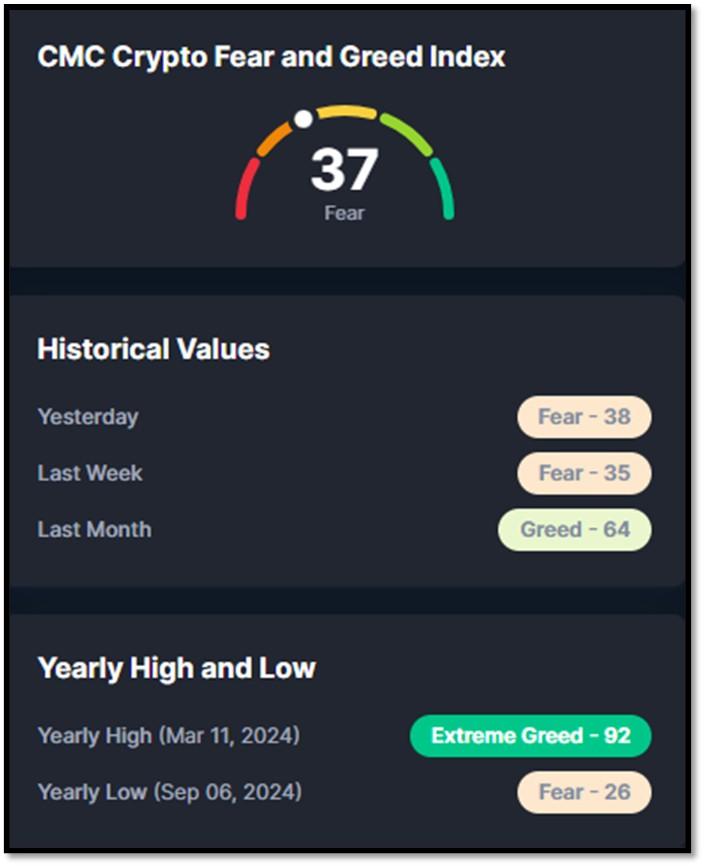
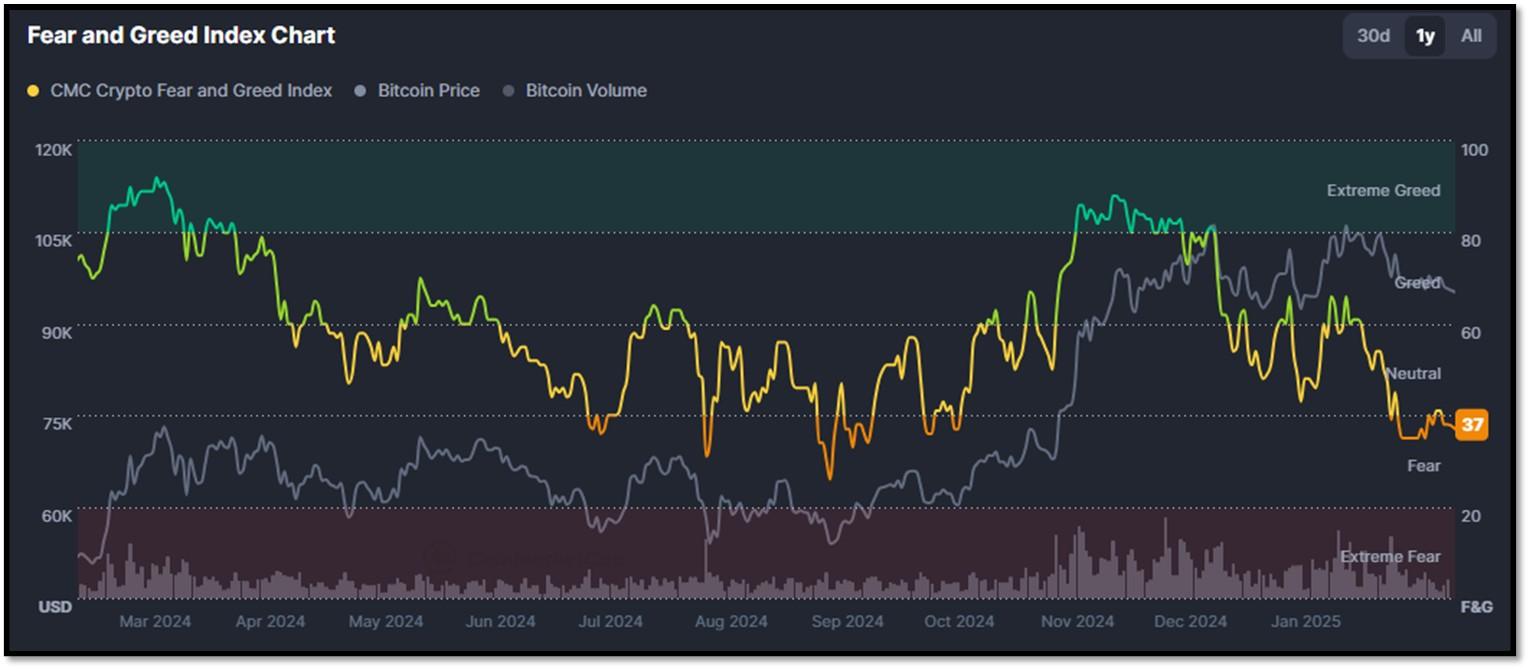
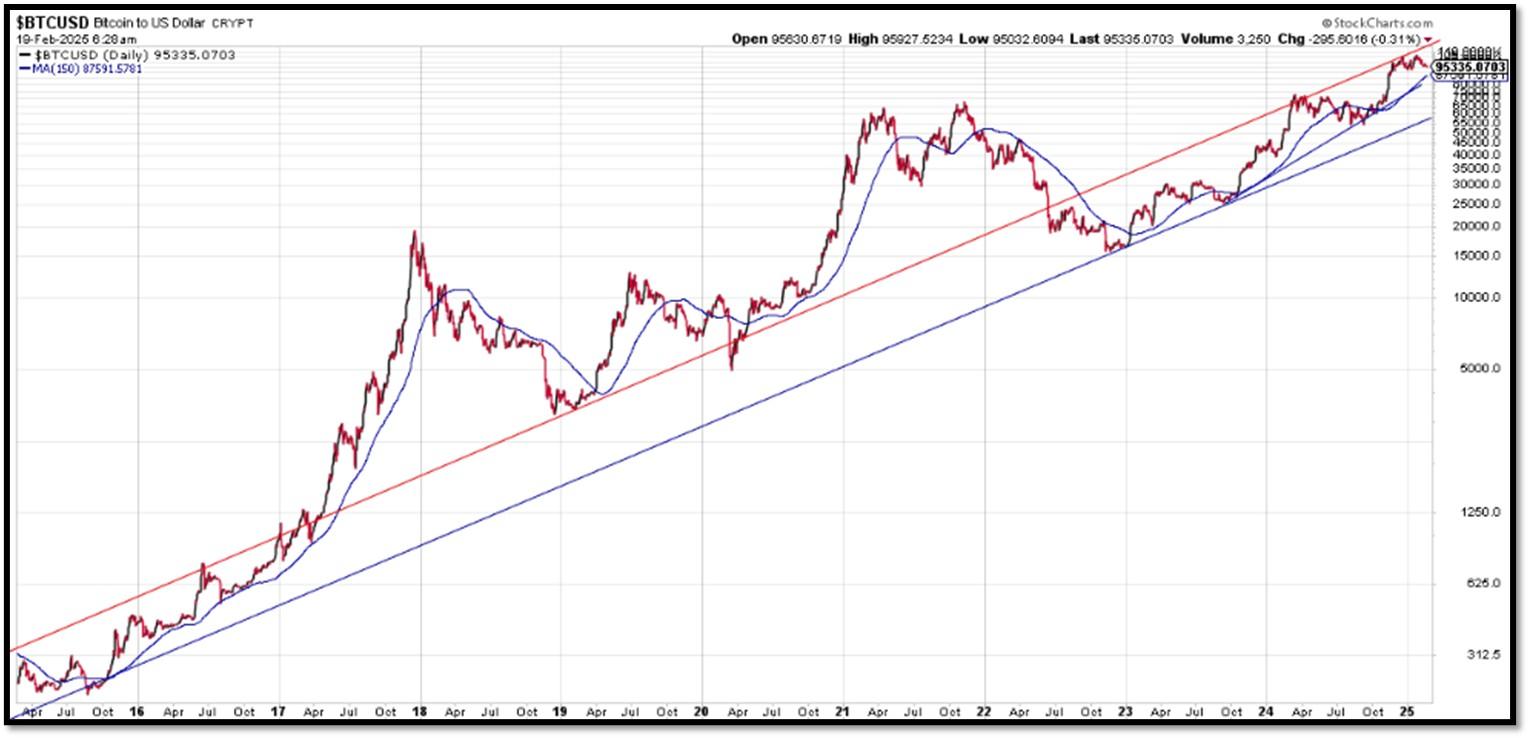
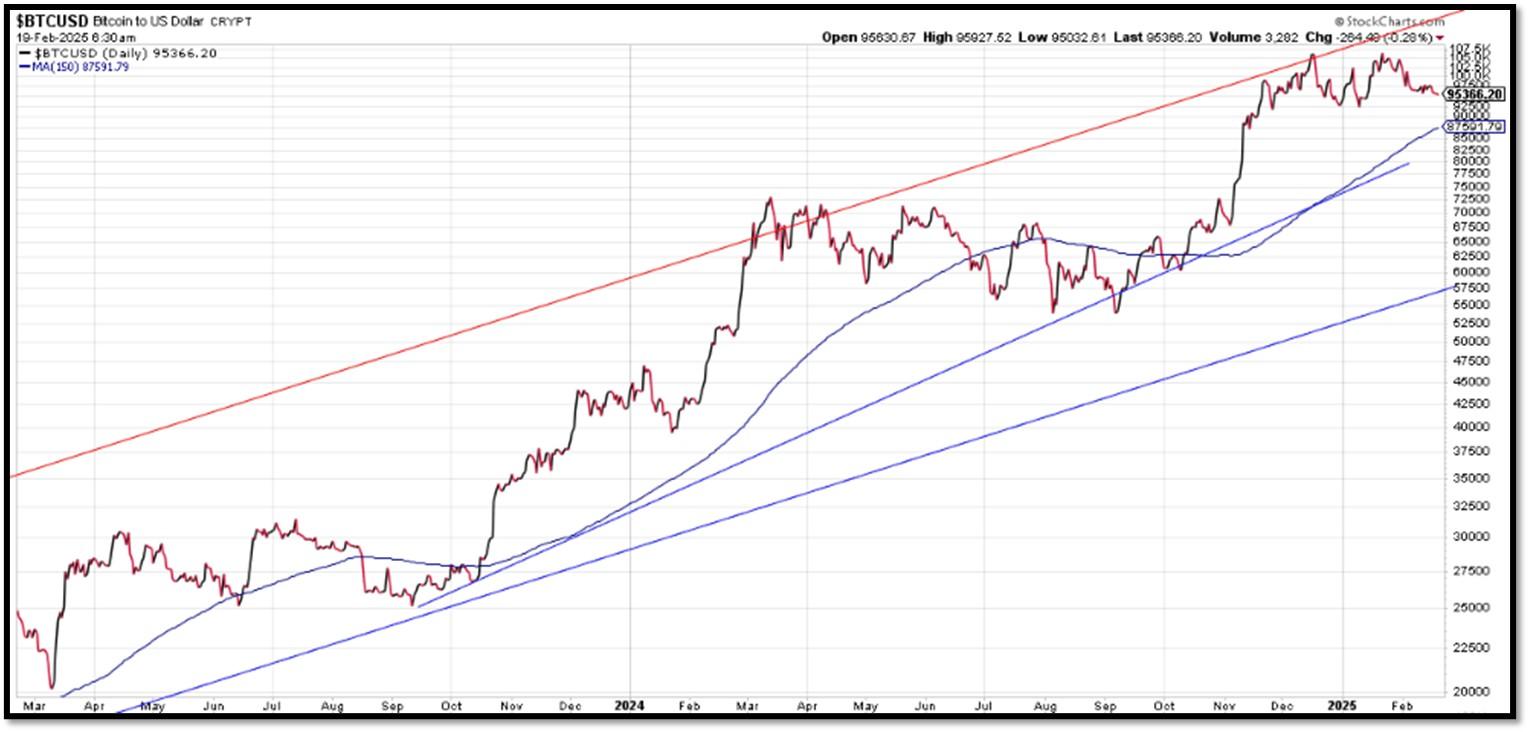
5M. Most recent read on the Crypto Fear & Greed Index with data as of 2/18/2025 is 47 (Neutral). Last week’s data was 72 (Greed) (1-100). Fear & Greed Index – A Contrarian Data. The crypto market behavior is very emotional. People tend to get greedy when the market is rising which results in FOMO (Fear of missing out). Also, people often sell their coins in irrational reaction of seeing red numbers. With the Crypto Fear and Greed Index, the data try to help save investors from their own emotional overreactions. There are two simple assumptions:
- Extreme fear can be a sign that investors are too worried. That could be a buying opportunity.
- When Investors are getting too greedy, that means the market is due for a correction.
Therefore, the program for this index analyzes the current sentiment of the Bitcoin market and crunch the numbers into a simple meter from 0 to 100. Zero means “Extreme Fear”, while 100 means “Extreme Greed”. REF: Coinmarketcap.com, Today’sReading
Bitcoin – 10-Year & 2-Year Charts. REF: Stockcharts10Y, Stockcharts2Y
From the desk of our Chief Investment Officer
As an investment professional with over twenty-six years of experience in the financial services industry, Andrew helps clients to protect, grow and transfer wealth during their lifetime with objective, unbiased, customized and efficient strategies.
Education, Professional Licenses Acquired & Affiliations
- Passed the Series 7, 63, 65 and 24 license examinations
- Currently holding Series 65 License
- BA in Economics – Boston University (Boston, MA) 1993
- Certificate in Commodities Trading – New York University (New York, NY) 1991
- Certificate in Financial Planning – New York University (New York, NY) April 2011
With extensive experience in the Financial Services Industry, Andrew Tang and Turner Financial Group provides disciplined wealth management with an intelligent caring approach to each and every client that compliments the Dedicated Financial offering.


Len writes much of his own content, and also shares helpful content from other trusted providers like Turner Financial Group (TFG).
The material contained herein is intended as a general market commentary, solely for informational purposes and is not intended to make an offer or solicitation for the sale or purchase of any securities. Such views are subject to change at any time without notice due to changes in market or economic conditions and may not necessarily come to pass. This information is not intended as a specific offer of investment services by Dedicated Financial and Turner Financial Group, Inc.
Dedicated Financial and Turner Financial Group, Inc., do not provide tax, legal or accounting advice. You should consult your own tax, legal and accounting advisors before engaging in any transaction.
Any hyperlinks in this document that connect to Web Sites maintained by third parties are provided for convenience only. Turner Financial Group, Inc. has not verified the accuracy of any information contained within the links and the provision of such links does not constitute a recommendation or endorsement of the company or the content by Dedicated Financial or Turner Financial Group, Inc. The prices/quotes/statistics referenced herein have been obtained from sources verified to be reliable for their accuracy or completeness and may be subject to change.
Past performance is no guarantee of future returns. Investing involves risk and possible loss of principal capital. The views and strategies described herein may not be suitable for all investors. To the extent referenced herein, real estate, hedge funds, and other private investments can present significant risks, including loss of the original amount invested. All indexes are unmanaged, and an individual cannot invest directly in an index. Index returns do not include fees or expenses.
Turner Financial Group, Inc. is an Investment Adviser registered with the United States Securities and Exchange Commission however, such registration does not imply a certain level of skill or training and no inference to the contrary should be made. Additional information about Turner Financial Group, Inc. is also available at www.adviserinfo.sec.gov. Advisory services are only offered to clients or prospective clients where Turner Financial Group, Inc. and its representatives are properly licensed or exempt from licensure. No advice may be rendered by Turner Financial Group, Inc. unless a client service agreement is in place.


