

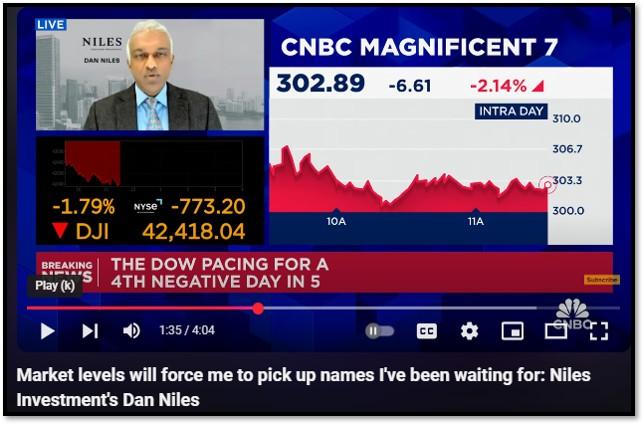
1. Recent turbulence in the stock market has undoubtedly sparked anxiety among investors, with sharp selloffs prompting fears of economic collapse. However, the world is far from falling apart.
Market corrections, while unsettling, are a natural part of economic cycles and often serve as a reset rather than a harbinger of doom. The global economy continues to demonstrate resilience, underpinned by stable fundamentals such as low unemployment in many regions, manageable inflation, and sustained consumer spending. Central banks, though navigating complex terrain, remain vigilant, adjusting policies to maintain balance. Rather than signaling an impending catastrophe, these fluctuations reflect short-term uncertainty—often driven by sentiment or geopolitical noise—against a backdrop of enduring structural strength. Still stressed-out? I recommend replacing the word “Tariff” with “Import Tax…”
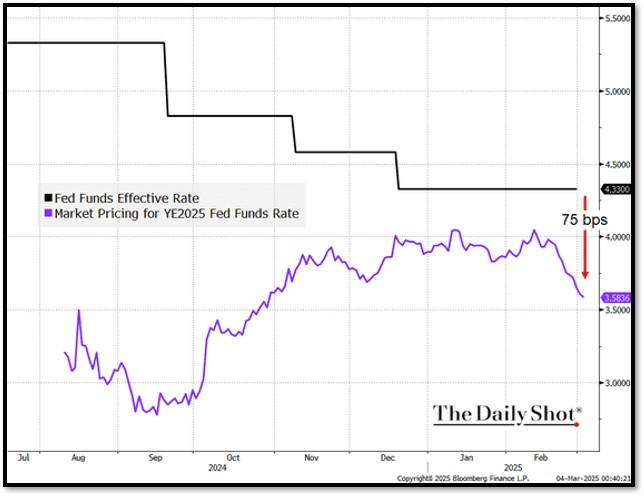
On the flip side, this dip presents a compelling buying opportunity for those with a longer-term perspective. The macroeconomic environment remains benign, with no immediate signs of systemic collapse, and growth continues to be fueled by innovation and technological advances. Sectors like artificial intelligence, renewable energy, and biotechnology are driving an ongoing expansion, creating new markets and efficiencies that bolster economic potential. Valuations, previously stretched in some areas, are now more attractive, offering entry points for investors to capitalize on companies poised for future gains. Far from a crisis, this moment underscores the cyclical nature of markets and the opportunities that arise for those who can see beyond the headlines. In addition, the market now fully pricing in 3 Fed rate cuts this year (See chart further below). Click onto picture below to access video. REF: CNBC, DailyShot
The market now fully pricing in 3 Fed Rate Cuts this year.
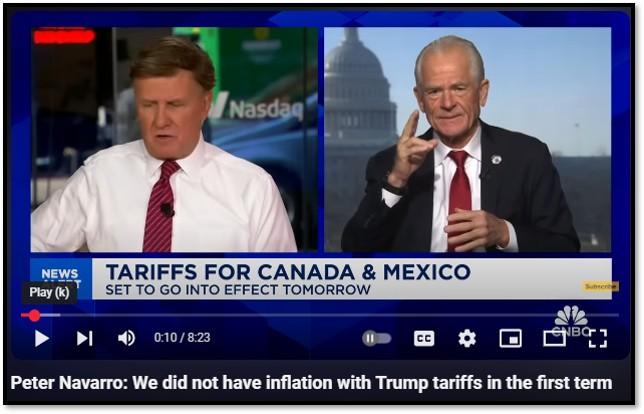
2. During Donald Trump’s first term (2017-2021), tariffs on goods like steel, aluminum, and Chinese imports aimed to protect U.S. industries and jobs. Studies show they had little effect on inflation but slightly hurt GDP.
Inflation Impact: The tariffs imposed during Trump’s first term had a limited and mostly temporary effect on inflation. Consumer Price Index (CPI) data from the U.S. Bureau of Labor Statistics shows inflation remained low and stable: averaging 1.9% annually (2017-2020), per BLS CPI data—1.3% in 2017, 2.4% in 2018, 1.8% in 2019, and 1.2% in 2020. Tariffs raised prices for specific items (e.g., washing machines up 12%, steel up 20-30%), but importers absorbed much of the cost, and the U.S.’s low trade-to-GDP ratio (25%) plus Fed policy kept broader inflation in check.
GDP Impact: The Tax Foundation estimates 2018-2019 tariffs cut GDP by 0.2% ($45 billion yearly), with retaliation (e.g., China’s soybean tariffs) potentially doubling losses to 0.4-0.7%, per the Peterson Institute. Pre-COVID GDP growth averaged 2.5% (2017-2019), below historical norms, as higher costs and export losses ($27 billion by 2019) offset tax-cut gains, dragging long-term growth projections to 1.7-2.0% through 2027. The tariffs’ impact on GDP was negative but modest, driven by higher input costs, reduced export competitiveness, and retaliatory measures from trading partners. Click onto picture below to access video. REF: BLS, BEA, CNBC
3. This week, we feature commentary from Dean Smith of FolioBeyond on the current market environment.
Below is a shortened version of my interpretation. Click the reference link for the full article. We currently use FolioBeyond as part of our investment solutions in several investment strategies. REF: FolioBeyond, DeanSmithMktCommentary
The market outlook highlights the uncertainty created by the Trump administration’s policies, particularly in financial regulation, trade, and taxation. One key policy shift is the potential reduction or elimination of the Consumer Financial Protection Bureau (CFPB), which could lead to less regulatory oversight in financial services. Additionally, the administration’s aggressive tariff policies could disrupt trade with Canada, Mexico, and other partners, increasing uncertainty in financial markets. Another notable shift is a more pro-cryptocurrency stance, including the easing of regulations on crypto-related securities.
Economic concerns are further compounded by the administration’s proposed U.S. Sovereign Wealth Fund, which

remains unclear in its funding and objectives, as well as the ongoing debate over managing the $36 trillion federal debt. Treasury Secretary Scott Bessent’s continuation of short-term debt refinancing could keep interest rate volatility high. Meanwhile,
proposed tax cuts, including eliminating taxes on tips, overtime, and Social Security benefits, would add to the deficit. Overall, the report suggests that the lack of fiscal discipline and rising debt levels will keep interest rates elevated, making a meaningful decline in rates unlikely through 2026. Investors are urged to reduce exposure to volatility, particularly in long-term fixed-income assets, given the unpredictable economic and political landscape.
**With the current macro-economic backdrop, below are areas we currently favor:
- Fixed Income – Short-term Corporates (Low-Beta)
- Fixed Income – Corporates High Yield as Opportunistic Allocation (Low-Beta)
- Businesses that contribute to and benefit from AI & Automation (Market-Risk)
- Communications (Market-Risk)
- Financials (Market-Risk)
- Small Cap & Mid Cap Stocks (Market-Risk)
- Biotechnology (Market-Risk)
- Gold & Digital Asset – Bitcoin (Market-Risk/Hedge)
4. World Watch
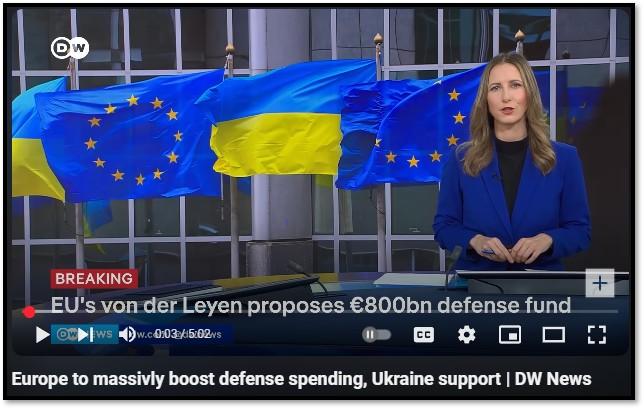
4A. The European Union’s proposal for a $158 billion military fund according to The Wall Street Journal, marks a significant shift in defense policy, largely driven by uncertainty over U.S. support for Ukraine and growing security concerns. This increased government spending will have notable economic and geopolitical consequences, though its potential to drive global economic expansion remains uncertain.
In the short term, higher military expenditures will stimulate the European defense industry, benefiting companies in aerospace, engineering, and technology. This could create jobs and increase demand for military-related manufacturing. However, increased government spending without corresponding revenue sources could contribute to inflationary pressures, forcing the European Central Bank (ECB) to maintain higher interest rates, potentially slowing broader economic growth. Additionally, many EU nations already face high debt levels, and further borrowing may lead to long-term fiscal challenges. The global impact of this spending depends on its broader economic spillover. Increased military production within Europe may reduce reliance on U.S. and foreign suppliers, shifting trade balances. While military investment does not directly stimulate consumer spending, technological advancements in defense—such as AI, cybersecurity, and energy innovations—could later benefit civilian industries. Click onto picture below to access video. REF: WSJ, DW
4B. As of 2024, Japan and China remain the two largest foreign holders of U.S. Treasuries, but their holdings have declined in recent years. Other countries, particularly in Europe, the Middle East, and emerging markets, have increased their ownership.
The top holders of U.S. Treasuries (approximate values as of late 2023 to early 2024, subject to change) are:
- Japan – ~$1.1 trillion (largest holder, though declining over time)
- China – ~$800 billion (significant decline due to economic concerns and geopolitical tensions)
- United Kingdom – ~$700 billion (London is a major financial hub for treasury transactions)
- Belgium – ~$350 billion (often linked to Chinese investments via Euroclear)
- Luxembourg – ~$350 billion (another financial hub for offshore investments)
- Switzerland – ~$300 billion
- Cayman Islands – ~$290 billion (offshore hedge funds and investment firms)
- Taiwan – ~$250 billion
- India – ~$140 billion (gradually increasing holdings)
- Saudi Arabia – ~$130 billion (petrodollar recycling)
Foreign ownership of U.S. Treasuries has undergone notable changes, influenced by economic conditions and geopolitical factors. Japan, historically the largest holder, has reduced its holdings as rising domestic bond yields make Japanese bonds more attractive. China’s holdings have also declined significantly, driven by U.S.-China tensions, economic slowdown, and diversification into gold and other assets. While China pulls back, European financial hubs like the U.K., Belgium, and Luxembourg have increased their holdings, often acting as intermediaries for hedge funds and other investors. Additionally, Gulf nations, including Saudi Arabia, continue investing in Treasuries due to petrodollar agreements and economic stability concerns. Despite worries about declining Chinese demand, strong investment from U.S. institutions, the Federal Reserve, and other foreign buyers has helped sustain Treasury demand, especially as higher U.S. interest rates attract more investors. REF: BARRON’S, FederalReserve
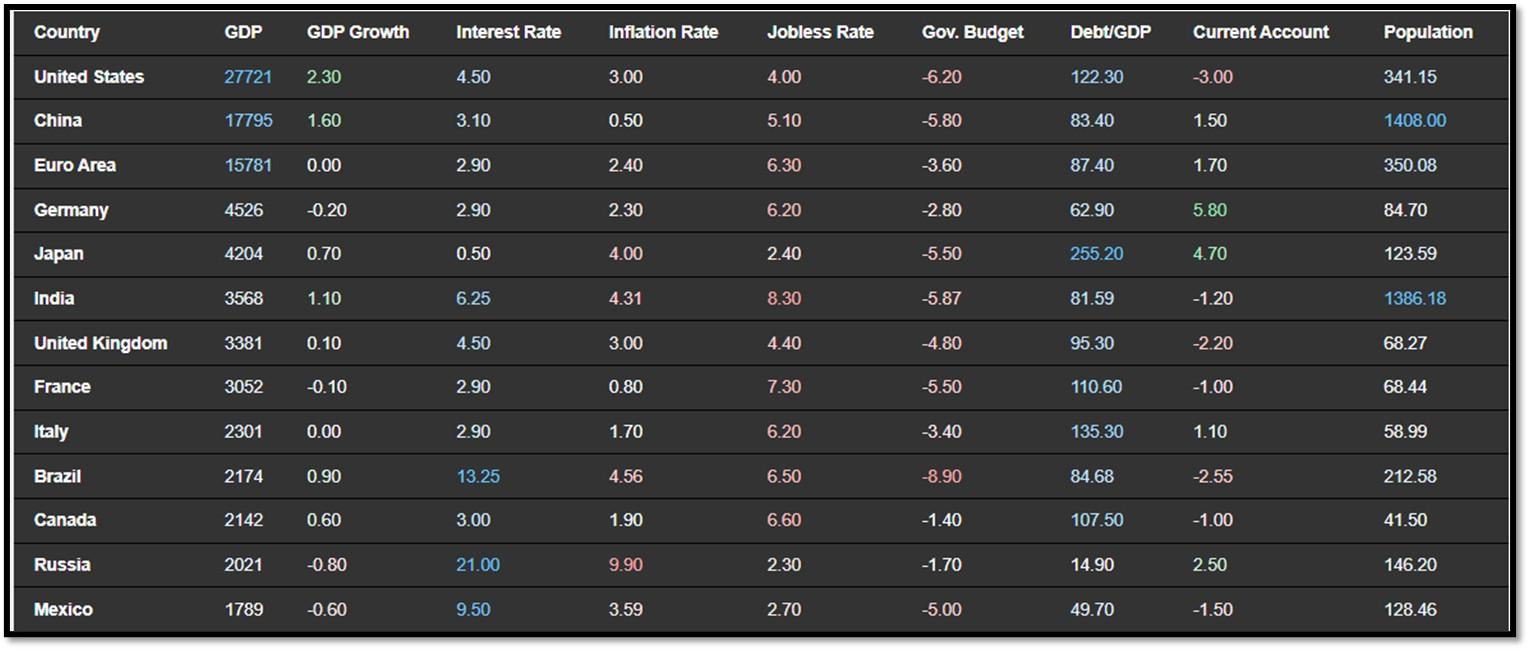
4C. Below is an updated snapshot of the current global state of economy according to TradingEconomics as of 3/3/2025. REF: TradingEconomics
- The annual inflation rate in France slowed sharply to 0.8% in February 2025, the lowest since February 2021, compared to 1.7% in January and market expectations of 1%, preliminary estimates showed.
- The annual inflation rate in Italy rose to 1.7% in February of 2025 from 1.5% in the previous month, in line with market expectations, according to a preliminary estimate.
- The unemployment rate in Brazil jumped to 6.5% in the moving quarter ending in January 2025 from 6.2% in the three-month period to October 2024, the highest in five months, and loosely in line with market expectations of 6.6%.
- The Canadian GDP rose by 0.6% over a quarter in the three months to December of 2024, following an upwardly revised 0.3% increase in the prior period.
5. Quant & Technical Corner
Below is a selection of quantitative & technical data we monitor on a regular basis to help gauge the overall financial market conditions and the investment environment.
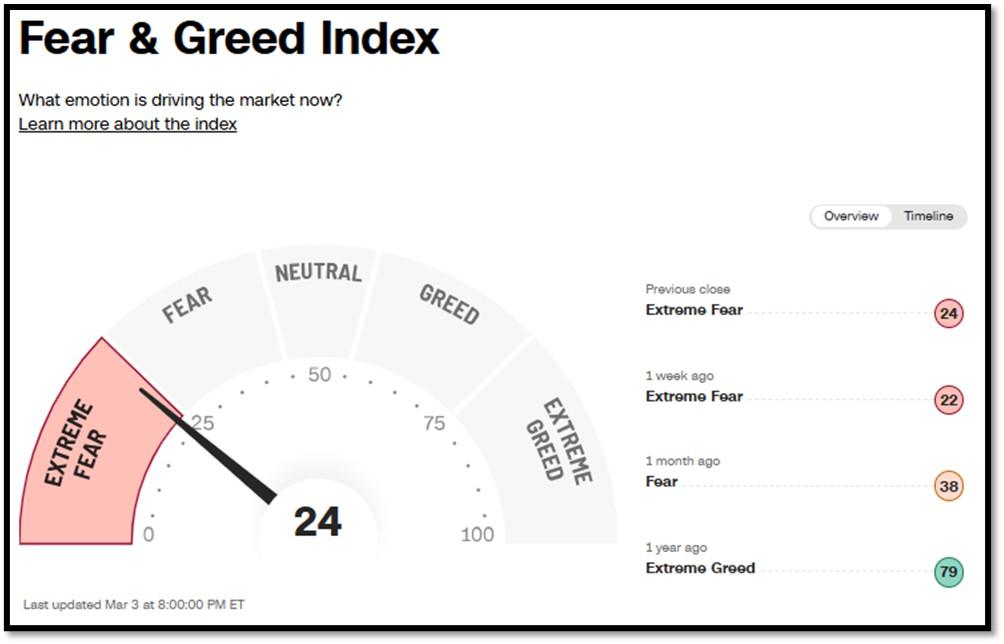
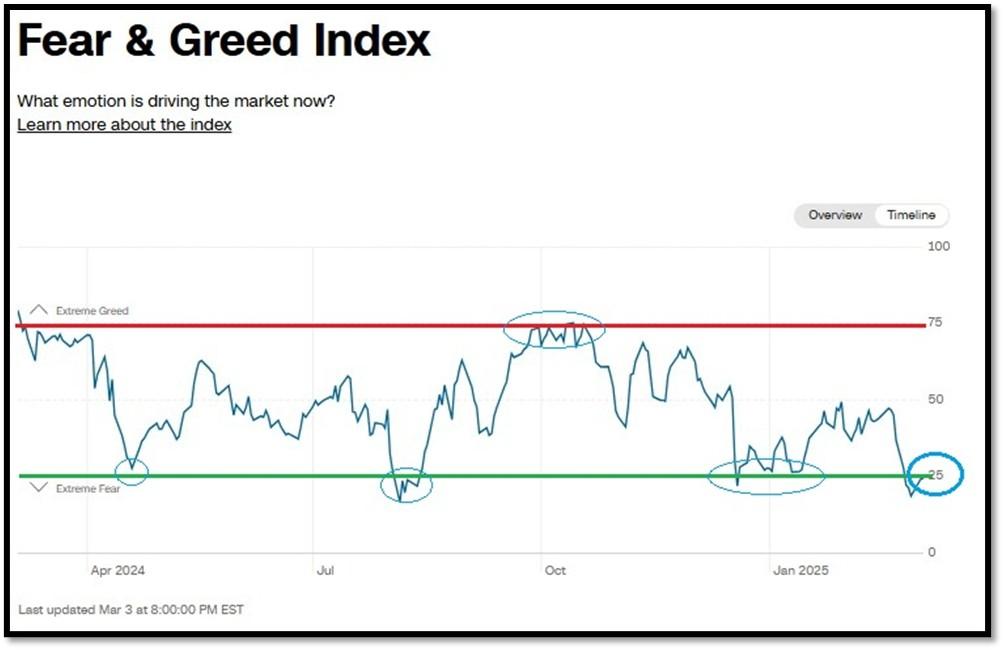
5A. Most recent read on the Fear & Greed Index with data as of 3/3/2025 – 8:00PM-ET is 24 (Extreme Fear). Last week’s data was 22 (Extreme Fear) (1-100). CNNMoney’s Fear & Greed index looks at 7 indicators (Stock Price Momentum, Stock Price Strength, Stock Price Breadth, Put and Call Options, Junk Bond Demand, Market Volatility, and Safe Haven Demand). Keep in mind this is a contrarian indicator! REF: Fear&Greed via CNNMoney
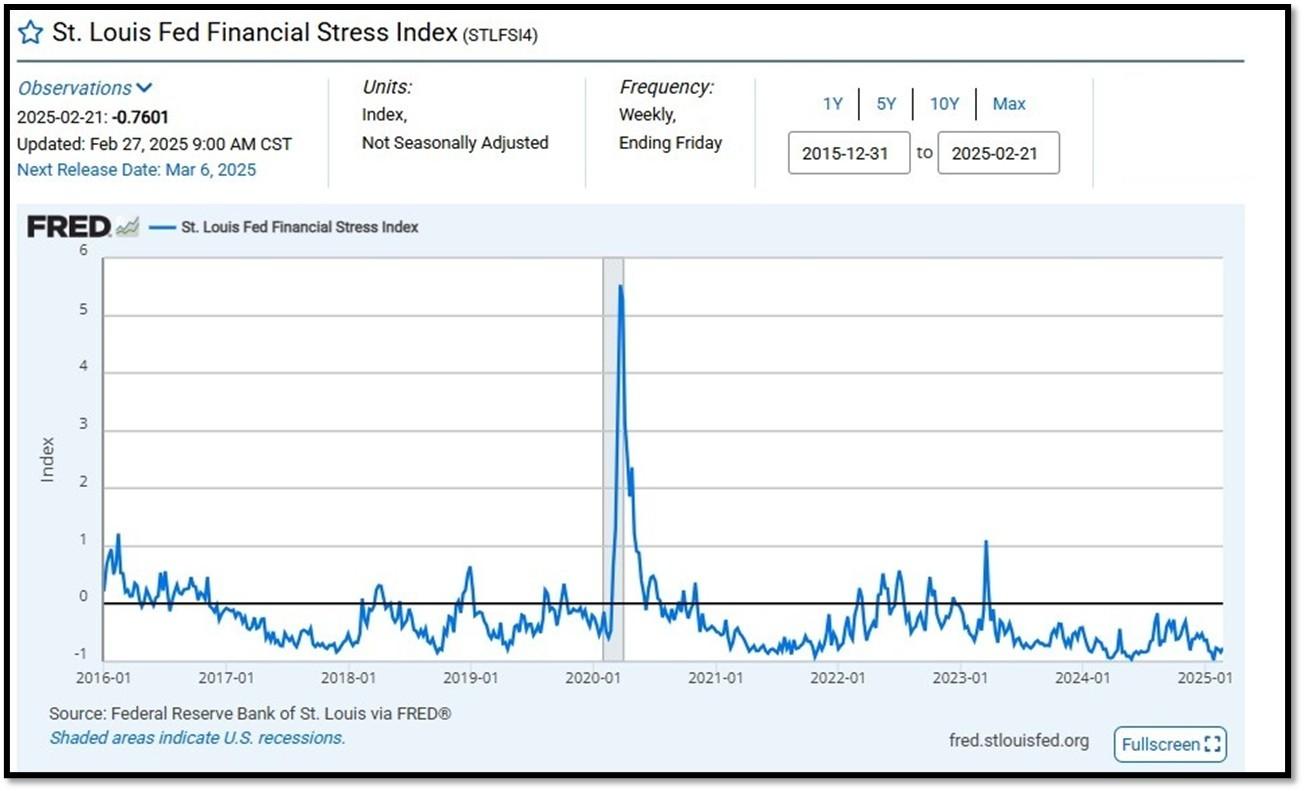
5B. St. Louis Fed Financial Stress Index’s (STLFSI4) most recent read is at –0.7601 as of February 27, 2025. Previous week’s data was -0.8378. A big spike up from previous readings reflecting the turmoil in the banking sector back in 2023. This weekly index is not seasonally adjusted. The STLFSI4 measures the degree of financial stress in the markets and is constructed from 18 weekly data series: seven interest rate series, six yield spreads and five other indicators. Each of these variables captures some aspect of financial stress. Accordingly, as the level of financial stress in the economy changes, the data series are likely to move together. REF: St. Louis Fed
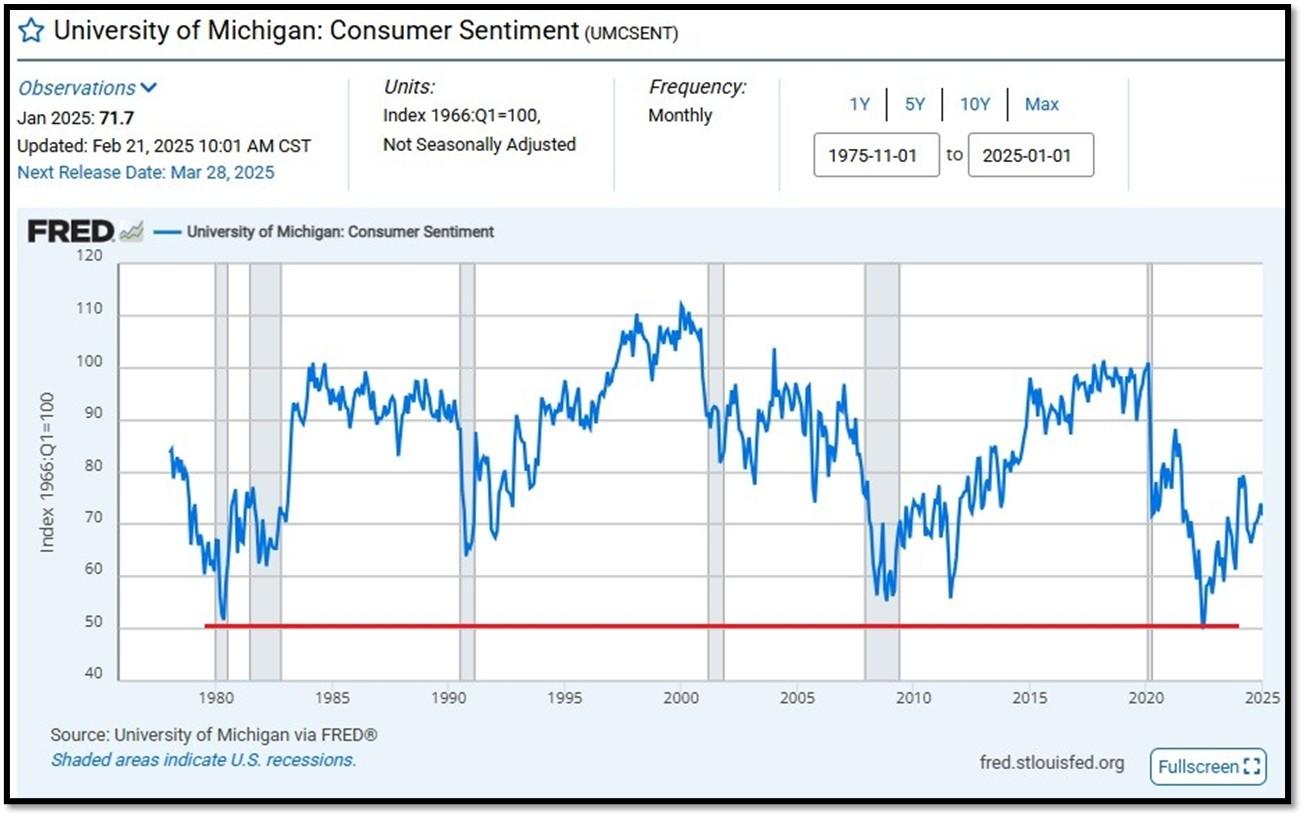
5C. University of Michigan, University of Michigan: Consumer Sentiment for January [UMCSENT] at 71.7, retrieved from FRED, Federal Reserve Bank of St. Louis, February 21, 2025. Back in June 2022, Consumer Sentiment hit a low point going back to April 1980. REF: UofM
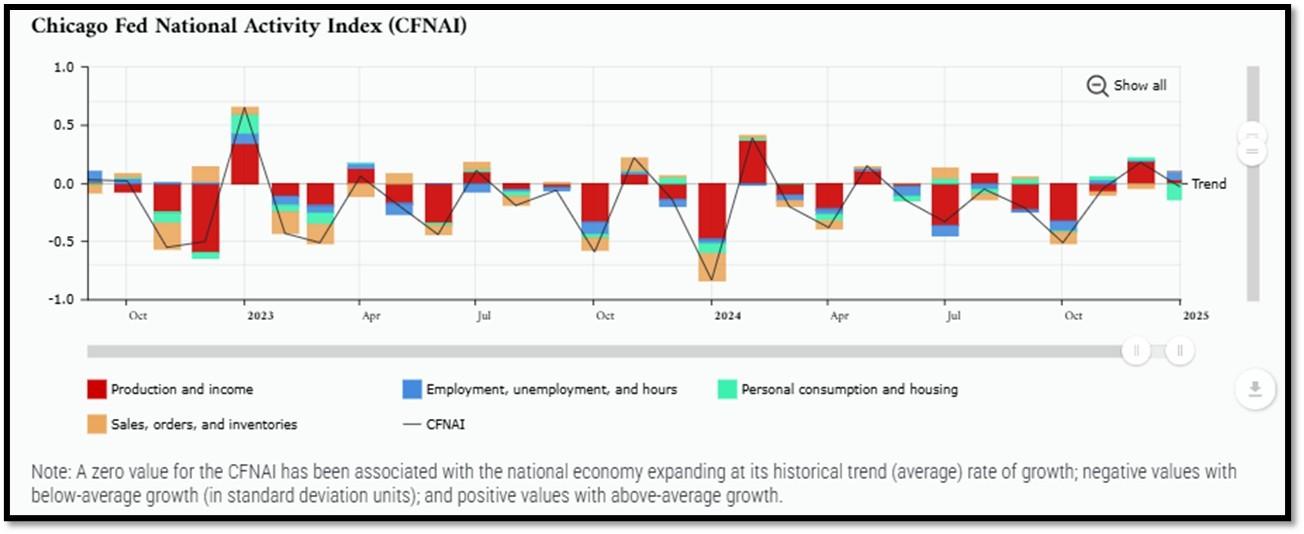
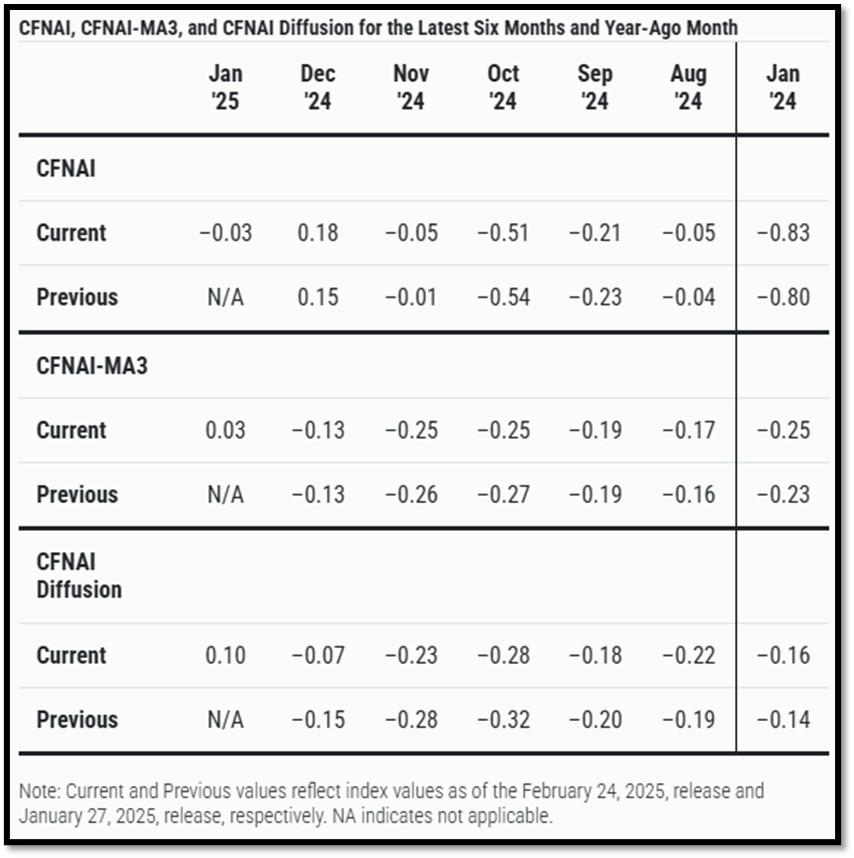
5D. The Chicago Fed National Activity Index (CFNAI) decreased to –0.03 in January from +0.18 in December. Two of the four broad categories of indicators used to construct the index decreased from December, and one category made a negative contribution in January. The index’s three-month moving average, CFNAI-MA3, increased to +0.03 in January from –0.13 in December. REF: ChicagoFed, January’s Report
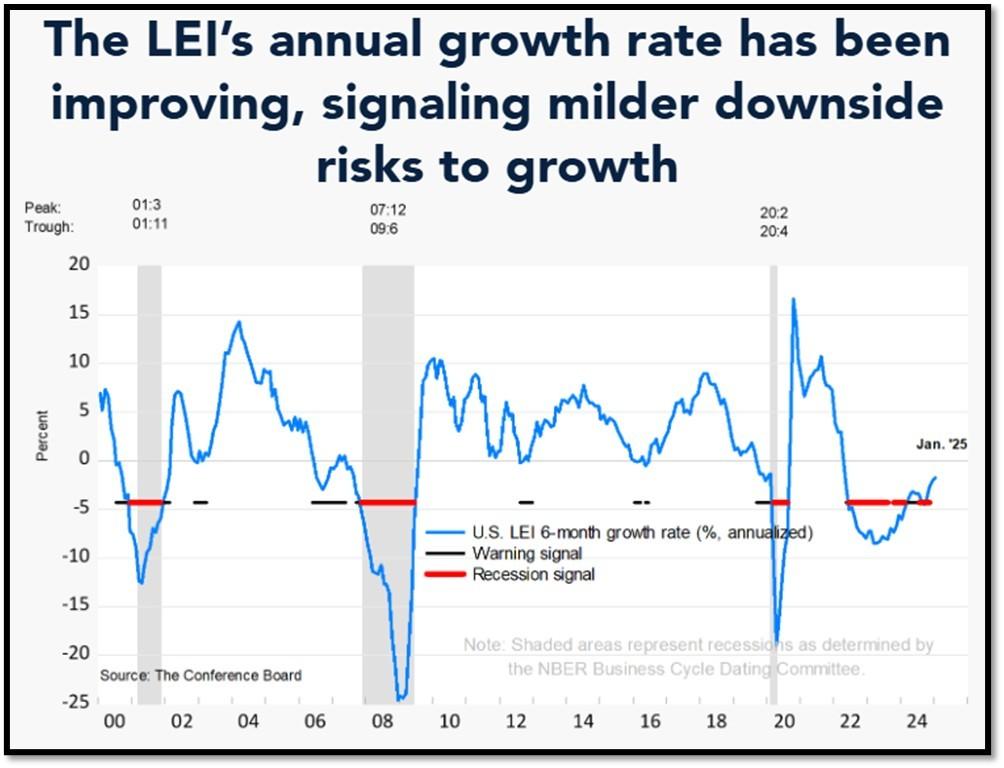
5E. (2/20/2025) The Conference Board Leading Economic Index (LEI) for the US fell by 0.3% in January 2025 to 101.5 (2016=100), after a 0.1% increase in December 2024 (upwardly revised from an initially estimated decline of 0.1%). Overall, the LEI recorded a 0.9% decline in the six-month period ending January 2025, much less than its 1.7% decline over the previous six months. The composite economic indexes are the key elements in an analytic system designed to signal peaks and troughs in the business cycle. The indexes are constructed to summarize and reveal common turning points in the economy in a clearer and more convincing manner than any individual component. The CEI is highly correlated with real GDP. The LEI is a predictive variable that anticipates (or “leads”) turning points in the business cycle by around 7 months. Shaded areas denote recession periods or economic contractions. The dates above the shaded areas show the chronology of peaks and troughs in the business cycle. The ten components of The Conference Board Leading Economic Index® for the U.S. include: Average weekly hours in manufacturing; Average weekly initial claims for unemployment insurance; Manufacturers’ new orders for consumer goods and materials; ISM® Index of New Orders; Manufacturers’ new orders for nondefense capital goods excluding aircraft orders; Building permits for new private housing units; S&P 500® Index of Stock Prices; Leading Credit Index™; Interest rate spread (10-year Treasury bonds less federal funds rate); Average consumer expectations for business conditions. REF: ConferenceBoard, LEI Report for January (Released on 3/2/2025)
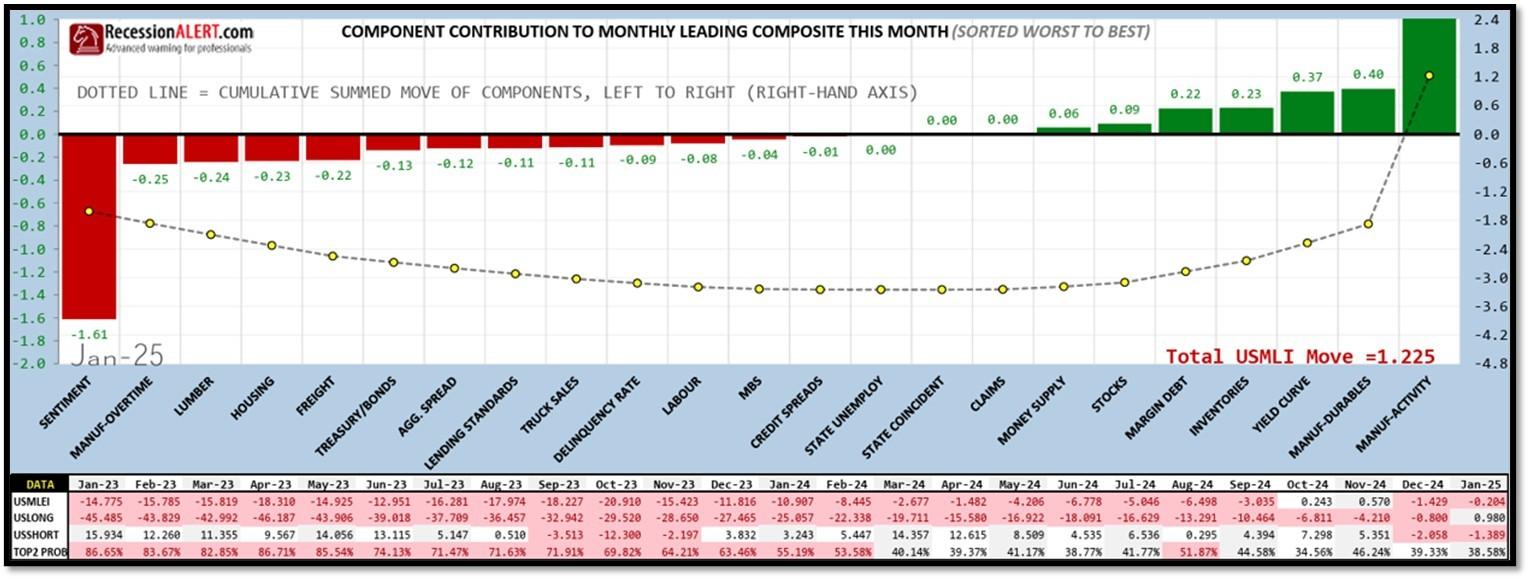
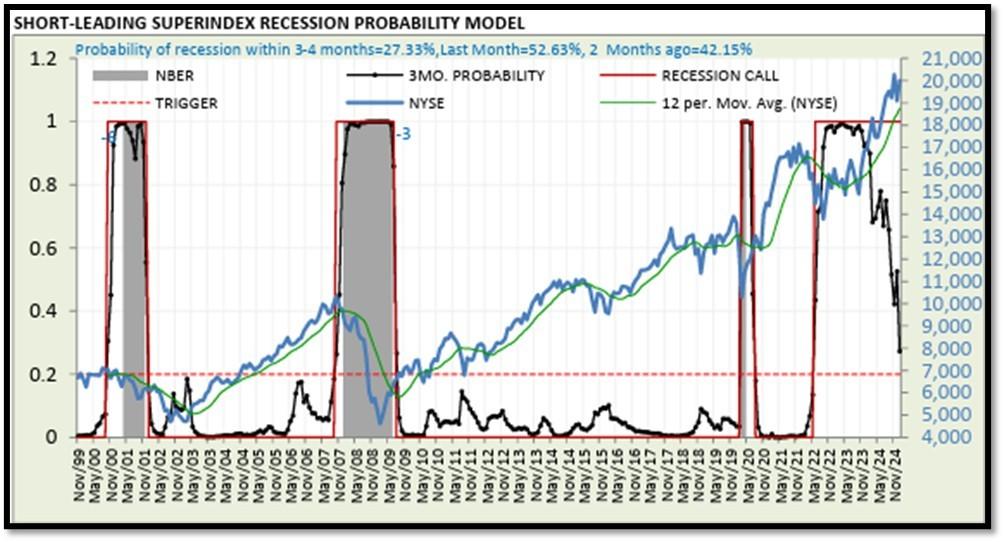
5F. Probability of U.S. falling into Recession within 3 to 4 months is currently at 27.33% (with data as of 02/16/2025 – Next Report 03/03/2025) according to RecessionAlert Research. Last release’s data was at 25.42%. This report is updated every two weeks. REF: RecessionAlertResearch
5G. Yield Curve as of 3/3/2025 is showing Normal. Spread on the 10-yr Treasury Yield (4.17%) minus yield on the 2-yr Treasury Yield (3.95%) is currently at 22 bps. REF: Stockcharts The yield curve—specifically, the spread between the interest rates on the ten-year Treasury note and the three-month Treasury bill—is a valuable forecasting tool. It is simple to use and significantly outperforms other financial and macroeconomic indicators in predicting recessions two to six quarters ahead. REF: NYFED
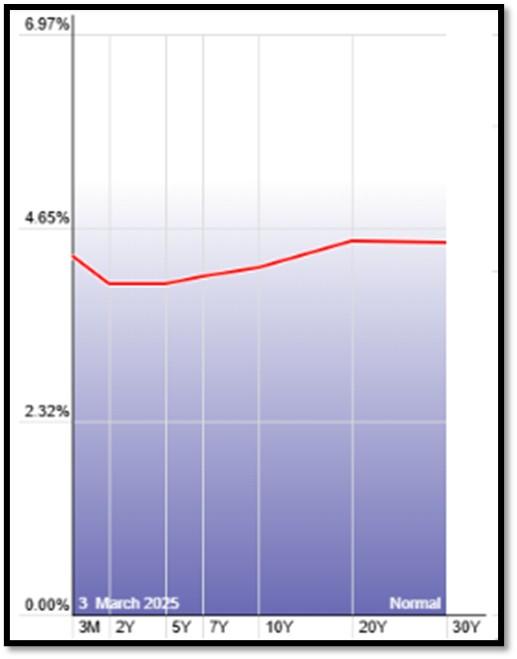
5H. Recent Yields in 10-Year Government Bonds. REF: Source is from Bloomberg.com, dated 3/3/2025, rates shown below are as of 3/3/2025, subject to change.
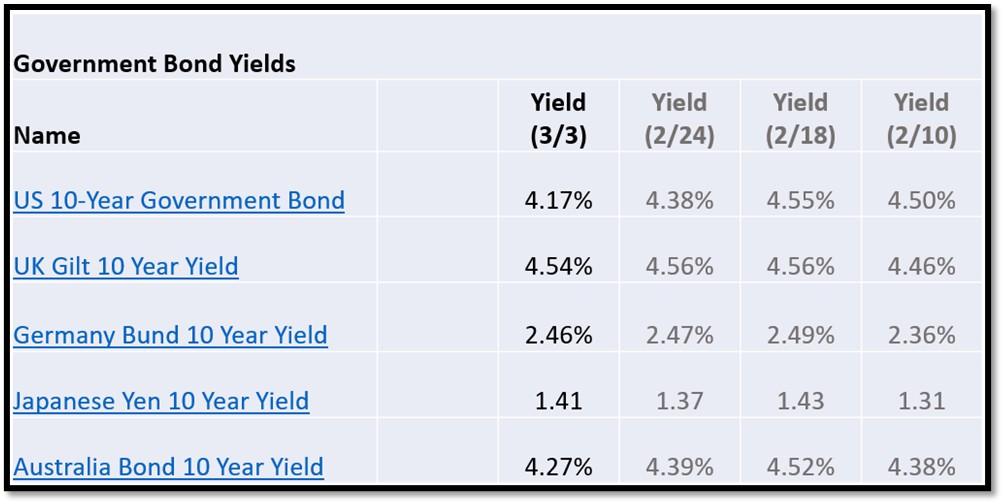
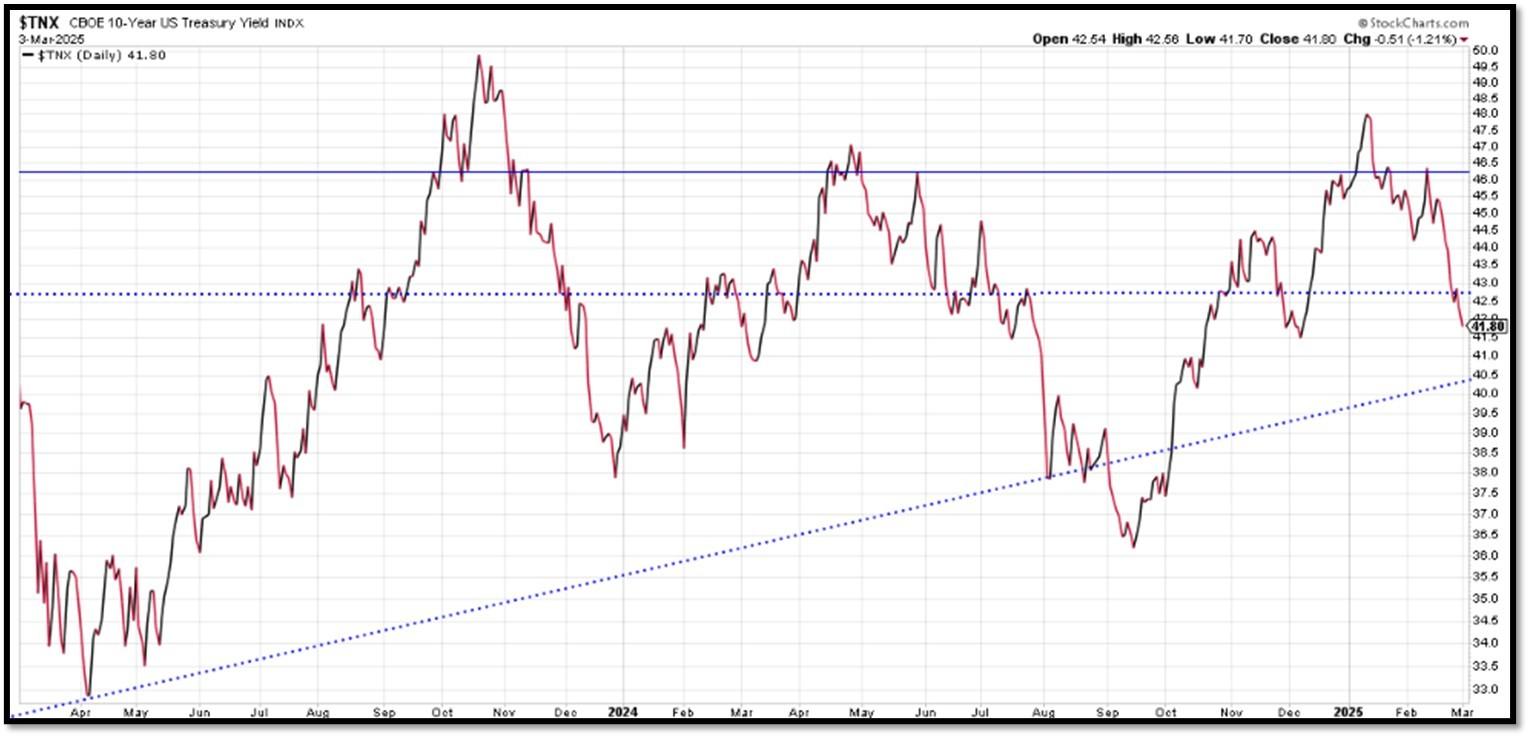
The 10-Year US Treasury Yield… REF: StockCharts1, StockCharts2
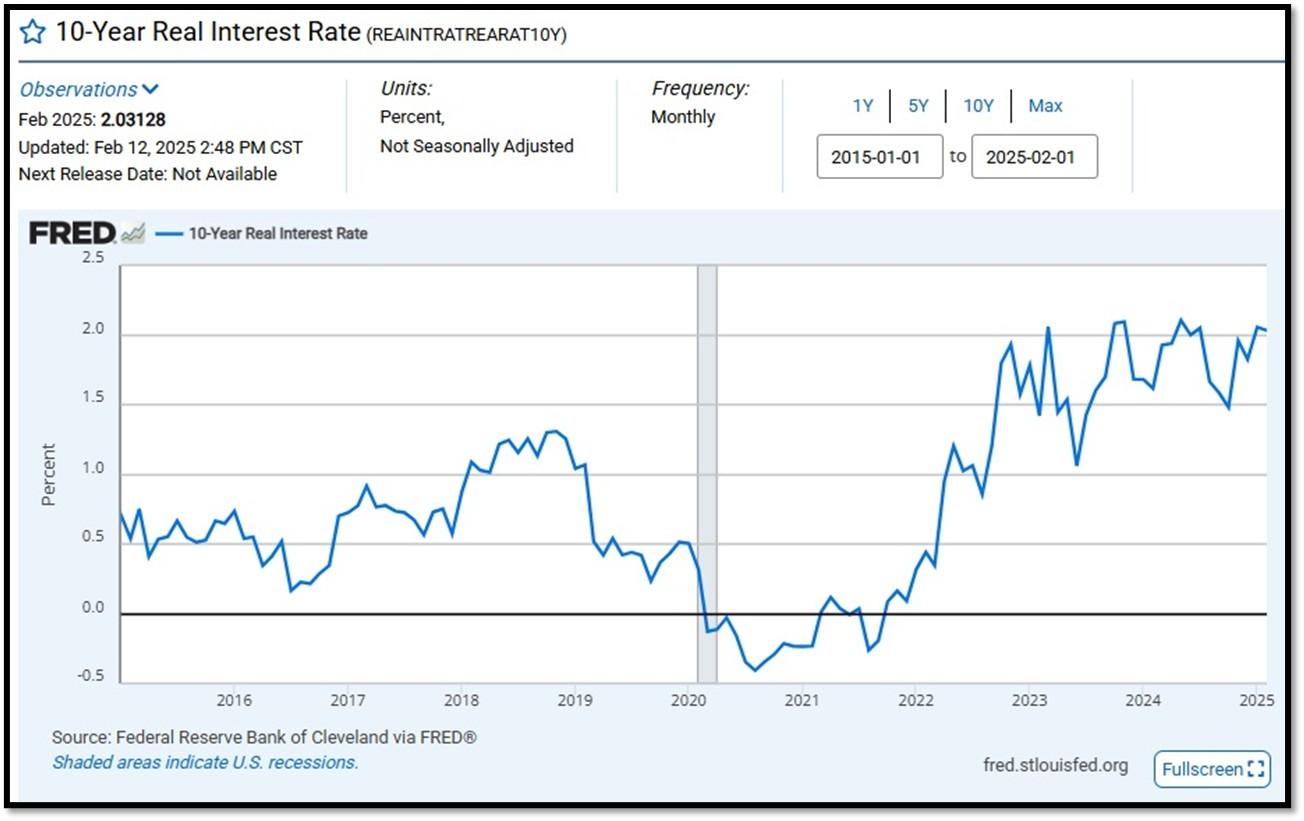
10-Year Real Interest Rate at 2.03128% as of 2/12/25. REF: REAINTRATREARAT10Y
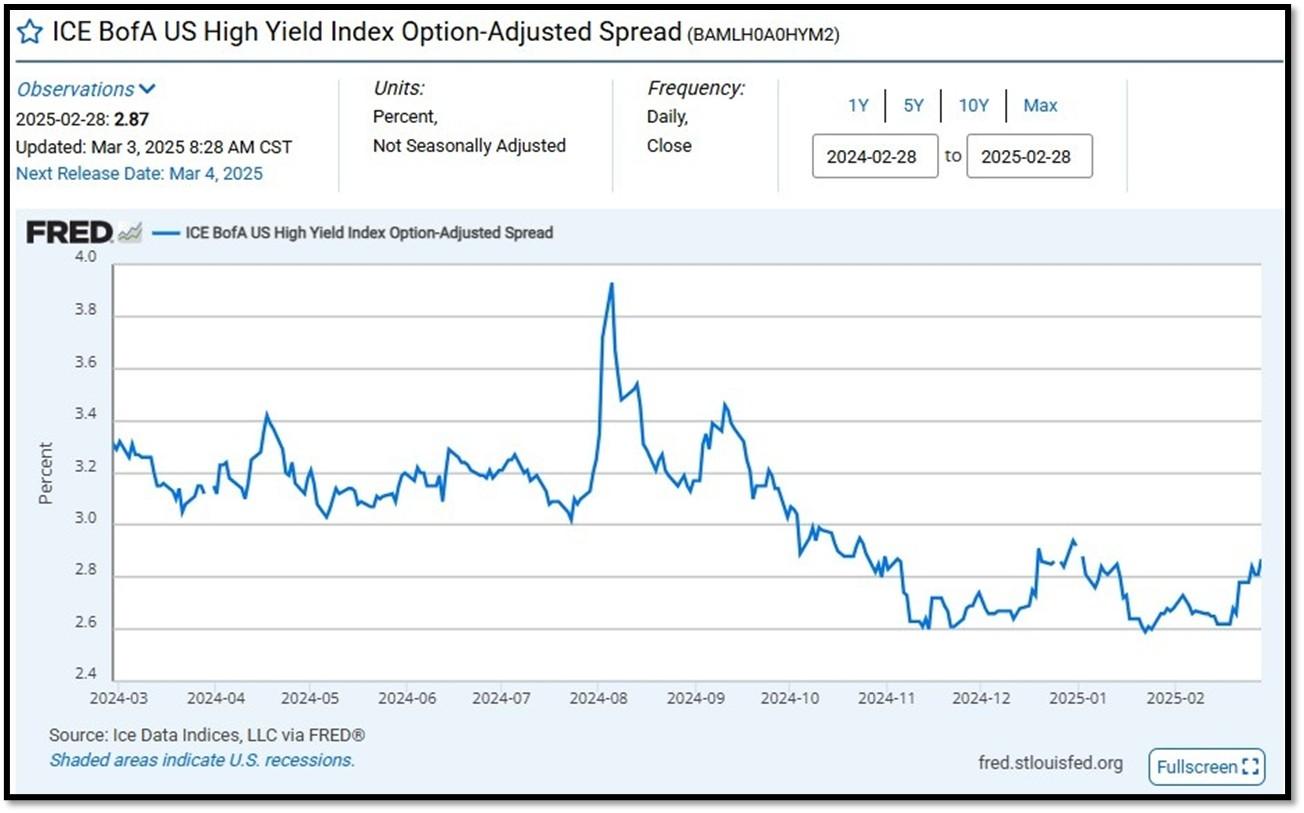
ICE BofA US High Yield Index Option-Adjusted Spread (BAMLH0A0HYM2) currently at 2.87 as of March 3, 2025. This is a key indicator of market sentiment, particularly regarding risk and economic health. At its core, the spread reflects the extra return investors demand to hold riskier corporate debt over safer government securities. High-yield bonds are issued by companies with lower credit ratings (below investment grade, like BB or lower), meaning they carry a higher chance of default. The spread compensates for this risk. When the spread is narrow—say, around 2.5% to 3%, as seen recently—it suggests investors are confident, willing to accept less extra yield because they perceive lower default risk or a strong economy. Narrow spreads often align with bullish markets, where cash is flowing, growth is steady, and fear is low. REF: FRED-BAMLH0A0HYM2
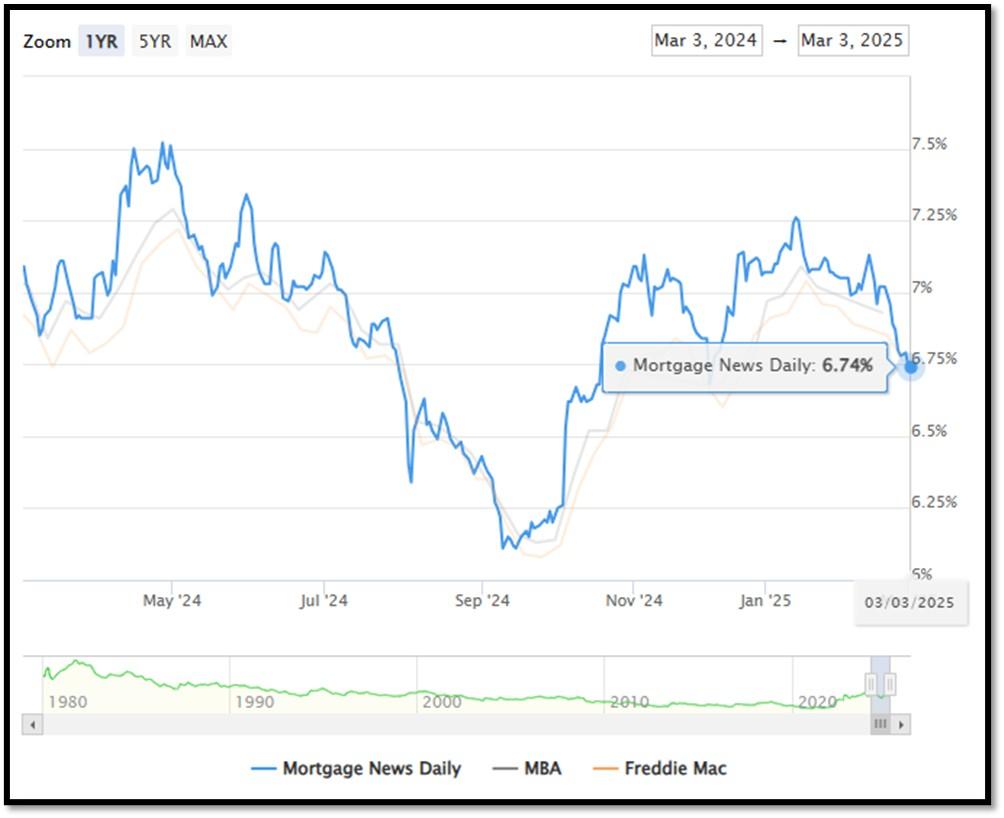
5I. (3/3/2025) Today’s National Average 30-Year Fixed Mortgage Rate is 6.74% (All Time High was 8.03% on 10/19/23). Last week’s data was 6.87%. This rate is the average 30-year fixed mortgage rates from several different surveys including Mortgage News Daily (daily index), Freddie Mac (weekly survey), Mortgage Bankers Association (weekly survey) and FHFA (monthly survey). REF: MortgageNewsDaily, Today’s Average Rate
The recent spike in the 30-year fixed-rate jumbo mortgage to 6.74%, compared to Freddie Mac’s rate at 6.76% and the Mortgage Bankers Association (MBA) rate at 6.93%, highlights key differences in the mortgage market. Jumbo mortgages, which exceed the conforming loan limits set by government agencies like Freddie Mac, typically carry higher interest rates because they are riskier for lenders. These loans are not backed by government entities, which increases the risk for lenders and, consequently, leads to higher rates. In contrast, Freddie Mac and MBA provide averages for conforming loans, which meet federal guidelines and have lower risk due to government backing, keeping their rates lower.
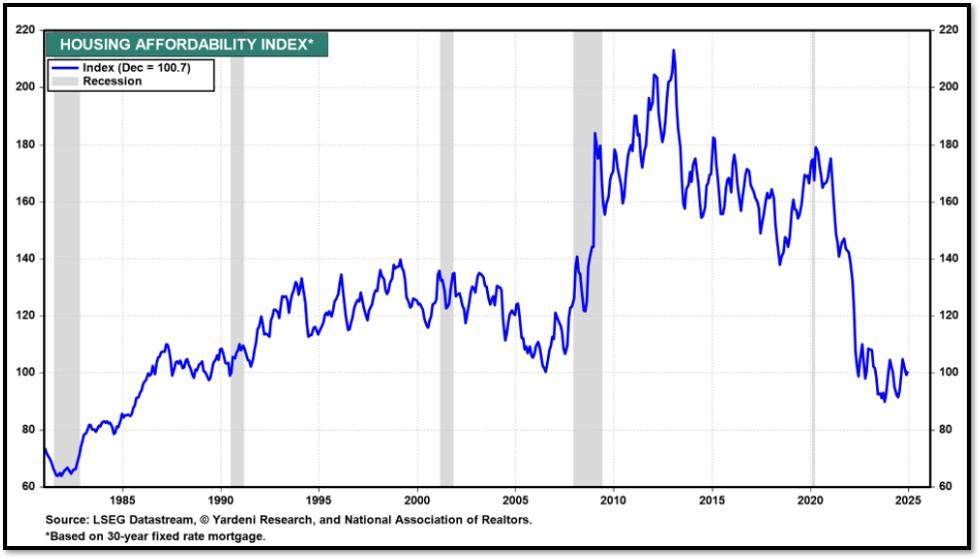
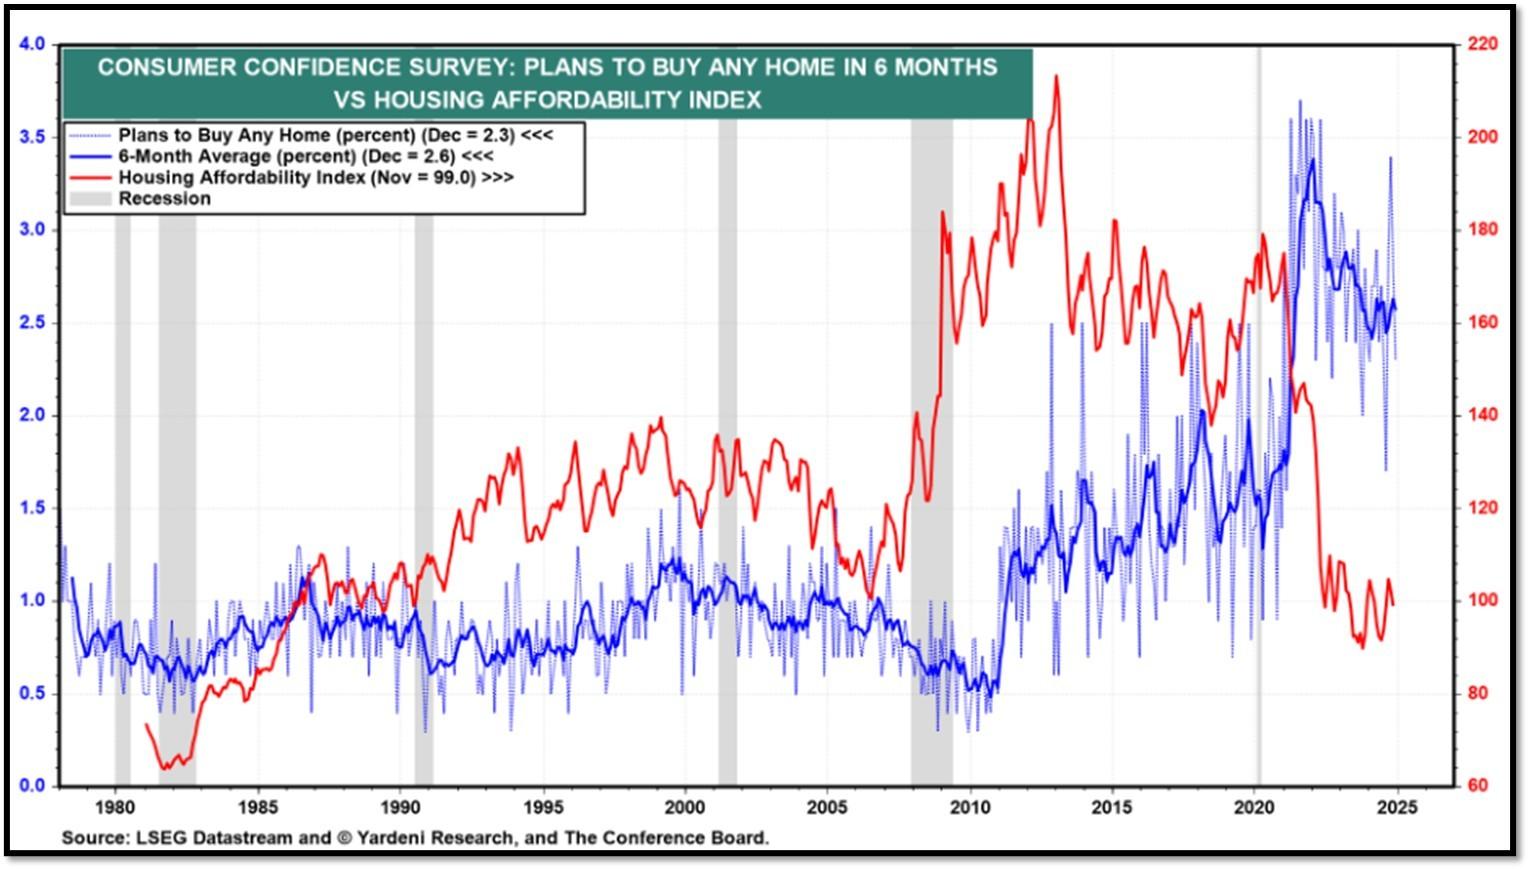
(2/10/25) Housing Affordability Index for Dec = 100.7 // Nov = 99 // Oct = 102.3 // Sep = 105.5 // Aug = 98.6 // July = 95 // June = 93.3 // May = 93.1 // April = 95.9 // March = 101.1 // February = 103.0. Data provided by Yardeni Research. REF: Yardeni
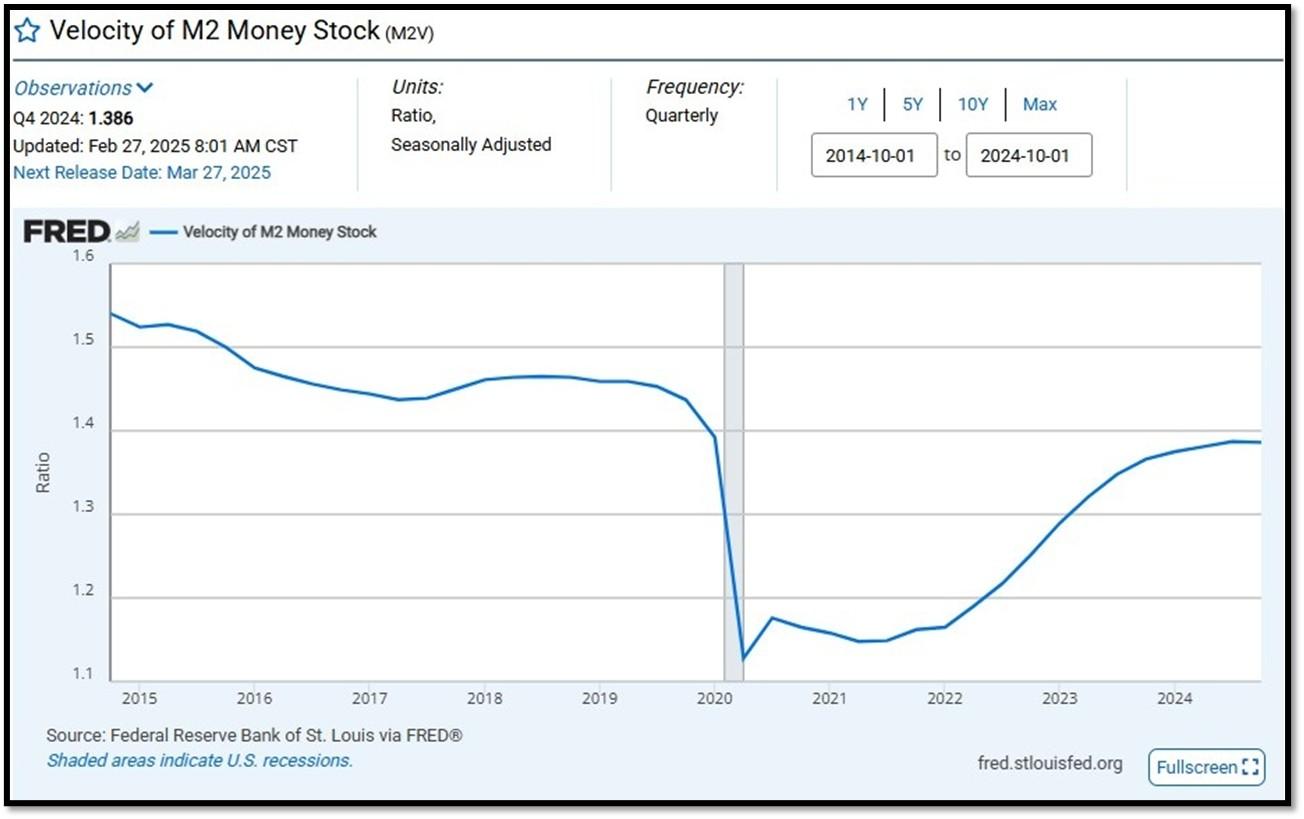
5J. Velocity of M2 Money Stock (M2V) with current read at 1.386 as of (Q4-2024 updated 2/27/2025). Previous quarter’s data was 1.390. The velocity of money is the frequency at which one unit of currency is used to purchase domestically- produced goods and services within a given time period. In other words, it is the number of times one dollar is spent to buy goods and services per unit of time. If the velocity of money is increasing, then more transactions are occurring between individuals in an economy. Current Money Stock (M2) report can be viewed in the reference link. REF: St.LouisFed-M2V
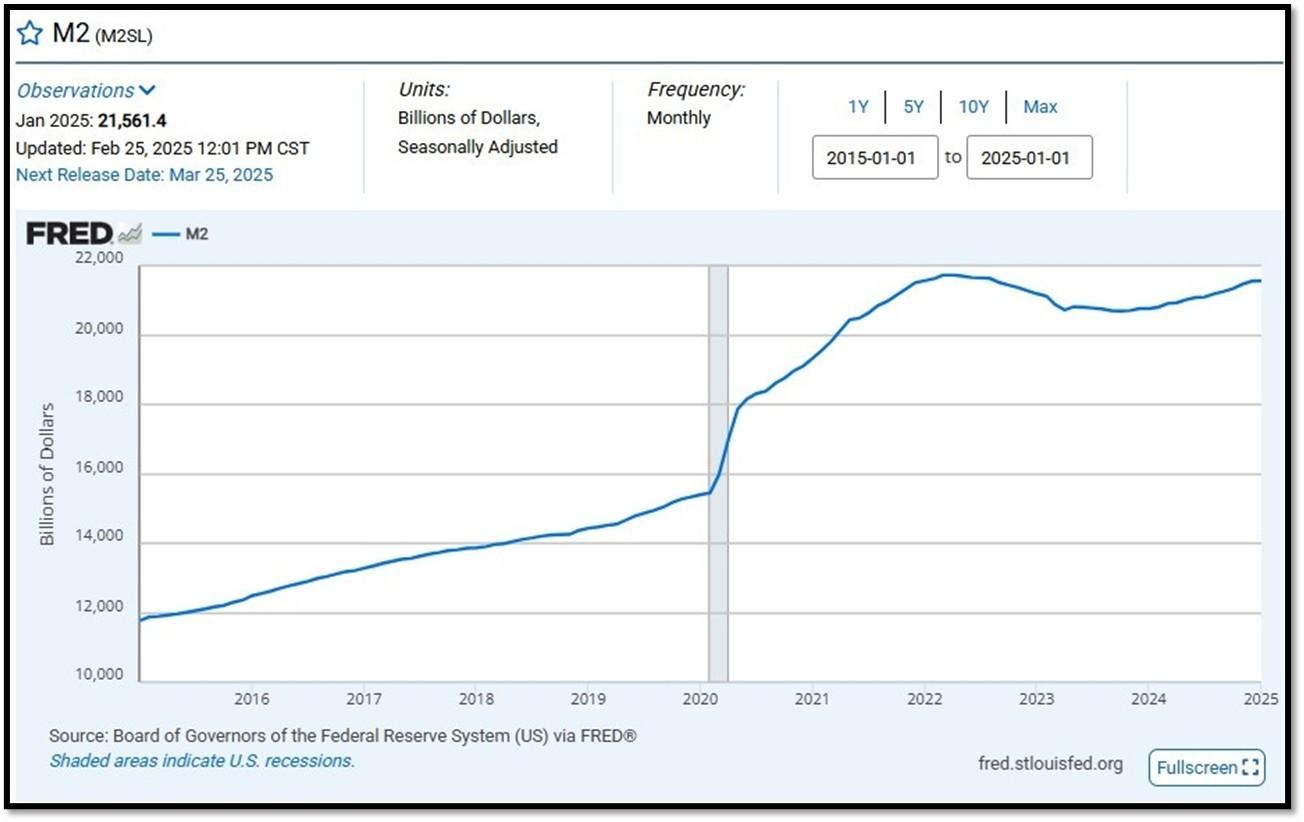
M2 consists of M1 plus (1) small-denomination time deposits (time deposits in amounts of less than $100,000) less IRA and Keogh balances at depository institutions; and (2) balances in retail MMFs less IRA and Keogh balances at MMFs. Seasonally adjusted M2 is constructed by summing savings deposits (before May 2020), small-denomination time deposits, and retail MMFs, each seasonally adjusted separately, and adding this result to seasonally adjusted M1. Board of Governors of the Federal Reserve System (US), M2 [M2SL], retrieved from FRED, Federal Reserve Bank of St. Louis; Updated on February 25, 2025. REF: St.LouisFed-M2
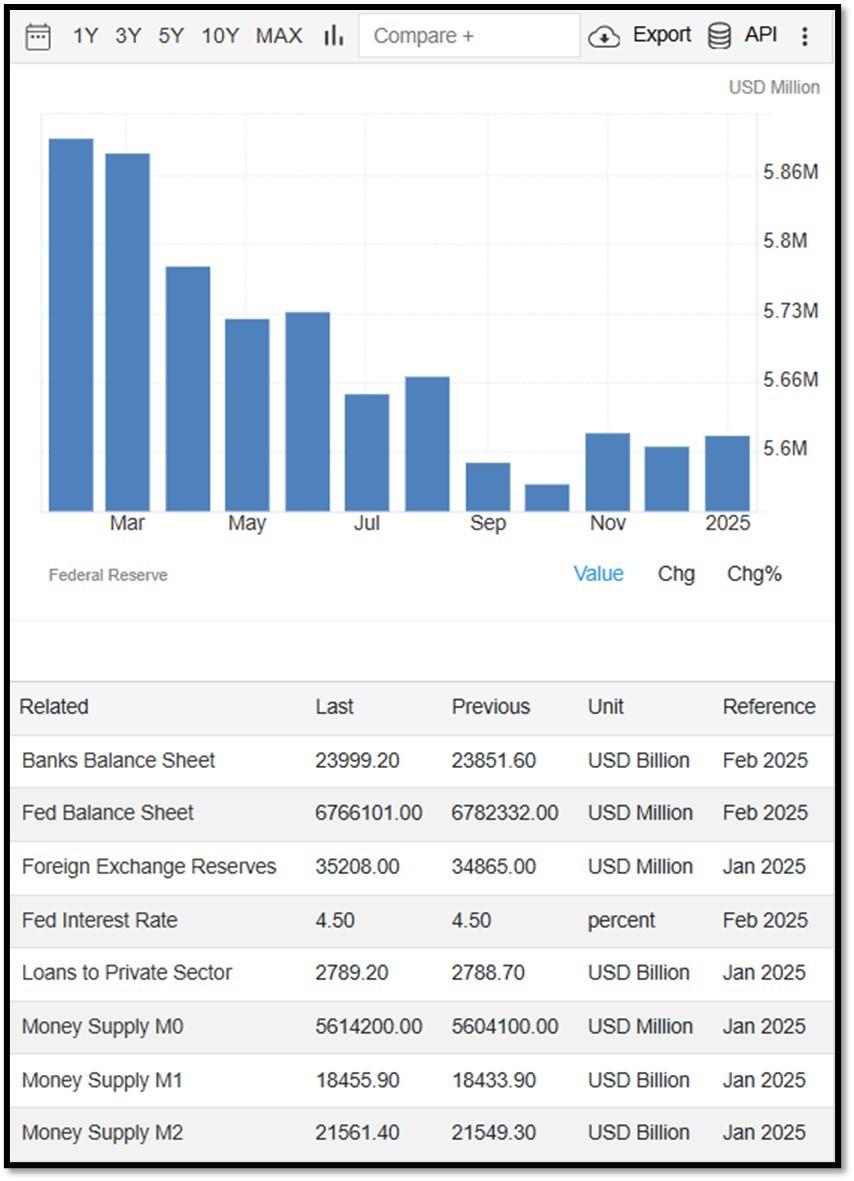
Money Supply M0 in the United States increased to 5,614,200 USD Million in January from 5,604,100 USD Million in December of 2024. Money Supply M0 in the United States averaged 1,171,888.65 USD Million from 1959 until 2025, reaching an all-time high of 6,413,100.00 USD Million in December of 2021 and a record low of 48,400.00 USD Million in February of 1961. REF: TradingEconomics, M0
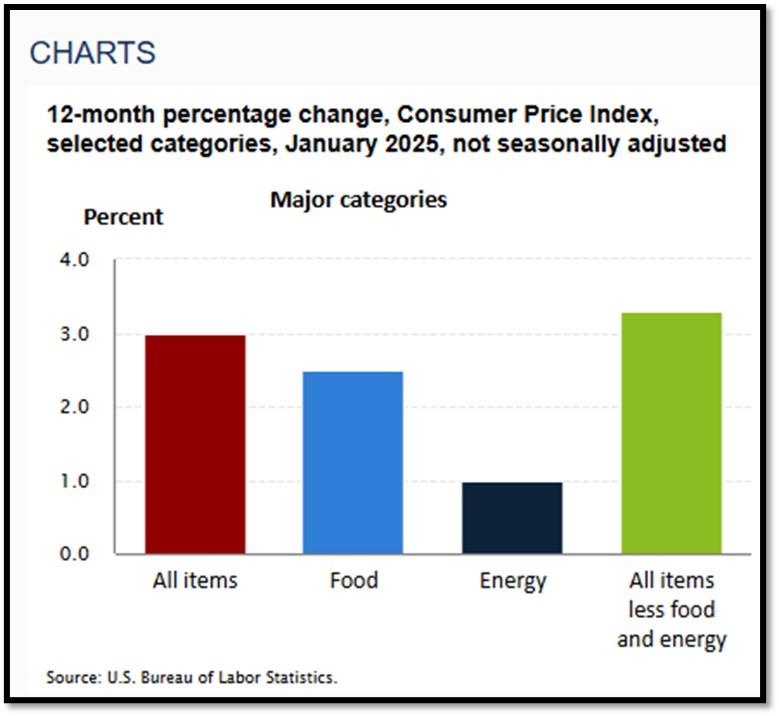
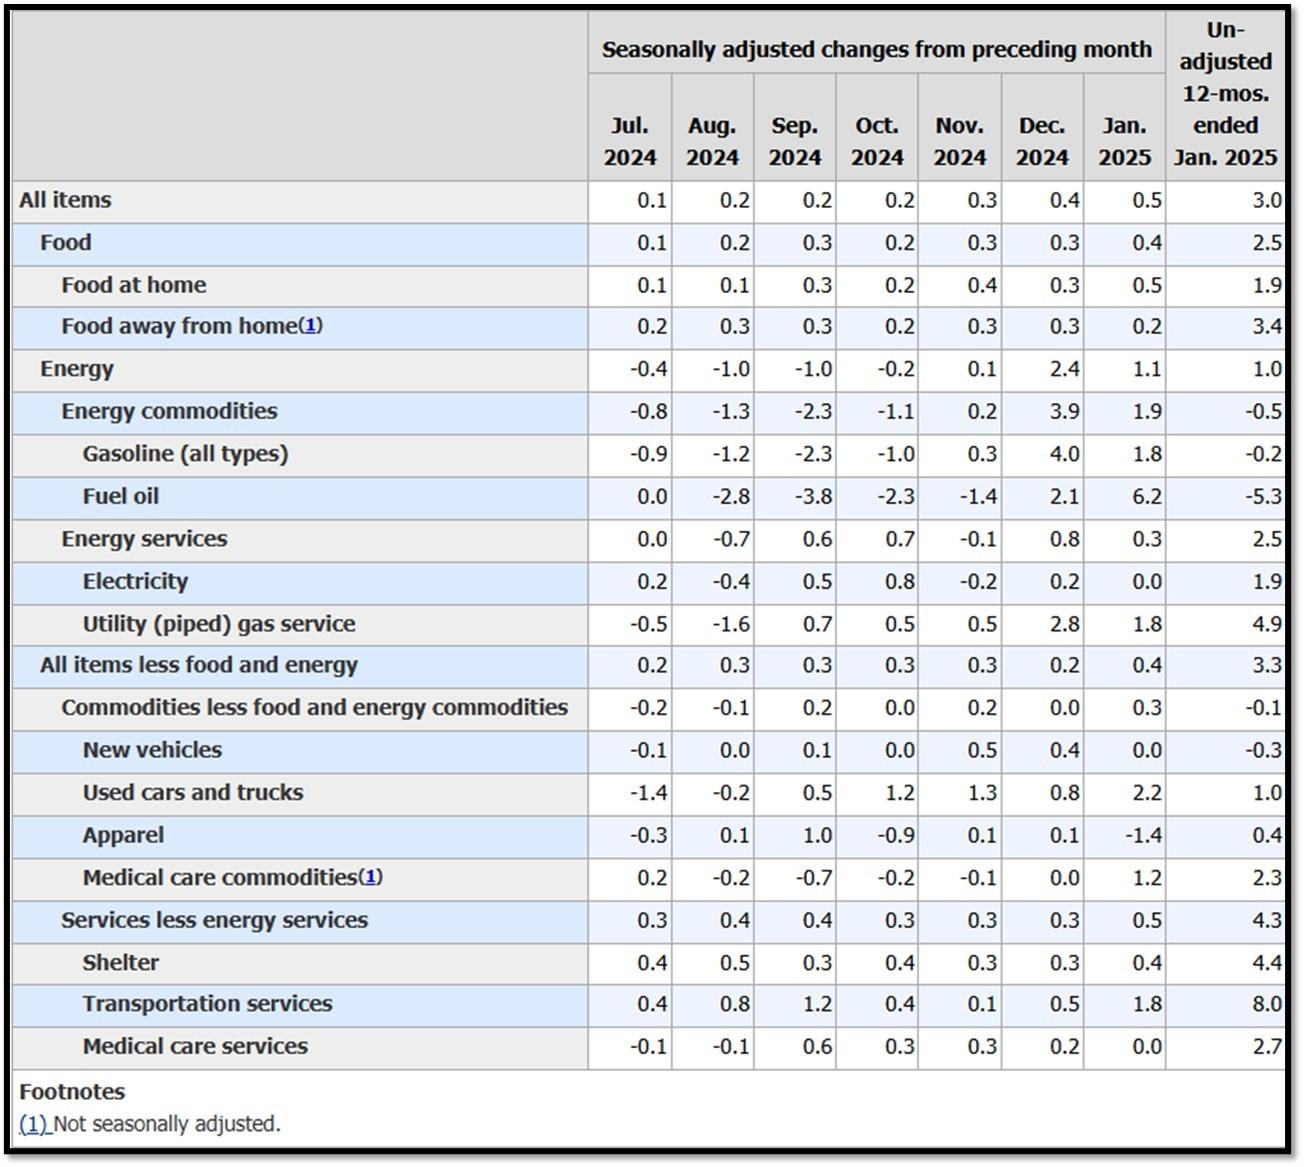
5K. In January, the Consumer Price Index for All Urban Consumers rose 0.5 percent, seasonally adjusted, and rose 3.0 percent over the last 12 months, not seasonally adjusted. The index for all items less food and energy increased 0.4 percent in January (SA); up 3.3 percent over the year (NSA). February 2025 CPI data are scheduled to be released on March 12, 2025, at 8:30AM-ET. REF: BLS, BLS.GOV
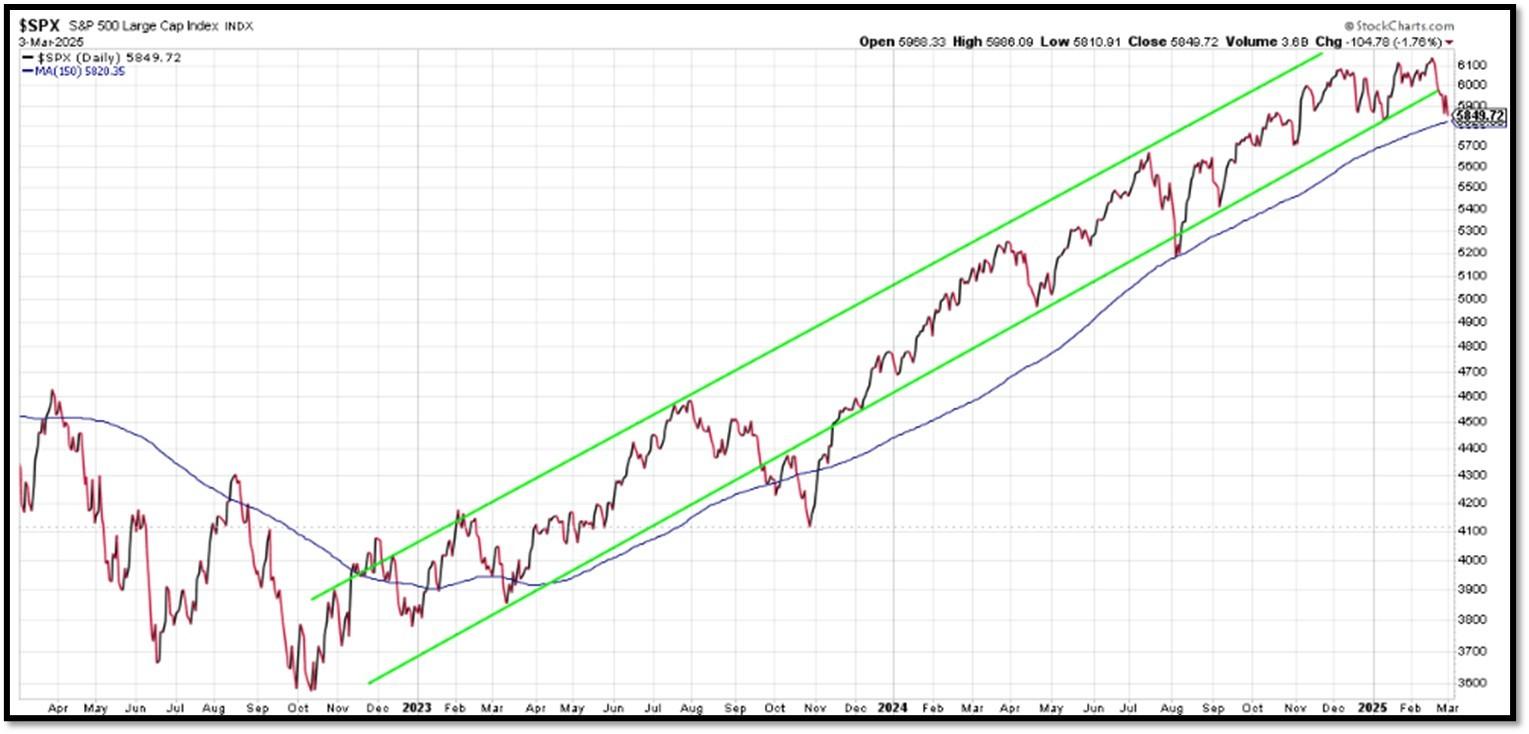
5L. Technical Analysis of the S&P500 Index. Click onto reference links below for images.
- Short-term Chart: Trend Neutral on 3/3/2025 – REF: Short-term S&P500 Chart by Marc Slavin (Click Here to Access Chart)
- Medium-term Chart: Trend Bullish on 3/3/2025 – REF: Medium-term S&P500 Chart by Marc Slavin (Click Here to Access Chart)
- Market Timing Indicators – S&P500 Index as of 3/3/2025 – REF: S&P500 Charts (7 of them) by Joanne Klein’s Top 7 (Click Here to Access Updated Charts)
- A well-defined uptrend channel shown in green with S&P500 still on up trend. REF: Stockcharts
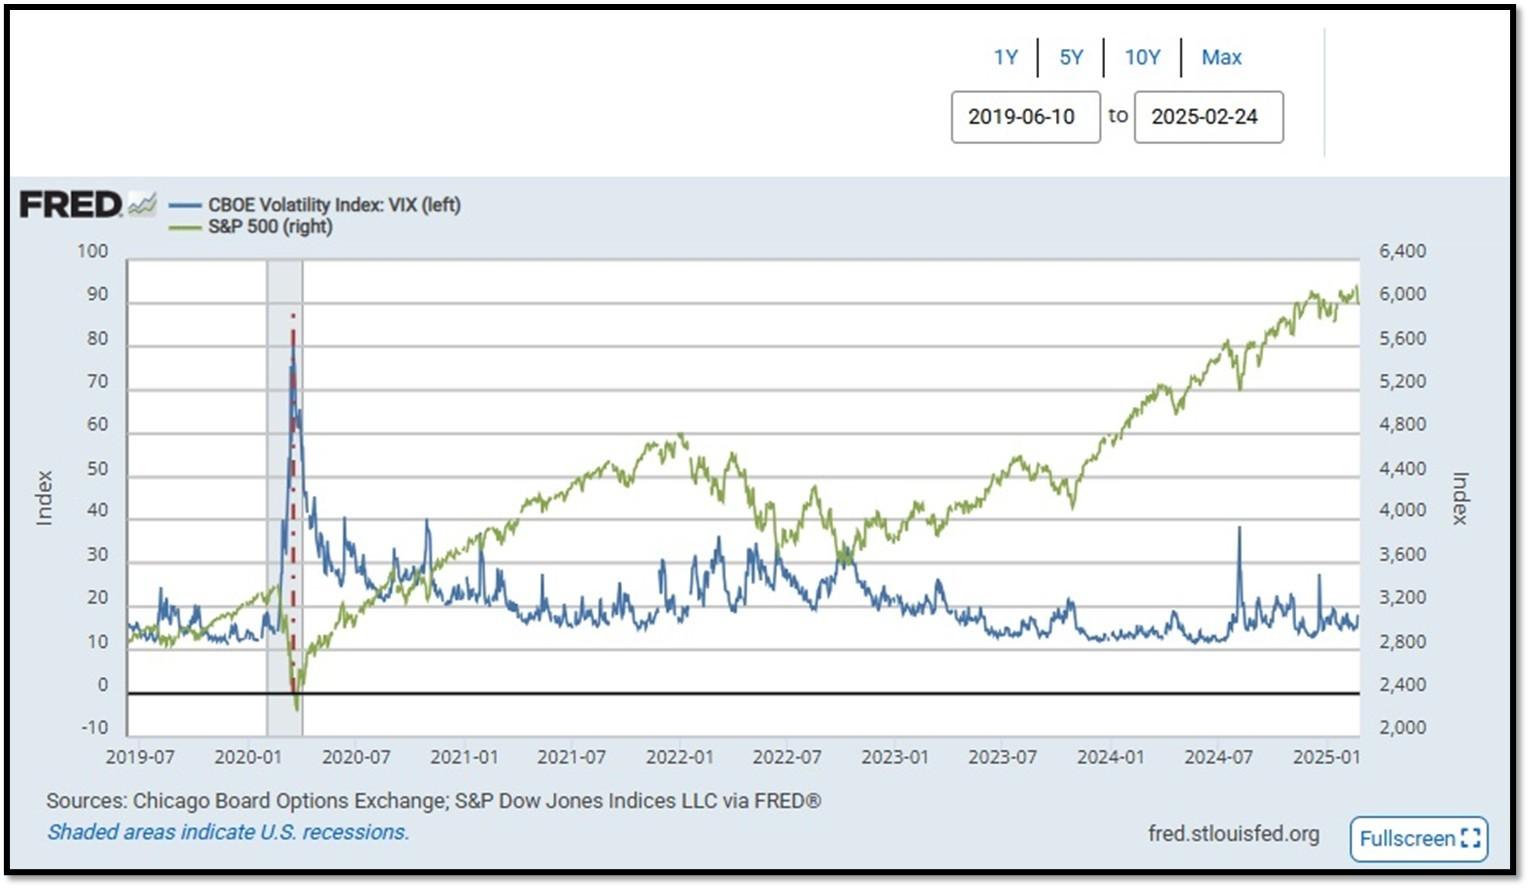
- S&P500 and CBOE Volatility Index (VIX) as of 3/3/2025. REF: FRED, Today’s Print
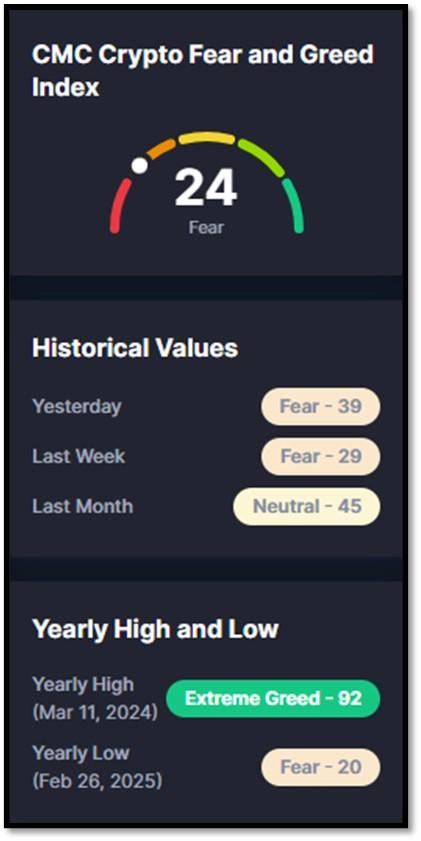
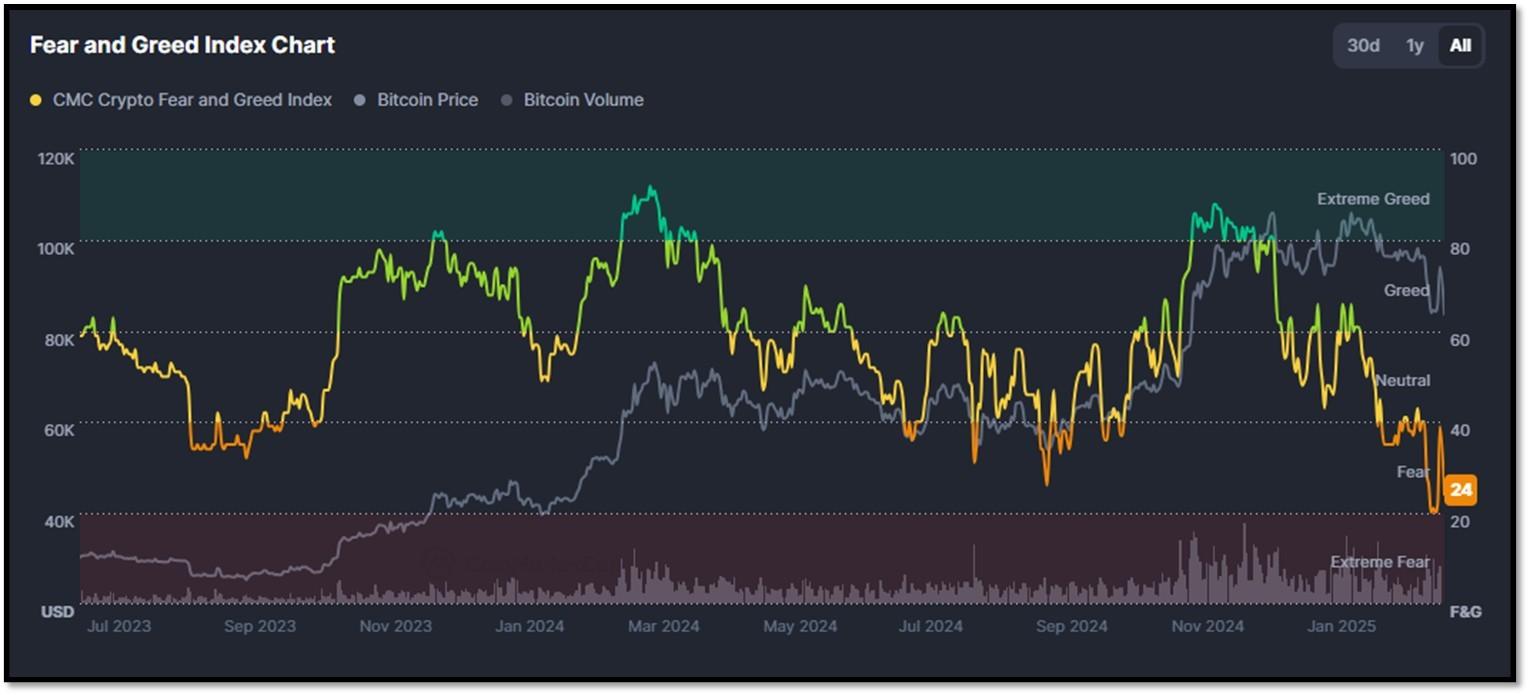
5M. Most recent read on the Crypto Fear & Greed Index with data as of 3/4/2025 is 24 (Fear). Last week’s data was 29 (Fear) (1-100). Fear & Greed Index – A Contrarian Data. The crypto market behavior is very emotional. People tend to get greedy when the market is rising which results in FOMO (Fear of missing out). Also, people often sell their coins in irrational reaction of seeing red numbers. With the Crypto Fear and Greed Index, the data try to help save investors from their own emotional overreactions. There are two simple assumptions:
- Extreme fear can be a sign that investors are too worried. That could be a buying opportunity.
- When Investors are getting too greedy, that means the market is due for a correction.
Therefore, the program for this index analyzes the current sentiment of the Bitcoin market and crunch the numbers into a simple meter from 0 to 100. Zero means “Extreme Fear”, while 100 means “Extreme Greed”. REF: Coinmarketcap.com, Today’sReading
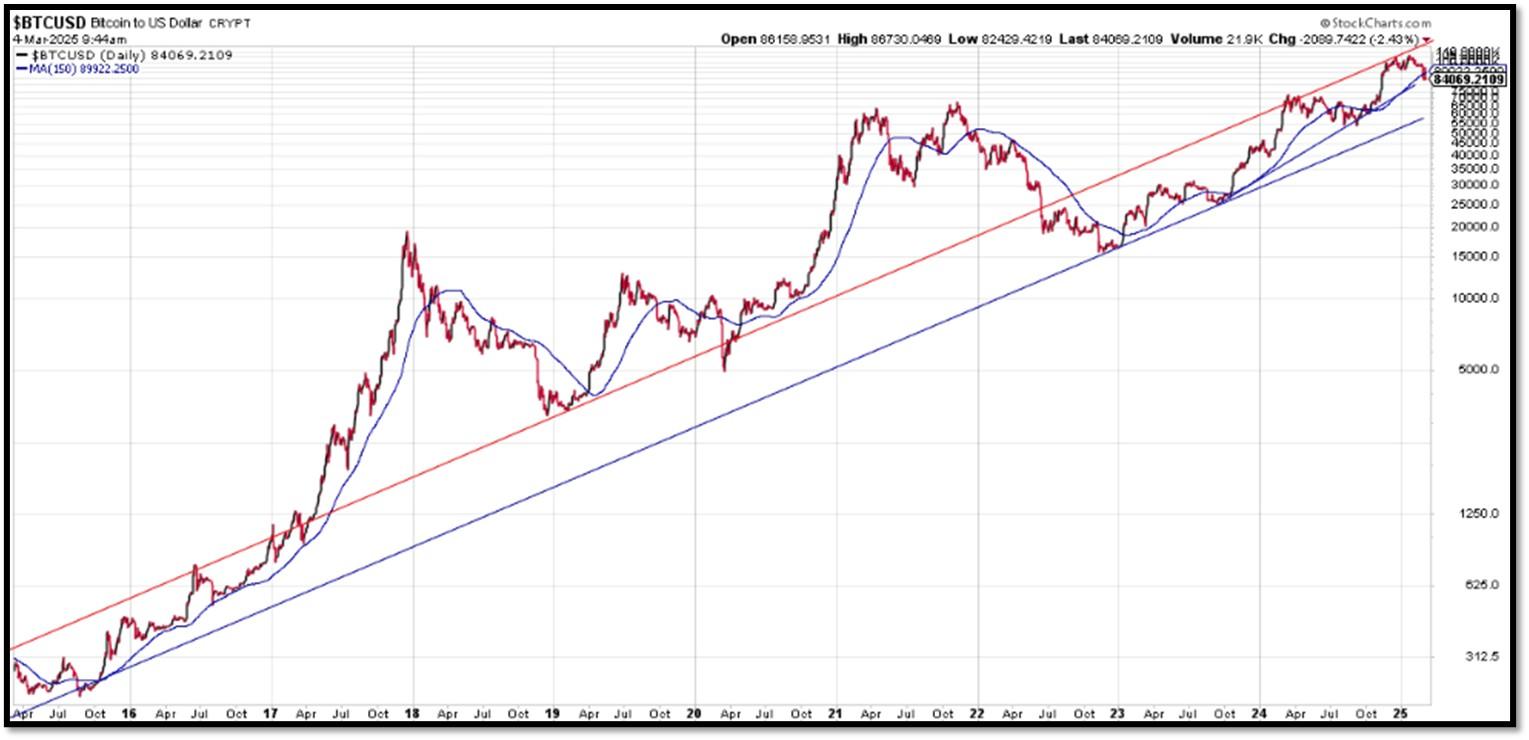
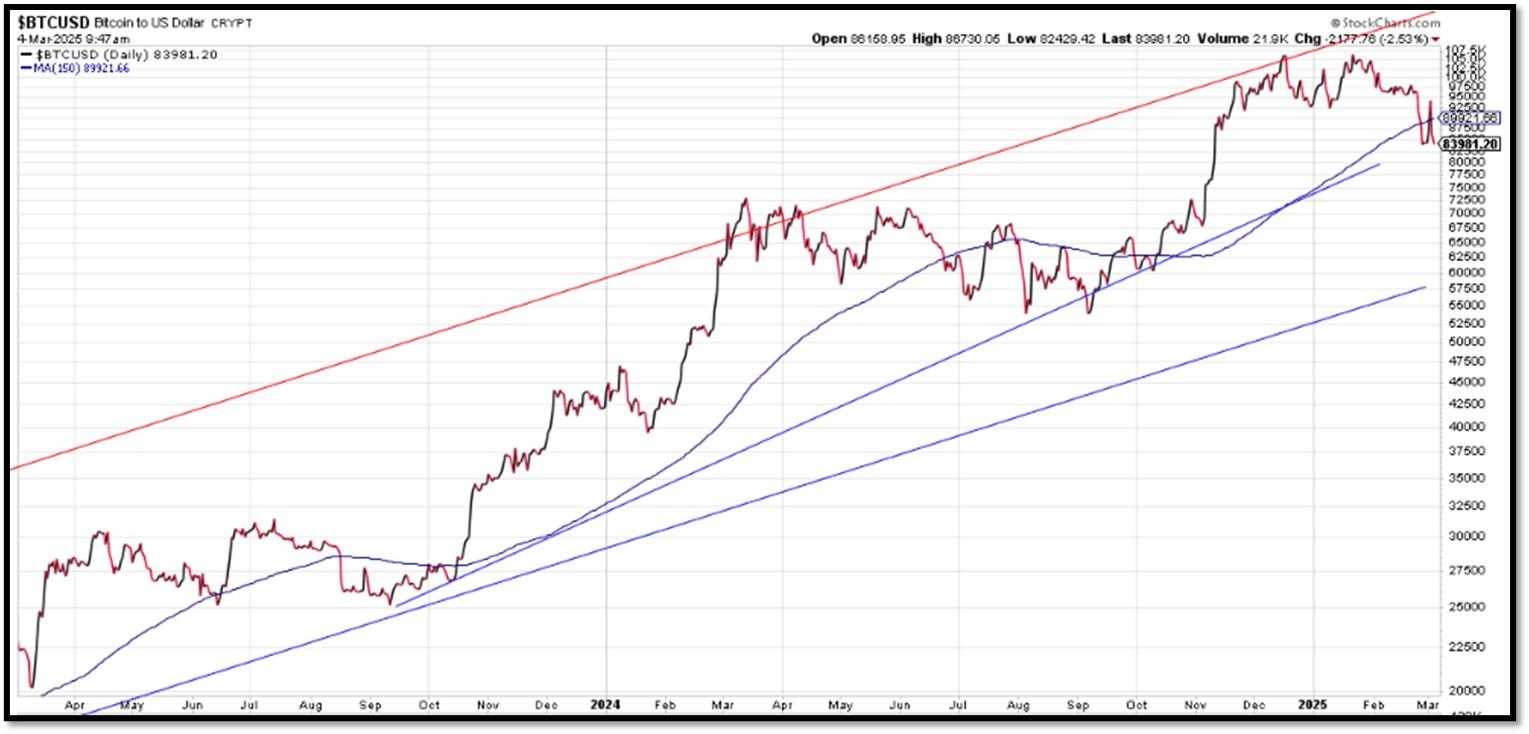
Bitcoin – 10-Year & 2-Year Charts. REF: Stockcharts10Y, Stockcharts2Y
From the desk of our Chief Investment Officer
As an investment professional with over twenty-six years of experience in the financial services industry, Andrew helps clients to protect, grow and transfer wealth during their lifetime with objective, unbiased, customized and efficient strategies.
Education, Professional Licenses Acquired & Affiliations
- Passed the Series 7, 63, 65 and 24 license examinations
- Currently holding Series 65 License
- BA in Economics – Boston University (Boston, MA) 1993
- Certificate in Commodities Trading – New York University (New York, NY) 1991
- Certificate in Financial Planning – New York University (New York, NY) April 2011
With extensive experience in the Financial Services Industry, Andrew Tang and Turner Financial Group provides disciplined wealth management with an intelligent caring approach to each and every client that compliments the Dedicated Financial offering.


Len writes much of his own content, and also shares helpful content from other trusted providers like Turner Financial Group (TFG).
The material contained herein is intended as a general market commentary, solely for informational purposes and is not intended to make an offer or solicitation for the sale or purchase of any securities. Such views are subject to change at any time without notice due to changes in market or economic conditions and may not necessarily come to pass. This information is not intended as a specific offer of investment services by Dedicated Financial and Turner Financial Group, Inc.
Dedicated Financial and Turner Financial Group, Inc., do not provide tax, legal or accounting advice. You should consult your own tax, legal and accounting advisors before engaging in any transaction.
Any hyperlinks in this document that connect to Web Sites maintained by third parties are provided for convenience only. Turner Financial Group, Inc. has not verified the accuracy of any information contained within the links and the provision of such links does not constitute a recommendation or endorsement of the company or the content by Dedicated Financial or Turner Financial Group, Inc. The prices/quotes/statistics referenced herein have been obtained from sources verified to be reliable for their accuracy or completeness and may be subject to change.
Past performance is no guarantee of future returns. Investing involves risk and possible loss of principal capital. The views and strategies described herein may not be suitable for all investors. To the extent referenced herein, real estate, hedge funds, and other private investments can present significant risks, including loss of the original amount invested. All indexes are unmanaged, and an individual cannot invest directly in an index. Index returns do not include fees or expenses.
Turner Financial Group, Inc. is an Investment Adviser registered with the United States Securities and Exchange Commission however, such registration does not imply a certain level of skill or training and no inference to the contrary should be made. Additional information about Turner Financial Group, Inc. is also available at www.adviserinfo.sec.gov. Advisory services are only offered to clients or prospective clients where Turner Financial Group, Inc. and its representatives are properly licensed or exempt from licensure. No advice may be rendered by Turner Financial Group, Inc. unless a client service agreement is in place.


