

- 1. This week’s economic data highlighted a slowing U.S. economy, with the July jobs report adding just 73,000 jobs, missing the 104,000 consensus, alongside 258,000 downward revisions for May and June, pushing unemployment to 4.2%.
- 2. TheCUBE highlights Jamie Dimon, CEO of JPMorgan Chase, as a surprising rival to OpenAI’s Sam Altman in the AI race, emphasizing “enterprise AGI” powered by proprietary data.
- 3. Recent stock market volatility has led traders to believe that current valuations are priced to perfection, reflecting overly optimistic expectations for economic growth and corporate earnings.
- 4. World Watch
- 4A. President Donald Trump demanded the resignation of Intel CEO Lip-Bu Tan, citing conflicts of interest due to Tan’s alleged investments in Chinese tech firms, some tied to the Chinese military, as highlighted by a Reuters report and Senator Tom Cotton’s letter to Intel’s board.
- 4B. Professor Jeremy Siegel’s vocal commentary focused on the unreliability of BLS jobs data, which he attributed to flawed methodologies rather than political manipulation.
- 4C. An updated snapshot of the current global state of economy.
- 5. Quant & Technical Corner – A selection of quantitative & technical data we monitor on a regular basis to help gauge the overall financial market conditions and the investment environment.
1. This week’s economic data highlighted a slowing U.S. economy, with the July jobs report adding just 73,000 jobs, missing the 104,000 consensus, alongside 258,000 downward revisions for May and June, pushing unemployment to 4.2%.
The ISM Manufacturing PMI at 49.5 signaled contraction, while core PCE inflation stayed at 2.8% and wage growth hit 3.6%, raising expectations for a 94% chance of a 50-basis-point Fed rate cut in September. The disappointing jobs data drove a 2% weekly S&P 500 decline, reflecting reduced risk appetite, while falling Treasury yields (10-year at 4.22%) boosted bond prices. New 25% tariffs on Indian imports threaten higher inflation, potentially limiting bond gains and increasing stock market volatility. Despite solid tech earnings, bonds are poised to outperform stocks amid economic and policy uncertainties. A consolidation phase is warranted, but I don’t expect a massive selloff as we get closer to September’s expected interest rate cut. REF: Briefing.com, Stockcharts
2. TheCUBE highlights Jamie Dimon, CEO of JPMorgan Chase, as a surprising rival to OpenAI’s Sam Altman in the AI race, emphasizing “enterprise AGI” powered by proprietary data.
JPMorgan’s 150-petabyte data estate, vastly larger than GPT-4’s training set, enables specialized AI applications like digital twins, outpacing general-purpose LLMs reliant on public data. While OpenAI’s GPT-5 boasts PhD-level reasoning and multimodal capabilities, Dimon leverages JPMorgan’s unique financial and operational insights to create unmatched enterprise solutions, redefining AI’s economic value.
Dimon’s edge stems from JPMorgan’s top ranking in the Evident AI Index, fueled by significant AI talent and innovation investments, avoiding the $200 million-plus costs of frontier models like Google’s Gemini Ultra. By integrating OpenAI’s advancements while safeguarding proprietary data, JPMorgan maintains a strategic advantage. However, data privacy and AI governance challenges persist for both Dimon and Altman. TheCUBE suggests enterprises like JPMorgan, with tailored AI and exclusive data, may surpass traditional AI developers in delivering economic impact. Click onto picture below to access video. REF: TheCube

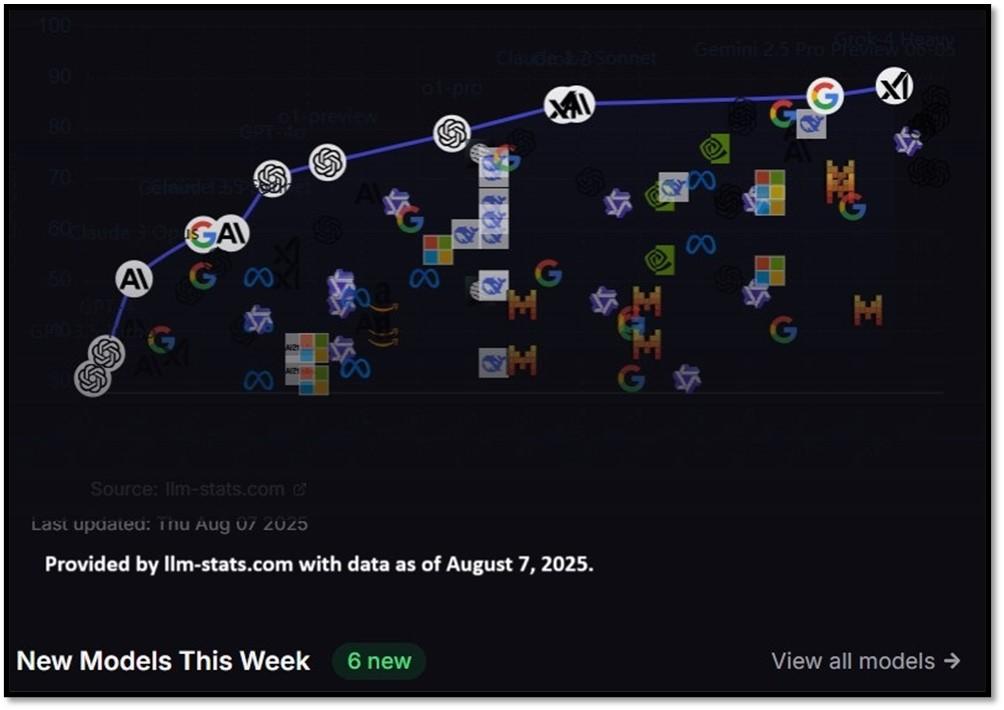
According to llm-stats.com, Grok 4, released by xAI in July 2025, leads the large language model race, with its Grok 4 Heavy variant outperforming competitors like OpenAI’s GPT-5 and Anthropic’s Claude 4 on key benchmarks. Grok 4 Heavy achieves top scores, including 50.7% on Humanity’s Last Exam, 15.9% on ARC-AGI-2, and 100% on AIME 2025, driven by its multi-agent architecture and 1.7 trillion parameters trained on 200,000 GPUs. Despite its benchmark dominance, some real-world tests rank it lower due to issues like slower response times and ethical concerns, though it remains a frontrunner in reasoning and coding tasks. REF: LLM-STATS
3. Recent stock market volatility has led traders to believe that current valuations are priced to perfection, reflecting overly optimistic expectations for economic growth and corporate earnings.
With high price-to-earnings ratios in indices like the S&P 500 and risks such as inflation and geopolitical tensions, a selloff is seen as warranted to realign valuations, especially after a weak July jobs report and anticipation of a Federal Reserve rate cut in September, potentially by 50 basis points, which may already be factored into stock prices.
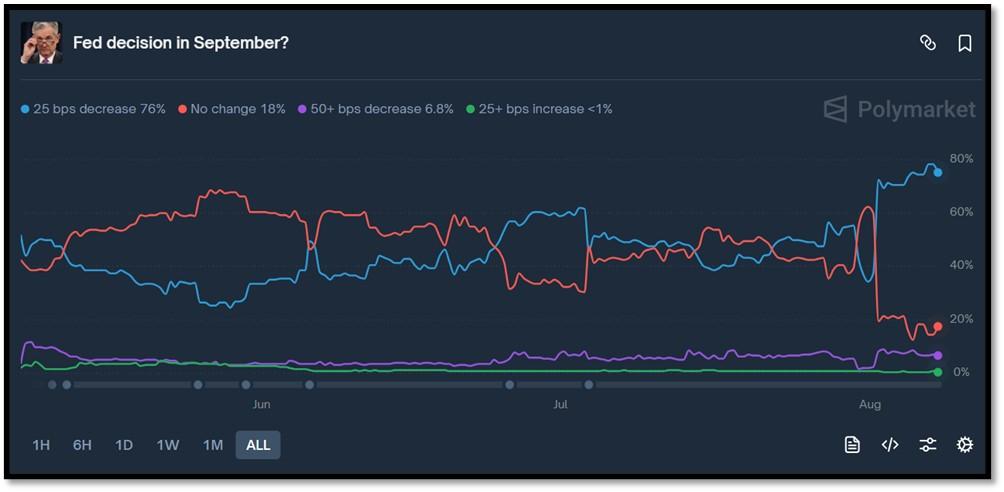
Bonds are well-positioned to gain as the Federal Reserve moves toward a looser monetary policy, with a potential 50-basis-point rate cut in September expected to stabilize or lower bond yields, boosting prices for Treasuries and high-grade corporate bonds. Investors are shifting toward bonds as a safer haven amid stock market uncertainty, expecting lower rates to enhance bond market returns, though persistent inflation could limit the extent of rate cuts and cap potential gains. Current odds of a 25bps rate cut in September is 76% according to Polymarket. REF: Polymarket
With the current macro-economic backdrop, below are areas we currently favor:
- Fixed Income – Short-term Corporates (Low-Beta)
- Fixed Income – (Corporates & Muni) High Yield as Opportunistic Allocation (Low-Beta)
- Businesses that contribute to and benefit from AI & Automation (Market-Risk)
- Fintech & Financials (Market-Risk)
- Digital Asset – Bitcoin (Market-Risk/Hedge)
- Cyber-Security & Software (Market-Risk)
- Cloud Computing (Market-Risk)
- Biotechnology (Market-Risk)
4. World Watch
4A. President Donald Trump demanded the resignation of Intel CEO Lip-Bu Tan, citing conflicts of interest due to Tan’s alleged investments in Chinese tech firms, some tied to the Chinese military, as highlighted by a Reuters report and Senator Tom Cotton’s letter to Intel’s board.
Cotton questioned Tan’s divestment from these interests, given Intel’s $8 billion in CHIPS Act funding to boost U.S. chip production. Trump’s Truth Social post triggered a 3% drop in Intel’s stock, reflecting market concerns. This aligns with Trump’s “America First” policy, including a proposed 100% tariff on imported chips to prioritize domestic manufacturing, though it raises concerns about presidential overreach into corporate governance.
The controversy stems from Tan’s investments and his past role at Cadence Design Systems, which violated U.S. export controls by selling technology to a Chinese military university. Critics like Cotton argue that these ties undermine Intel’s role in national security and its handling of taxpayer funds. However, analysts like Anshel Sag suggest Tan’s expertise in Chinese semiconductor capabilities benefits Intel, which is struggling against competitors like Nvidia and TSMC. Intel insists Tan and the board support U.S. interests. The episode highlights U.S.-China tech tensions and the complex interplay between global investment and national security, with Trump’s demand marking a bold executive move. Click onto picture below to access video. REF: Bloomberg, CNBC

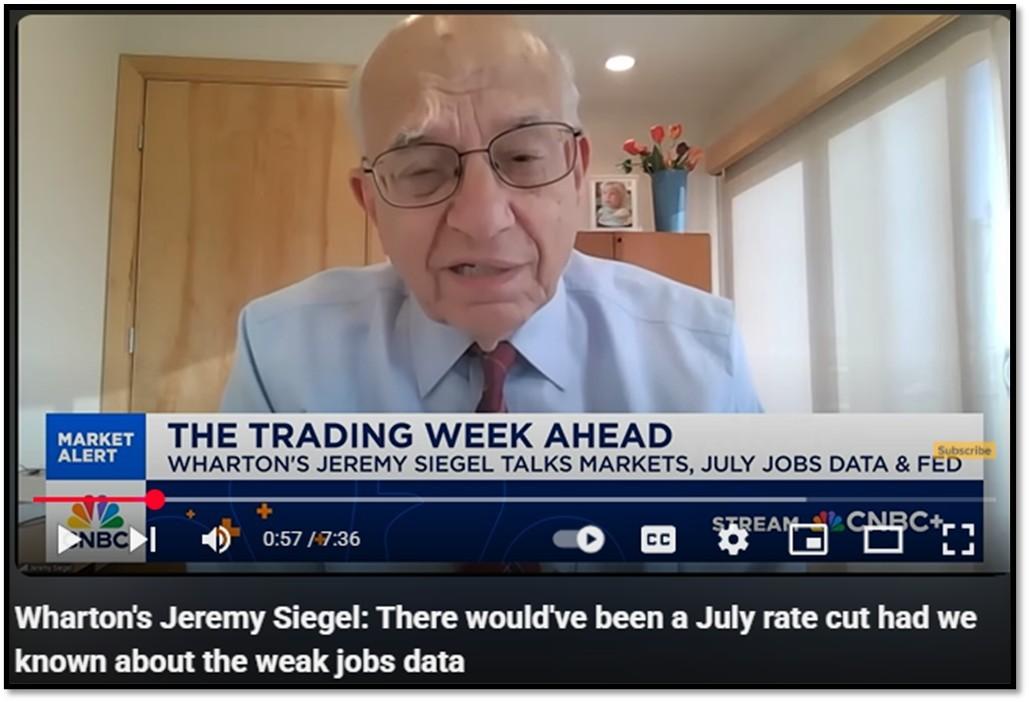
4B. Professor Jeremy Siegel’s vocal commentary focused on the unreliability of BLS jobs data, which he attributed to flawed methodologies rather than political manipulation.
During an appearance on CNBC’s Squawk Box, Siegel criticized the BLS for its reliance on voluntary surveys with declining response rates—down to 60% for key employment metrics and as low as 20% for the Job Openings and Labor Turnover Survey (JOLTS). These low response rates, coupled with the lack of mandatory participation or strict deadlines, lead to significant data revisions, as seen in the July 2025 report. Siegel argued that these inaccuracies distorted the economic picture, contributing to misguided Federal Reserve decisions, such as missing an opportunity for a July rate cut. He emphasized that the flawed data had real consequences, noting that market odds for a September rate cut surged to 83% after the report.
Siegel advocated for modernizing BLS data collection, proposing mandatory surveys with time limits to improve accuracy and transparency. He explicitly rejected Trump’s claims of political rigging, stating there was no evidence of deliberate manipulation by McEntarfer or the BLS. Instead, he framed the issue as one of systemic inefficiency, questioning why the BLS did not provide a detailed explanation for what he called “the biggest mistake in 50 years.” President Trump is seeking a loyalist to lead the agency, which traditionally requires an experienced economist with a Ph.D. for its $195,000-a-year role overseeing critical economic data. Click onto picture below to access video. REF: CNBC, WSJ
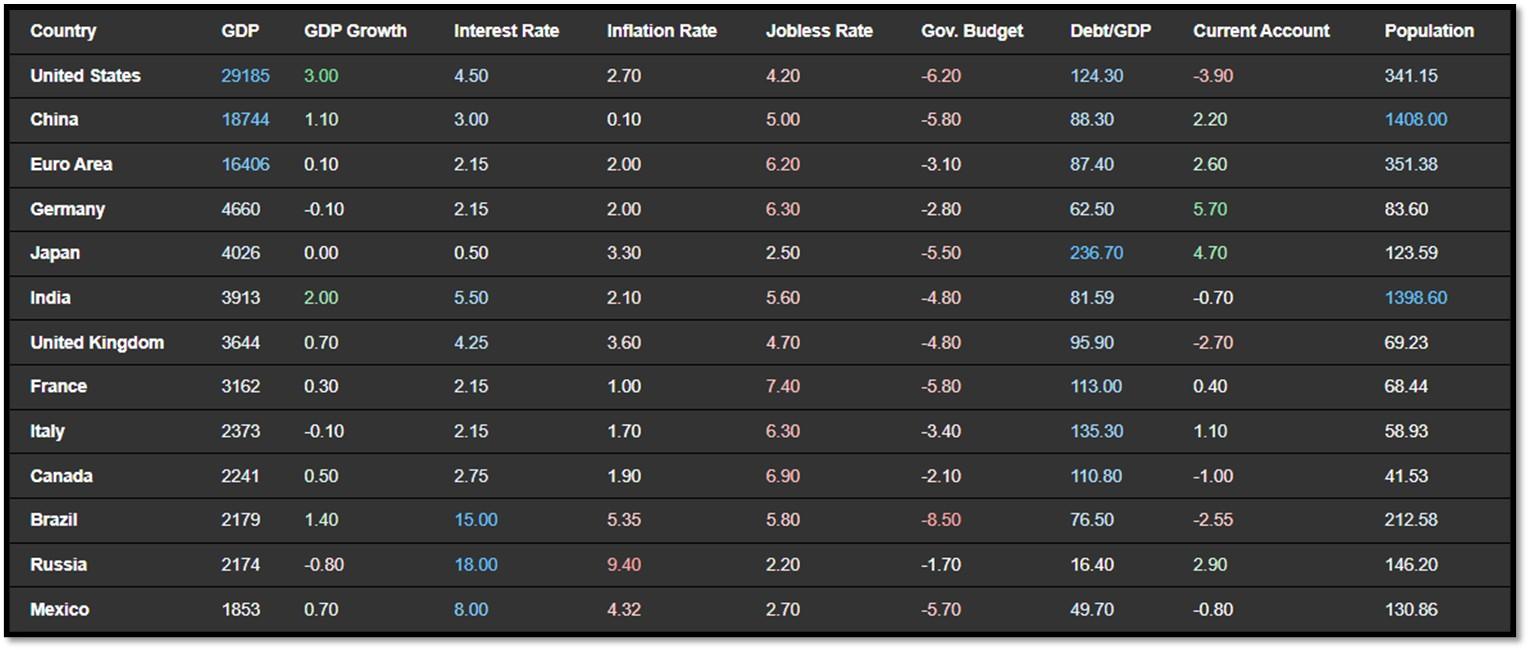
4C. An updated snapshot of the current global state of economy.
According to TradingEconomics as of 8/4/2025 (REF: TradingEconomics):
- The US economy grew an annualized 3% in Q2 2025, rebounding from a 0.5% contraction in Q1, and beating expectations of a 2.4% rise, according to the advance estimate.
- The US unemployment rate rose slightly to 4.2% in July 2025 from 4.1% in June, aligning with market expectations.
- Germany’s economy contracted by 0.1% quarter-on-quarter in the second quarter of 2025, following a downwardly revised 0.3% expansion in the previous quarter, according to a preliminary estimate.
- France’s annual inflation rate held steady at 1% in July 2025, unchanged from June and in line with market expectations, according to preliminary estimates.
5. Quant & Technical Corner – A selection of quantitative & technical data we monitor on a regular basis to help gauge the overall financial market conditions and the investment environment.
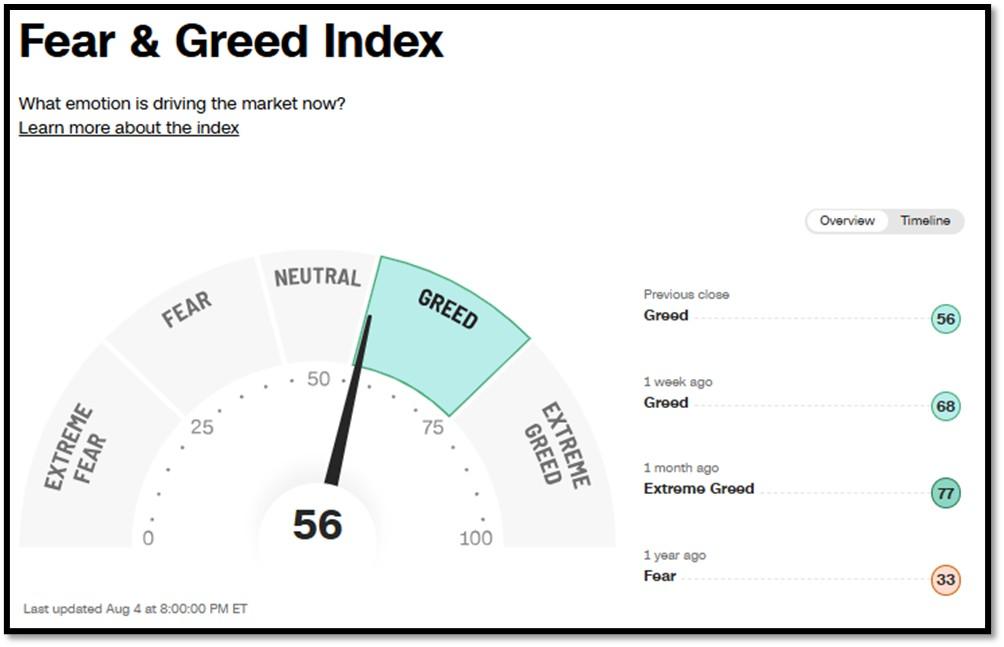
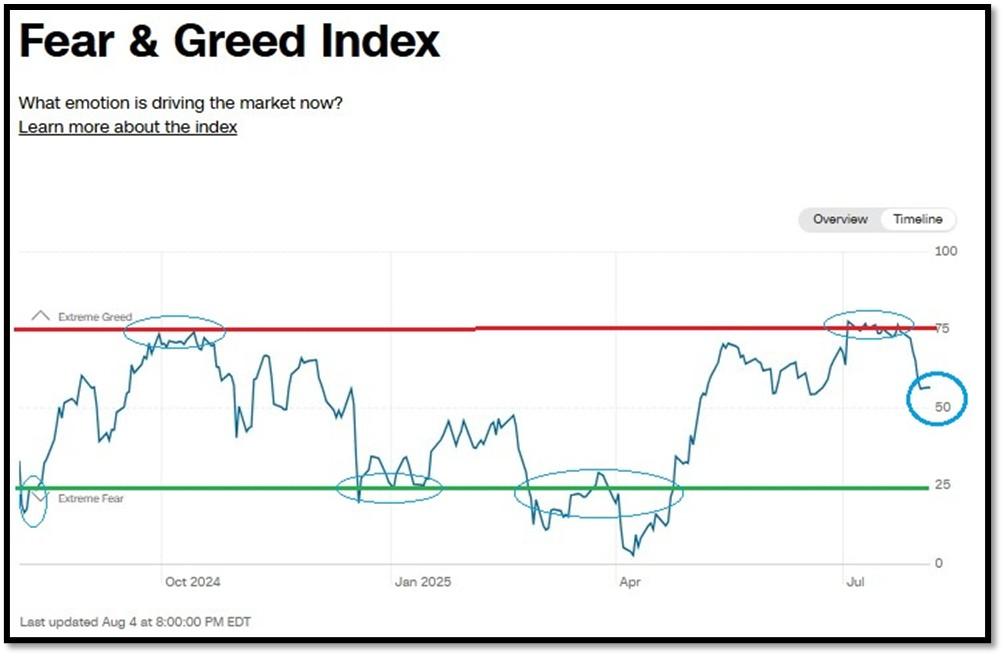
5A. Most recent read on the Fear & Greed Index with data as of 8/4/2025 – 8:00PM-ET is 56 (Greed). Last week’s data was 68 (Greed) (1-100). CNNMoney’s Fear & Greed index looks at 7 indicators (Stock Price Momentum, Stock Price Strength, Stock Price Breadth, Put and Call Options, Junk Bond Demand, Market Volatility, and Safe Haven Demand). Keep in mind this is a contrarian indicator! REF: Fear&Greed via CNNMoney
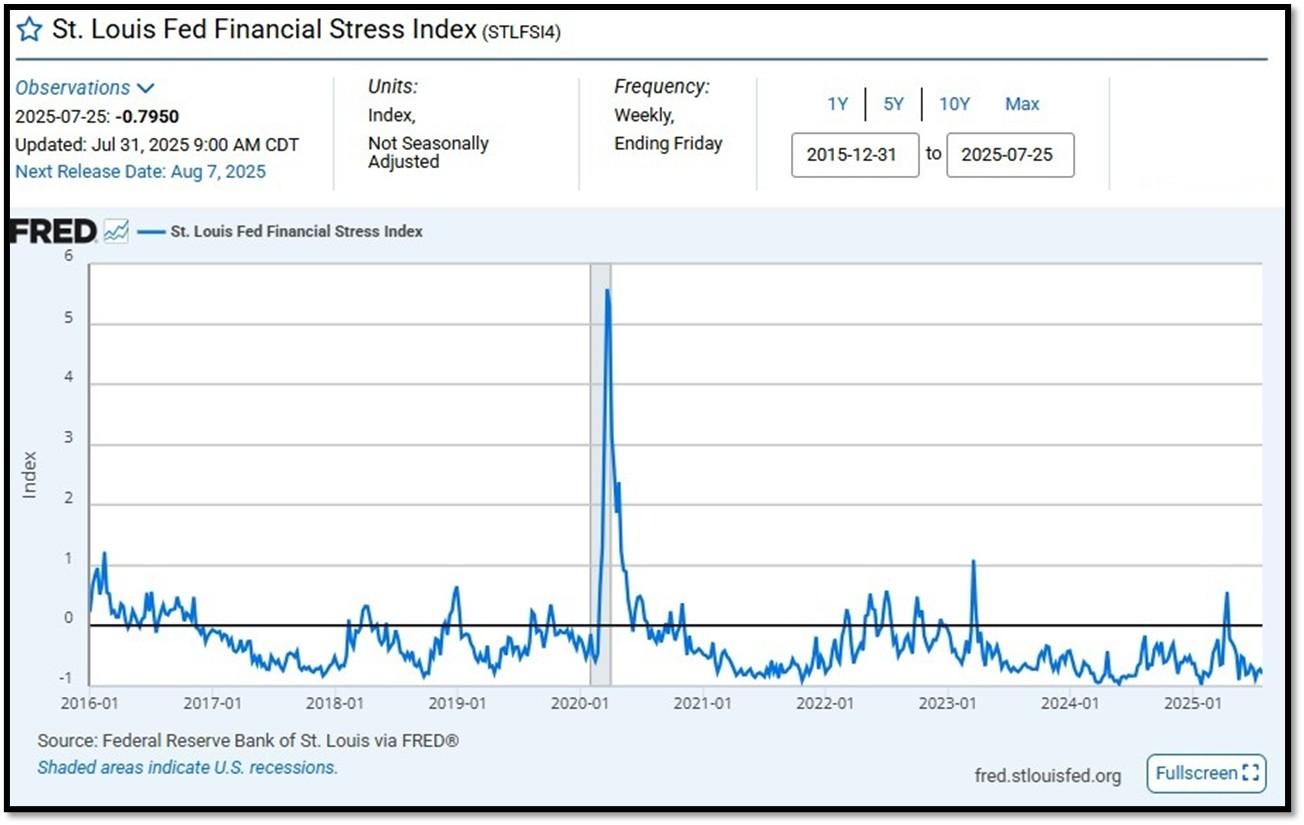
5B. St. Louis Fed Financial Stress Index’s (STLFSI4) most recent read is at –0.7950 as of July 31, 2025. Previous week’s data was -0.7175. A big spike up from previous readings reflecting the turmoil in the banking sector back in 2023. This weekly index is not seasonally adjusted. The STLFSI4 measures the degree of financial stress in the markets and is constructed from 18 weekly data series: seven interest rate series, six yield spreads and five other indicators. Each of these variables captures some aspect of financial stress. Accordingly, as the level of financial stress in the economy changes, the data series are likely to move together. REF: St. Louis Fed
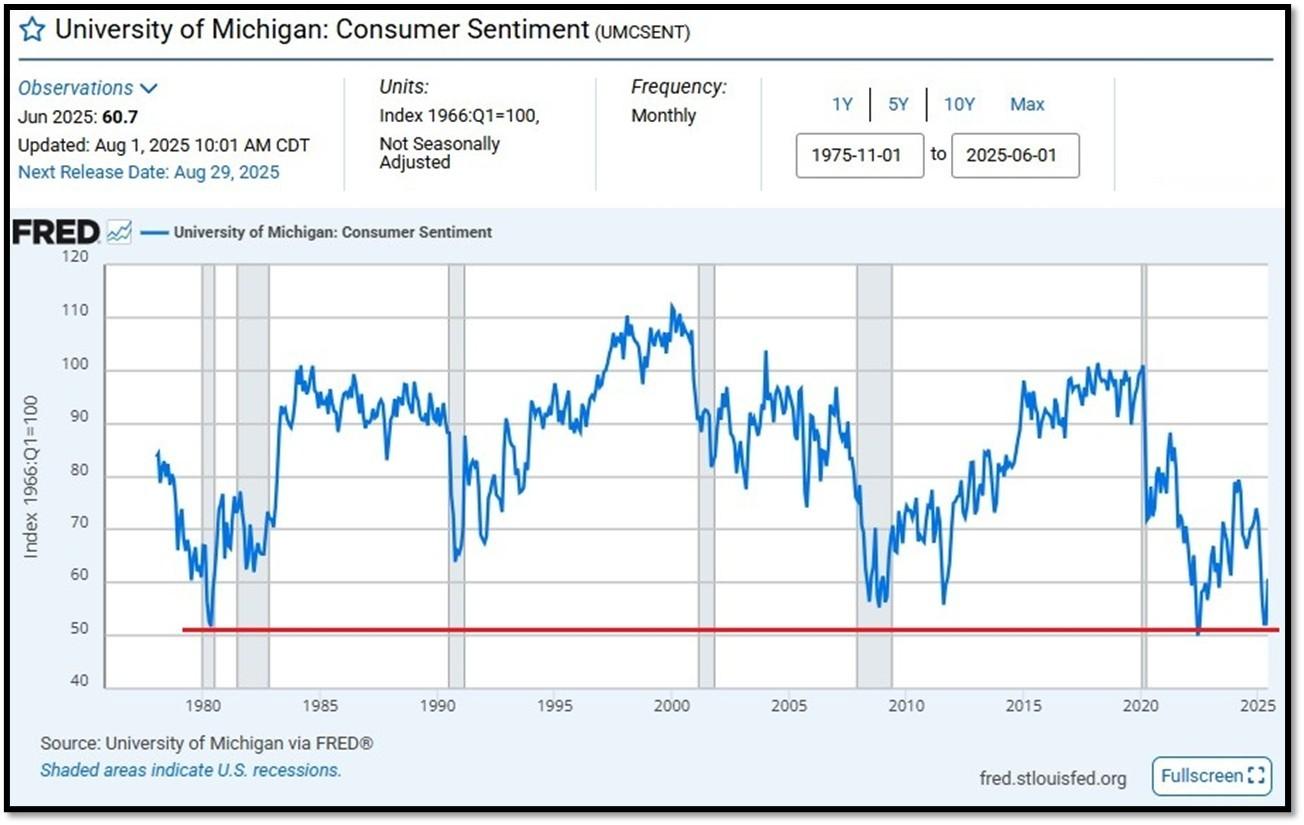
5C. University of Michigan, University of Michigan: Consumer Sentiment for February [UMCSENT] at 60.7, retrieved from FRED, Federal Reserve Bank of St. Louis, August 1, 2025. Back in June 2022, Consumer Sentiment hit a low point going back to April 1980. REF: UofM
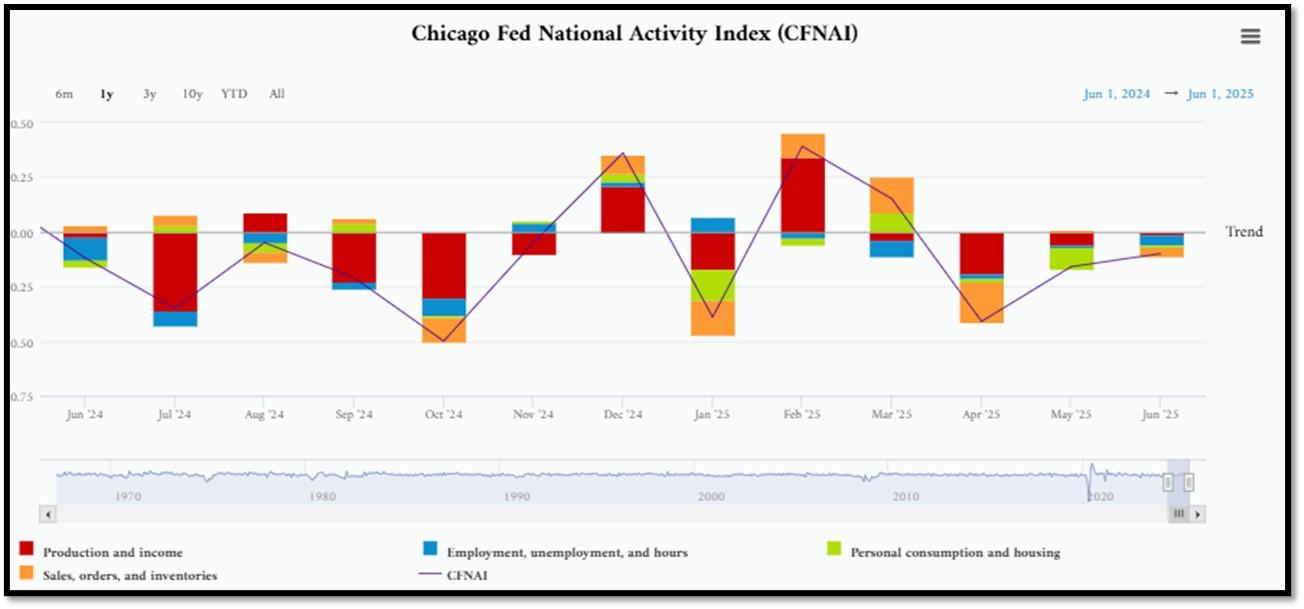
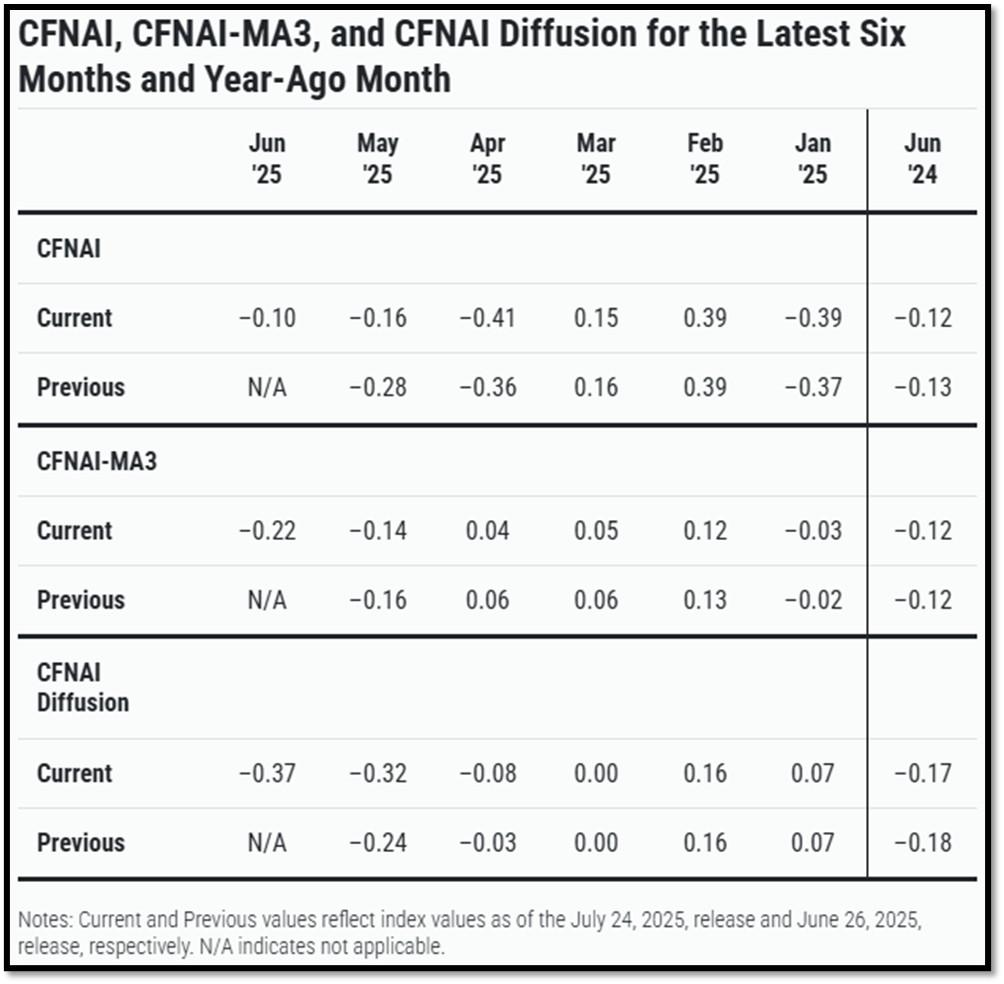
5D. The Chicago Fed National Activity Index (CFNAI) increased to –0.10 in June from –0.16 in May. Two of the four broad categories of indicators used to construct the index increased from May, but all four categories made negative contributions in June. The index’s three-month moving average, CFNAI-MA3, decreased to –0.22 in June from –0.14 in May. REF: ChicagoFed, June’s Report
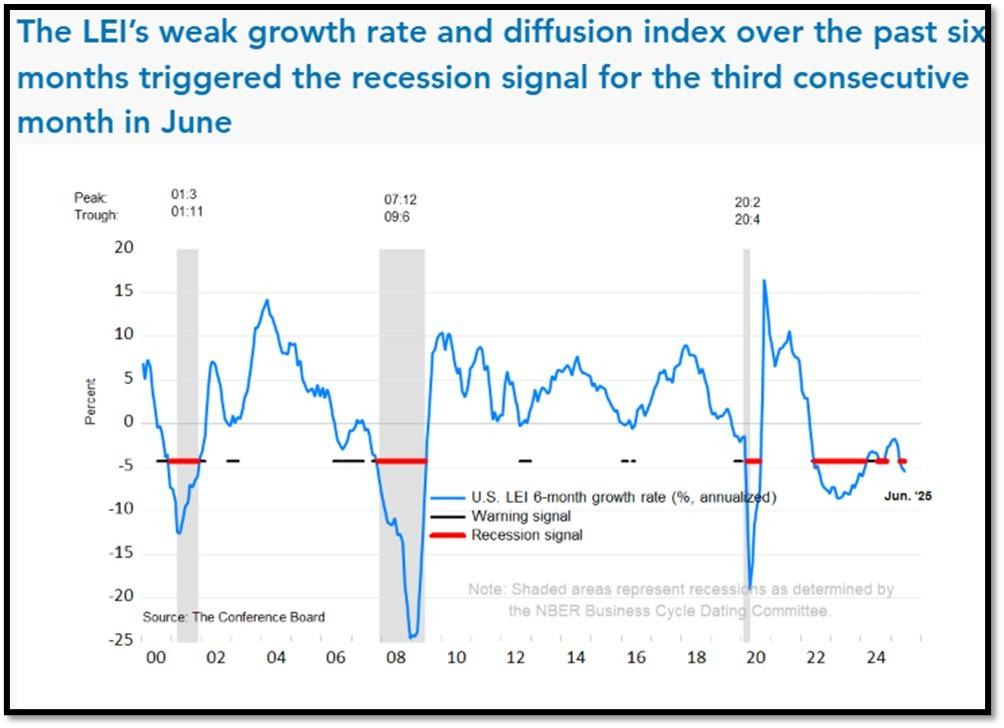
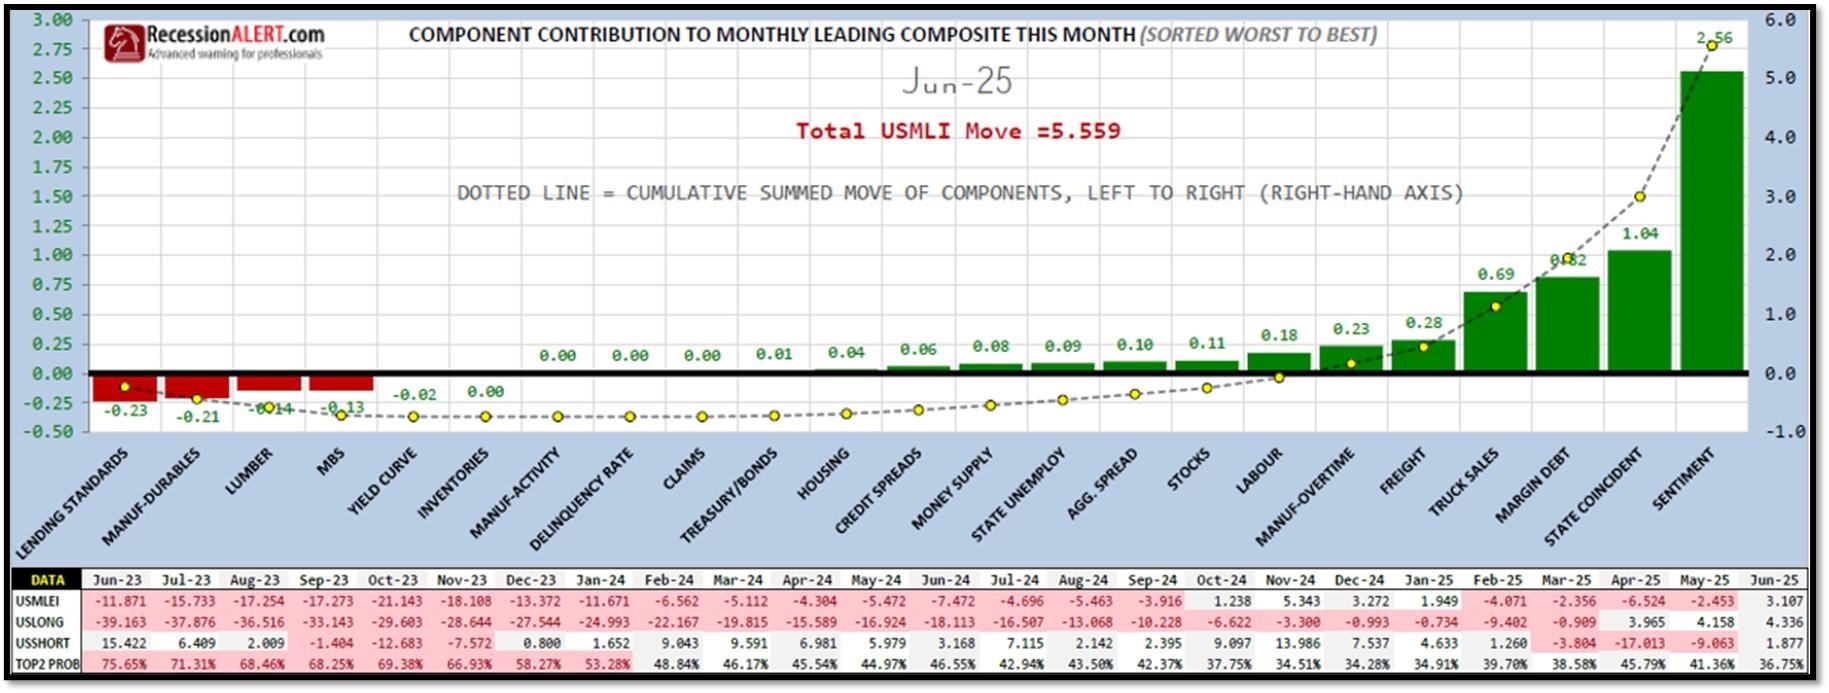
5E. (7/21/2025) The Conference Board Leading Economic Index (LEI) for the US declined by 0.3% in June 2025 to 98.8 (2016=100), after no change in May (revised upward from –0.1% originally reported). As a result, the LEI fell by 2.8% over the first half of 2025, a substantially faster rate of decline than the –1.3% contraction over the second half of 2024. The composite economic indexes are the key elements in an analytic system designed to signal peaks and troughs in the business cycle. The indexes are constructed to summarize and reveal common turning points in the economy in a clearer and more convincing manner than any individual component. The CEI is highly correlated with real GDP. The LEI is a predictive variable that anticipates (or “leads”) turning points in the business cycle by around 7 months. Shaded areas denote recession periods or economic contractions. The dates above the shaded areas show the chronology of peaks and troughs in the business cycle. The ten components of The Conference Board Leading Economic Index® for the U.S. include: Average weekly hours in manufacturing; Average weekly initial claims for unemployment insurance; Manufacturers’ new orders for consumer goods and materials; ISM® Index of New Orders; Manufacturers’ new orders for nondefense capital goods excluding aircraft orders; Building permits for new private housing units; S&P 500® Index of Stock Prices; Leading Credit Index™; Interest rate spread (10-year Treasury bonds less federal funds rate); Average consumer expectations for business conditions. REF: ConferenceBoard, LEI Report for June (Released on 7/31/2025)
We have experienced a “rolling recession” since June 2022 and are only now emerging from it. However, authorities are not labeling it a recession due to high employment data.
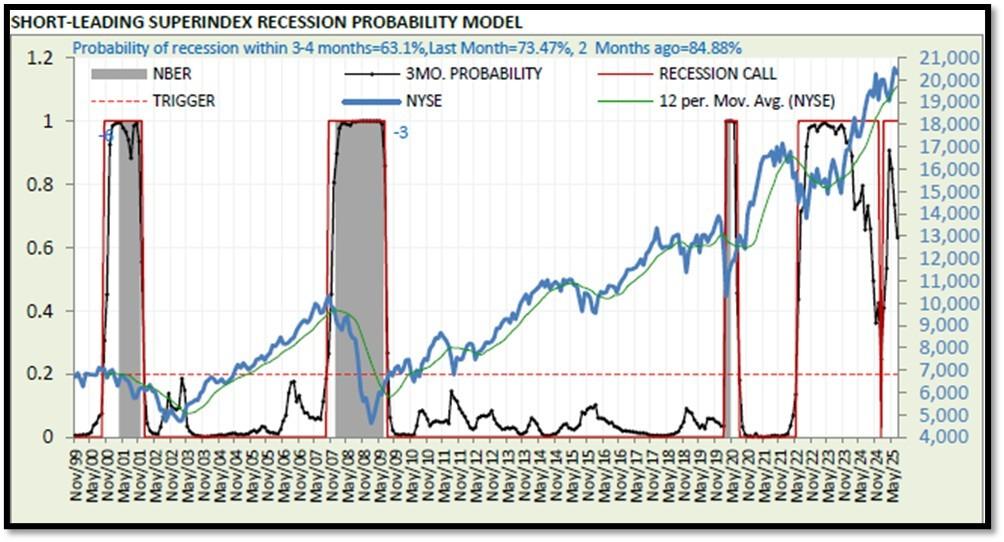
5F. Probability of U.S. falling into Recession within 3 to 4 months is currently at 63.1% (with data as of 08/4/2025 – Next Report 08/18/2025) according to RecessionAlert Research. Last release’s data was at 82.02%. This report is updated every two weeks. REF: RecessionAlertResearch
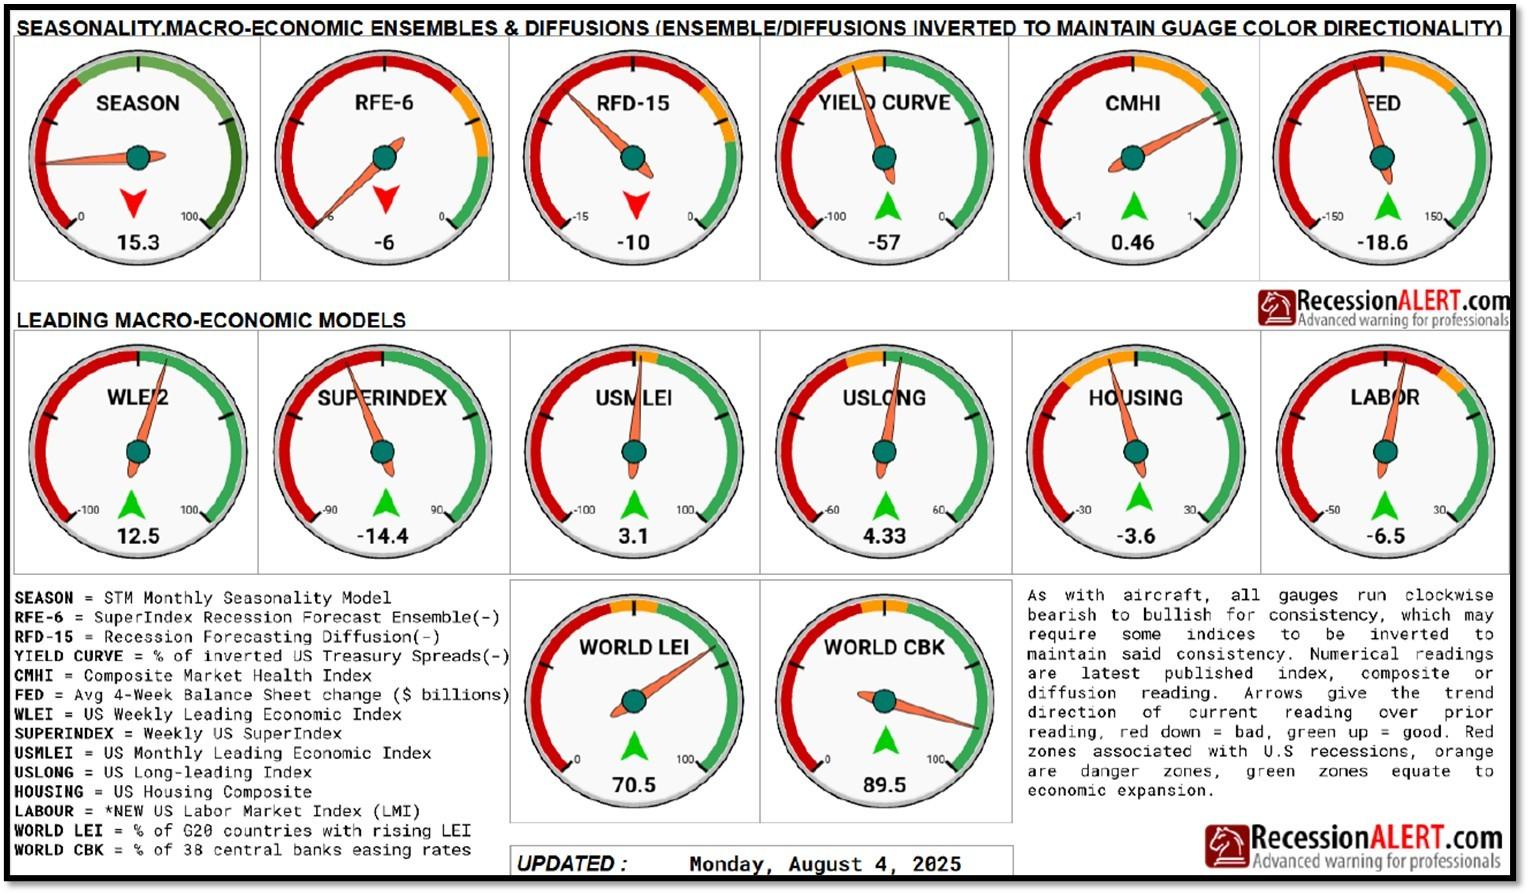
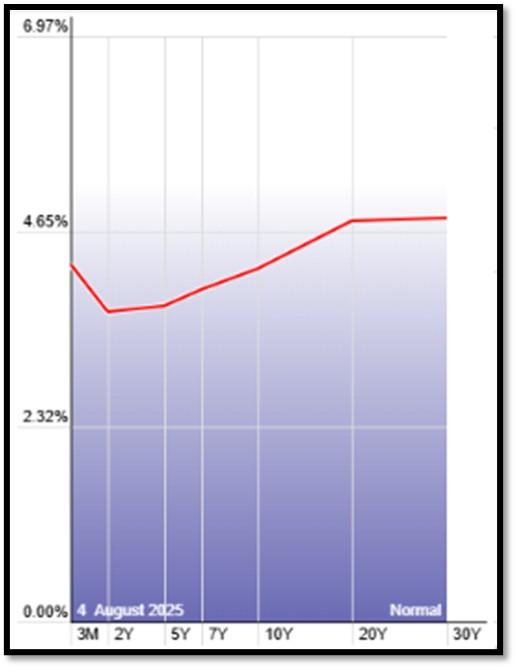
5G. Yield Curve as of 8/4/2025 is showing Normal. Spread on the 10-yr Treasury Yield (4.21%) minus yield on the 2-yr Treasury Yield (3.70%) is currently at 51bps. REF: Stockcharts The yield curve—specifically, the spread between the interest rates on the ten-year Treasury note and the three-month Treasury bill—is a valuable forecasting tool. It is simple to use and significantly outperforms other financial and macroeconomic indicators in predicting recessions two to six quarters ahead. REF: NYFED
5H. Recent Yields in 10-Year Government Bonds. REF: Source is from Bloomberg.com, dated 8/4/2025, rates shown below are as of 8/4/2025, subject to change.
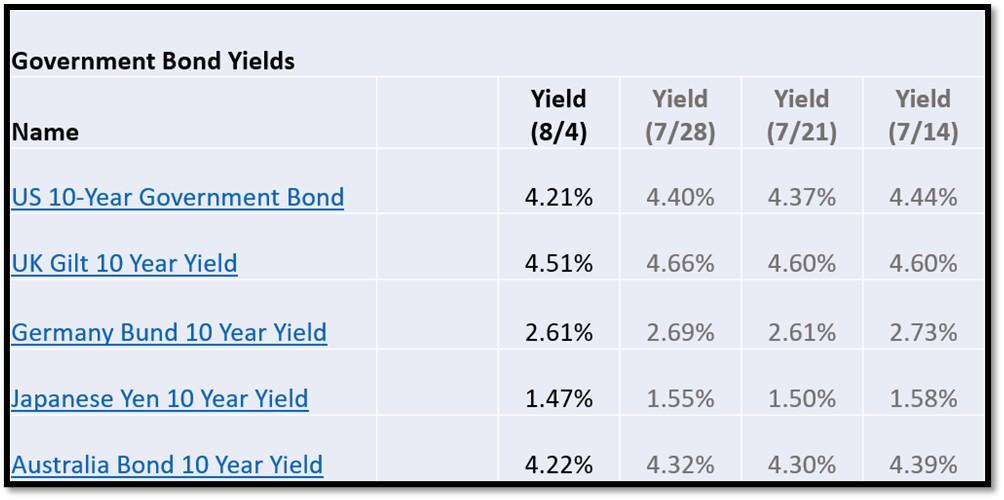
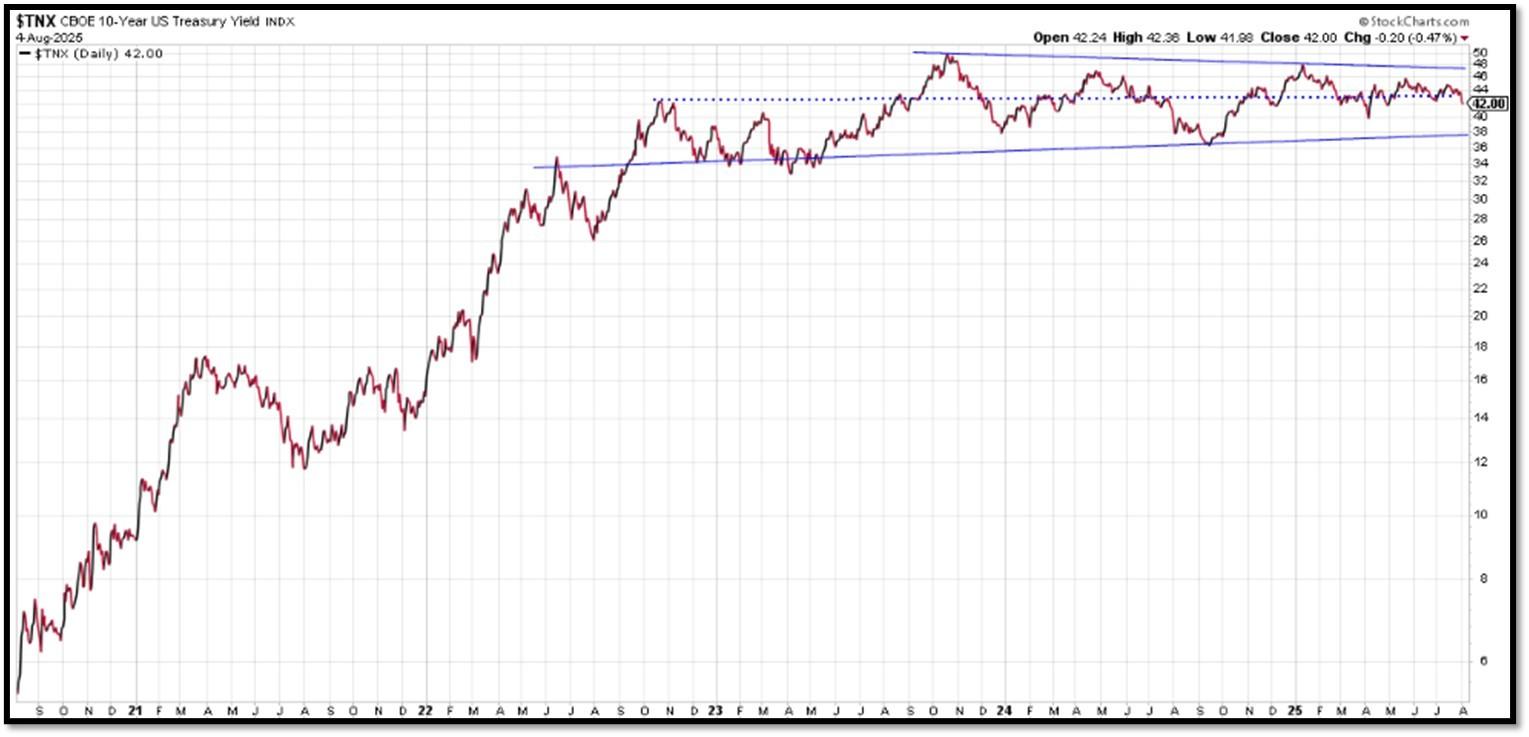
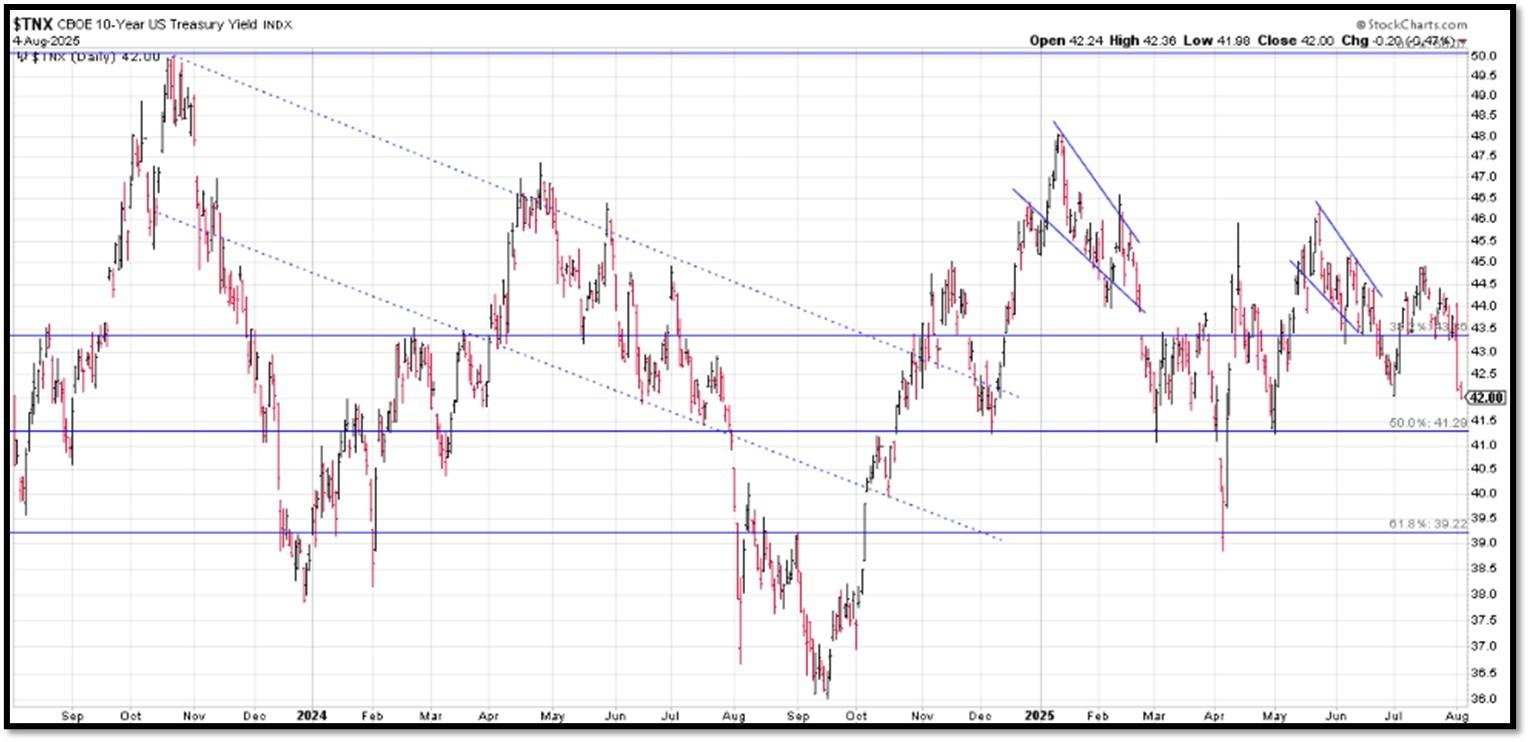
The 10-Year US Treasury Yield… The 10-Year Yield is indirectly related to inflation. I expect the 10-Year Yield to drop further as dis-inflation kicks in. REF: StockCharts1, StockCharts2
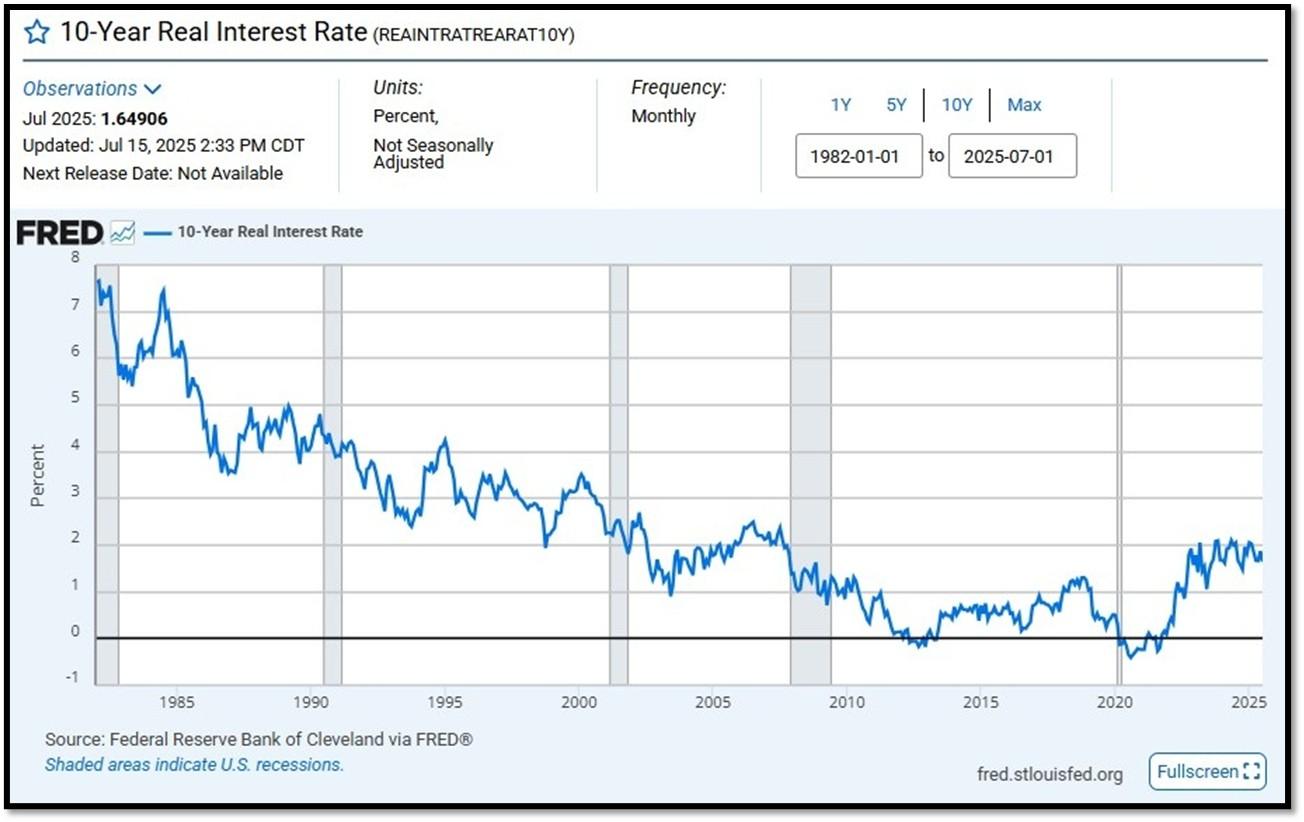
10-Year Real Interest Rate at 1.64906% as of 7/15/25. Last month’s data was 1.87166%. REF: REAINTRATREARAT10Y
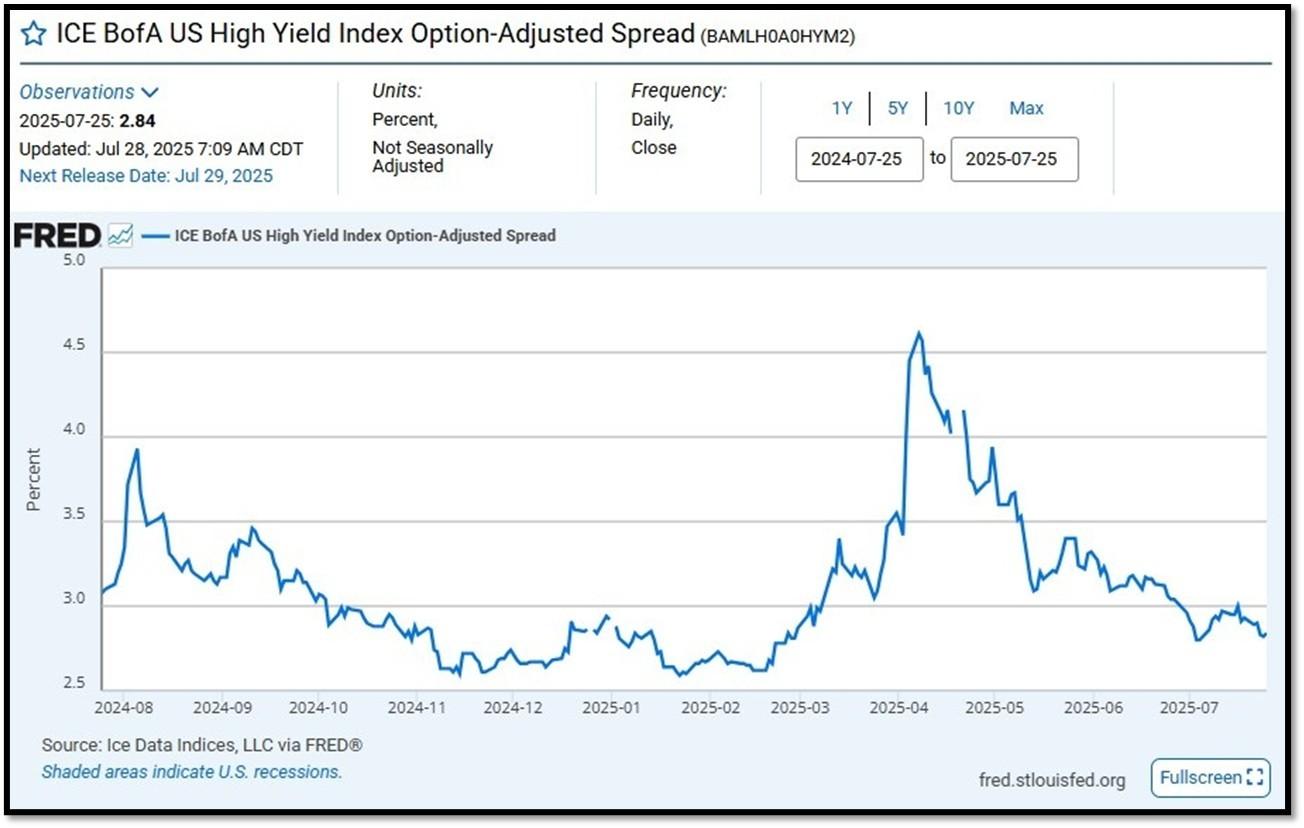
ICE BofA US High Yield Index Option-Adjusted Spread (BAMLH0A0HYM2) currently at 3.13 as of August 4, 2025. This is a key indicator of market sentiment, particularly regarding risk and economic health. At its core, the spread reflects the extra return investors demand to hold riskier corporate debt over safer government securities. High-yield bonds are issued by companies with lower credit ratings (below investment grade, like BB or lower), meaning they carry a higher chance of default. The spread compensates for this risk. When the spread is narrow—say, around 2.5% to 3%, as seen recently—it suggests investors are confident, willing to accept less extra yield because they perceive lower default risk or a strong economy. Narrow spreads often align with bullish markets, where cash is flowing, growth is steady, and fear is low. REF: FRED-BAMLH0A0HYM2
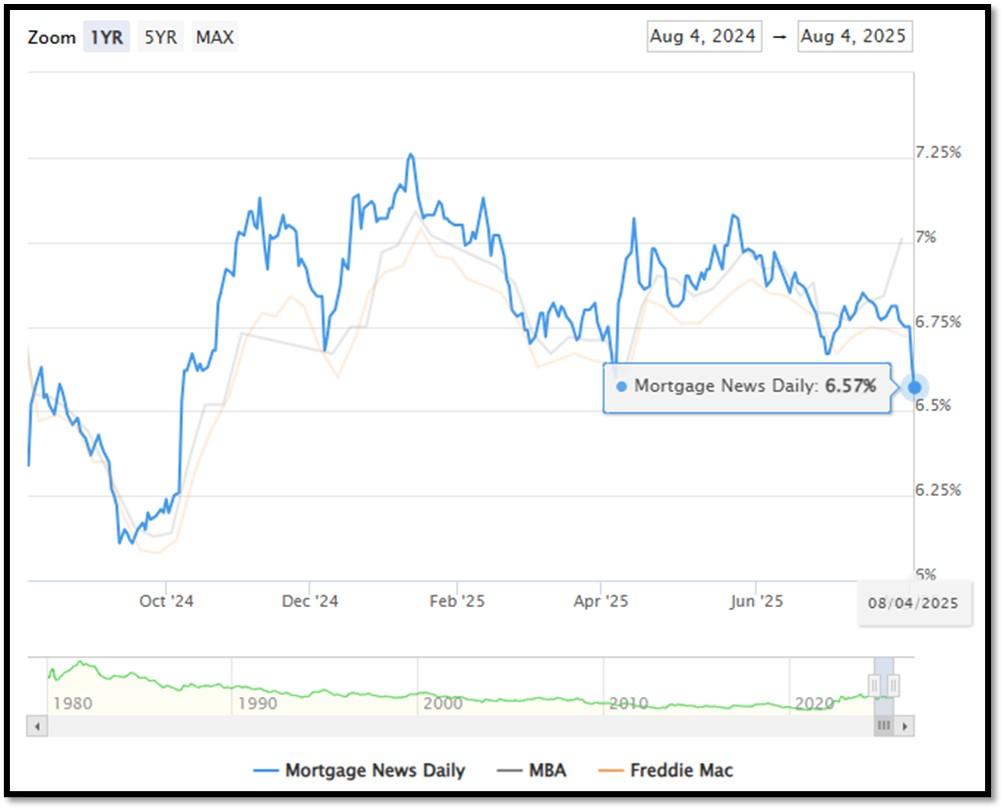
5I. (8/4/2025) Today’s National Average 30-Year Fixed Mortgage Rate is 6.57% (All Time High was 8.03% on 10/19/23). Last week’s data was 6.81%. This rate is the average 30-year fixed mortgage rates from several different surveys including Mortgage News Daily (daily index), Freddie Mac (weekly survey), Mortgage Bankers Association (weekly survey) and FHFA (monthly survey). REF: MortgageNewsDaily, Today’s Average Rate
The recent spike in the 30-year fixed-rate jumbo mortgage to 6.57%, compared to Freddie Mac’s rate at 6.72% and the Mortgage Bankers Association (MBA) rate at 7.01%, highlights key differences in the mortgage market. Jumbo mortgages, which exceed the conforming loan limits set by government agencies like Freddie Mac, typically carry higher interest rates because they are riskier for lenders. These loans are not backed by government entities, which increases the risk for lenders and, consequently, leads to higher rates. In contrast, Freddie Mac and MBA provide averages for conforming loans, which meet federal guidelines and have lower risk due to government backing, keeping their rates lower.
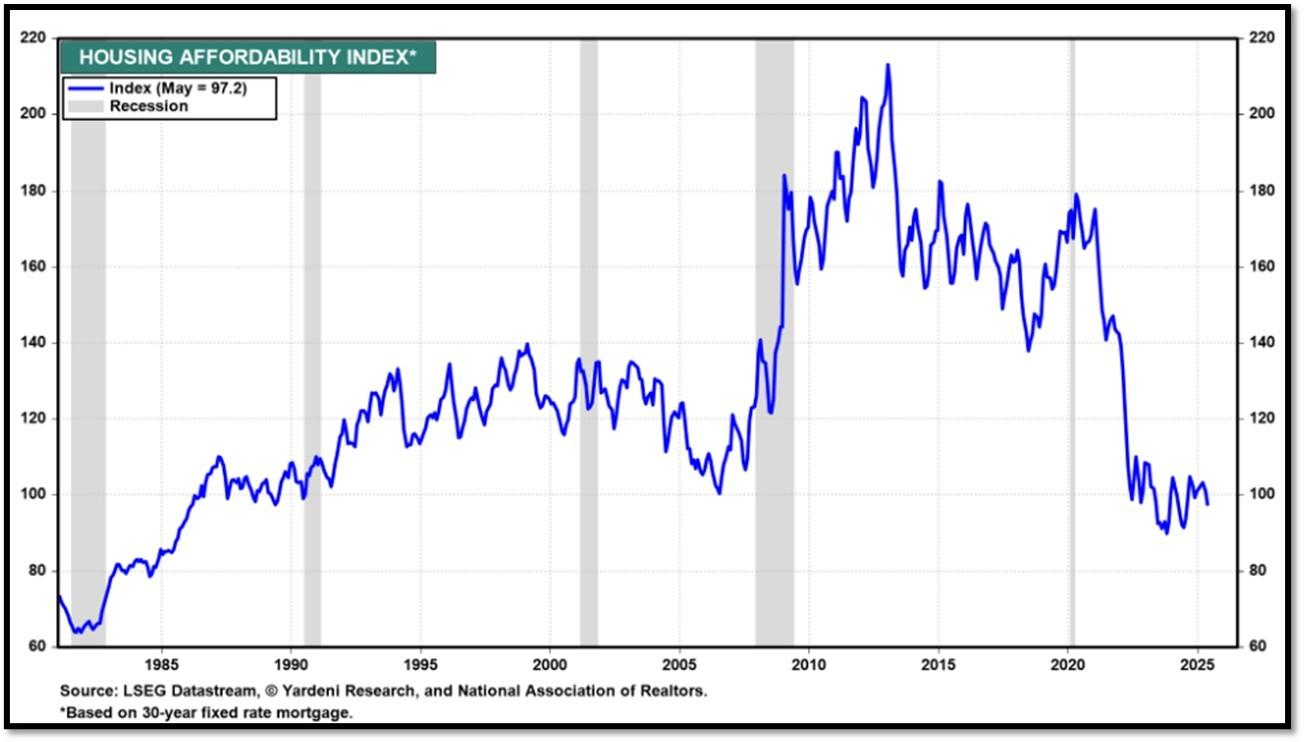
Housing Affordability Index for May = 97.2 // Apr = 101.0 // Mar = 103.2 // Feb = 102.2 // Jan = 100.7 // Dec = 100.7 // Nov = 99 // Oct = 102.3. Data provided by Yardeni Research. REF: Yardeni
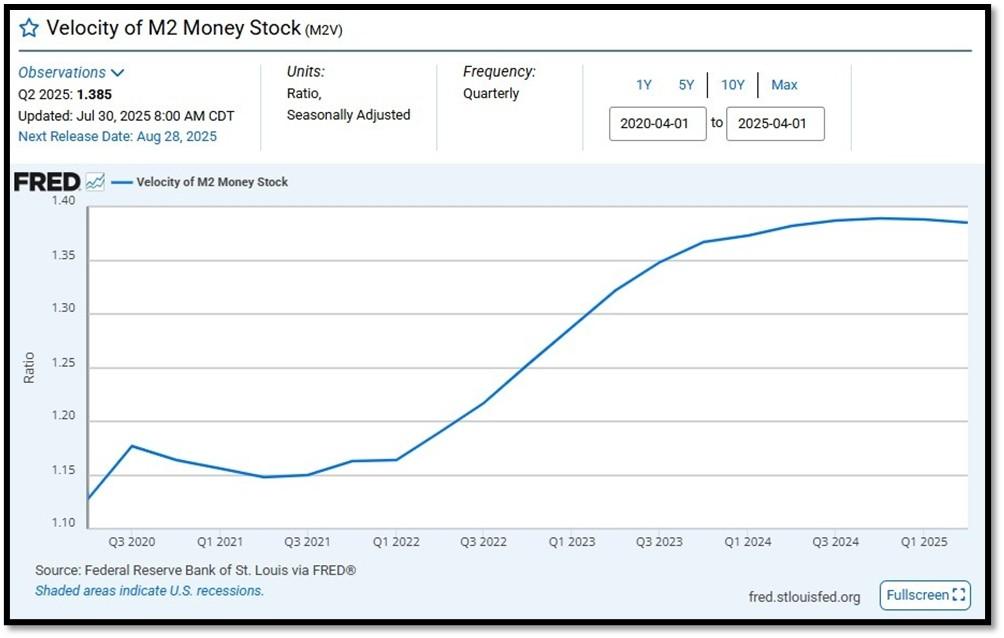
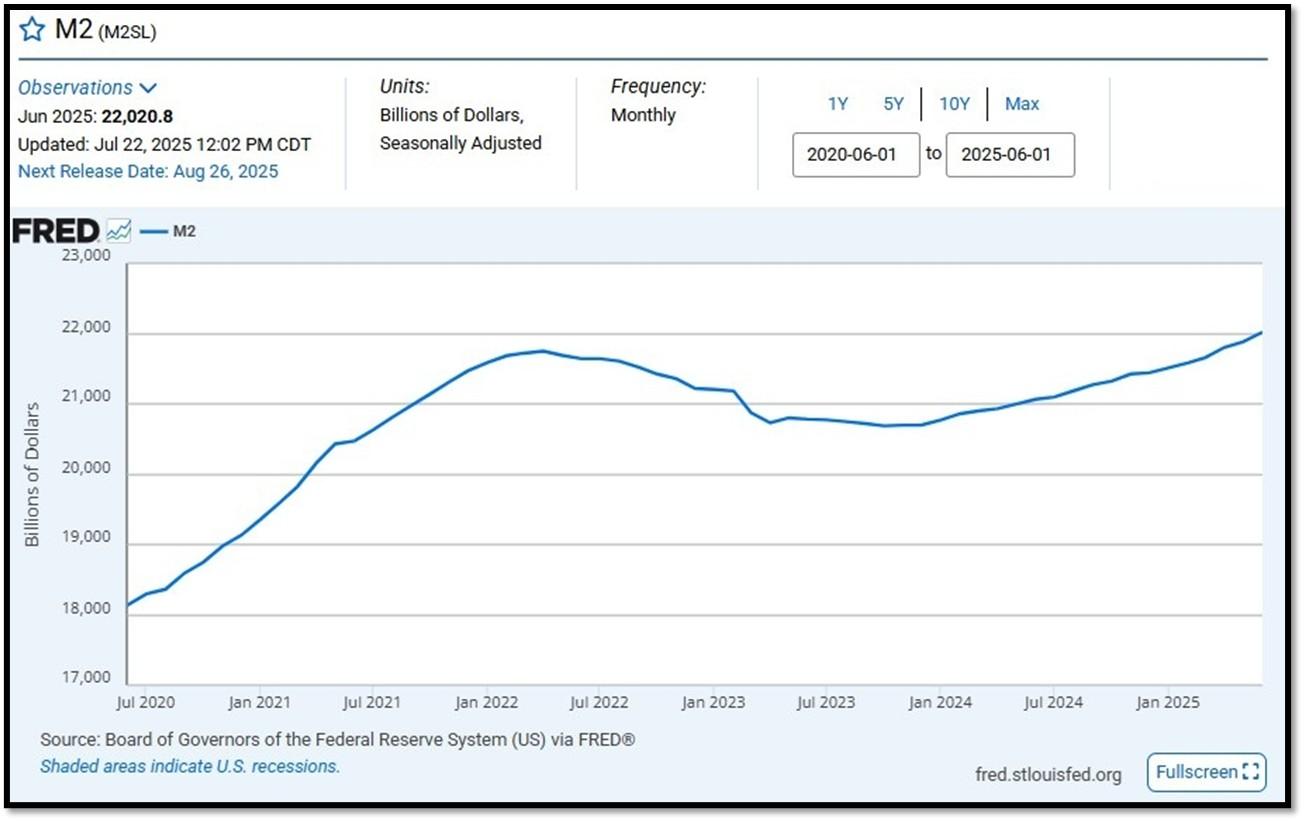
5J. Velocity of M2 Money Stock (M2V) with current read at 1.385 as of (Q2-2025 updated 7/30/2025). Previous quarter’s data was 1.386. The velocity of money is the frequency at which one unit of currency is used to purchase domestically- produced goods and services within a given time period. In other words, it is the number of times one dollar is spent to buy goods and services per unit of time. If the velocity of money is increasing, then more transactions are occurring between individuals in an economy. Current Money Stock (M2) report can be viewed in the reference link. REF: St.LouisFed-M2V
M2 consists of M1 plus (1) small-denomination time deposits (time deposits in amounts of less than $100,000) less IRA and Keogh balances at depository institutions; and (2) balances in retail MMFs less IRA and Keogh balances at MMFs. Seasonally adjusted M2 is constructed by summing savings deposits (before May 2020), small-denomination time deposits, and retail MMFs, each seasonally adjusted separately, and adding this result to seasonally adjusted M1. Board of Governors of the Federal Reserve System (US), M2 [M2SL], retrieved from FRED, Federal Reserve Bank of St. Louis; Updated on July 22, 2025. REF: St.LouisFed-M2
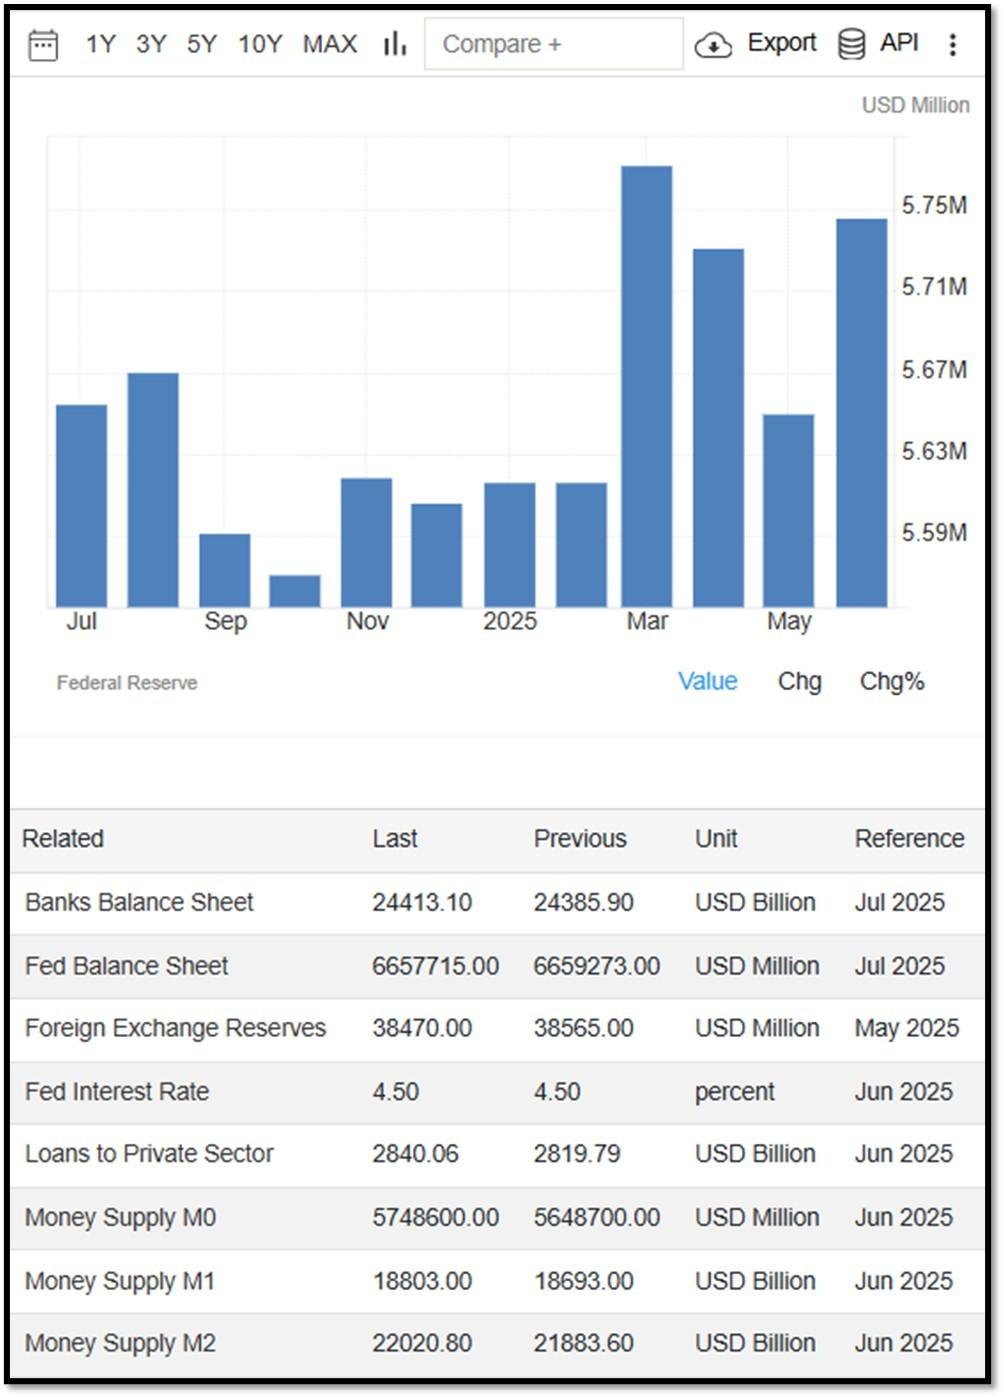
Money Supply M0 in the United States increased to 5,748,600 USD Million in June from 5,648,700 USD Million in May of 2025. Money Supply M0 in the United States averaged 1,200,279.70 USD Million from 1959 until 2025, reaching an all-time high of 6,413,100.00 USD Million in December of 2021 and a record low of 48,400.00 USD Million in February of 1961. REF: TradingEconomics, M0
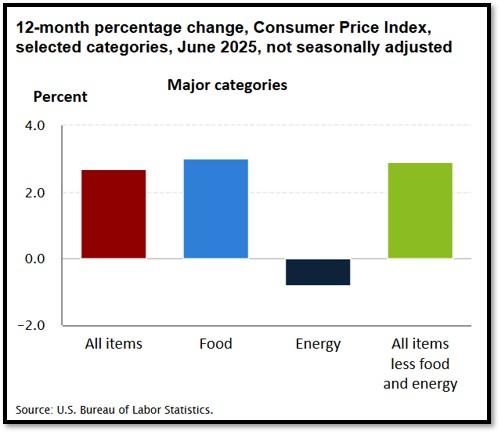
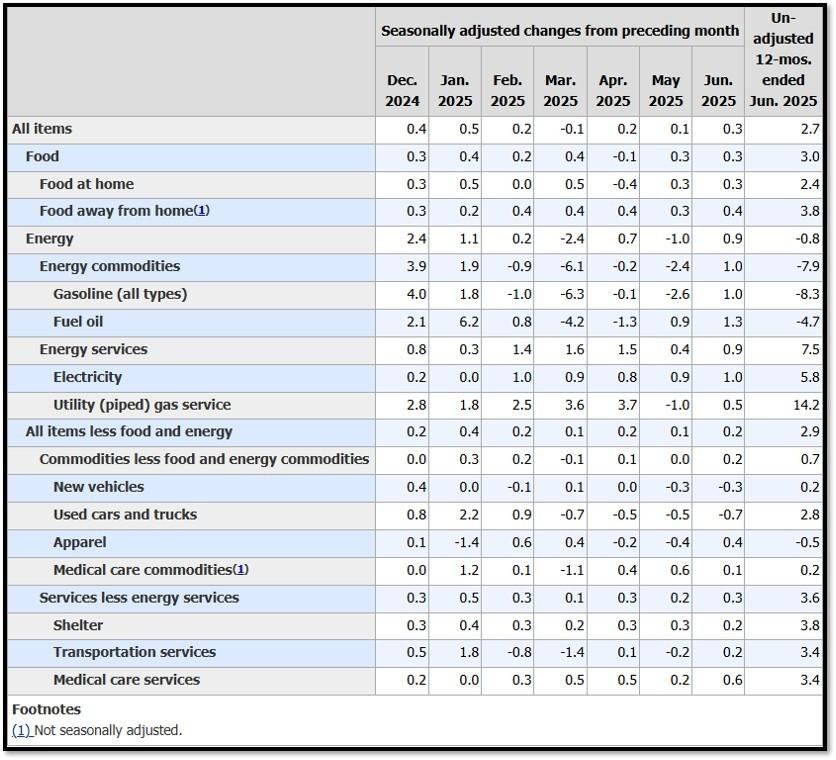
5K. In June, the Consumer Price Index for All Urban Consumers rose 0.3 percent, seasonally adjusted, and rose 2.7 percent over the last 12 months, not seasonally adjusted. The index for all items less food and energy increased 0.2 percent in June (SA); up 2.9 percent over the year (NSA). July 2025 CPI data are scheduled to be released on August 12, 2025, at 8:30AM-ET. REF: BLS, BLS.GOV
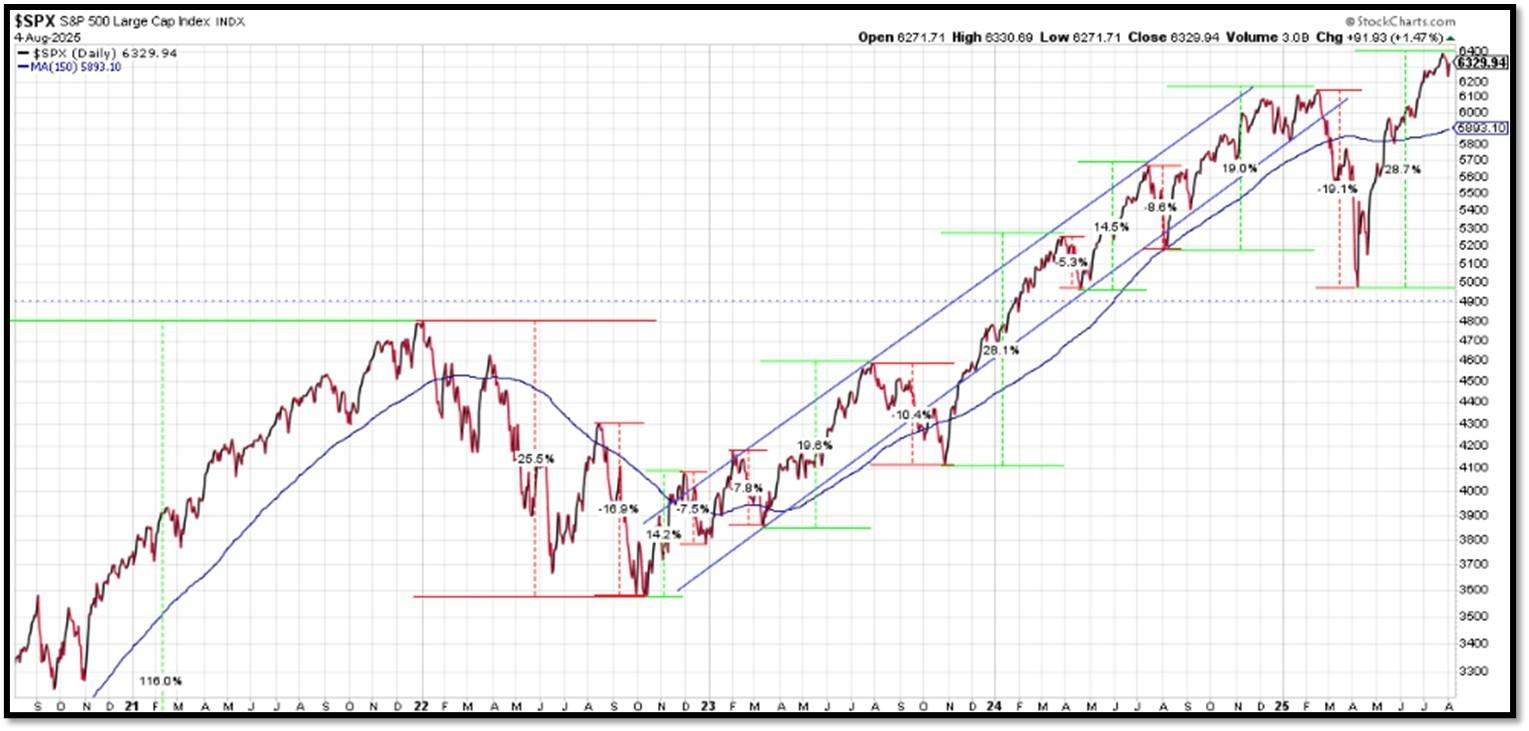
5L. Technical Analysis of the S&P500 Index. Click onto reference links below for images.
- Short-term Chart: Trend Bullish on 8/4/2025 – REF: Short-term S&P500 Chart by Marc Slavin (Click Here to Access Chart)
- Medium-term Chart: Trend Bearish to Bullish on 8/4/2025 – REF: Medium-term S&P500 Chart by Marc Slavin (Click Here to Access Chart)
- Market Timing Indicators – S&P500 Index as of 8/4/2025 – REF: S&P500 Charts (7 of them) by Joanne Klein’s Top 7 (Click Here to Access Updated Charts)
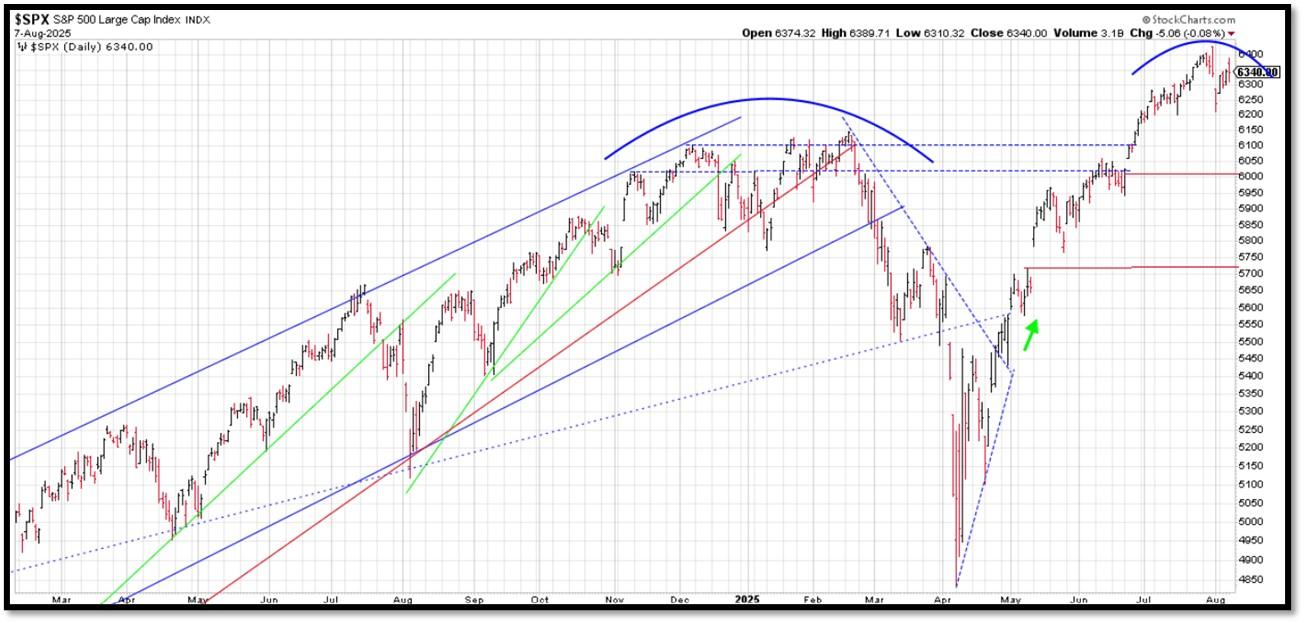
- The S&P500 is hitting all-time-high, rebounding from a V-shaped recovery. This is one of the ‘most-hated’ rallies. REF: Stockcharts
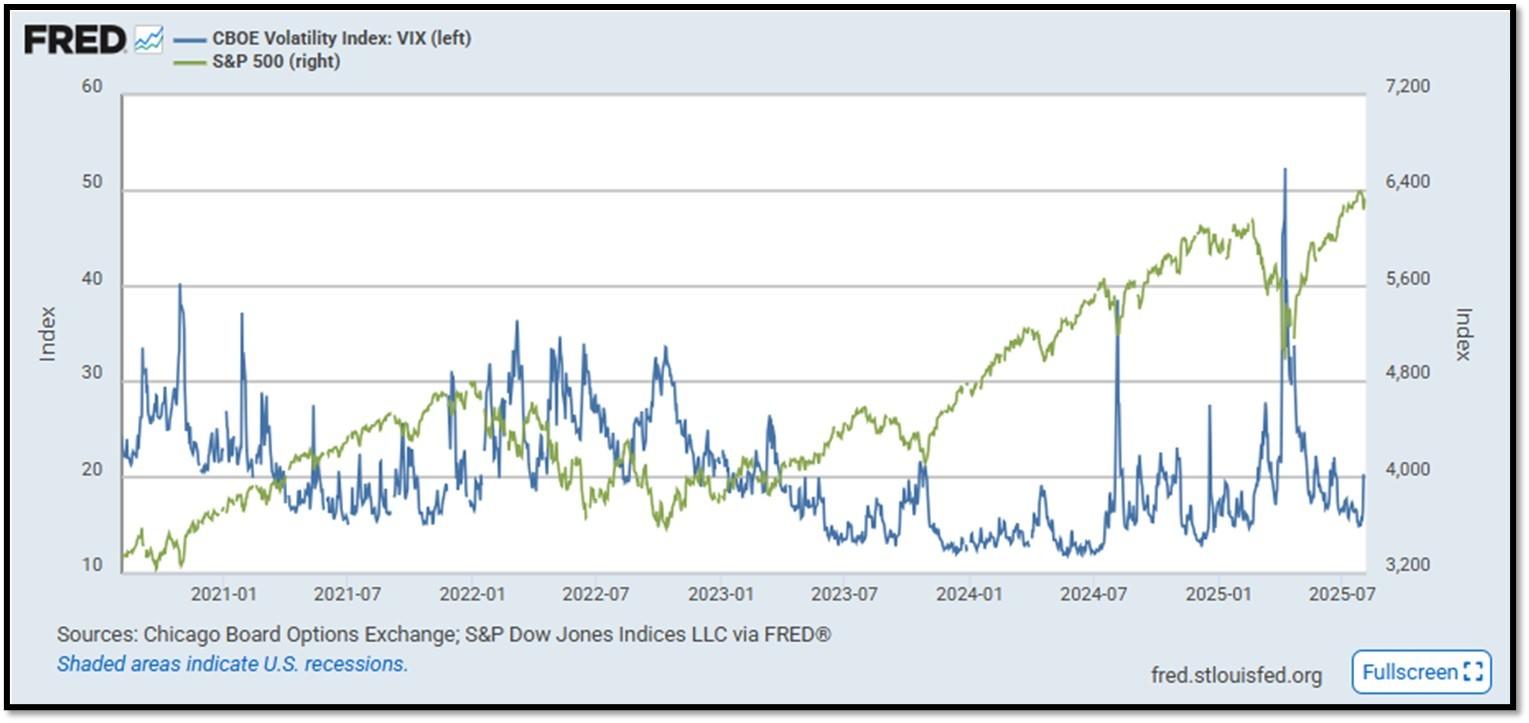
- S&P500 and CBOE Volatility Index (VIX) as of 7/28/2025. REF: FRED, Today’s Print
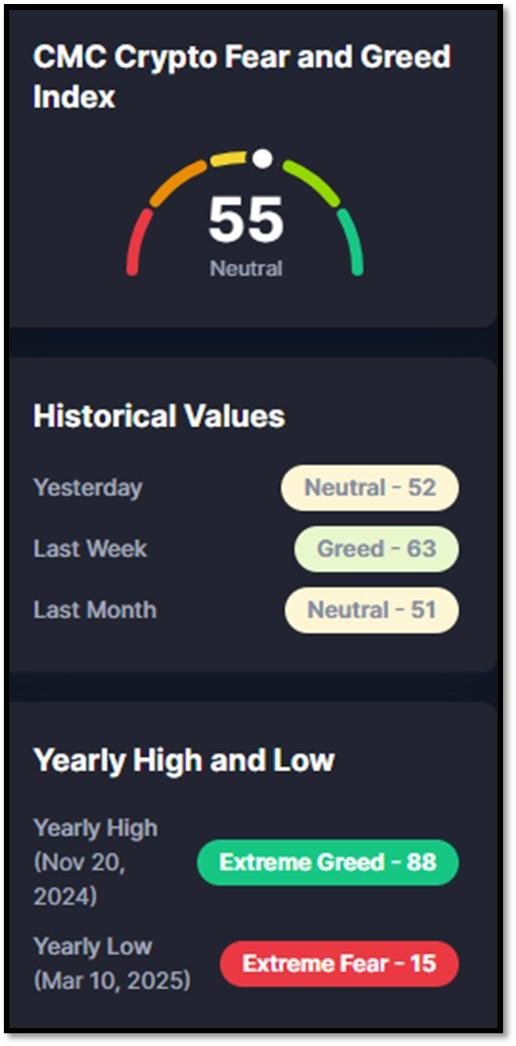
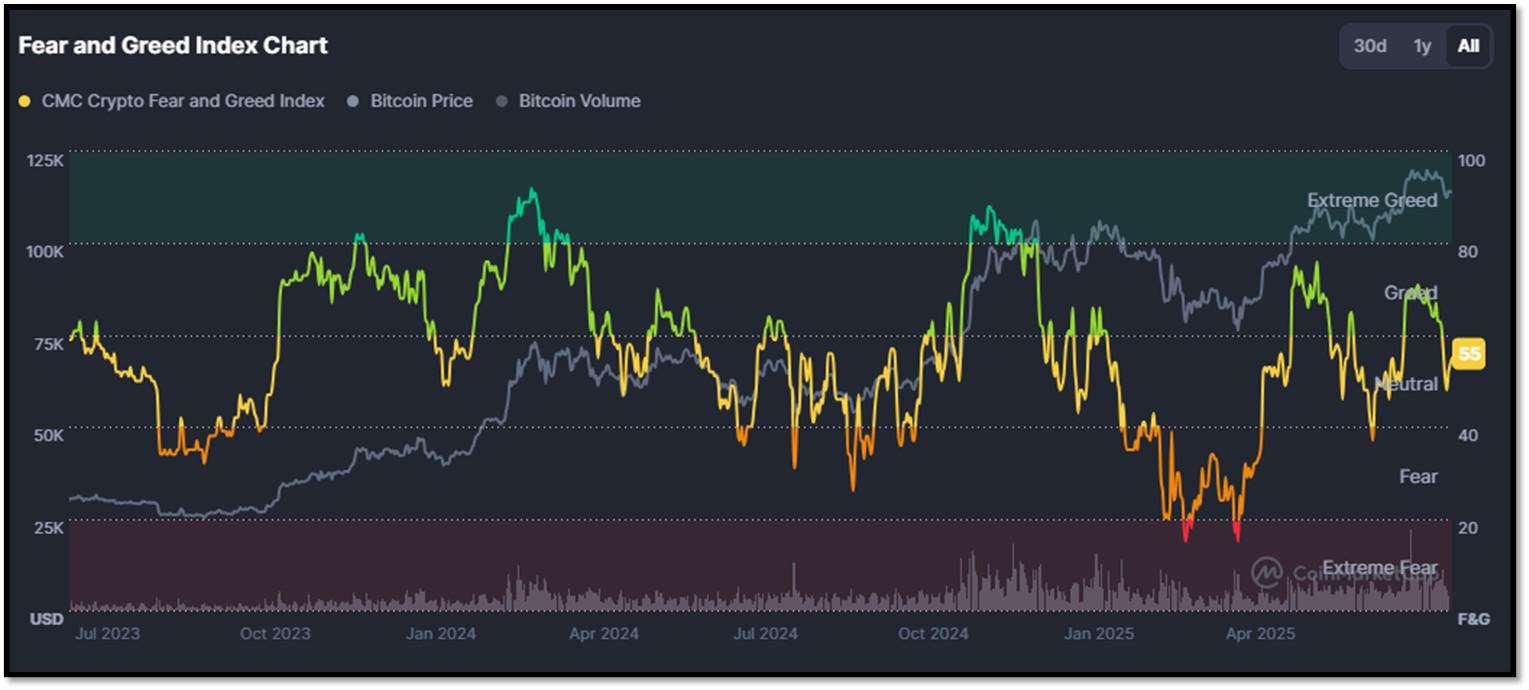
5M. Most recent read on the Crypto Fear & Greed Index with data as of 8/4/2025 is 55 (Neutral). Last week’s data was 63 (Greed) (1-100). Fear & Greed Index – A Contrarian Data. The crypto market behavior is very emotional. People tend to get greedy when the market is rising which results in FOMO (Fear of missing out). Also, people often sell their coins in irrational reaction of seeing red numbers. With the Crypto Fear and Greed Index, the data try to help save investors from their own emotional overreactions. There are two simple assumptions:
- Extreme fear can be a sign that investors are too worried. That could be a buying opportunity.
- When Investors are getting too greedy, that means the market is due for a correction.
Therefore, the program for this index analyzes the current sentiment of the Bitcoin market and crunch the numbers into a simple meter from 0 to 100. Zero means “Extreme Fear”, while 100 means “Extreme Greed”. REF: Coinmarketcap.com, Today’sReading
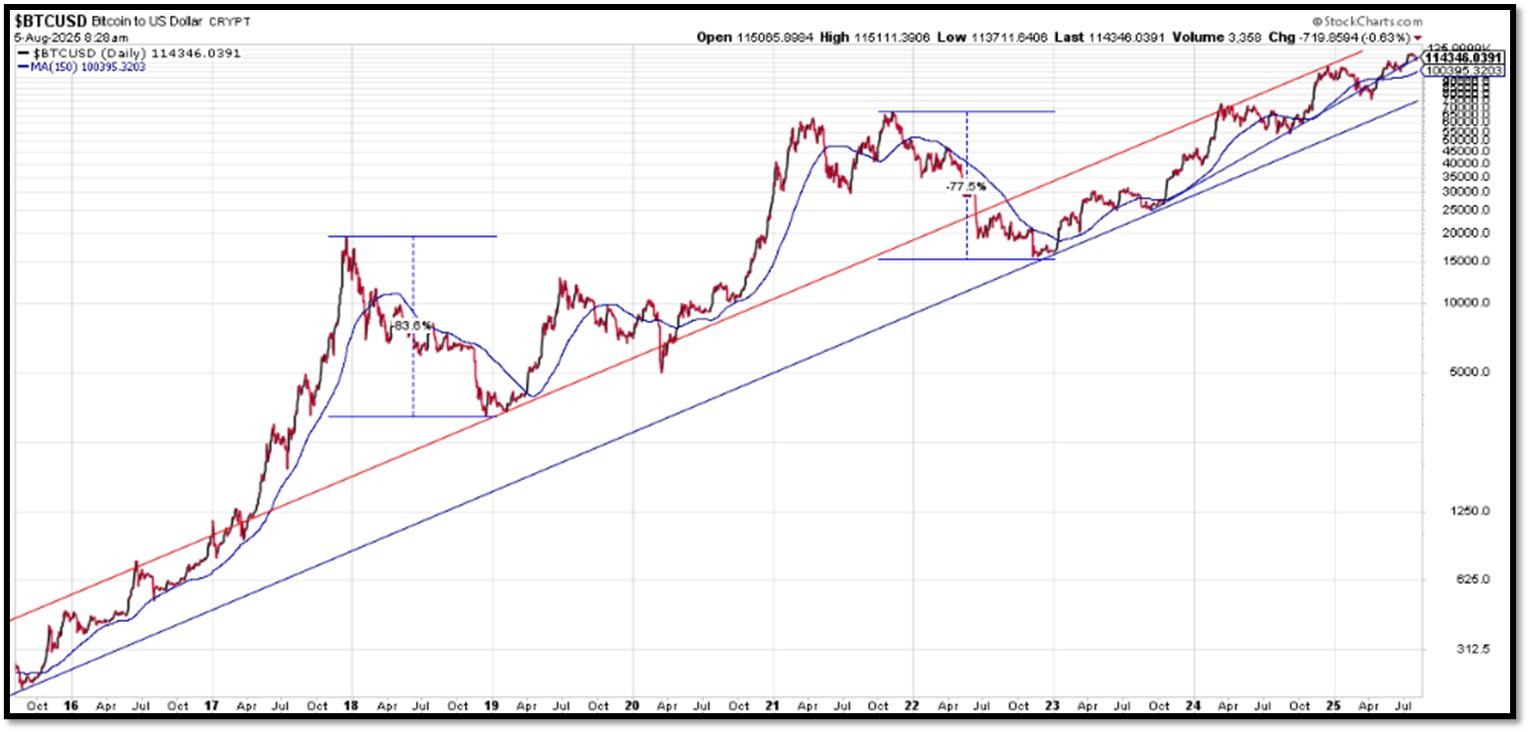
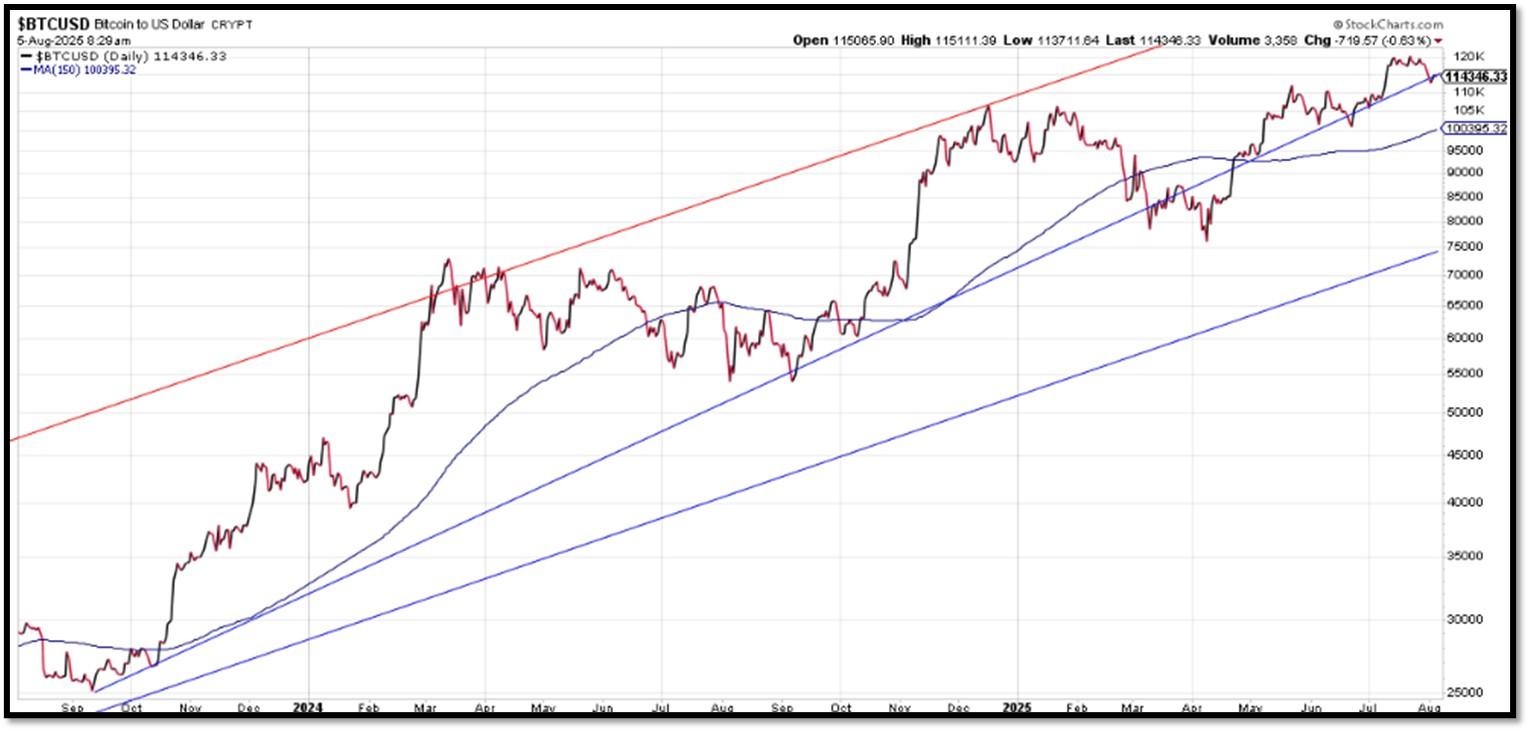
Bitcoin – 10-Year & 2-Year Charts. REF: Stockcharts10Y, Stockcharts2Y
From the desk of our Chief Investment Officer
As an investment professional with over twenty-six years of experience in the financial services industry, Andrew helps clients to protect, grow and transfer wealth during their lifetime with objective, unbiased, customized and efficient strategies.
Education, Professional Licenses Acquired & Affiliations
- Passed the Series 7, 63, 65 and 24 license examinations
- Currently holding Series 65 License
- BA in Economics – Boston University (Boston, MA) 1993
- Certificate in Commodities Trading – New York University (New York, NY) 1991
- Certificate in Financial Planning – New York University (New York, NY) April 2011
With extensive experience in the Financial Services Industry, Andrew Tang and Turner Financial Group provides disciplined wealth management with an intelligent caring approach to each and every client that compliments the Dedicated Financial offering.


Len writes much of his own content, and also shares helpful content from other trusted providers like Turner Financial Group (TFG).
The material contained herein is intended as a general market commentary, solely for informational purposes and is not intended to make an offer or solicitation for the sale or purchase of any securities. Such views are subject to change at any time without notice due to changes in market or economic conditions and may not necessarily come to pass. This information is not intended as a specific offer of investment services by Dedicated Financial and Turner Financial Group, Inc.
Dedicated Financial and Turner Financial Group, Inc., do not provide tax, legal or accounting advice. You should consult your own tax, legal and accounting advisors before engaging in any transaction.
Any hyperlinks in this document that connect to Web Sites maintained by third parties are provided for convenience only. Turner Financial Group, Inc. has not verified the accuracy of any information contained within the links and the provision of such links does not constitute a recommendation or endorsement of the company or the content by Dedicated Financial or Turner Financial Group, Inc. The prices/quotes/statistics referenced herein have been obtained from sources verified to be reliable for their accuracy or completeness and may be subject to change.
Past performance is no guarantee of future returns. Investing involves risk and possible loss of principal capital. The views and strategies described herein may not be suitable for all investors. To the extent referenced herein, real estate, hedge funds, and other private investments can present significant risks, including loss of the original amount invested. All indexes are unmanaged, and an individual cannot invest directly in an index. Index returns do not include fees or expenses.
Turner Financial Group, Inc. is an Investment Adviser registered with the United States Securities and Exchange Commission however, such registration does not imply a certain level of skill or training and no inference to the contrary should be made. Additional information about Turner Financial Group, Inc. is also available at www.adviserinfo.sec.gov. Advisory services are only offered to clients or prospective clients where Turner Financial Group, Inc. and its representatives are properly licensed or exempt from licensure. No advice may be rendered by Turner Financial Group, Inc. unless a client service agreement is in place.


