

- 1. This week’s economic news highlighted a mix of resilience and challenges in the U.S. economy amidst global trade shifts.
- 2. Amazon just reported its Q2 2025 earnings that beat analysts’ expectations.
- 3. Many of our clients own the Private Shares Fund as part of their investment allocations. The Private Shares Fund (PIIVX) reports a significant update for its portfolio company xAI as of June 30, 2025.
- 4. World Watch
- 4A. President Donald Trump signed an executive order revising tariff rates before an August 1 deadline, imposing a 40% duty on all transshipped goods to combat tariff evasion, as reported by CNBC.
- 4B. China’s nationwide childcare subsidy program, effective retroactively from January 1, 2025, is a strategic response to the country’s declining birth rate and demographic challenges.
- 4C. An updated snapshot of the current global state of economy.
- 5. Quant & Technical Corner – A selection of quantitative & technical data we monitor on a regular basis to help gauge the overall financial market conditions and the investment environment.
1. This week’s economic news highlighted a mix of resilience and challenges in the U.S. economy amidst global trade shifts.
The U.S. economy grew at a 3% annualized rate in Q2, rebounding from Q1’s -0.5% contraction, driven by reduced imports and steady consumer spending, though first-half GDP averaged just 0.3%. Inflation remained moderate, with core PCE at 2.5% and CPI at 2.7% year-over-year in June, but tariff-related pressures are expected to push inflation toward 3.1% by year-end. The labor market showed strength with 147,000 jobs added in June and unemployment steady at 4.1%, though consumer confidence dipped due to tariff concerns. This week, tech giants like Amazon, Microsoft, Meta, and Apple reported strong Q2 2025 earnings, with most beating revenue and profit expectations, though Amazon’s stock dipped due to cautious guidance and AWS margin concerns, while Alphabet missed estimates, leading to varied stock reactions.
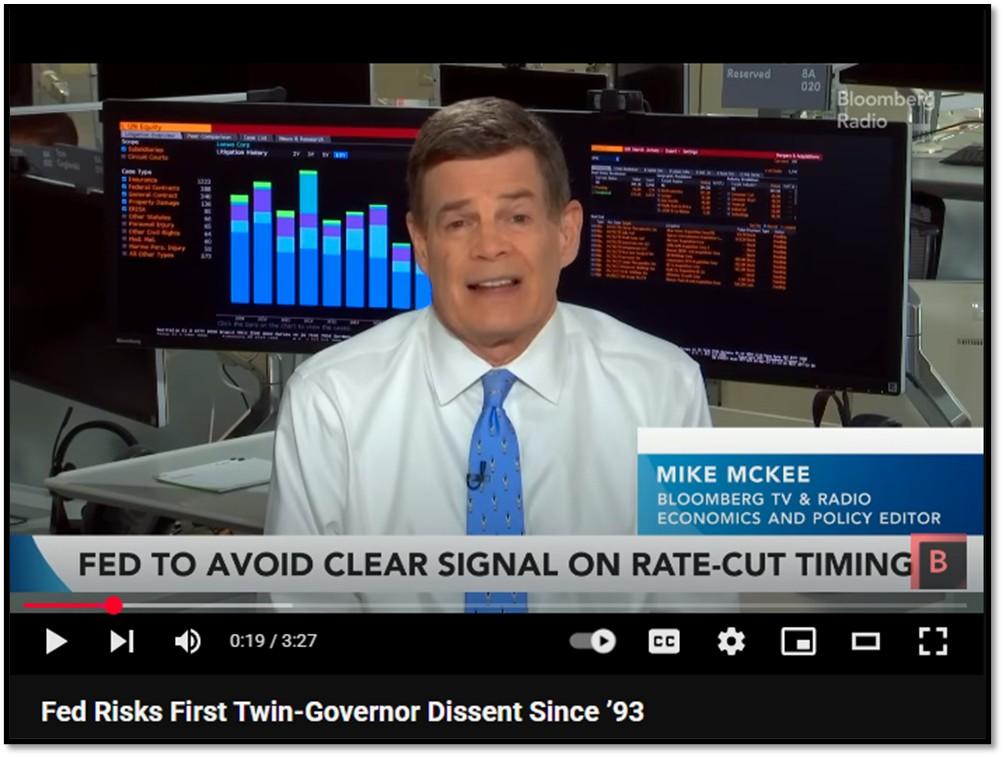
Trade policy dominated headlines, with President Trump imposing a 40% tariff on transshipped goods to curb evasion, alongside reciprocal tariffs ranging from 10% (UK) to 41% (Syria), impacting countries like Canada (35%) and Brazil (threatened 50%). Trade deals with Japan, South Korea, and the EU set lower tariffs (15% to 20%). The Federal Reserve held rates at 4.25% to 4.50%, with two governors dissenting for a 25-basis-point cut, signaling potential easing in September. Markets reacted variably, with the S&P 500 stable but Asian indices like South Korea’s Kospi dropping 3%. While stagflation risks linger, the economy’s resilience offers cautious optimism. REF: Briefing, BEA-Personal Income, Fed, FOMC
|
Remaining FOMC Meetings for 2025 |
|
|
September |
16-17* |
|
October |
28-29 |
|
December |
9-10* |
|
* Meeting associated with a Summary of Economic Projections. |
|
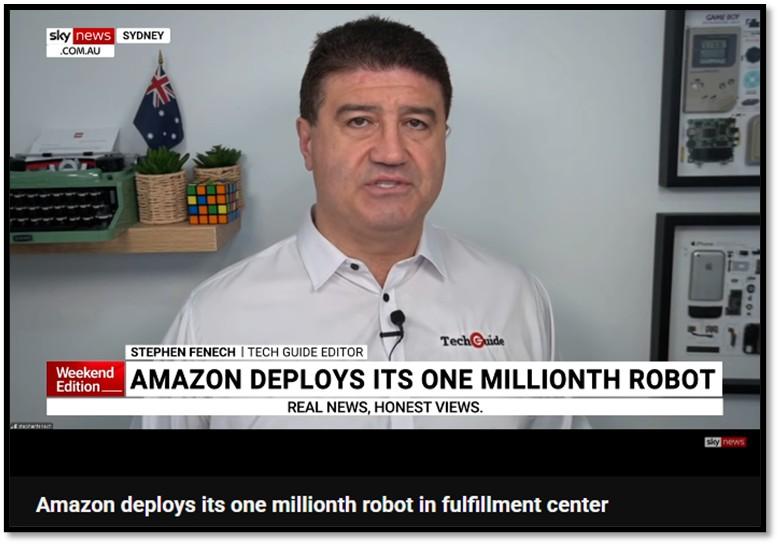
2. Amazon just reported its Q2 2025 earnings that beat analysts’ expectations.
But that’s not the story here… The real story is the massive milestone Amazon achieved as of the end of June. Amazon deployed its one-millionth robot and launched DeepFleet, a generative AI foundation model to optimize its robotic fleet, reinforcing its leadership in warehouse automation. As the world’s largest operator of industrial mobile robots across 300 facilities, Amazon’s DeepFleet, built with AWS tools, boosts robot efficiency by 10%, reducing congestion and speeding up deliveries. As a benchmark for U.S. commerce, Amazon’s advancements drive industry standards, pushing competitors to adopt AI-driven logistics. This milestone, rooted in the 2012 Kiva Systems acquisition, features robots like Hercules and Proteus, complementing 1.56 million employees. Amazon’s innovations strengthen its dominance and shape e-commerce’s future, with businesses closely following its lead.
The implications are significant for labor, competition, and the economy. DeepFleet’s efficiency gains enhance Amazon’s edge, with 75% of global deliveries already robot-assisted, pressuring rivals like Walmart to invest in automation. While Amazon upskills 700,000 workers, AI may reduce roles, raising displacement concerns. Economically, efficiency could offset costs from 40% transshipment tariffs, but competitors’ automation costs may fuel inflation. As a U.S. commerce pacesetter, Amazon’s robotics push signals an AI-driven future, urging businesses to adapt or lag behind. Click onto pictures below to access videos. REF: AMZN, Q2-WebSlides
NOTE: Not investment advice or recommendations. Investor should consider the investment objective, risks, charges and expenses carefully before investing. For additional information about securities mentioned above or in the video, please visit the company’s website (listed below) of referenced securities mentioned above. Read carefully before investing.
Amazon: https://ir.aboutamazon.com/overview/default.aspx

3. Many of our clients own the Private Shares Fund as part of their investment allocations. The Private Shares Fund (PIIVX) reports a significant update for its portfolio company xAI as of June 30, 2025.
Per the Financial Times and Reuters, xAI is in early talks for a fundraising round that could value the AI firm at $170 billion–$200 billion, a sharp rise from its $80 billion valuation in March 2025, when it acquired the social media platform X. The company secured $10 billion in commitments this summer and plans to invest $18 billion in data centers to bolster AI infrastructure. This valuation surge and strategic focus on AI development enhance xAI’s growth potential, strengthening the Fund’s exposure to high-growth technology.
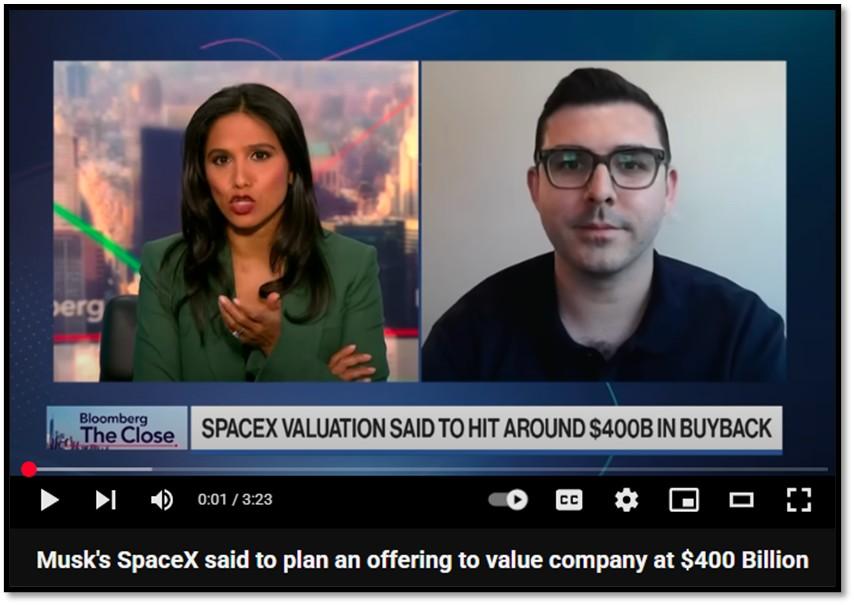
SpaceX, the Fund’s second-largest holding, is also advancing. On July 8, Bloomberg reported SpaceX is discussing an insider share sale at a $400 billion valuation, up from $350 billion in December 2024. This reflects strong investor confidence in SpaceX’s aerospace leadership, driven by Starlink’s 1.5 million users and a $2.9 billion NASA lunar contract. SpaceX’s $2 billion investment in xAI further aligns Elon Musk’s ventures, with xAI’s Grok chatbot supporting Starlink and eyed for Tesla’s Optimus robots. These developments signal SpaceX’s robust trajectory, bolstering the Fund’s portfolio performance. Click onto picture below to access video on SpaceX. REF: Bloomberg, REUTERS
NOTE: Not investment advice or recommendations. Investor should consider the investment objective, risks, charges and expenses carefully before investing. For additional information about securities mentioned above or in the video, please visit the companies’ websites (listed below) of referenced securities mentioned above. Read carefully before investing.
SpaceX: https://www.spacex.com/
Xai: https://x.ai/
With the current macro-economic backdrop, below are areas we currently favor:
- Fixed Income – Short-term Corporates (Low-Beta)
- Fixed Income – (Corporates & Muni) High Yield as Opportunistic Allocation (Low-Beta)
- Businesses that contribute to and benefit from AI & Automation (Market-Risk)
- Fintech & Financials (Market-Risk)
- Digital Asset – Bitcoin (Market-Risk/Hedge)
- Cyber-Security & Software (Market-Risk)
- Cloud Computing (Market-Risk)
- Biotechnology (Market-Risk)
4. World Watch
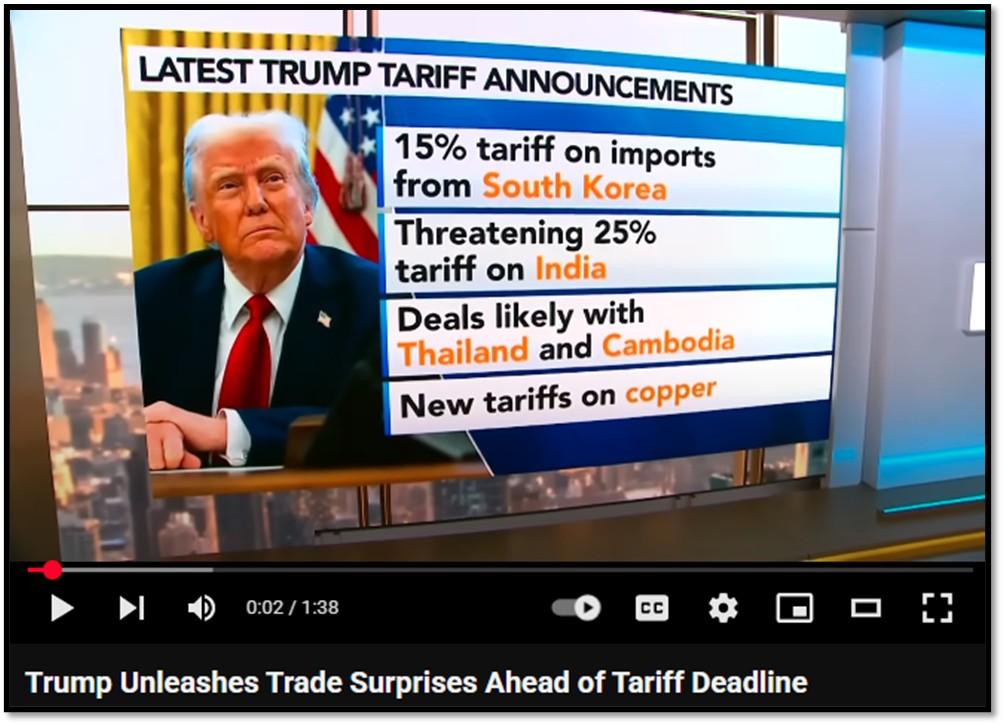
4A. President Donald Trump signed an executive order revising tariff rates before an August 1 deadline, imposing a 40% duty on all transshipped goods to combat tariff evasion, as reported by CNBC.
This order targets goods rerouted through countries like Vietnam to avoid U.S. tariffs, disrupting global supply chains. The order also set “reciprocal” tariffs from 10% to 41%, with 41% for Syria, 40% for Laos, 35% for Canada, and 10% for the UK, while Japan and the EU secured 15%–20% rates. Aimed at reducing U.S. trade deficits, the policy risks higher consumer costs, with the Tax Foundation projecting a $1,300 tax hike per U.S. household in 2025.
The tariff changes triggered market volatility, with South Korea’s Kospi dropping 3% and Japan’s Nikkei 225 falling 0.66%, reflecting trade disruption fears. The 40% transshipment duty threatens inflation as businesses pass costs to consumers. While Trump uses tariffs to negotiate better deals, analysts warn of supply chain issues and retaliatory tariffs, like Canada’s 25% levy, raising trade war risks and a 40% recession probability, potentially slowing global growth. Click onto picture below to access video. REF: CNBC, Bloomberg
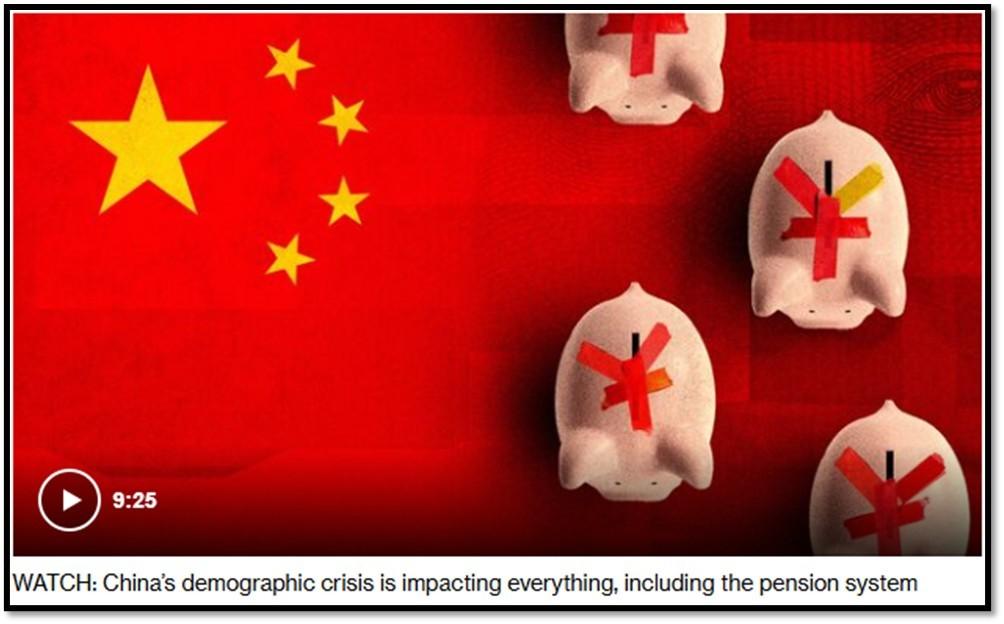
4B. China’s nationwide childcare subsidy program, effective retroactively from January 1, 2025, is a strategic response to the country’s declining birth rate and demographic challenges.
Announced on July 28, 2025, the policy offers 3,600 yuan ($502) annually per child under three, regardless of birth order, as reported by Bloomberg and Xinhua. With births dropping to 9.54 million in 2024 from 18.80 million in 2016, and a fertility rate of 1.2 births per woman, China faces a shrinking population, worsened by the one-child policy’s legacy, high childcare costs, and shifting attitudes toward smaller families. Local initiatives, like Hohhot’s 100,000 yuan ($13,800) for third children and extended maternity leave, aim to ease financial burdens and boost sectors like childcare. Tianmen, Hubei, saw a 17% birth increase in 2024 after similar measures, but the United Nations projects a population drop to under 800 million by 2100 without broader reforms. Click onto picture below to access video. REF: Bloomberg, UN-Reports
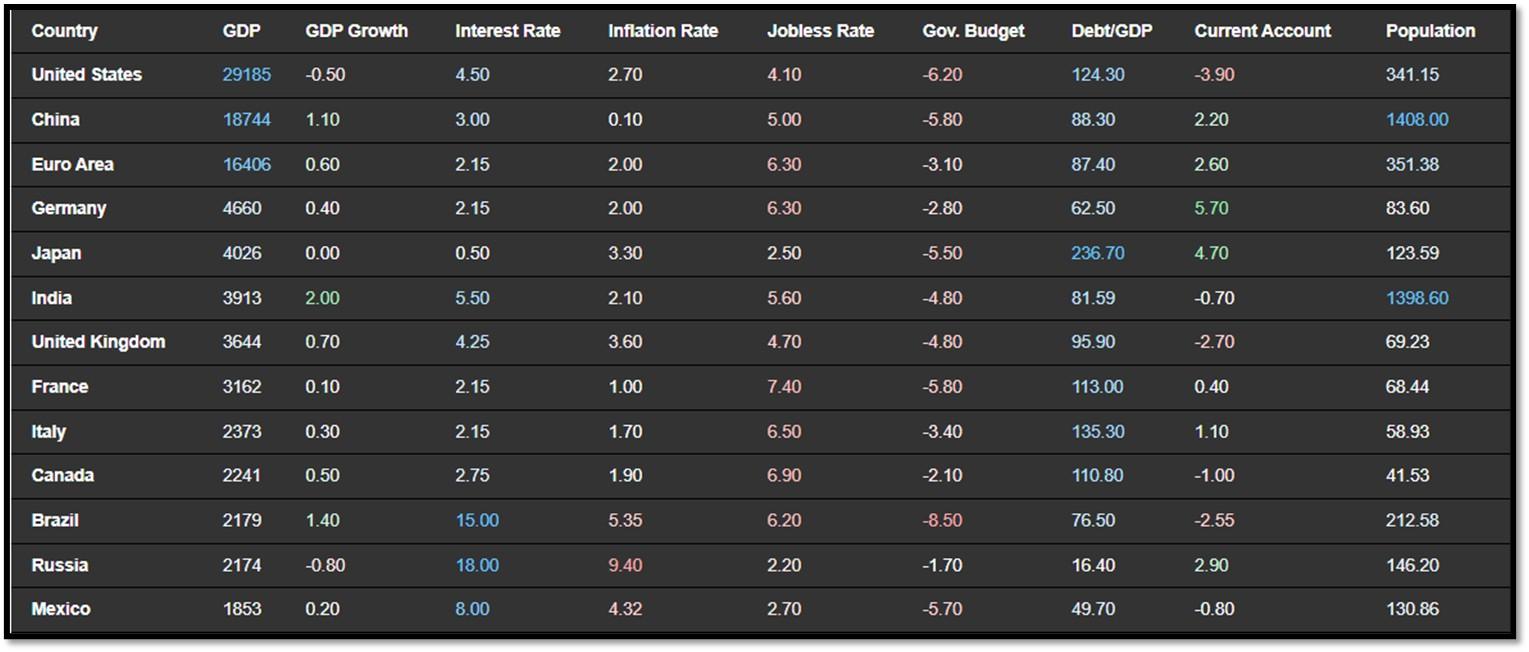
4C. An updated snapshot of the current global state of economy.
According to TradingEconomics as of 7/28/2025 (REF: TradingEconomics):
- The bank of Russia cut its benchmark interest rate by 200 basis points to 18% on its July 2025 meeting, in line with median market expectations, and signaled that it will likely deliver another rate cut this year.
- The Spanish economy grew by 0.7% quarter-on-quarter in the three months to June 2025, slightly above the 0.6% expansion in the previous quarter.
- The Swedish economy expanded by 0.1% quarter-on-quarter in the second quarter of 2025, after a 0.2% contraction in the first quarter, according to a flash estimate. Mattias Kain Wyatt, an economist at Statistics Sweden, said that after a decline in May.
- The US dollar index held firm above 98.6 on Tuesday, after rising 1% in the previous session, supported largely by euro weakness following a new US-EU trade agreement seen as favoring the US economy.
5. Quant & Technical Corner – A selection of quantitative & technical data we monitor on a regular basis to help gauge the overall financial market conditions and the investment environment.
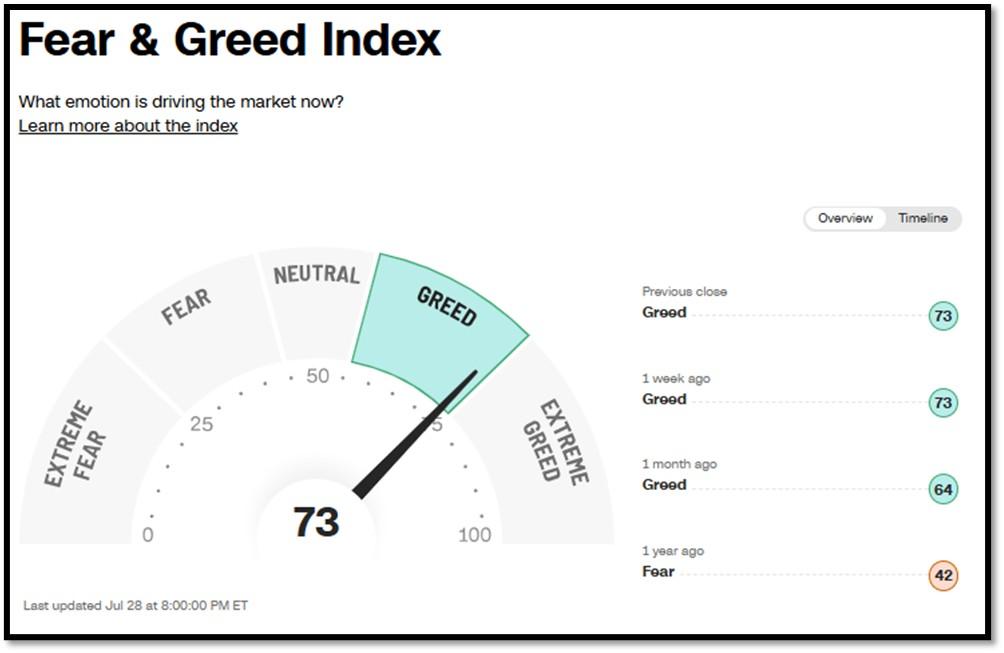
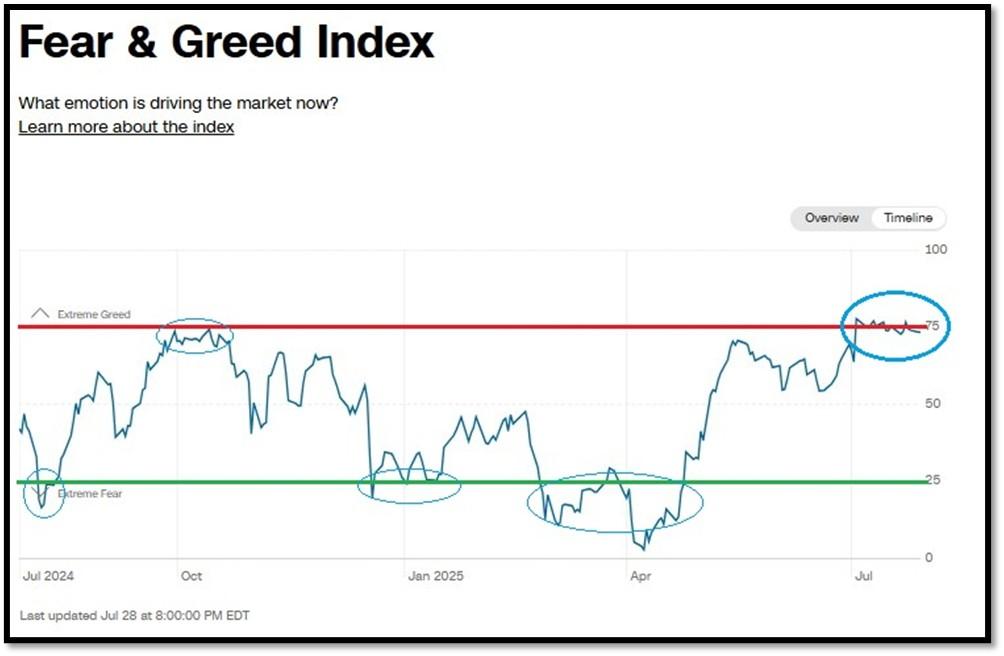
5A. Most recent read on the Fear & Greed Index with data as of 7/28/2025 – 8:00PM-ET is 73 (Greed). Last week’s data was 73 (Greed) (1-100). CNNMoney’s Fear & Greed index looks at 7 indicators (Stock Price Momentum, Stock Price Strength, Stock Price Breadth, Put and Call Options, Junk Bond Demand, Market Volatility, and Safe Haven Demand). Keep in mind this is a contrarian indicator! REF: Fear&Greed via CNNMoney
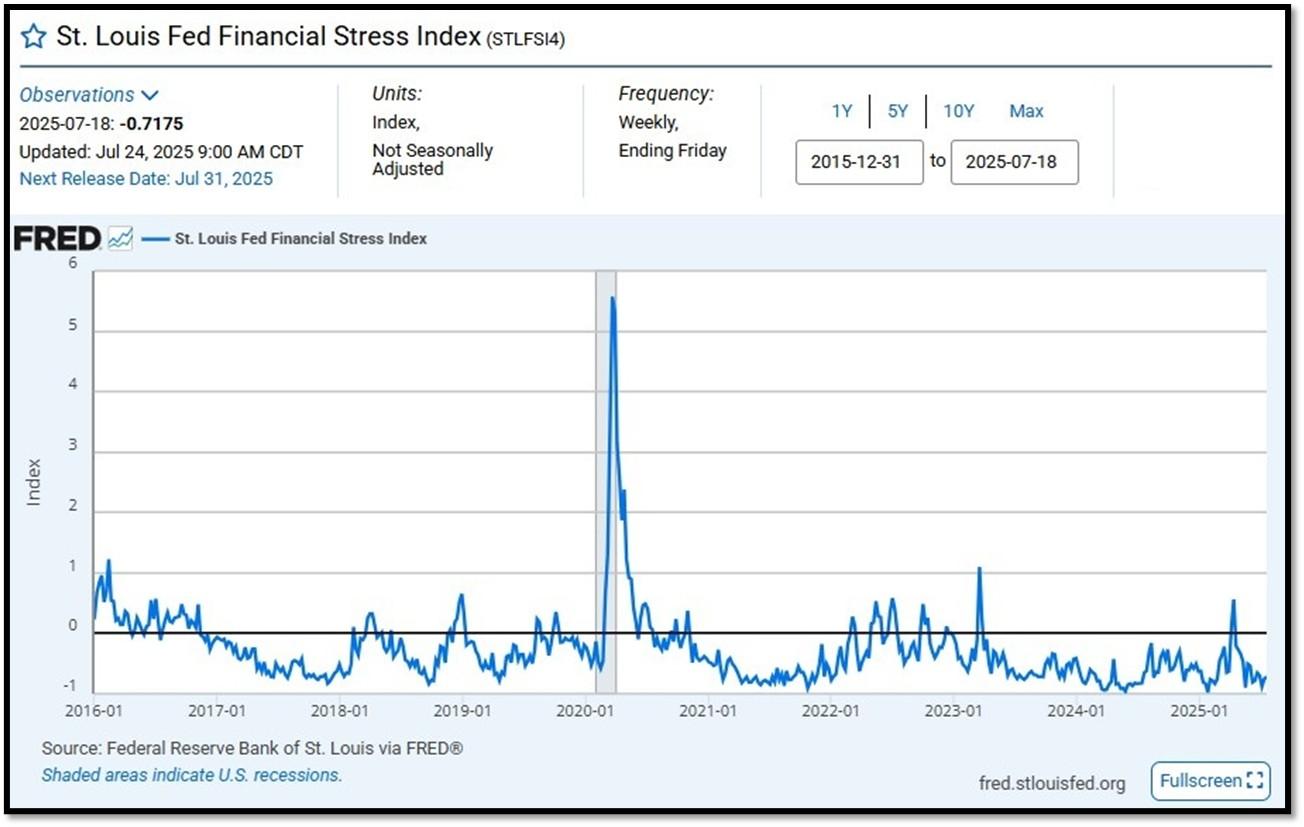
5B. St. Louis Fed Financial Stress Index’s (STLFSI4) most recent read is at –0.7175 as of July 24, 2025. Previous week’s data was -0.7526. A big spike up from previous readings reflecting the turmoil in the banking sector back in 2023. This weekly index is not seasonally adjusted. The STLFSI4 measures the degree of financial stress in the markets and is constructed from 18 weekly data series: seven interest rate series, six yield spreads and five other indicators. Each of these variables captures some aspect of financial stress. Accordingly, as the level of financial stress in the economy changes, the data series are likely to move together. REF: St. Louis Fed
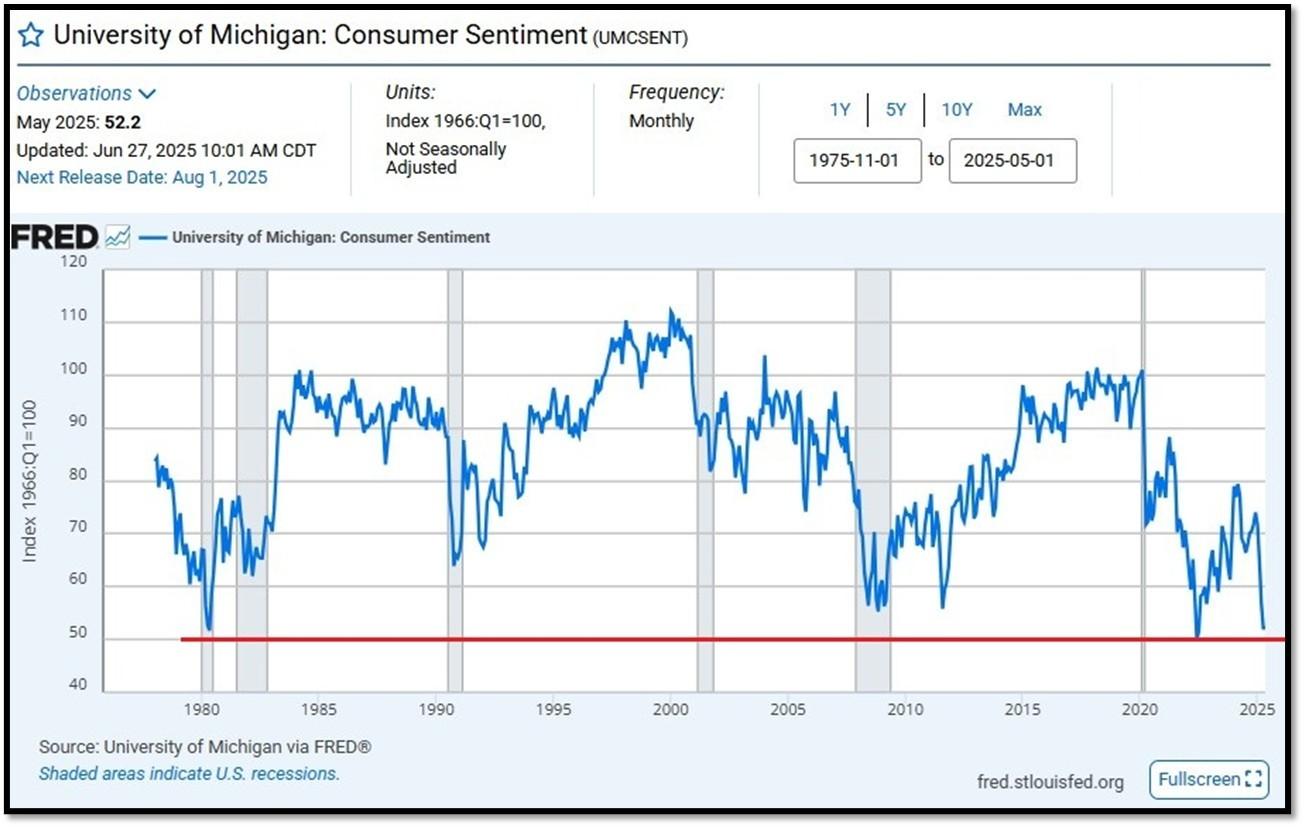
5C. University of Michigan, University of Michigan: Consumer Sentiment for February [UMCSENT] at 52.2, retrieved from FRED, Federal Reserve Bank of St. Louis, June 27, 2025. Back in June 2022, Consumer Sentiment hit a low point going back to April 1980. REF: UofM
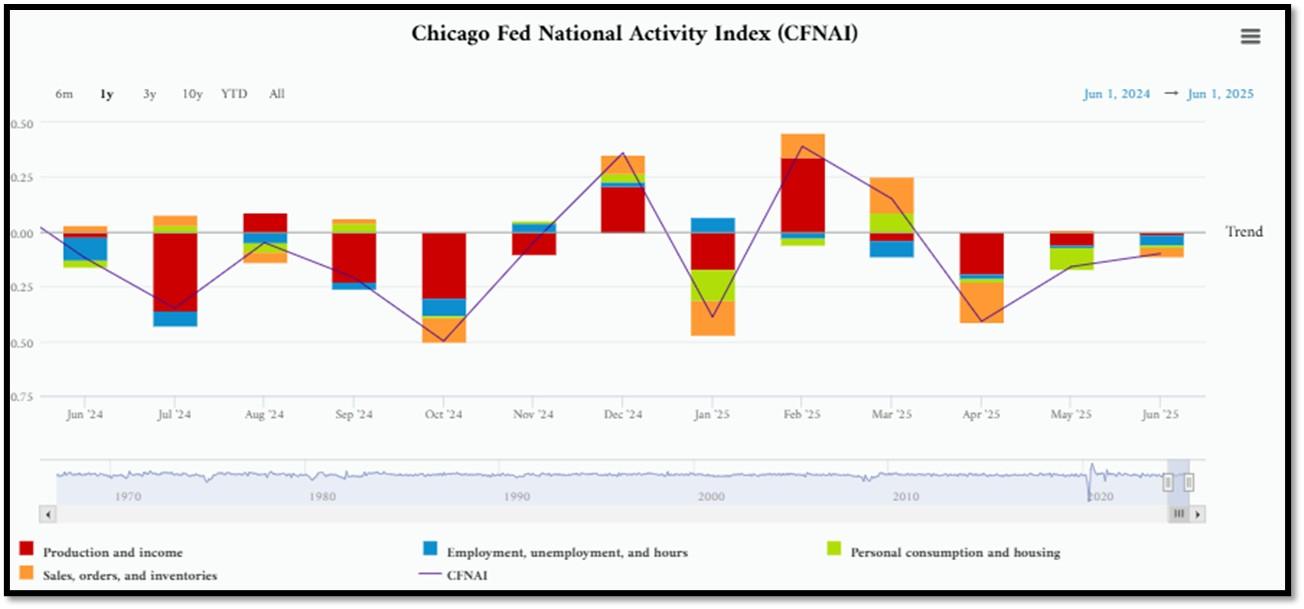
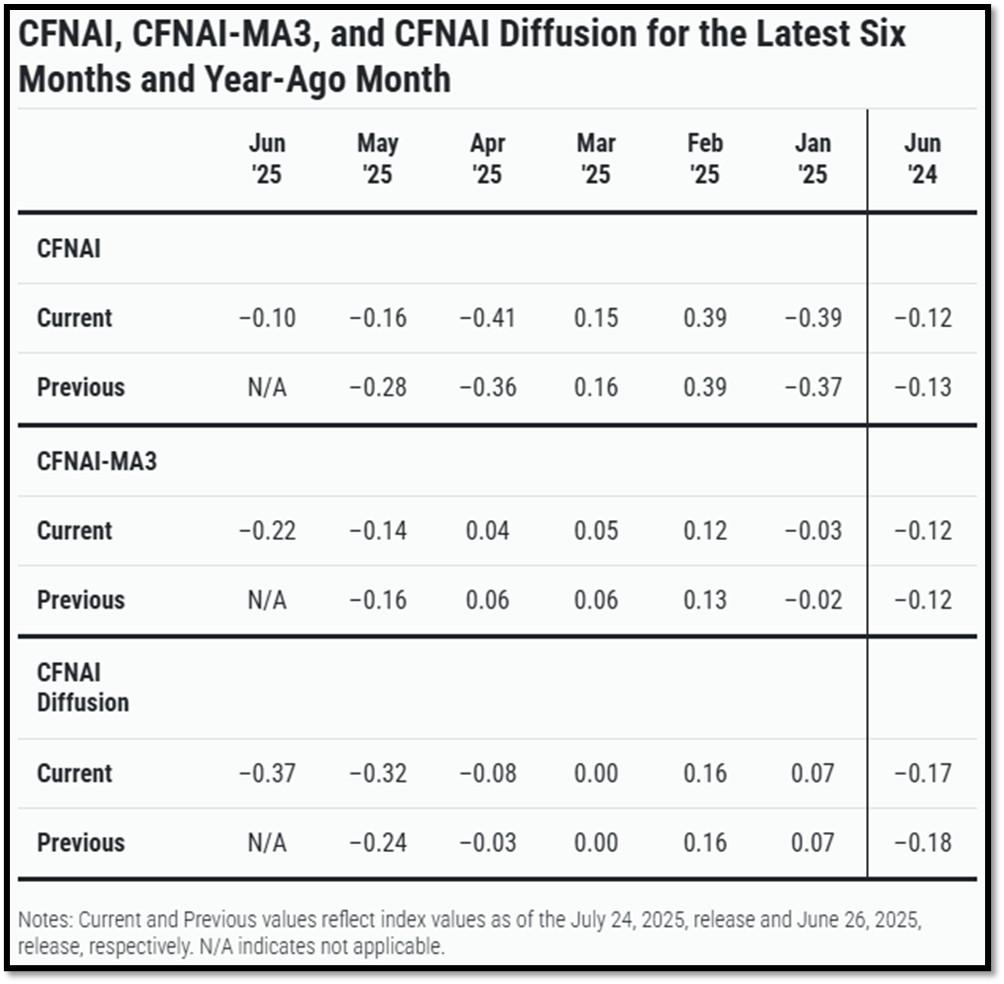
5D. The Chicago Fed National Activity Index (CFNAI) increased to –0.10 in June from –0.16 in May. Two of the four broad categories of indicators used to construct the index increased from May, but all four categories made negative contributions in June. The index’s three-month moving average, CFNAI-MA3, decreased to –0.22 in June from –0.14 in May. REF: ChicagoFed, June’s Report
5E. (7/21/2025) The Conference Board Leading Economic Index (LEI) for the US declined by 0.3% in June 2025 to 98.8 (2016=100), after no change in May (revised upward from –0.1% originally reported). As a result, the LEI fell by 2.8% over the first half of 2025, a substantially faster rate of decline than the –1.3% contraction over the second half of 2024. The composite economic indexes are the key elements in an analytic system designed to signal peaks and troughs in the business cycle. The indexes are constructed to summarize and reveal common turning points in the economy in a clearer and more convincing manner than any individual component. The CEI is highly correlated with real GDP. The LEI is a predictive variable that anticipates (or “leads”) turning points in the business cycle by around 7 months. Shaded areas denote recession periods or economic contractions. The dates above the shaded areas show the chronology of peaks and troughs in the business cycle. The ten components of The Conference Board Leading Economic Index® for the U.S. include: Average weekly hours in manufacturing; Average weekly initial claims for unemployment insurance; Manufacturers’ new orders for consumer goods and materials; ISM® Index of New Orders; Manufacturers’ new orders for nondefense capital goods excluding aircraft orders; Building permits for new private housing units; S&P 500® Index of Stock Prices; Leading Credit Index™; Interest rate spread (10-year Treasury bonds less federal funds rate); Average consumer expectations for business conditions. REF: ConferenceBoard, LEI Report for May (Released on 6/30/2025)
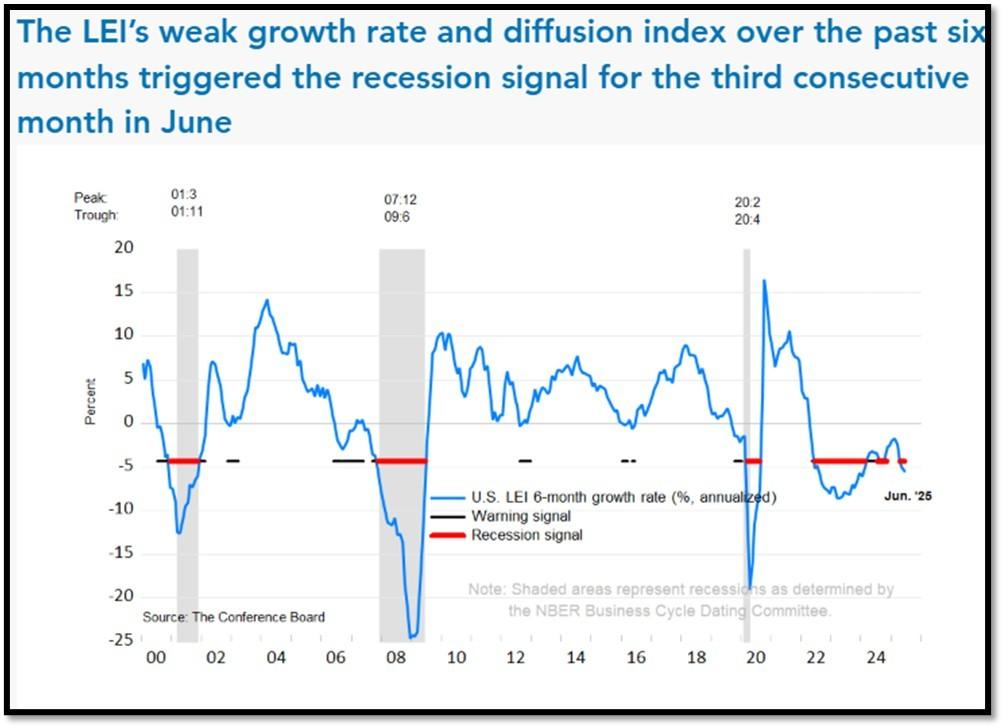
We have experienced a “rolling recession” since June 2022 and are only now emerging from it. However, authorities are not labeling it a recession due to high employment data.
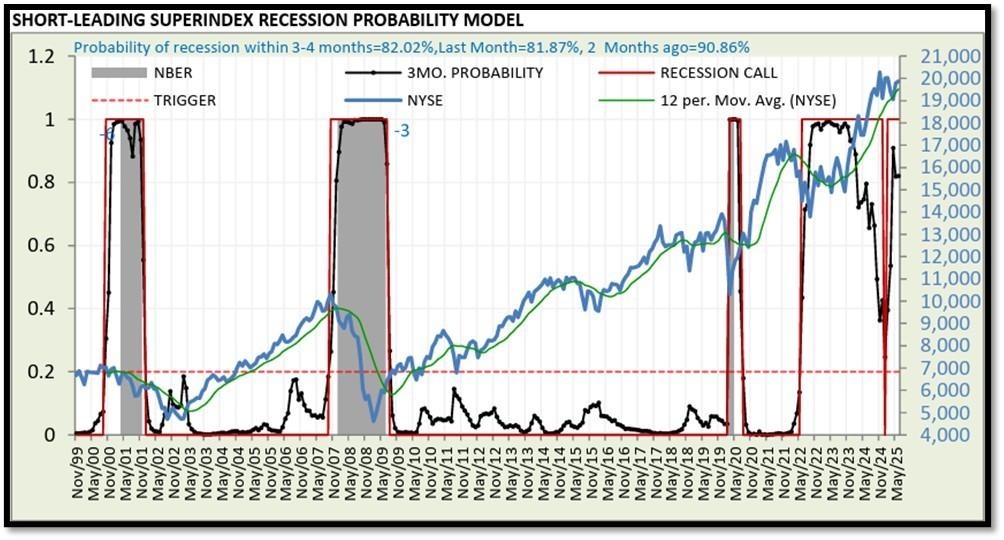
5F. Probability of U.S. falling into Recession within 3 to 4 months is currently at 82.02% (with data as of 07/14/2025 – Next Report 07/28/2025) according to RecessionAlert Research. Last release’s data was at 84.97%. This report is updated every two weeks. REF: RecessionAlertResearch
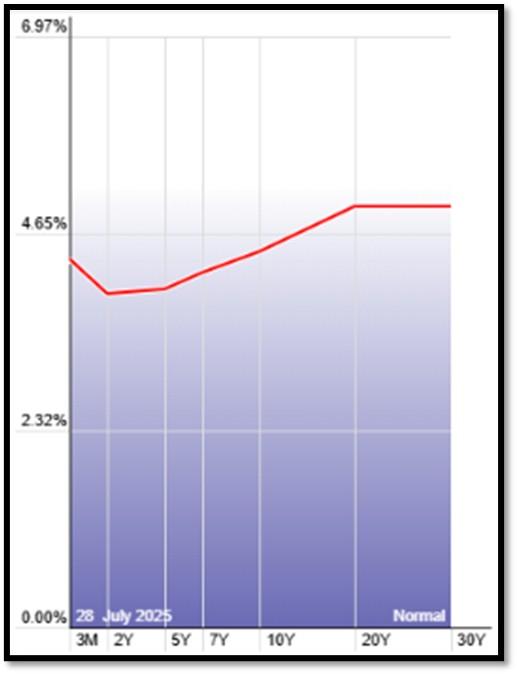
5G. Yield Curve as of 7/28/2025 is showing Normal. Spread on the 10-yr Treasury Yield (4.40%) minus yield on the 2-yr Treasury Yield (3.91%) is currently at 49bps. REF: Stockcharts The yield curve—specifically, the spread between the interest rates on the ten-year Treasury note and the three-month Treasury bill—is a valuable forecasting tool. It is simple to use and significantly outperforms other financial and macroeconomic indicators in predicting recessions two to six quarters ahead. REF: NYFED
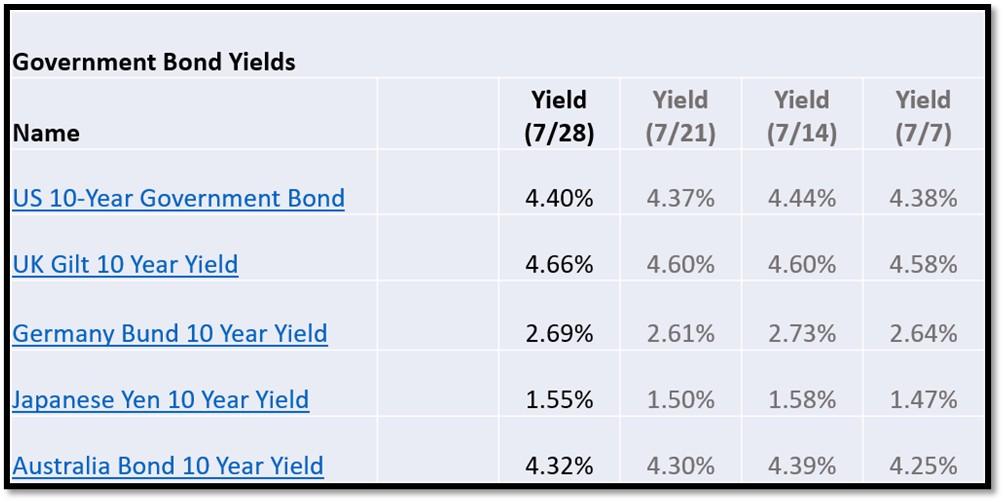
5H. Recent Yields in 10-Year Government Bonds. REF: Source is from Bloomberg.com, dated 7/28/2025, rates shown below are as of 7/28/2025, subject to change.
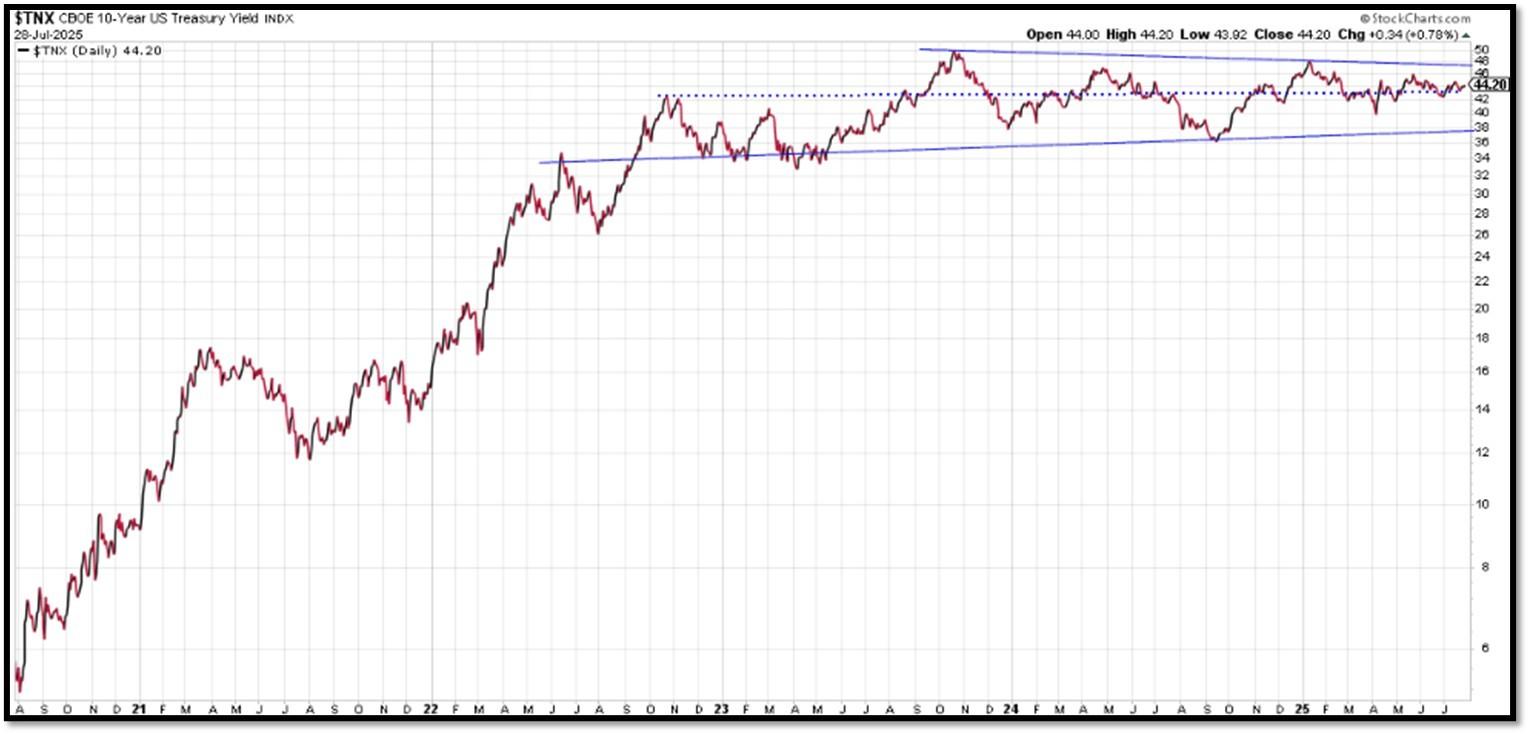
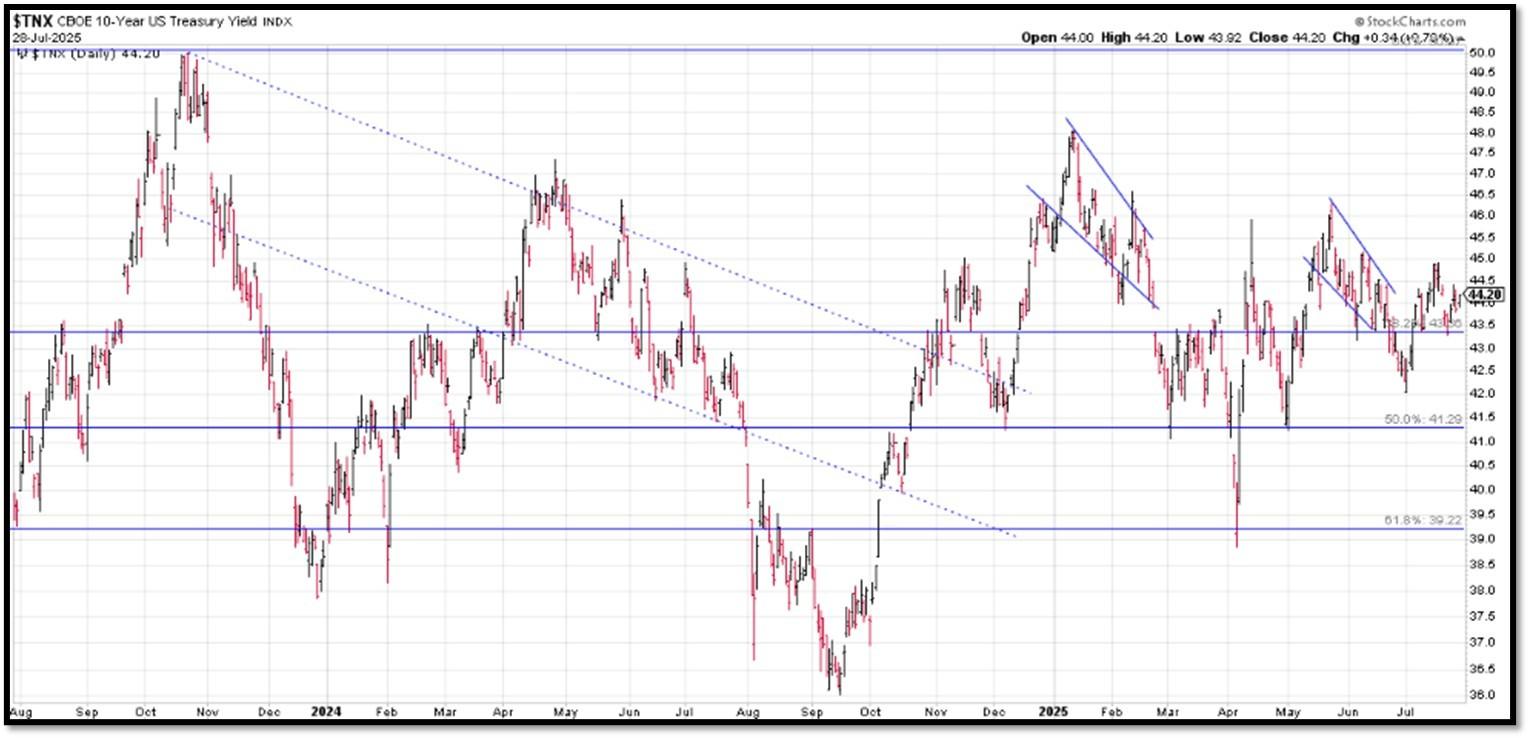
The 10-Year US Treasury Yield… The 10-Year Yield is indirectly related to inflation. I expect the 10-Year Yield to drop further as dis-inflation kicks in. REF: StockCharts1, StockCharts2
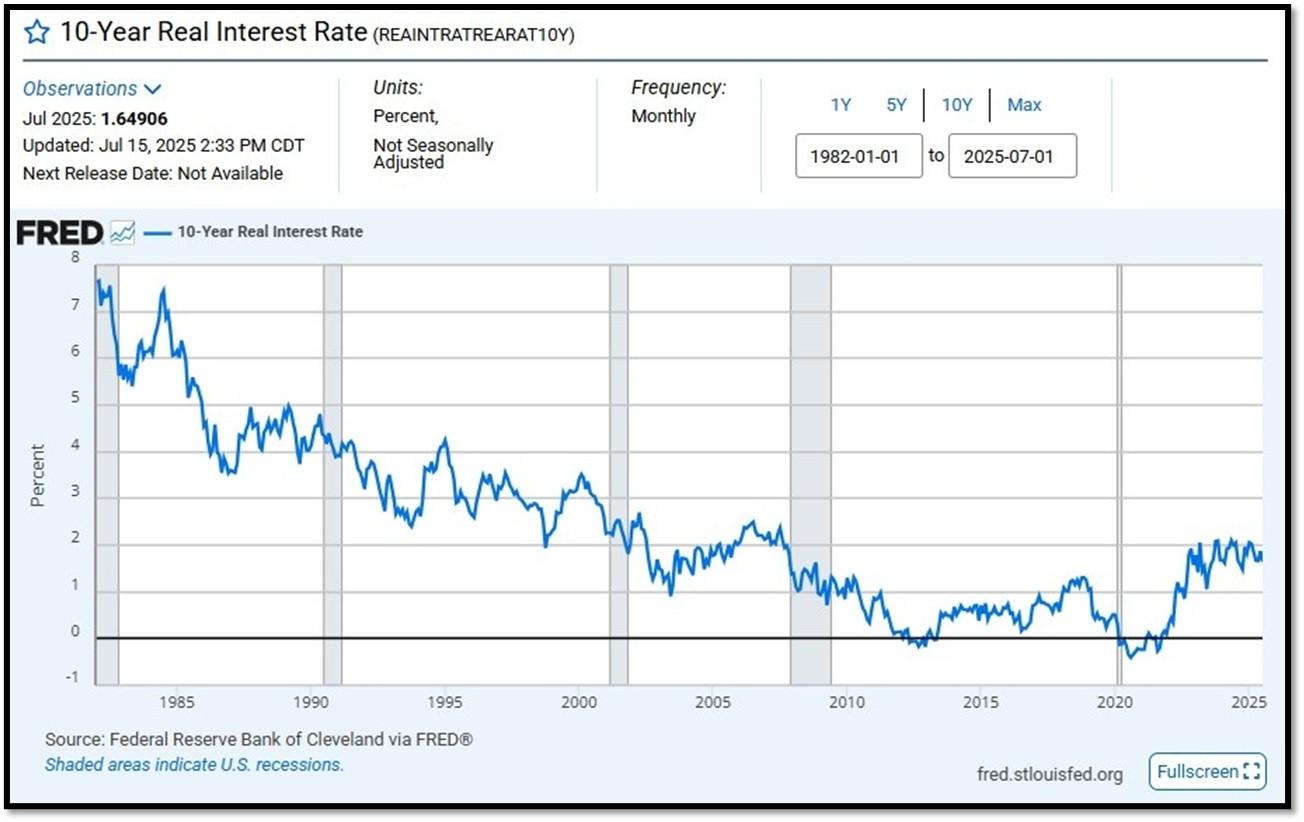
10-Year Real Interest Rate at 1.64906% as of 7/15/25. Last month’s data was 1.87166%. REF: REAINTRATREARAT10Y
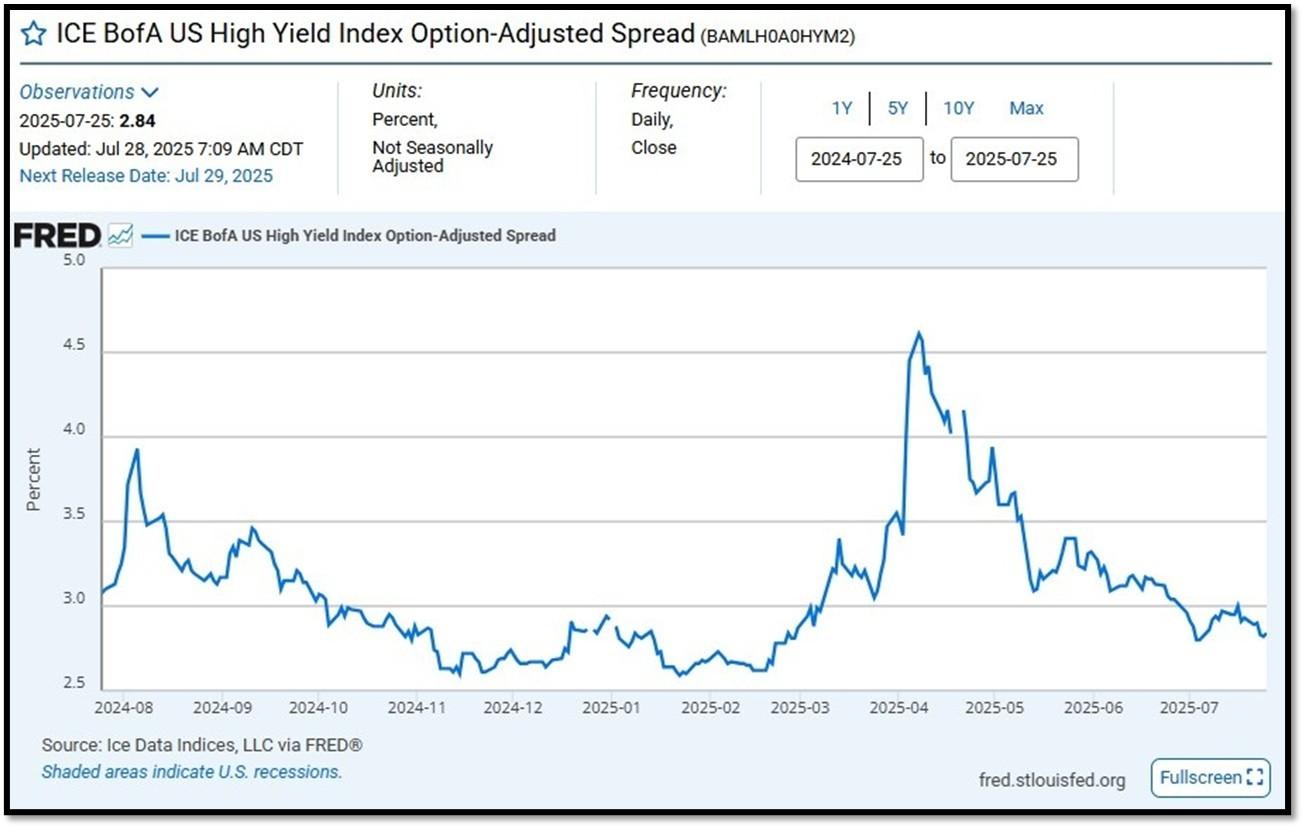
ICE BofA US High Yield Index Option-Adjusted Spread (BAMLH0A0HYM2) currently at 2.84 as of July 28, 2025. This is a key indicator of market sentiment, particularly regarding risk and economic health. At its core, the spread reflects the extra return investors demand to hold riskier corporate debt over safer government securities. High-yield bonds are issued by companies with lower credit ratings (below investment grade, like BB or lower), meaning they carry a higher chance of default. The spread compensates for this risk. When the spread is narrow—say, around 2.5% to 3%, as seen recently—it suggests investors are confident, willing to accept less extra yield because they perceive lower default risk or a strong economy. Narrow spreads often align with bullish markets, where cash is flowing, growth is steady, and fear is low. REF: FRED-BAMLH0A0HYM2
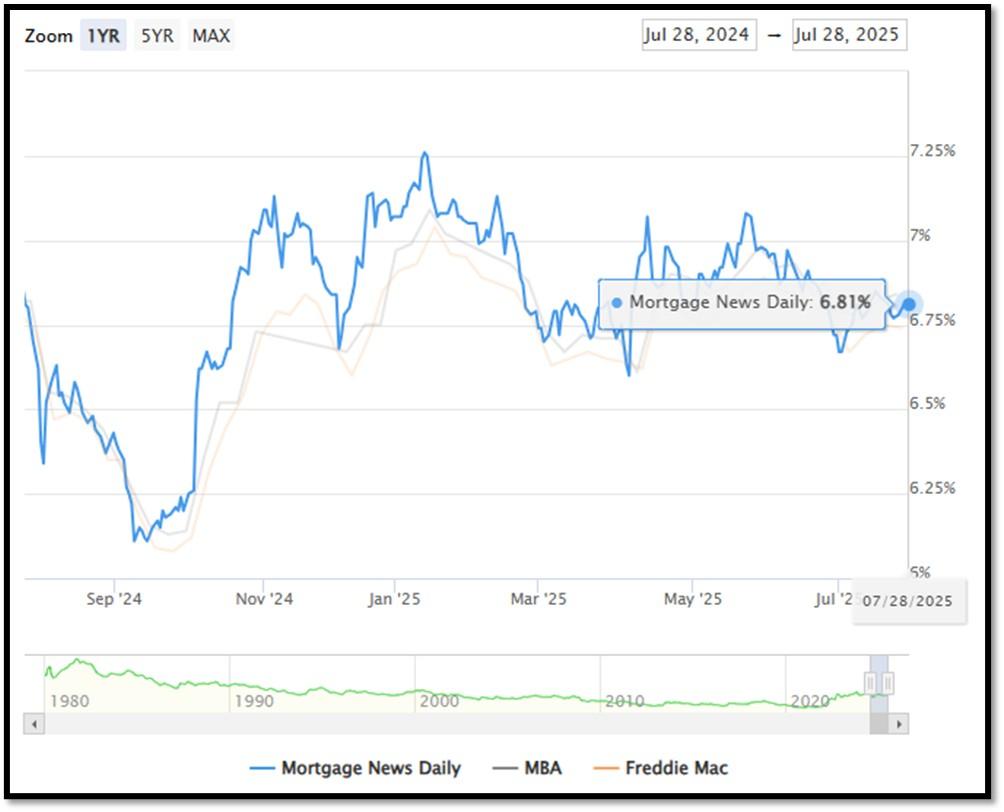
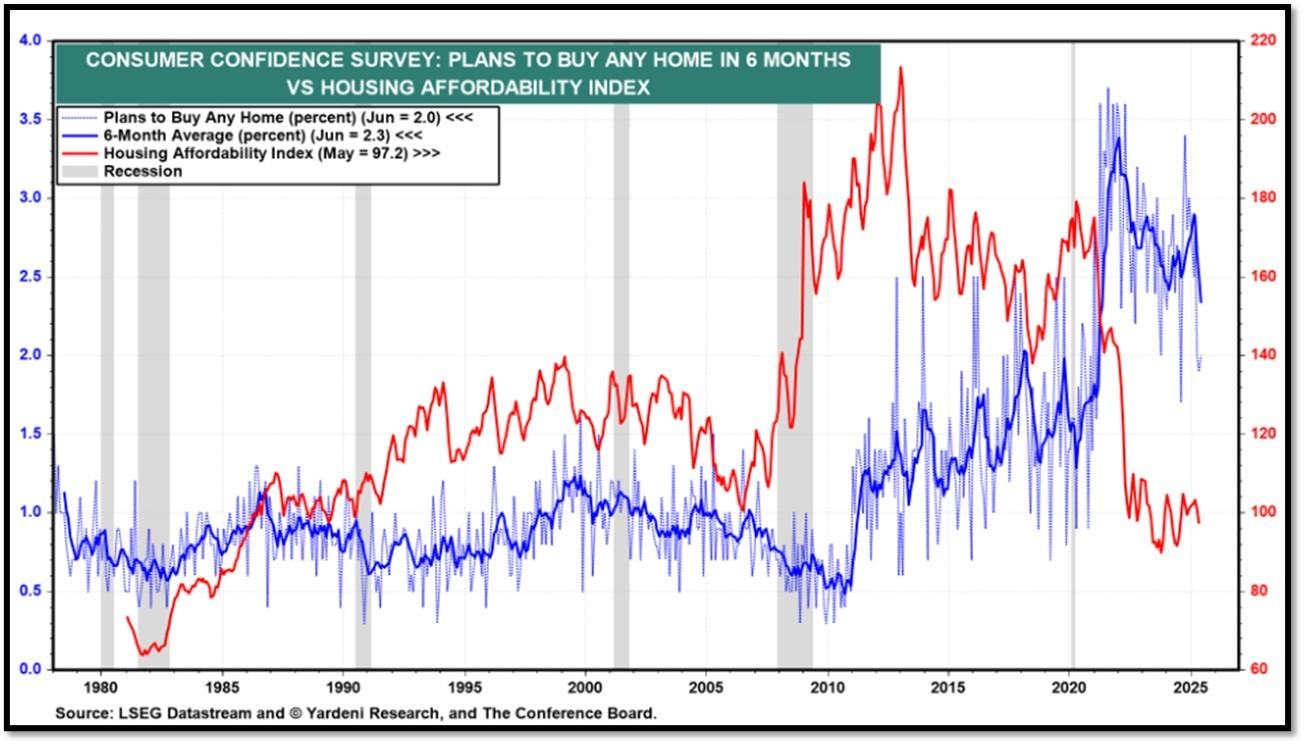
5I. (7/28/2025) Today’s National Average 30-Year Fixed Mortgage Rate is 6.81% (All Time High was 8.03% on 10/19/23). Last week’s data was 6.78%. This rate is the average 30-year fixed mortgage rates from several different surveys including Mortgage News Daily (daily index), Freddie Mac (weekly survey), Mortgage Bankers Association (weekly survey) and FHFA (monthly survey). REF: MortgageNewsDaily, Today’s Average Rate
The recent spike in the 30-year fixed-rate jumbo mortgage to 6.81%, compared to Freddie Mac’s rate at 6.74% and the Mortgage Bankers Association (MBA) rate at 6.84%, highlights key differences in the mortgage market. Jumbo mortgages, which exceed the conforming loan limits set by government agencies like Freddie Mac, typically carry higher interest rates because they are riskier for lenders. These loans are not backed by government entities, which increases the risk for lenders and, consequently, leads to higher rates. In contrast, Freddie Mac and MBA provide averages for conforming loans, which meet federal guidelines and have lower risk due to government backing, keeping their rates lower.
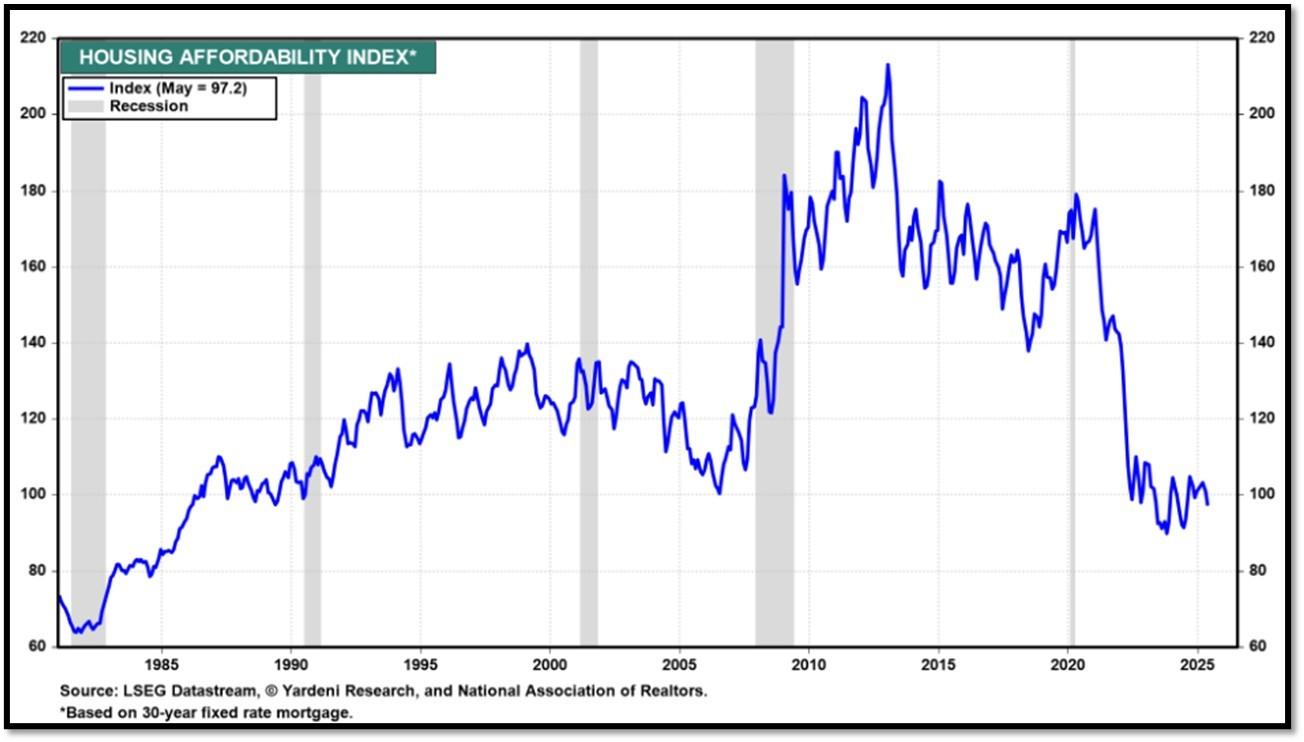
Housing Affordability Index for May = 97.2 // Apr = 101.0 // Mar = 103.2 // Feb = 102.2 // Jan = 100.7 // Dec = 100.7 // Nov = 99 // Oct = 102.3. Data provided by Yardeni Research. REF: Yardeni
5J. Velocity of M2 Money Stock (M2V) with current read at 1.386 as of (Q1-2025 updated 6/26/2025). Previous quarter’s data was 1.383. The velocity of money is the frequency at which one unit of currency is used to purchase domestically- produced goods and services within a given time period. In other words, it is the number of times one dollar is spent to buy goods and services per unit of time. If the velocity of money is increasing, then more transactions are occurring between individuals in an economy. Current Money Stock (M2) report can be viewed in the reference link. REF: St.LouisFed-M2V
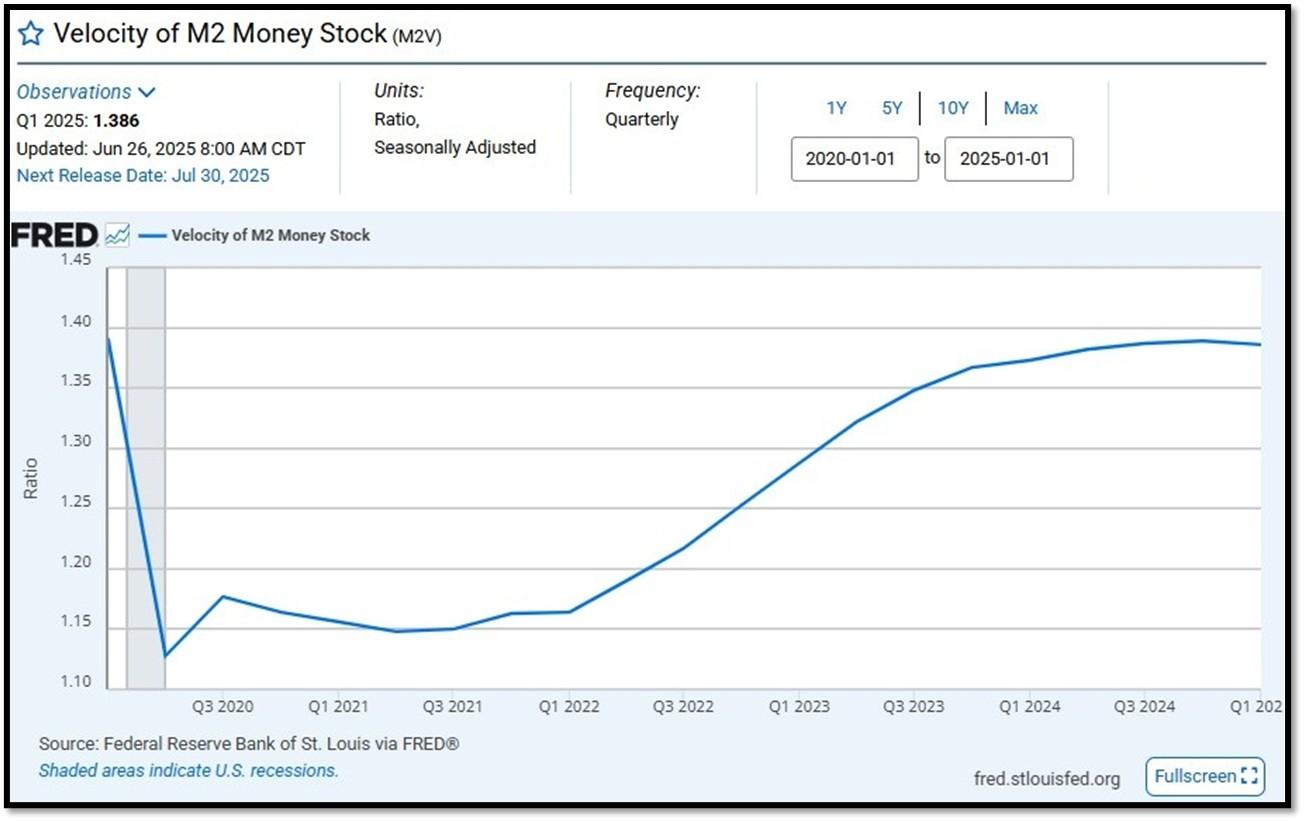
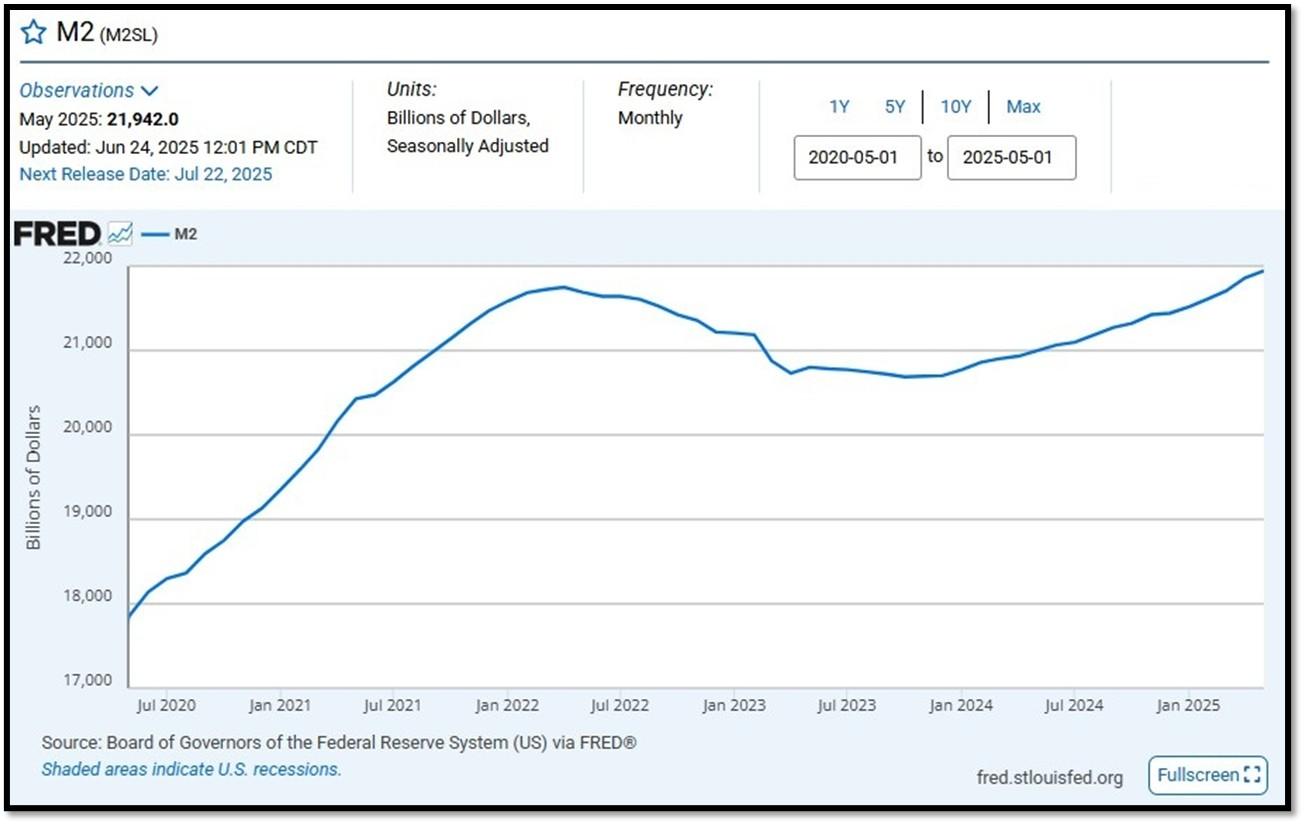
M2 consists of M1 plus (1) small-denomination time deposits (time deposits in amounts of less than $100,000) less IRA and Keogh balances at depository institutions; and (2) balances in retail MMFs less IRA and Keogh balances at MMFs. Seasonally adjusted M2 is constructed by summing savings deposits (before May 2020), small-denomination time deposits, and retail MMFs, each seasonally adjusted separately, and adding this result to seasonally adjusted M1. Board of Governors of the Federal Reserve System (US), M2 [M2SL], retrieved from FRED, Federal Reserve Bank of St. Louis; Updated on June 24, 2025. REF: St.LouisFed-M2
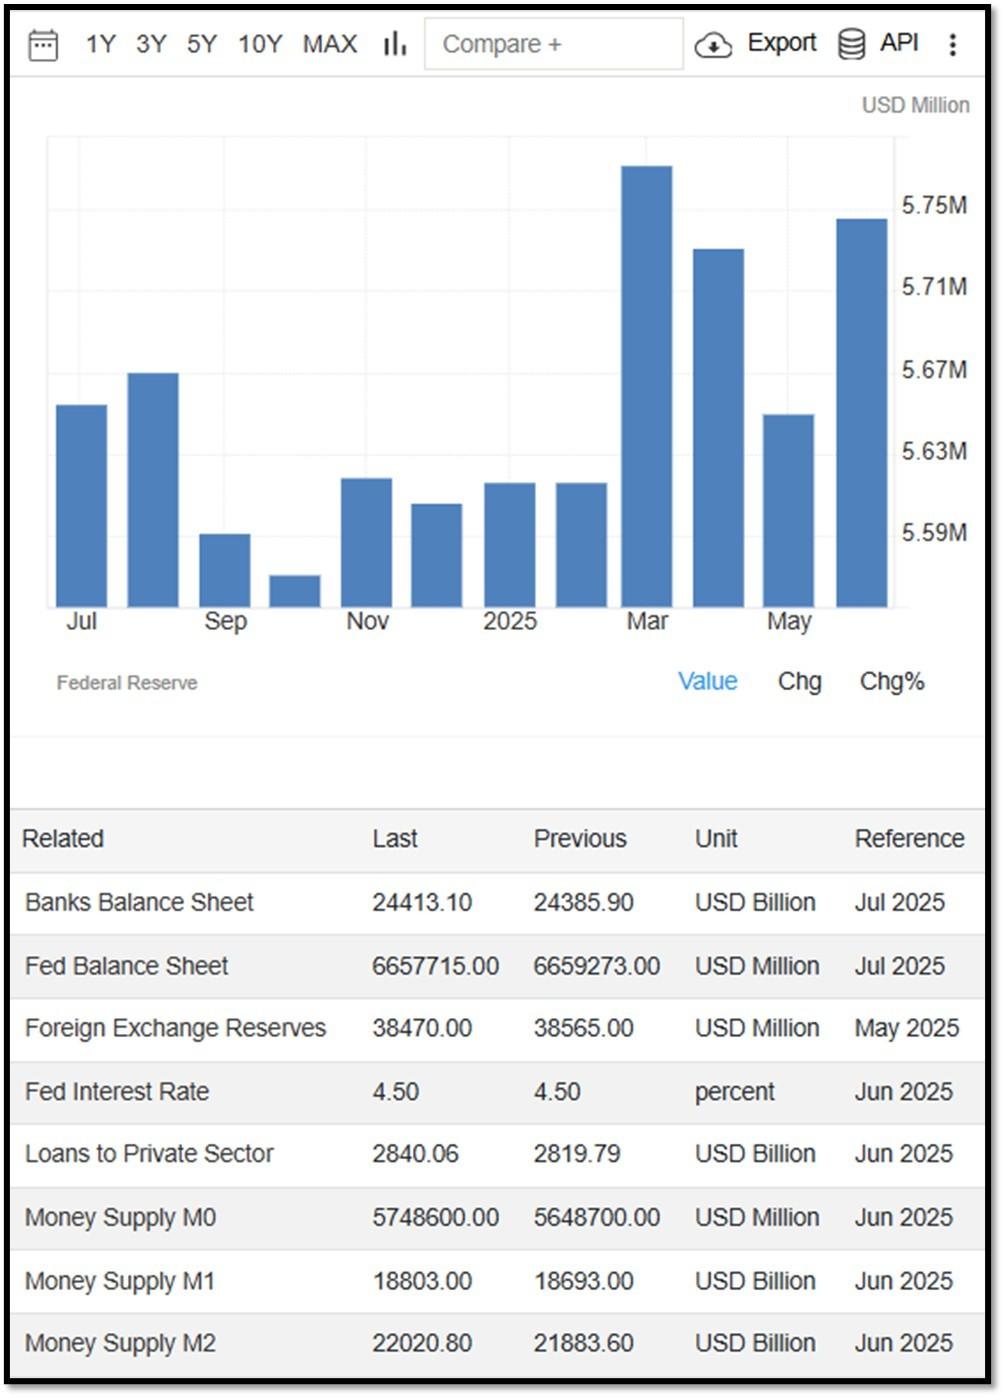
Money Supply M0 in the United States increased to 5,748,600 USD Million in June from 5,648,700 USD Million in May of 2025. Money Supply M0 in the United States averaged 1,200,279.70 USD Million from 1959 until 2025, reaching an all-time high of 6,413,100.00 USD Million in December of 2021 and a record low of 48,400.00 USD Million in February of 1961. REF: TradingEconomics, M0
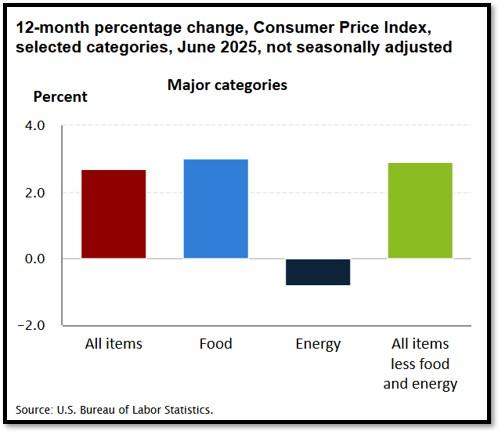
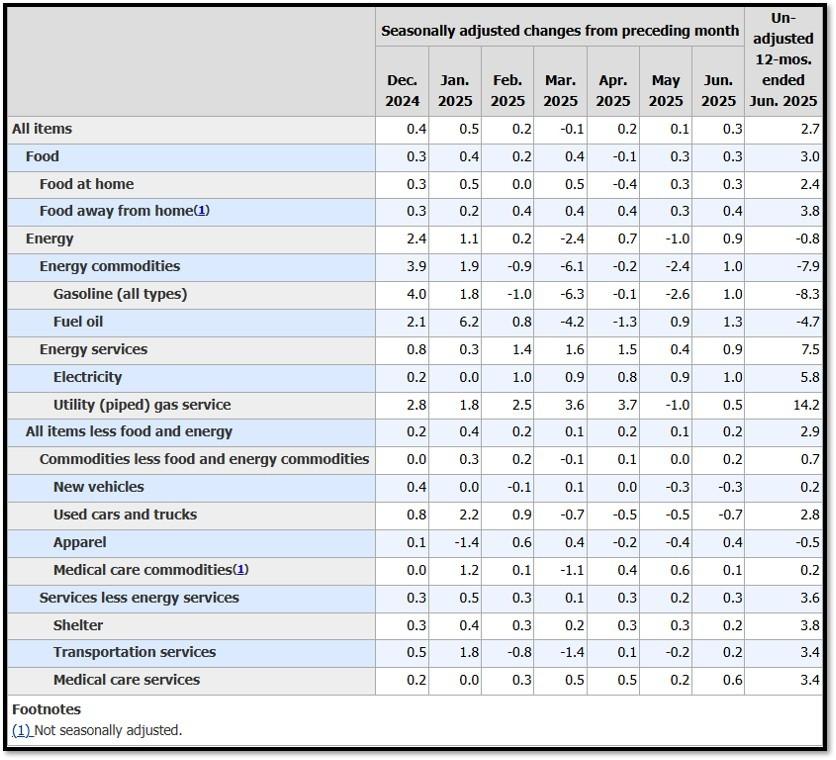
5K. In June, the Consumer Price Index for All Urban Consumers rose 0.3 percent, seasonally adjusted, and rose 2.7 percent over the last 12 months, not seasonally adjusted. The index for all items less food and energy increased 0.2 percent in June (SA); up 2.9 percent over the year (NSA). July 2025 CPI data are scheduled to be released on August 12, 2025, at 8:30AM-ET. REF: BLS, BLS.GOV
5L. Technical Analysis of the S&P500 Index. Click onto reference links below for images.
- Short-term Chart: Trend Bullish on 7/28/2025 – REF: Short-term S&P500 Chart by Marc Slavin (Click Here to Access Chart)
- Medium-term Chart: Trend Bearish to Bullish on 7/28/2025 – REF: Medium-term S&P500 Chart by Marc Slavin (Click Here to Access Chart)
- Market Timing Indicators – S&P500 Index as of 7/28/2025 – REF: S&P500 Charts (7 of them) by Joanne Klein’s Top 7 (Click Here to Access Updated Charts)
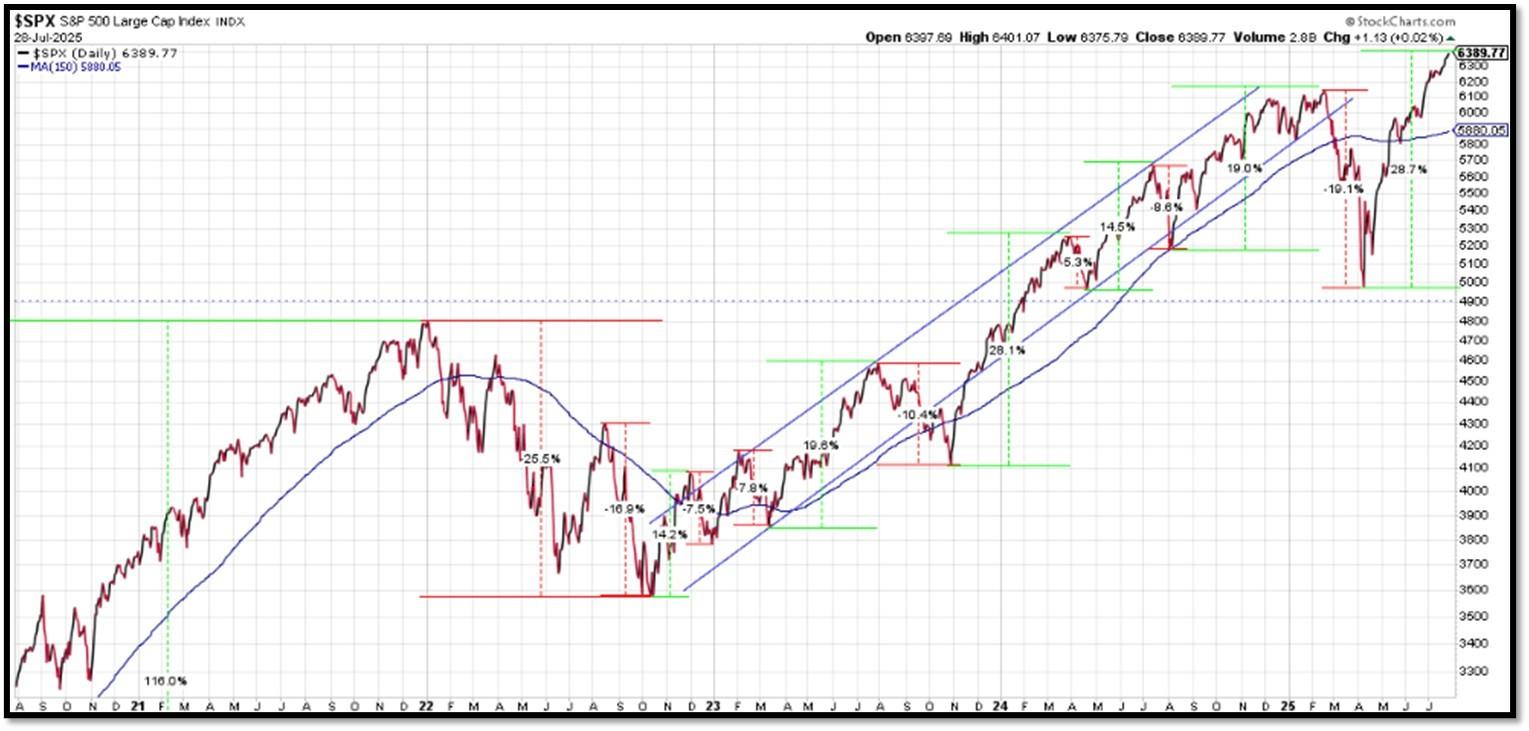
- The S&P500 is hitting all-time-high, rebounding from a V-shaped recovery. This is one of the ‘most-hated’ rallies. REF: Stockcharts
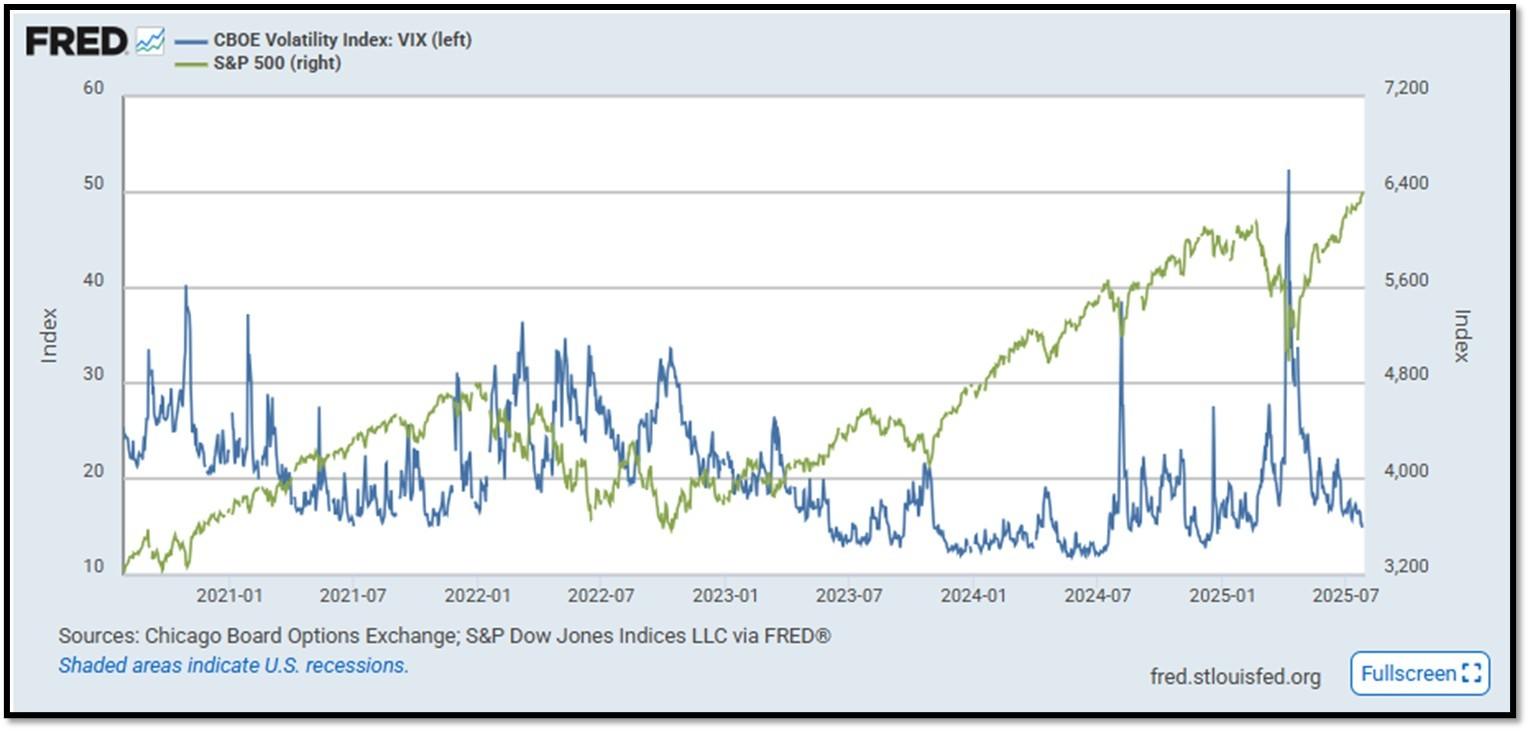
- S&P500 and CBOE Volatility Index (VIX) as of 7/28/2025. REF: FRED, Today’s Print
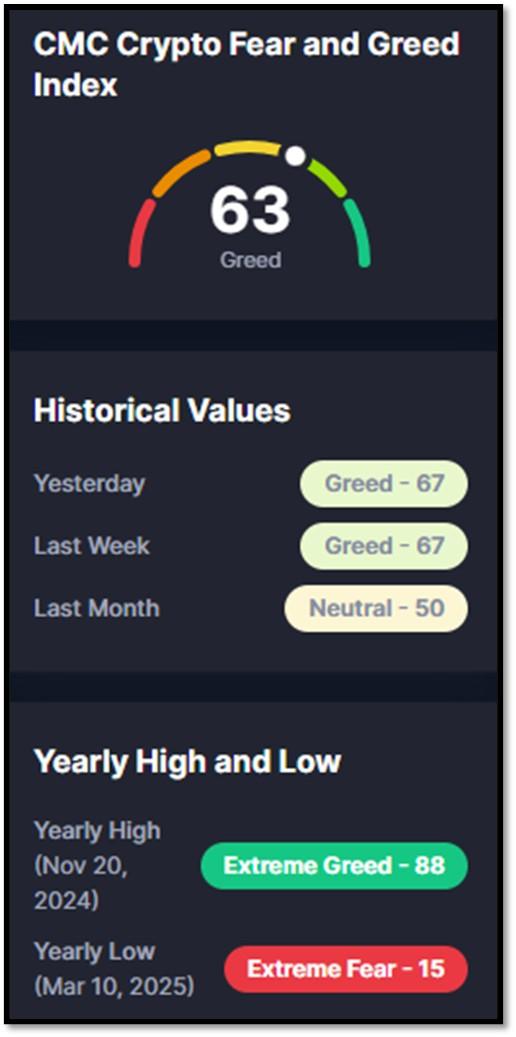
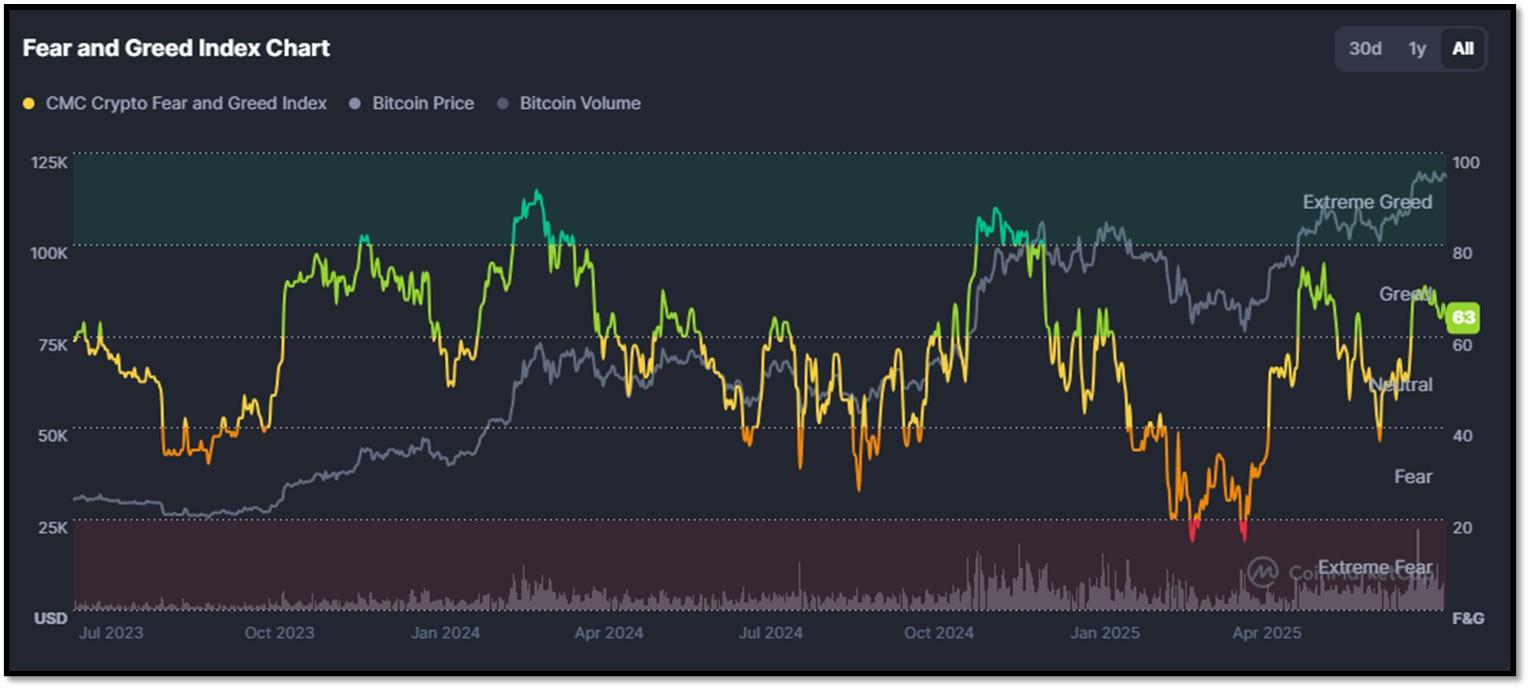
5M. Most recent read on the Crypto Fear & Greed Index with data as of 7/28/2025 is 67 (Greed). Last week’s data was 70 (Greed) (1-100). Fear & Greed Index – A Contrarian Data. The crypto market behavior is very emotional. People tend to get greedy when the market is rising which results in FOMO (Fear of missing out). Also, people often sell their coins in irrational reaction of seeing red numbers. With the Crypto Fear and Greed Index, the data try to help save investors from their own emotional overreactions. There are two simple assumptions:
- Extreme fear can be a sign that investors are too worried. That could be a buying opportunity.
- When Investors are getting too greedy, that means the market is due for a correction.
Therefore, the program for this index analyzes the current sentiment of the Bitcoin market and crunch the numbers into a simple meter from 0 to 100. Zero means “Extreme Fear”, while 100 means “Extreme Greed”. REF: Coinmarketcap.com, Today’sReading
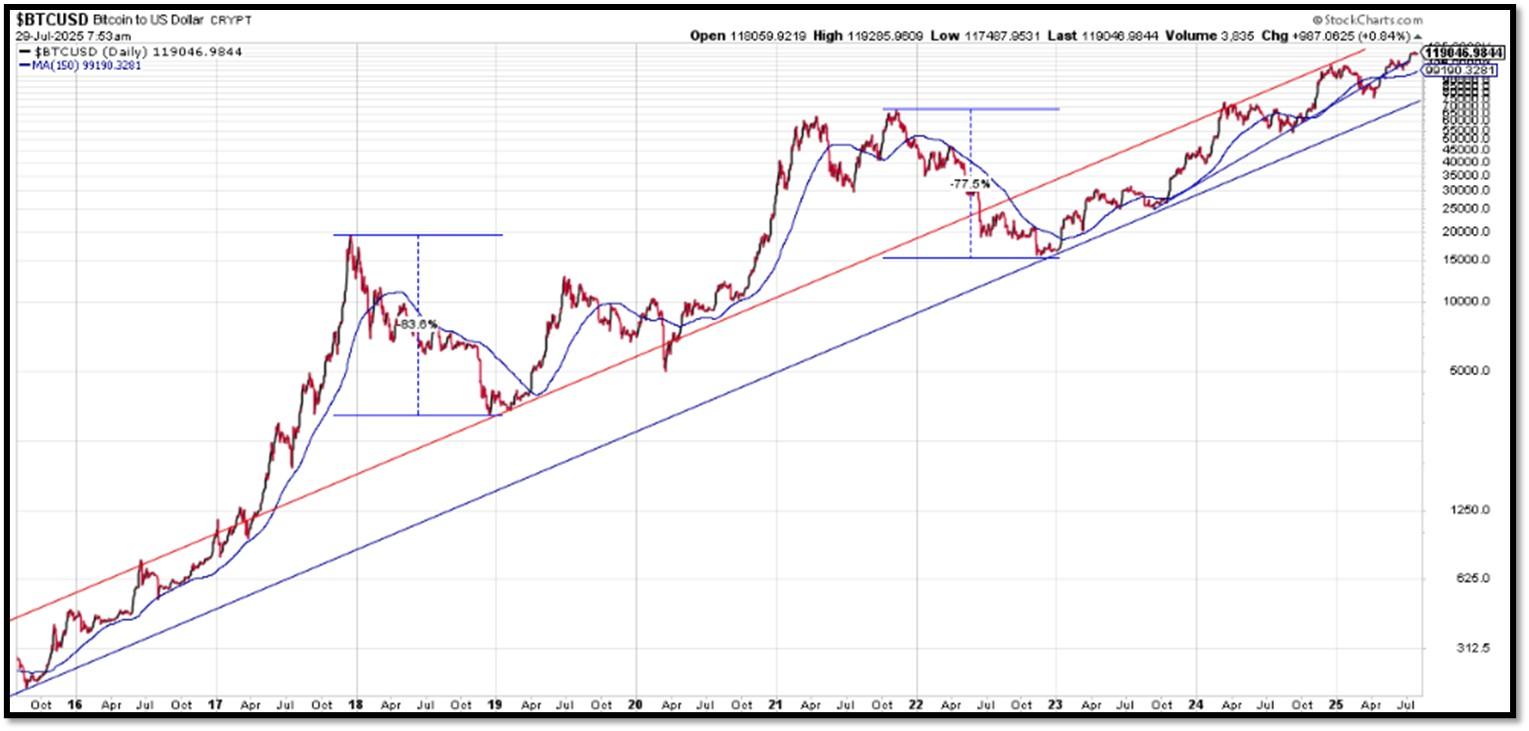
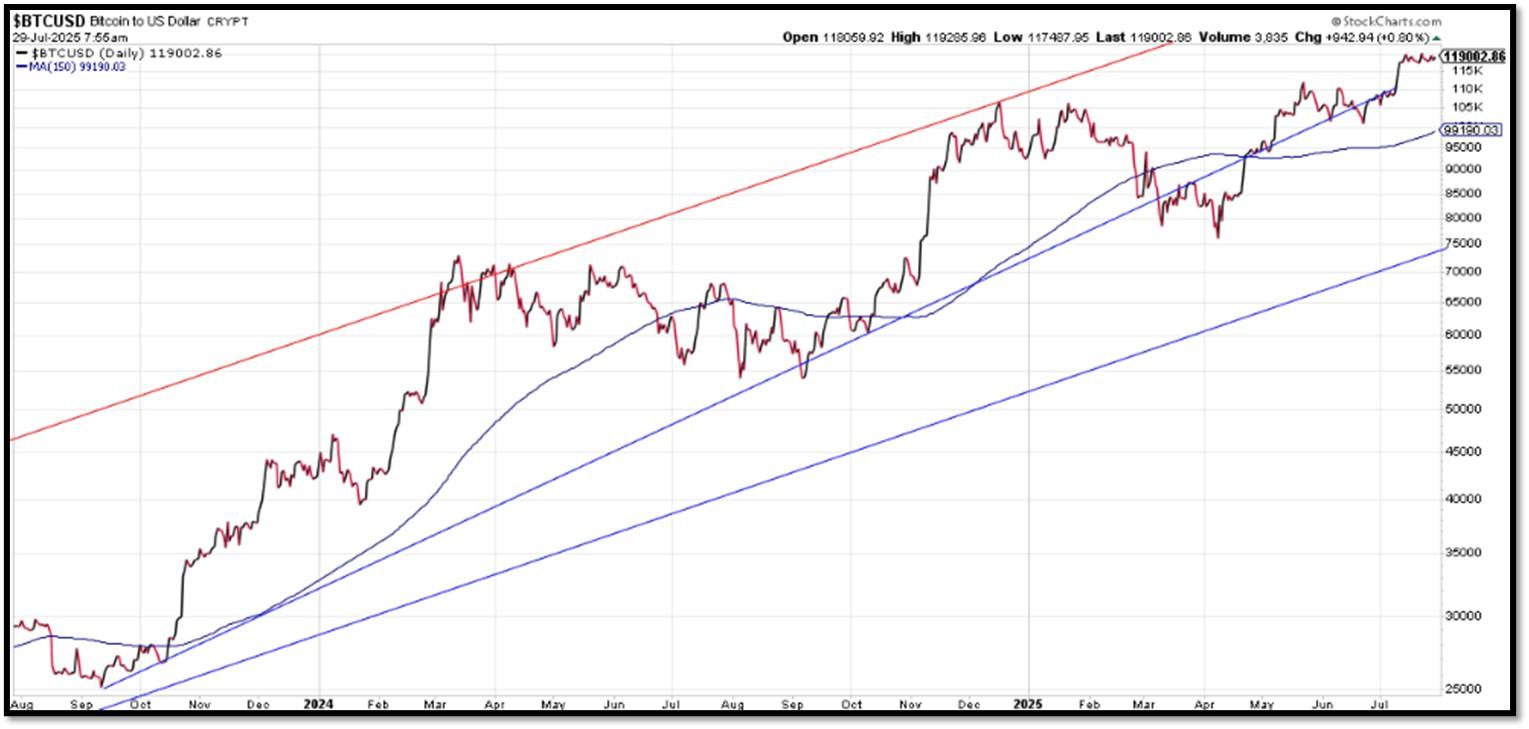
Bitcoin – 10-Year & 2-Year Charts. REF: Stockcharts10Y, Stockcharts2Y
From the desk of our Chief Investment Officer
As an investment professional with over twenty-six years of experience in the financial services industry, Andrew helps clients to protect, grow and transfer wealth during their lifetime with objective, unbiased, customized and efficient strategies.
Education, Professional Licenses Acquired & Affiliations
- Passed the Series 7, 63, 65 and 24 license examinations
- Currently holding Series 65 License
- BA in Economics – Boston University (Boston, MA) 1993
- Certificate in Commodities Trading – New York University (New York, NY) 1991
- Certificate in Financial Planning – New York University (New York, NY) April 2011
With extensive experience in the Financial Services Industry, Andrew Tang and Turner Financial Group provides disciplined wealth management with an intelligent caring approach to each and every client that compliments the Dedicated Financial offering.


Len writes much of his own content, and also shares helpful content from other trusted providers like Turner Financial Group (TFG).
The material contained herein is intended as a general market commentary, solely for informational purposes and is not intended to make an offer or solicitation for the sale or purchase of any securities. Such views are subject to change at any time without notice due to changes in market or economic conditions and may not necessarily come to pass. This information is not intended as a specific offer of investment services by Dedicated Financial and Turner Financial Group, Inc.
Dedicated Financial and Turner Financial Group, Inc., do not provide tax, legal or accounting advice. You should consult your own tax, legal and accounting advisors before engaging in any transaction.
Any hyperlinks in this document that connect to Web Sites maintained by third parties are provided for convenience only. Turner Financial Group, Inc. has not verified the accuracy of any information contained within the links and the provision of such links does not constitute a recommendation or endorsement of the company or the content by Dedicated Financial or Turner Financial Group, Inc. The prices/quotes/statistics referenced herein have been obtained from sources verified to be reliable for their accuracy or completeness and may be subject to change.
Past performance is no guarantee of future returns. Investing involves risk and possible loss of principal capital. The views and strategies described herein may not be suitable for all investors. To the extent referenced herein, real estate, hedge funds, and other private investments can present significant risks, including loss of the original amount invested. All indexes are unmanaged, and an individual cannot invest directly in an index. Index returns do not include fees or expenses.
Turner Financial Group, Inc. is an Investment Adviser registered with the United States Securities and Exchange Commission however, such registration does not imply a certain level of skill or training and no inference to the contrary should be made. Additional information about Turner Financial Group, Inc. is also available at www.adviserinfo.sec.gov. Advisory services are only offered to clients or prospective clients where Turner Financial Group, Inc. and its representatives are properly licensed or exempt from licensure. No advice may be rendered by Turner Financial Group, Inc. unless a client service agreement is in place.


