

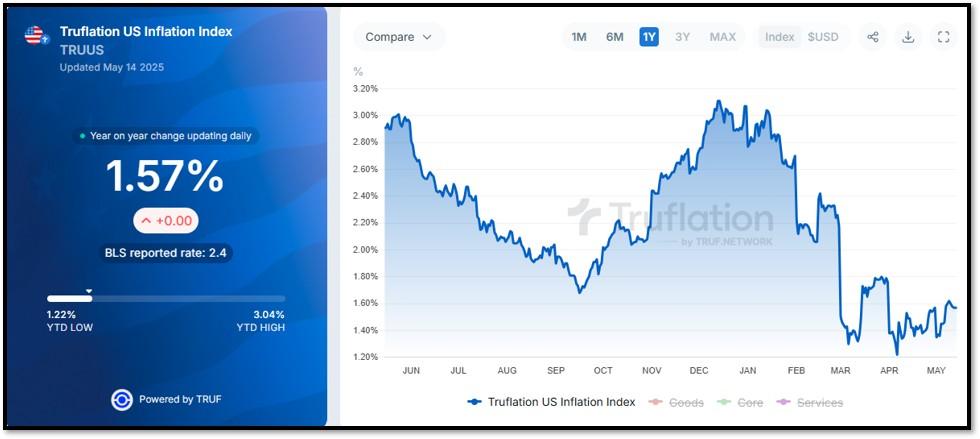
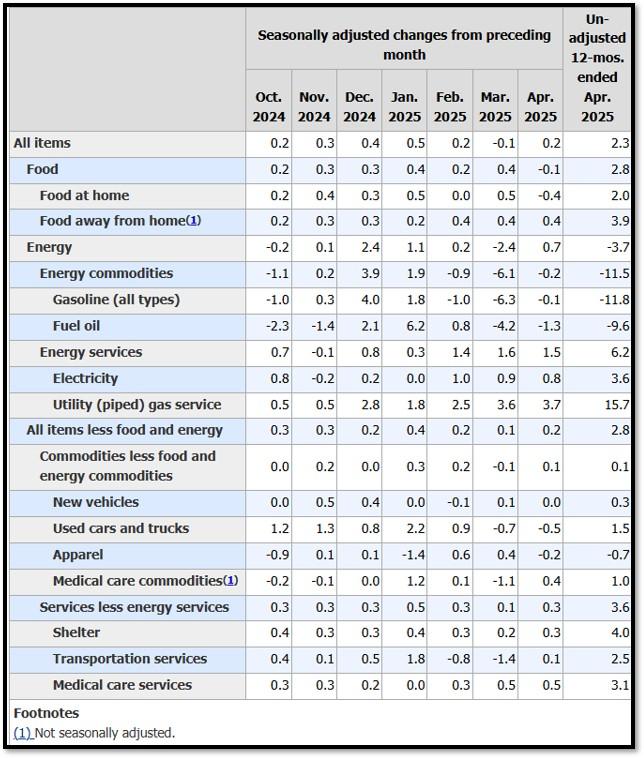
- 1. This week’s economic data, led by the April 2025 Consumer Price Index (CPI) report, indicated cooling inflation, with headline CPI rising 2.3% year-over-year, down from 2.4% in March, the lowest since February 2021.
- 2. United States and China reached a significant, albeit temporary, agreement to de-escalate their escalating trade war, as reported by NPR, The New York Times, and Reuters.
- 3. Silicon Valley’s push to capture a share of the U.S. Department of Defense’s (DoD) projected $1 trillion budget, as highlighted by BARRON’S, marks a transformative shift in the defense industry, driven by tech startups like Palantir, Anduril, and Shield AI.
- 4. World Watch
- 4A. President Donald Trump embarked on a four-day Middle East tour, visiting Saudi Arabia, Qatar, and the United Arab Emirates, marking his first major international trip of his second term.
- 4B. President Donald Trump’s May 2025 Middle East tour, covering Saudi Arabia, Qatar, and the UAE, marked a pivotal moment in U.S.-Gulf relations, with artificial intelligence (AI) deals emerging as a cornerstone of his economic and strategic agenda.
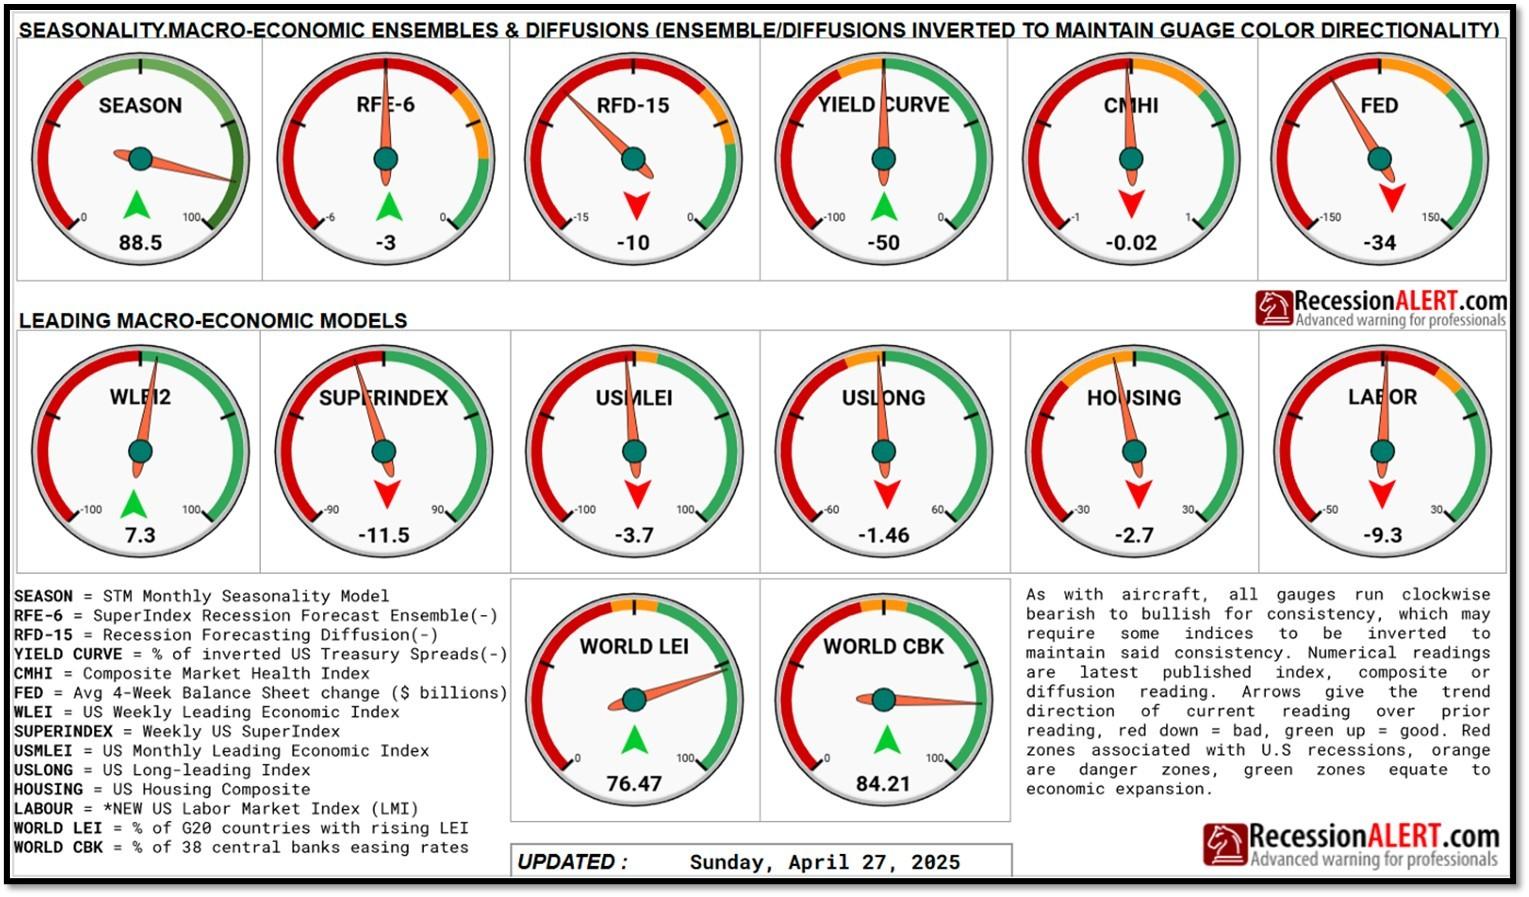
- 4C. An updated snapshot of the current global state of economy.
- 5. Quant & Technical Corner – A selection of quantitative & technical data we monitor on a regular basis to help gauge the overall financial market conditions and the investment environment.
1. This week’s economic data, led by the April 2025 Consumer Price Index (CPI) report, indicated cooling inflation, with headline CPI rising 2.3% year-over-year, down from 2.4% in March, the lowest since February 2021.
The Bureau of Labor Statistics reported a 0.2% month-over-month increase, primarily driven by a 12.7% drop in egg prices, which caused a 1.6% decline in the meats, poultry, fish, and eggs index, alongside a 3.7% annual fall in energy prices, notably an 11.8% decrease in gasoline. Truflation, an alternative inflation gauge, estimated a slightly lower 1.57% rate, reinforcing the cooling trend. Core CPI, excluding food and energy, remained at 2.8% annually, showing stable underlying pressures. The labor market added 164,000 jobs in April, down from 228,000 in March, with unemployment rising to 4.2%. Posts on X highlighted market optimism, with traders anticipating Federal Reserve rate cuts, possibly in September, due to the softer inflation data.
The lower CPI and Truflation readings bolster arguments for the Federal Reserve to resume interest rate cuts, critical for revitalizing manufacturing and real estate. Re-shoring U.S. manufacturing demands capital for new factories, but high borrowing costs since 2022 have hindered progress. Rate cuts would ease financing, enabling expansion. The real estate sector, crippled by high rates, faces stalled projects and loan rollovers, with developers frozen out of affordable capital. The Fed’s benchmark rate, steady at 4.25%-4.50% in May, reflects caution amid tariff risks, with EY forecasting only two cuts in 2025, likely starting in September, as tariffs may push inflation to 3.2%. Despite the encouraging CPI, the Fed’s cautious, data-driven approach and trade policy uncertainties could delay relief, leaving manufacturing and real estate vulnerable. REF: Truflation
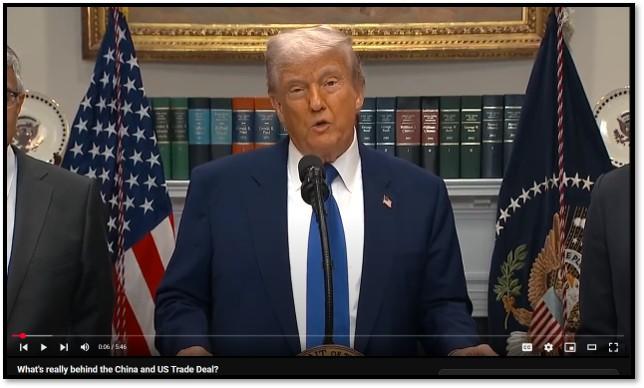
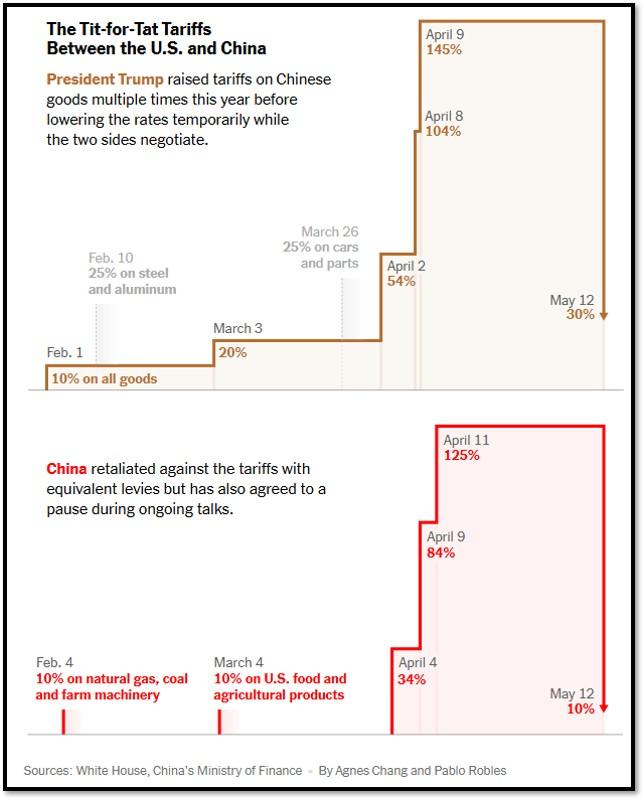
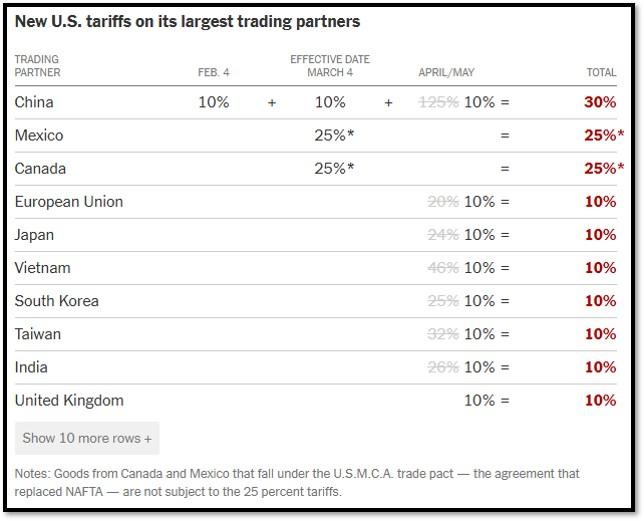
2. United States and China reached a significant, albeit temporary, agreement to de-escalate their escalating trade war, as reported by NPR, The New York Times, and Reuters.
Following intense negotiations in Geneva, both nations agreed to a 90-day pause on most tariffs imposed since April 2, 2025, slashing U.S. tariffs on Chinese goods from 145% to 30% and Chinese tariffs on U.S. goods from 125% to 10%, effective May 14, 2025. This deal, described as a “major breakthrough” by CNN, retains a U.S. 10% universal tariff and a 20% tariff tied to fentanyl-related concerns, while China suspended non-tariff countermeasures, such as rare earth export restrictions. The agreement, driven by Treasury Secretary Scott Bessent and Chinese Vice Premier He Lifeng, aims to stabilize global markets rattled by the trade dispute, with both sides establishing a consultation mechanism for further talks. However, the pause offers no major concessions beyond continued dialogue, leaving underlying issues like the U.S. trade deficit and China’s manufacturing dominance unresolved.
Despite the relief rally in global stocks, with the S&P 500 rising 2.7% and the Nasdaq jumping 3.7%, analysts remain cautious about the deal’s long-term impact. The Washington Post and Reuters note that the temporary truce does little to address deep-seated tensions, with tariffs still higher than pre-April levels and no clear path to a comprehensive agreement. Critics, like Scott Kennedy from the Center for Strategic and International Studies, argue the U.S. retreated under economic pressure, as the 145% tariffs disrupted supply chains and threatened American businesses with bankruptcy. Chinese media, per CNBC, hailed the deal as a victory for Beijing’s defiant stance, while U.S. businesses scramble to ship goods before the 90-day window closes, wary of potential tariff hikes if talks falter. The agreement’s focus on de-escalation over structural reform, coupled with ongoing U.S. demands for China to curb fentanyl precursors and open markets, suggests a fragile truce amid a broader economic and geopolitical rivalry. Click onto picture below to access video. REF: WH, NYT
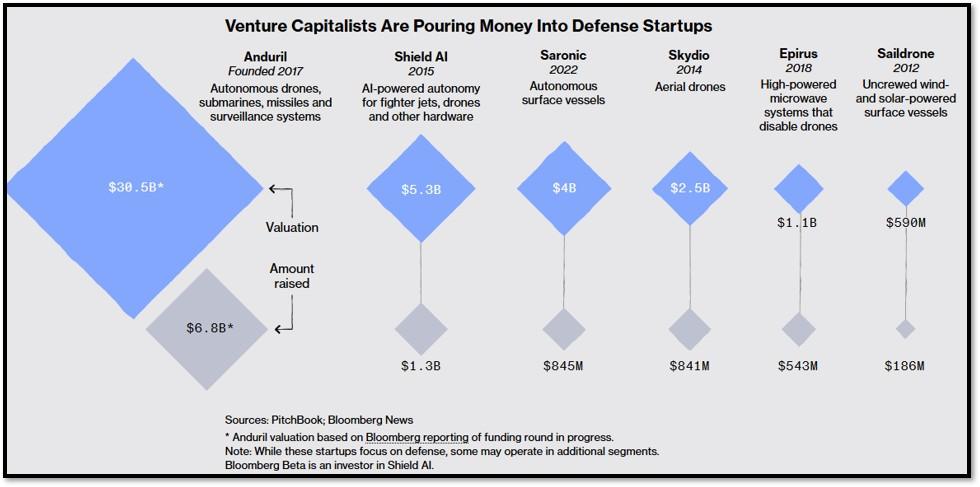
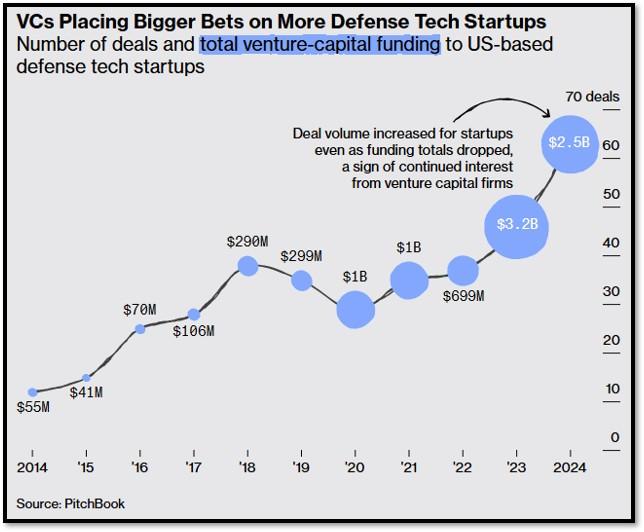
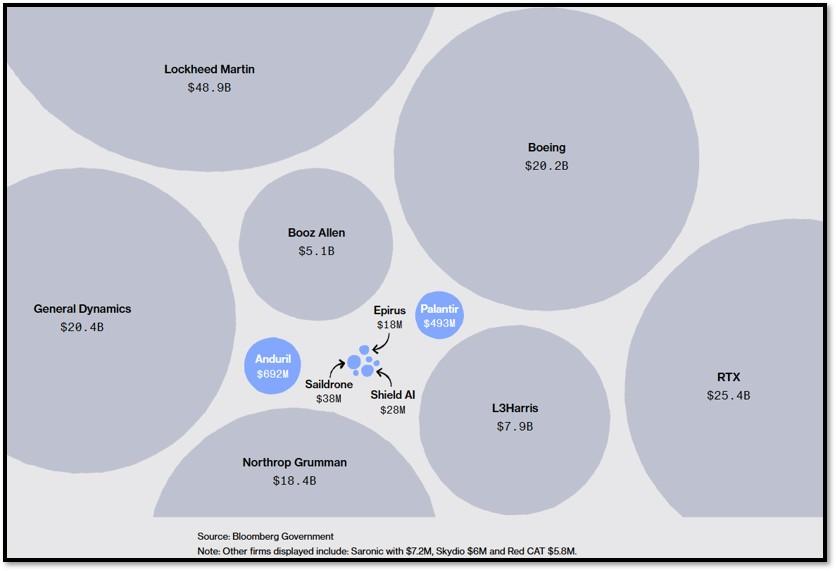
3. Silicon Valley’s push to capture a share of the U.S. Department of Defense’s (DoD) projected $1 trillion budget, as highlighted by BARRON’S, marks a transformative shift in the defense industry, driven by tech startups like Palantir, Anduril, and Shield AI.
These firms are challenging traditional defense contractors—such as Lockheed Martin and Boeing—by offering AI-driven software, autonomous drones, and digital warfare solutions that prioritize speed and innovation over conventional hardware-heavy systems. For instance, Palantir’s $178 million contract for the Army’s Titan battlefield system, secured over RTX Corp., was a historic win, marking the first time a software company led a major DoD battlefield project. This shift is fueled by the Trump administration’s emphasis on a “software-centric” approach, with Defense Secretary Pete Hegseth redirecting $50 billion toward innovative weaponry and Deputy Defense Secretary Stephen Feinberg scrutinizing procurement to favor agile tech solutions. Silicon Valley’s growing influence is further amplified by its political alignment with the administration, as tech leaders like Palantir’s Alex Karp advocate for a moral imperative to bolster U.S. defense through cutting-edge technology, positioning startups as key players in modernizing the military.
However, this tech invasion of the Pentagon’s budget raises significant concerns about oversight, ethics, and long-term efficacy. Critics, including Stanford professor Roberto Gonzalez, warn that prioritizing commercial software and AI could erode checks and balances, leaving the DoD vulnerable to costly, unproven systems that may not deliver as promised. The Pentagon’s history of failed audits and unaccounted-for trillions underscores the risk of entrusting taxpayer dollars to startups with a “move fast and break things” ethos, which clashes with the military’s need for reliable, battle-tested equipment. Ethical questions also loom, as Silicon Valley’s push for autonomous weapons and AI-driven warfare—exemplified by Palantir’s battlefield analysis tools and Shield AI’s autonomous drone swarms—stirs debate over accountability and the potential for misuse. While the DoD’s $1 trillion budget offers a lucrative opportunity for tech firms, the lack of transparency in classified contracts and the influence of venture capital, which pumped $100 billion into defense tech from 2021 to 2023, heighten fears of profiteering over strategic necessity. Balancing innovation with rigorous oversight will be critical to ensure Silicon Valley’s contributions enhance, rather than undermine, national security. Two ETFs come to mind covering publicly traded companies this space: ITA and SHLD. Click onto Reference Links below to access additional information. REF: BARRON’S
- iShares US Aerospace & Defense ETF (ITA) – REF: https://www.ishares.com/us/products/239502/ishares-us-aerospace-defense-etf
- Global X Defense Tech ETF (SHLD) – REF: https://www.globalxetfs.com/funds/shld
NOTE: Not investment advice or recommendations. Investor should consider the investment objective, risks, charges and expenses carefully before investing. For prospectus or summary prospectus with information about these Funds (ETFs), please visit referenced links listed above. Read carefully before investing.
With the current macro-economic backdrop, below are areas we currently favor:
- Fixed Income – Short-term Corporates (Low-Beta)
- Fixed Income – Corporates High Yield as Opportunistic Allocation (Low-Beta)
- Businesses that contribute to and benefit from AI & Automation (Market-Risk)
- Cyber-Security & Software (Market-Risk)
- Biotechnology (Market-Risk)
- Financials (Market-Risk)
- Digital Asset – Bitcoin (Market-Risk/Hedge)
- Cloud Computing (Market-Risk)
4. World Watch
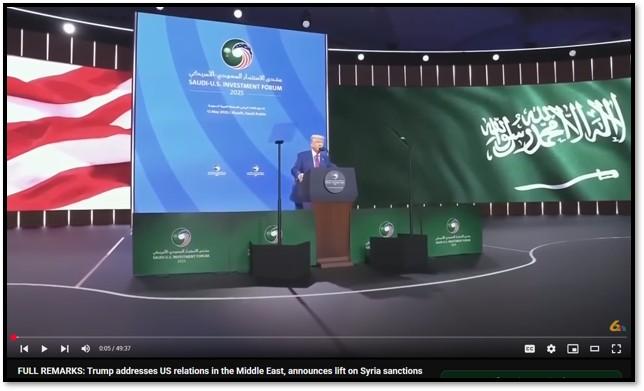
4A. President Donald Trump embarked on a four-day Middle East tour, visiting Saudi Arabia, Qatar, and the United Arab Emirates, marking his first major international trip of his second term.
The visit, detailed in WSJ and Bloomberg articles, prioritized economic deals and investments over traditional diplomatic efforts, reflecting Trump’s dealmaking approach to foreign policy. In Saudi Arabia, Trump secured a reported $600 billion investment commitment, including a $142 billion defense sales agreement, and announced the lifting of U.S. sanctions on Syria to foster regional stability. Discussions in Qatar and the UAE focused on aviation, technology, and defense, with Qatar Airways nearing a 100-jet Boeing order and the UAE pledging significant investments. The trip underscored Trump’s strategy to leverage Gulf wealth for U.S. economic gains, while notably avoiding Israel amid Gaza tensions and strained relations with Prime Minister Benjamin Netanyahu.
The visit highlighted Trump’s preference for commerce over conflict resolution, as he sidestepped contentious issues like the Gaza war and Iranian nuclear talks, focusing instead on strengthening economic ties with Gulf allies. However, the ambitious $1 trillion in commercial deals touted with Saudi Arabia faced scrutiny for lacking firm commitments, suggesting some figures were aspirational. The trip also revealed regional dynamics, with Gulf states aiming to solidify their status as indispensable U.S. partners while navigating Trump’s tariff policies and nuclear ambitions. Despite the economic focus, geopolitical undercurrents persisted, with Saudi Arabia seeking U.S. support for a civil nuclear program and Qatar pushing for Gaza ceasefire mediation. Below are key takeaways. Click onto pictures further below to access videos. REF: WSJ, Bloomberg, SkyNews
- Economic Focus: Secured $600 billion in Saudi investments, including a $142 billion defense deal, and advanced aviation and tech accords with Qatar and UAE.
- Sanctions Lifted: Announced the end of U.S. sanctions on Syria to promote regional stability.
- Israel Omission: Skipped Israel due to Gaza conflict and tensions with Netanyahu, signaling a shift in U.S. Middle East priorities.
- Scrutiny on Deals: Reported $1 trillion in deals faced questions over feasibility and firmness.
- Gulf Ambitions: Saudi Arabia pursued nuclear cooperation, while Qatar emphasized military and mediation roles.

4B. President Donald Trump’s May 2025 Middle East tour, covering Saudi Arabia, Qatar, and the UAE, marked a pivotal moment in U.S.-Gulf relations, with artificial intelligence (AI) deals emerging as a cornerstone of his economic and strategic agenda.
As reported by Bloomberg, Trump leveraged U.S. dominance in AI chip technology to secure massive investments, including Saudi Arabia’s $20 billion commitment to U.S. AI data centers via DataVolt and $80 billion in joint AI projects with firms like Nvidia, AMD, and Google. The UAE’s G42 signed deals with Cisco and Nvidia for up to 500,000 AI chips annually, while Qatar explored tech infrastructure alongside aviation agreements. By easing Biden-era export restrictions on advanced semiconductors, Trump enabled Gulf nations to access cutting-edge technology, positioning them as potential AI hubs. These deals, part of a broader $600 billion Saudi investment package, reflect a shift from oil and defense ties to technology-driven partnerships aimed at countering China’s global tech influence and boosting U.S. economic growth.
However, the AI deals carry significant risks and complexities that temper their promise. National security concerns loom large, with critics like Rep. John Moolenaar warning that large-scale chip exports could enable technology transfers to adversaries like China, a fear echoed in X posts alleging potential Saudi resales. The Trump administration’s transactional approach, prioritizing economic gains over geopolitical issues like Gaza or Saudi-Israeli normalization, raises questions about long-term strategic leverage, especially as Saudi Arabia links AI ambitions to its pursuit of a civil nuclear program. Ethical concerns also surfaced due to the Trump family’s business ties in the region, including real estate ventures in Qatar and a UAE crypto deal, fueling accusations of conflicts of interest. While the deals promise job creation and Gulf diversification, their success hinges on robust safeguards to prevent misuse and ensure mutual benefits, lest the U.S. cede technological dominance for short-term financial gains. Click onto picture below to access video. REF: Bloomberg, Video

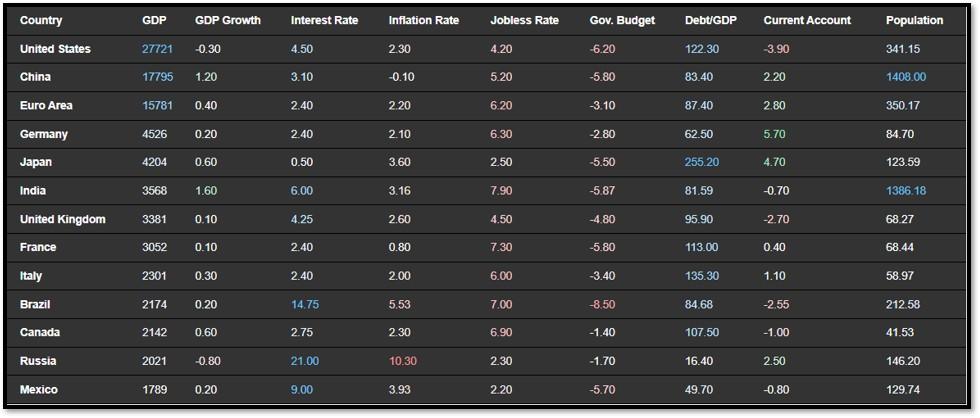
4C. An updated snapshot of the current global state of economy.
According to TradingEconomics as of 5/13/2025, REF: TradingEconomics:
- The annual inflation rate in the US eased to 2.3% in April 2025, the lowest since February 2021, from 2.4% in March and below forecasts of 2.4%.
- The annual inflation rate in India fell to 3.16% in April of 2025, the lowest since July of 2019, from 3.34% in the previous month, and firmly below market expectations of 3.3%.
- The Bank of England voted 5–4 to cut Bank Rate by 25bps to 4.25% in May as expected.
- The United Kingdom’s unemployment rate edged higher to 4.5% from January to March 2025, after remaining unchanged at 4.4% for four consecutive periods, aligning with market expectations.
5. Quant & Technical Corner – A selection of quantitative & technical data we monitor on a regular basis to help gauge the overall financial market conditions and the investment environment.
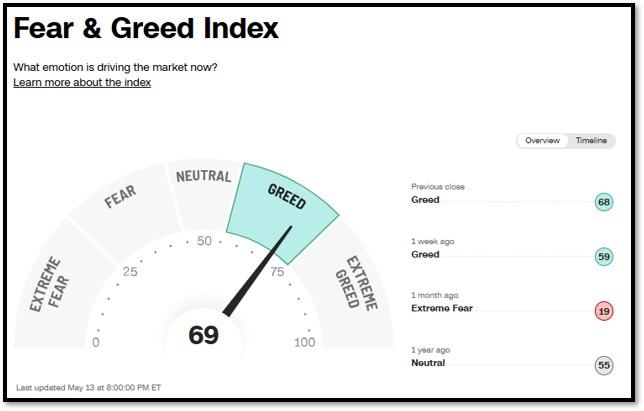
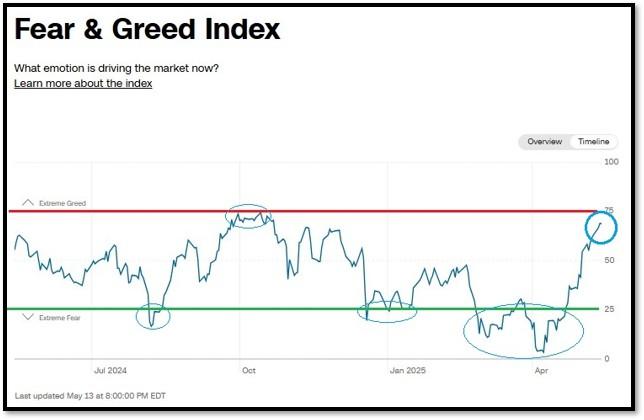
5A. Most recent read on the Fear & Greed Index with data as of 5/13/2025 – 8:00PM-ET is 69 (Greed). Last week’s data was 59 (Fear) (1-100). CNNMoney’s Fear & Greed index looks at 7 indicators (Stock Price Momentum, Stock Price Strength, Stock Price Breadth, Put and Call Options, Junk Bond Demand, Market Volatility, and Safe Haven Demand). Keep in mind this is a contrarian indicator! REF: Fear&Greed via CNNMoney
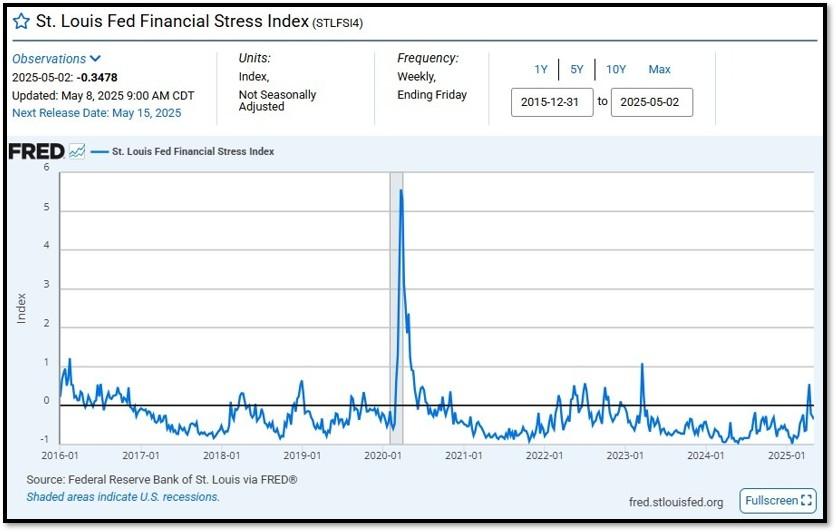
5B. St. Louis Fed Financial Stress Index’s (STLFSI4) most recent read is at –0.2767 as of May 8, 2025. Previous week’s data was -0.2767. A big spike up from previous readings reflecting the turmoil in the banking sector back in 2023. This weekly index is not seasonally adjusted. The STLFSI4 measures the degree of financial stress in the markets and is constructed from 18 weekly data series: seven interest rate series, six yield spreads and five other indicators. Each of these variables captures some aspect of financial stress. Accordingly, as the level of financial stress in the economy changes, the data series are likely to move together. REF: St. Louis Fed
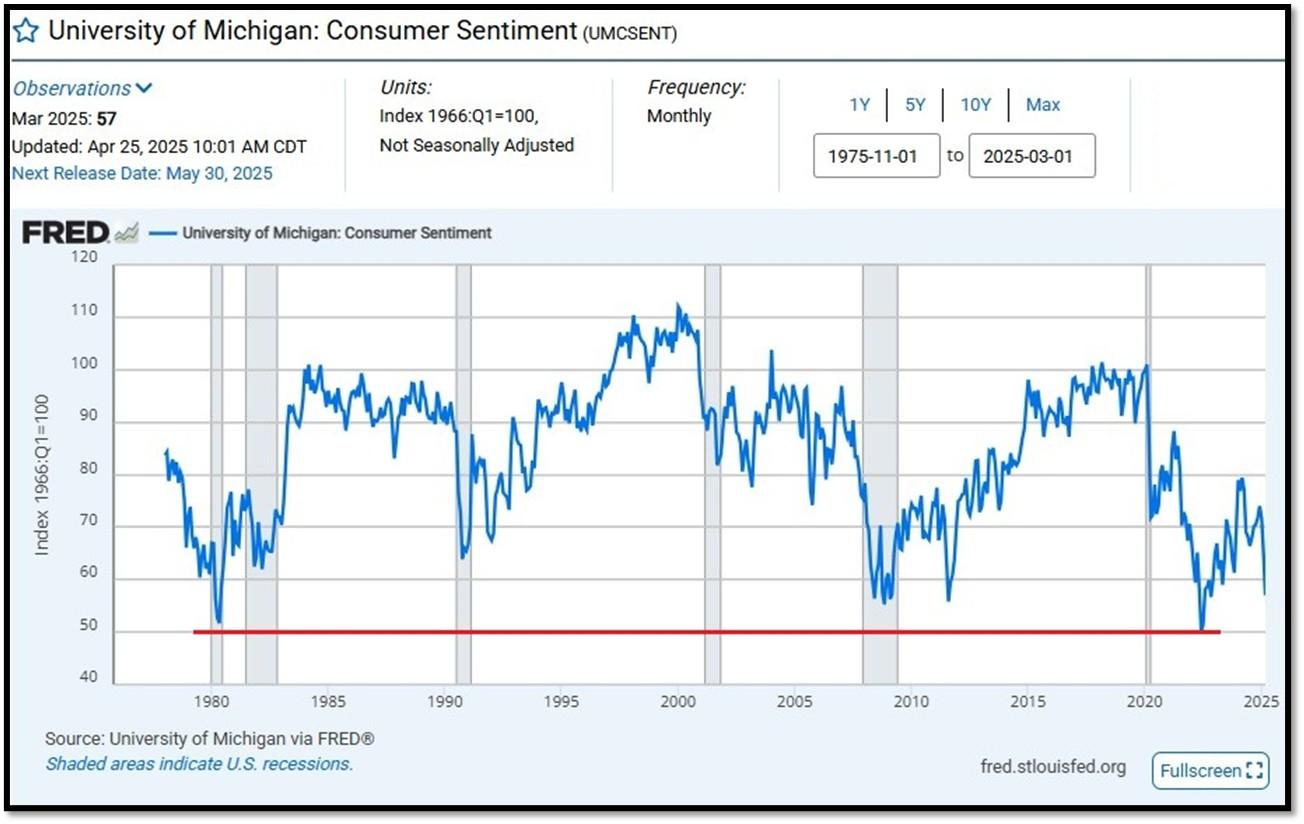
5C. University of Michigan, University of Michigan: Consumer Sentiment for February [UMCSENT] at 57, retrieved from FRED, Federal Reserve Bank of St. Louis, April 25, 2025. Back in June 2022, Consumer Sentiment hit a low point going back to April 1980. REF: UofM
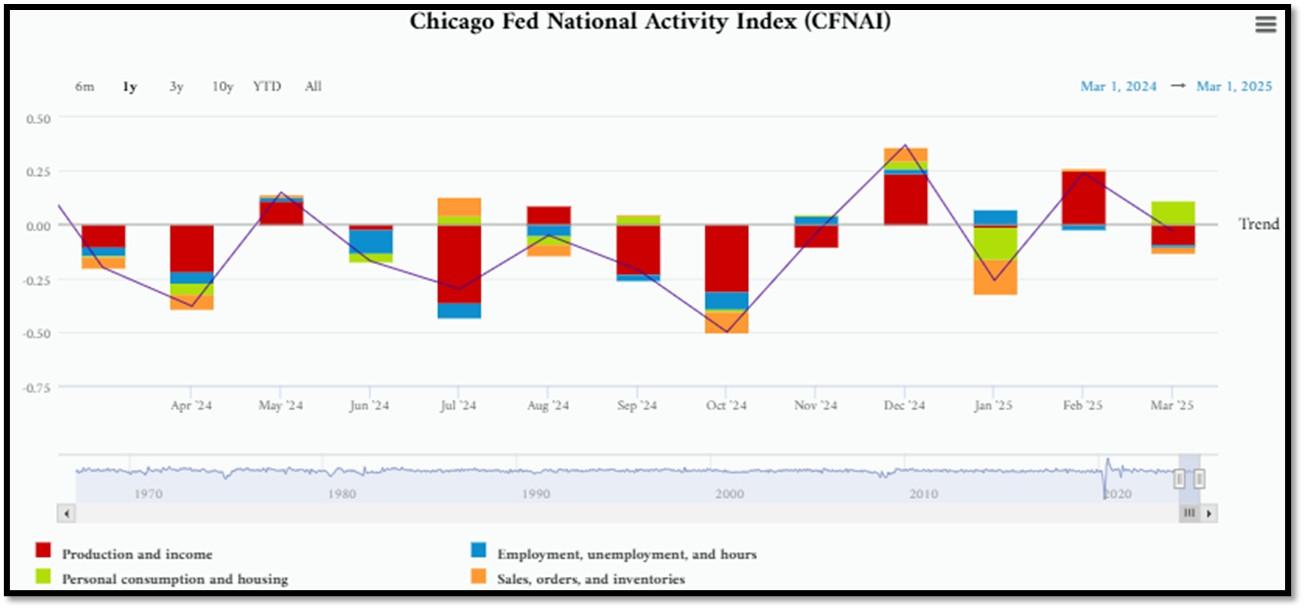
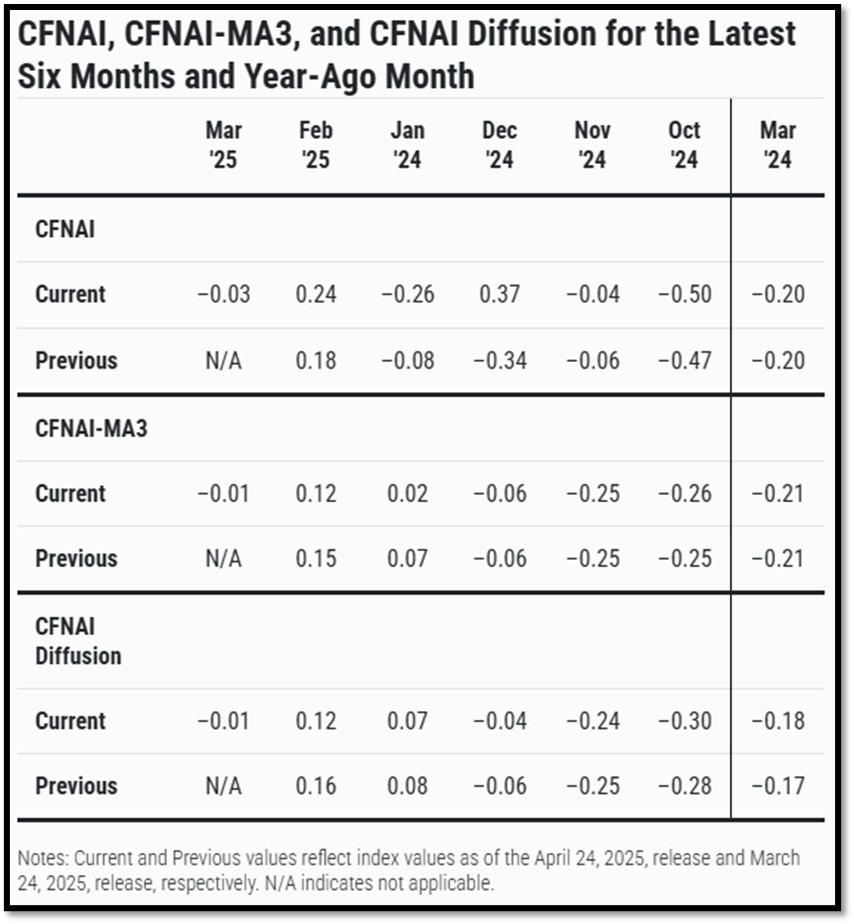
5D. The Chicago Fed National Activity Index (CFNAI) decreased to –0.03 in March from +0.24 in February. Two of the four broad categories of indicators used to construct the index decreased from February, and three categories made negative contributions in March. The index’s three-month moving average, CFNAI-MA3, decreased to –0.01 in March from +0.12 in February. REF: ChicagoFed, March’s Report
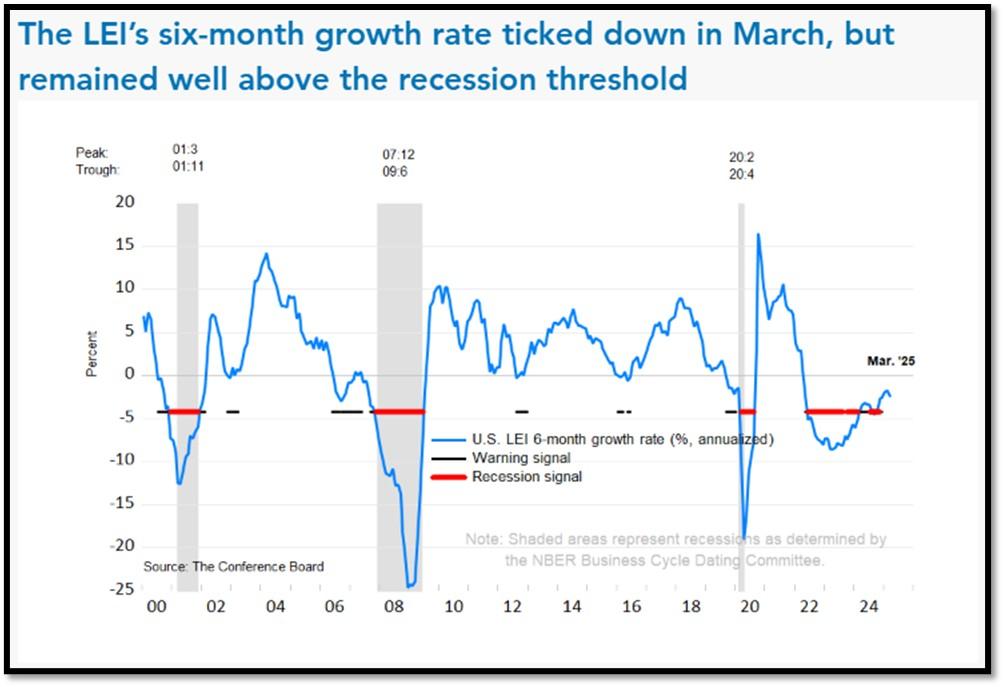
5E. (4/21/2025) The Conference Board Leading Economic Index (LEI) for the US declined by 0.7% in March 2025 to 100.5 (2016=100), after a decline of 0.2% (revised up from –0.3%) in February. The LEI also fell by 1.2% in the six-month period ending in March 2025, a smaller rate of decline than its –2.3% contraction over the previous six months (March–September 2024). The composite economic indexes are the key elements in an analytic system designed to signal peaks and troughs in the business cycle. The indexes are constructed to summarize and reveal common turning points in the economy in a clearer and more convincing manner than any individual component. The CEI is highly correlated with real GDP. The LEI is a predictive variable that anticipates (or “leads”) turning points in the business cycle by around 7 months. Shaded areas denote recession periods or economic contractions. The dates above the shaded areas show the chronology of peaks and troughs in the business cycle. The ten components of The Conference Board Leading Economic Index® for the U.S. include: Average weekly hours in manufacturing; Average weekly initial claims for unemployment insurance; Manufacturers’ new orders for consumer goods and materials; ISM® Index of New Orders; Manufacturers’ new orders for nondefense capital goods excluding aircraft orders; Building permits for new private housing units; S&P 500® Index of Stock Prices; Leading Credit Index™; Interest rate spread (10-year Treasury bonds less federal funds rate); Average consumer expectations for business conditions. REF: ConferenceBoard, LEI Report for March (Released on 4/27/2025)
We have experienced a “rolling recession” since June 2022 and are only now emerging from it. However, authorities are not labeling it a recession due to high employment data.
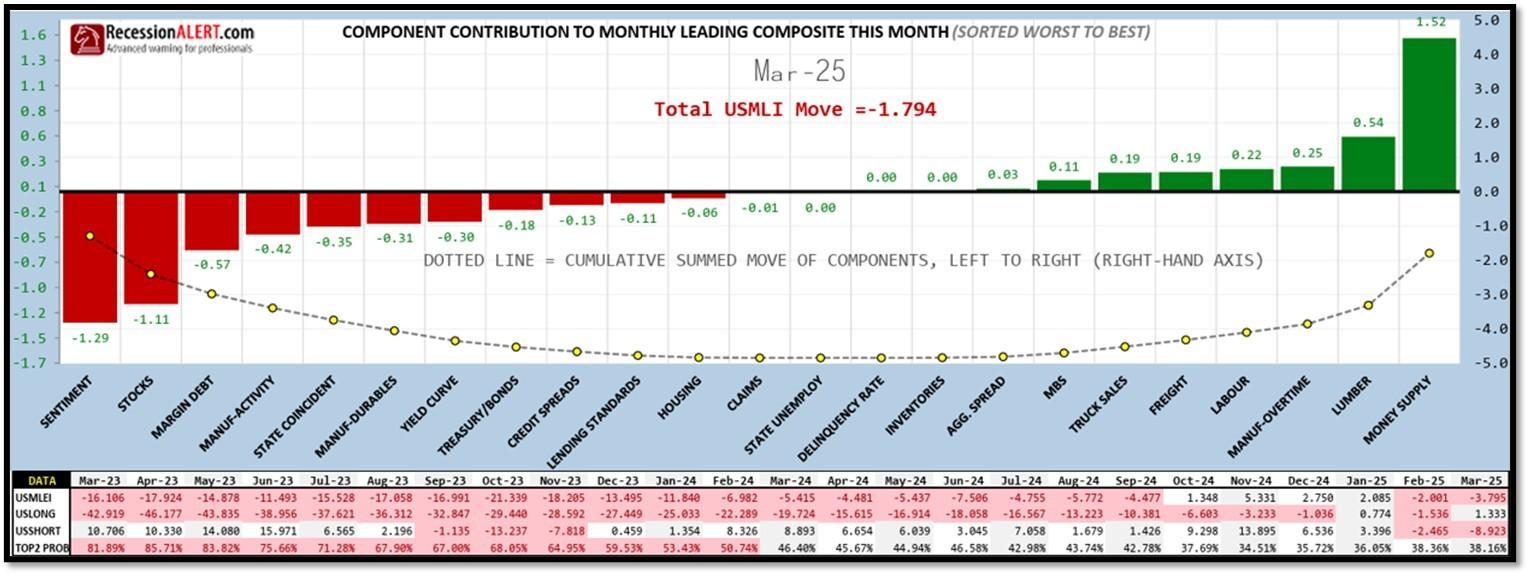
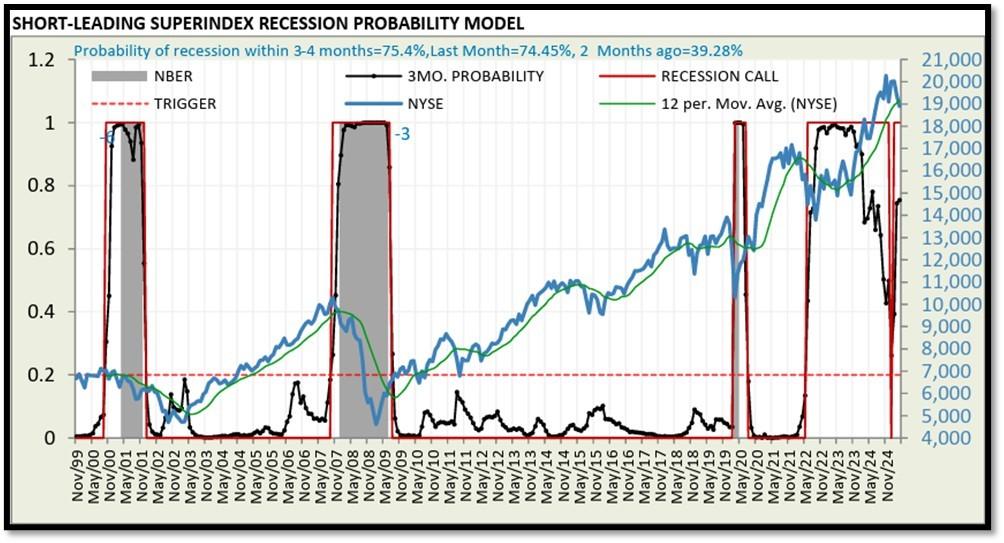
5F. Probability of U.S. falling into Recession within 3 to 4 months is currently at 75.4% (with data as of 04/27/2025 – Next Report 05/12/2025) according to RecessionAlert Research. Last release’s data was at 46.74%. This report is updated every two weeks. REF: RecessionAlertResearch
5G. Yield Curve as of 5/13/2025 is showing Normal. Spread on the 10-yr Treasury Yield (4.47%) minus yield on the 2-yr Treasury Yield (3.99%) is currently at 48bps. REF: Stockcharts The yield curve—specifically, the spread between the interest rates on the ten-year Treasury note and the three-month Treasury bill—is a valuable forecasting tool. It is simple to use and significantly outperforms other financial and macroeconomic indicators in predicting recessions two to six quarters ahead. REF: NYFED
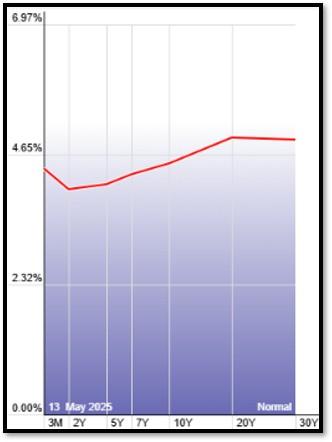
5H. Recent Yields in 10-Year Government Bonds. REF: Source is from Bloomberg.com, dated 5/13/2025, rates shown below are as of 5/13/2025, subject to change.
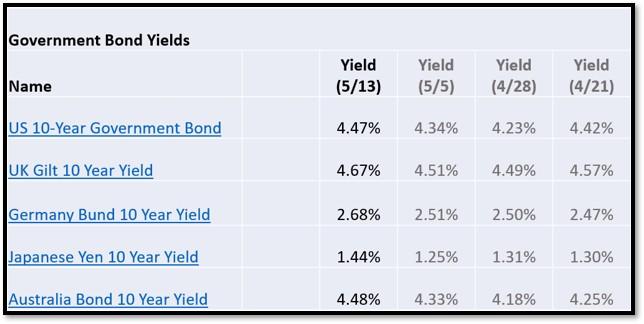
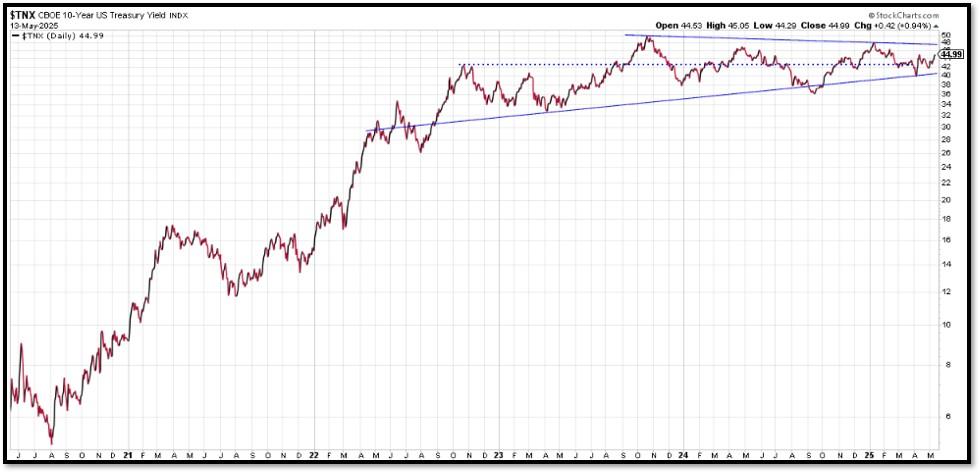
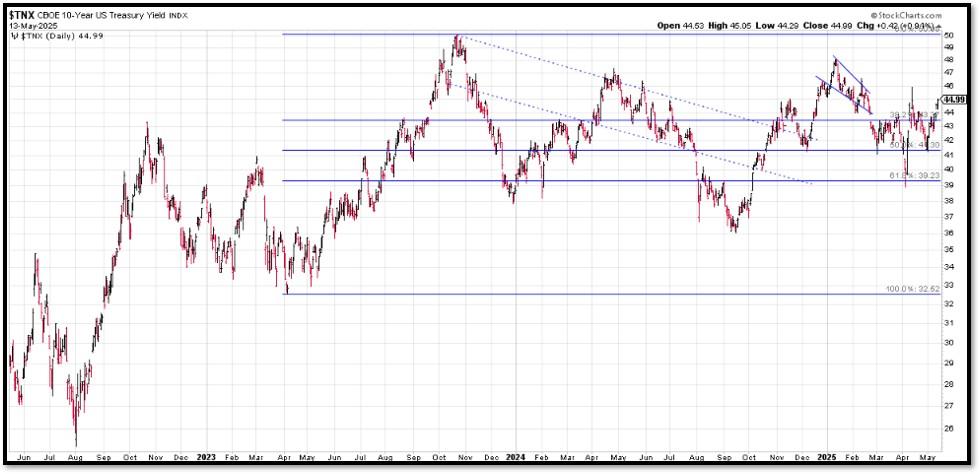
The 10-Year US Treasury Yield… The 10-Year Yield is indirectly related to inflation. I expect the 10-Year Yield to drop further as dis-inflation kicks in. REF: StockCharts1, StockCharts2
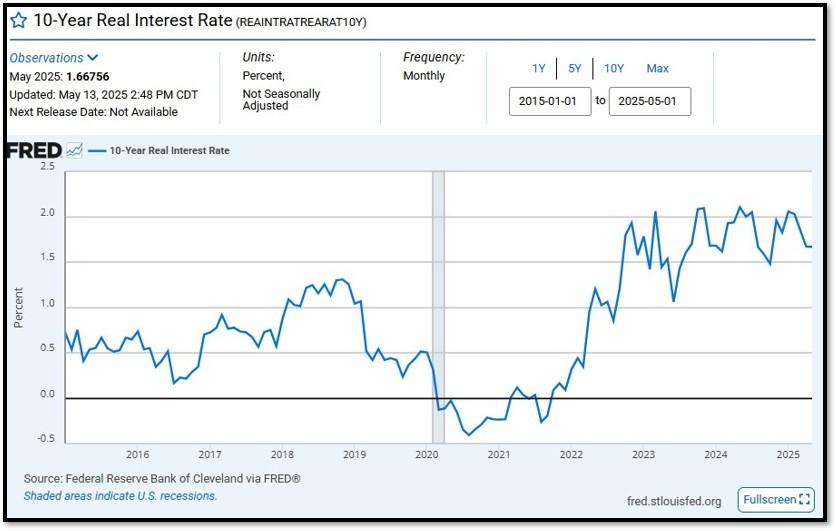
10-Year Real Interest Rate at 1.66756% as of 5/13/25. Last month’s data was 1.66841%. REF: REAINTRATREARAT10Y
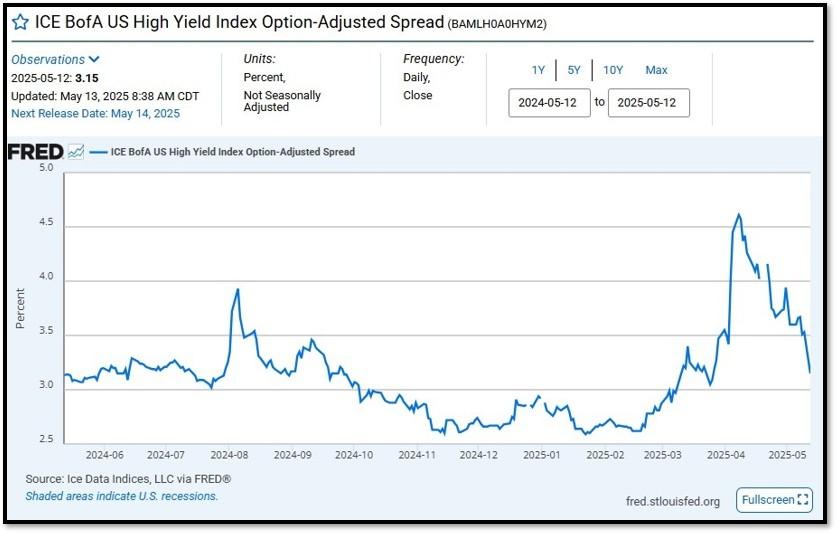
ICE BofA US High Yield Index Option-Adjusted Spread (BAMLH0A0HYM2) currently at 3.15 as of May 13, 2025. This is a key indicator of market sentiment, particularly regarding risk and economic health. At its core, the spread reflects the extra return investors demand to hold riskier corporate debt over safer government securities. High-yield bonds are issued by companies with lower credit ratings (below investment grade, like BB or lower), meaning they carry a higher chance of default. The spread compensates for this risk. When the spread is narrow—say, around 2.5% to 3%, as seen recently—it suggests investors are confident, willing to accept less extra yield because they perceive lower default risk or a strong economy. Narrow spreads often align with bullish markets, where cash is flowing, growth is steady, and fear is low. REF: FRED-BAMLH0A0HYM2
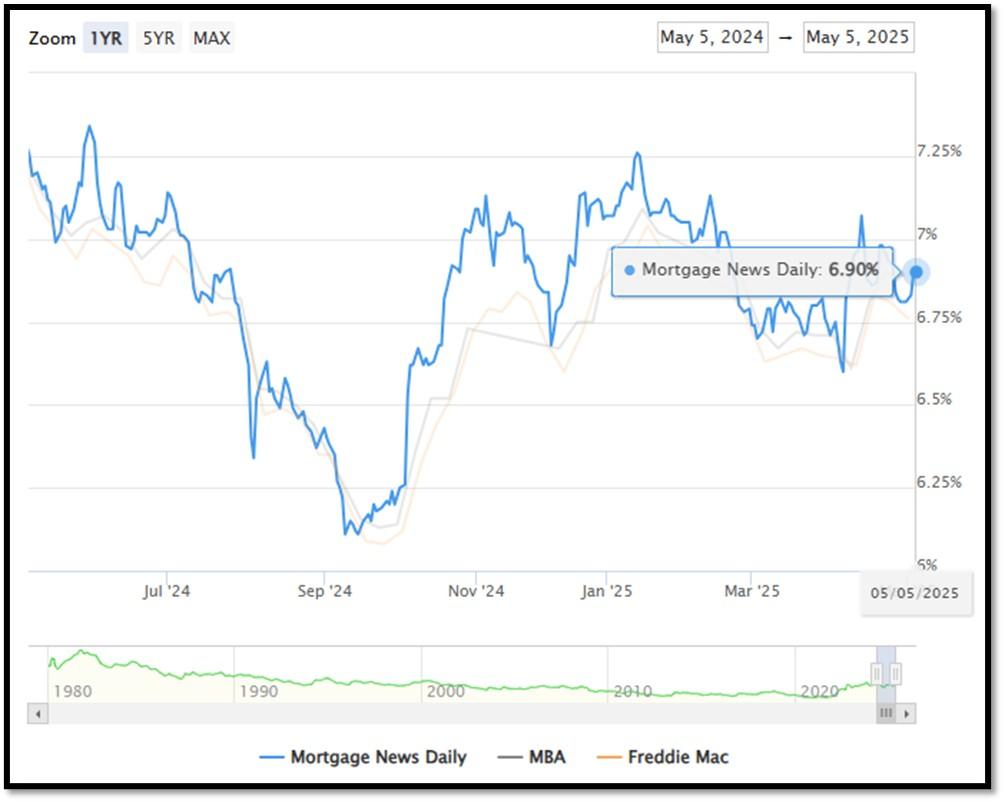
5I. (5/13/2025) Today’s National Average 30-Year Fixed Mortgage Rate is 6.92% (All Time High was 8.03% on 10/19/23). Last week’s data was 6.90%. This rate is the average 30-year fixed mortgage rates from several different surveys including Mortgage News Daily (daily index), Freddie Mac (weekly survey), Mortgage Bankers Association (weekly survey) and FHFA (monthly survey). REF: MortgageNewsDaily, Today’s Average Rate
The recent spike in the 30-year fixed-rate jumbo mortgage to 6.92%, compared to Freddie Mac’s rate at 6.76% and the Mortgage Bankers Association (MBA) rate at 6.84%, highlights key differences in the mortgage market. Jumbo mortgages, which exceed the conforming loan limits set by government agencies like Freddie Mac, typically carry higher interest rates because they are riskier for lenders. These loans are not backed by government entities, which increases the risk for lenders and, consequently, leads to higher rates. In contrast, Freddie Mac and MBA provide averages for conforming loans, which meet federal guidelines and have lower risk due to government backing, keeping their rates lower.
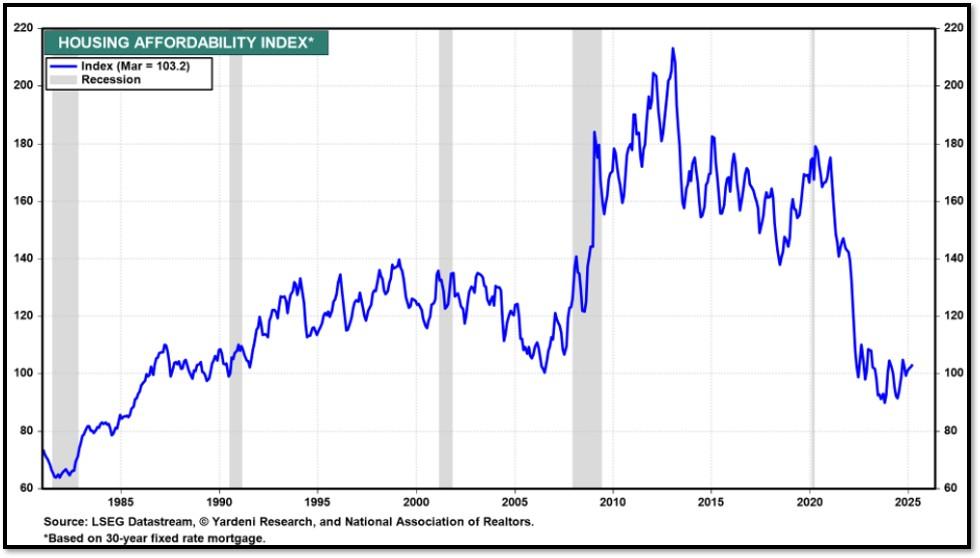
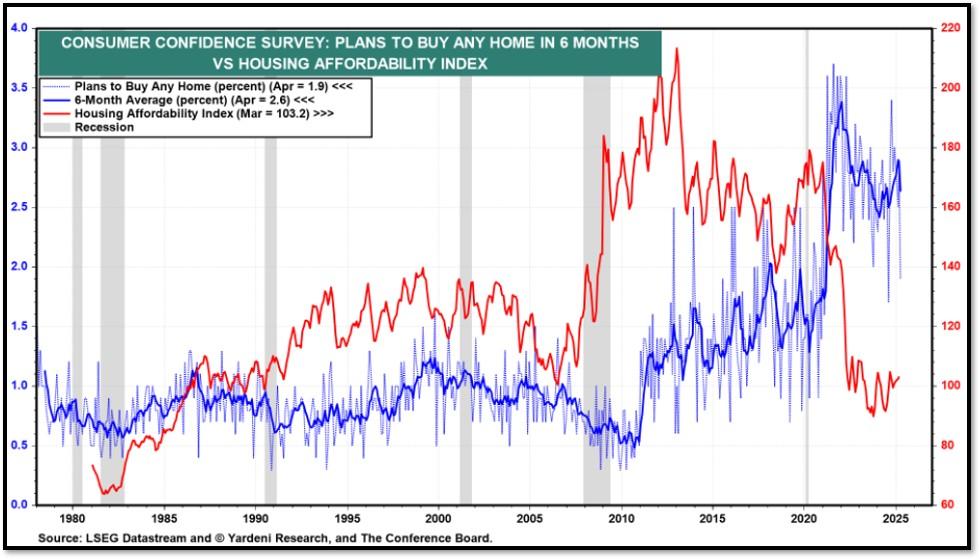
(5/13/25) Housing Affordability Index for Mar = 103.2 // Feb = 102.2 // Jan = 100.7 // Dec = 100.7 // Nov = 99 // Oct = 102.3. Data provided by Yardeni Research. REF: Yardeni
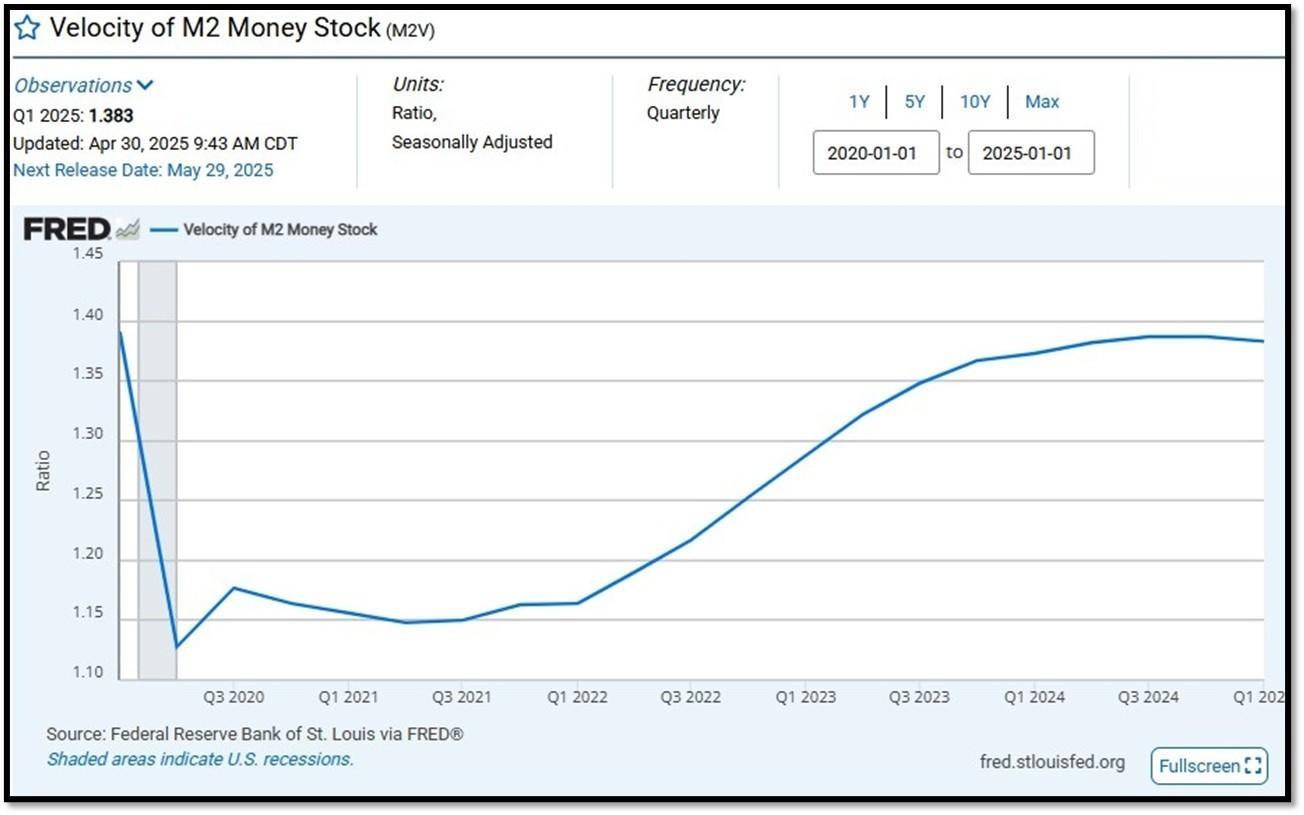
5J. Velocity of M2 Money Stock (M2V) with current read at 1.383 as of (Q1-2025 updated 4/30/2025). Previous quarter’s data was 1.387. The velocity of money is the frequency at which one unit of currency is used to purchase domestically- produced goods and services within a given time period. In other words, it is the number of times one dollar is spent to buy goods and services per unit of time. If the velocity of money is increasing, then more transactions are occurring between individuals in an economy. Current Money Stock (M2) report can be viewed in the reference link. REF: St.LouisFed-M2V
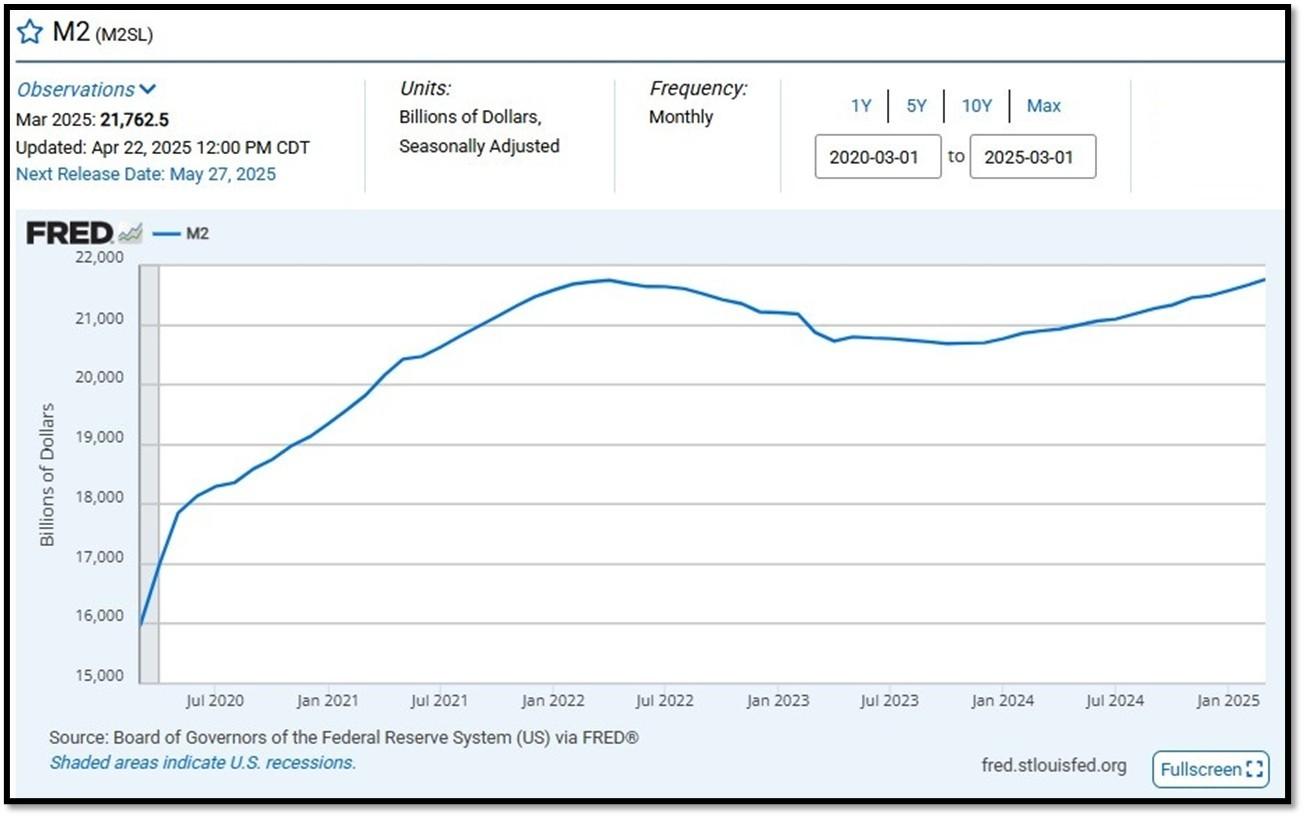
M2 consists of M1 plus (1) small-denomination time deposits (time deposits in amounts of less than $100,000) less IRA and Keogh balances at depository institutions; and (2) balances in retail MMFs less IRA and Keogh balances at MMFs. Seasonally adjusted M2 is constructed by summing savings deposits (before May 2020), small-denomination time deposits, and retail MMFs, each seasonally adjusted separately, and adding this result to seasonally adjusted M1. Board of Governors of the Federal Reserve System (US), M2 [M2SL], retrieved from FRED, Federal Reserve Bank of St. Louis; Updated on April 22, 2025. REF: St.LouisFed-M2
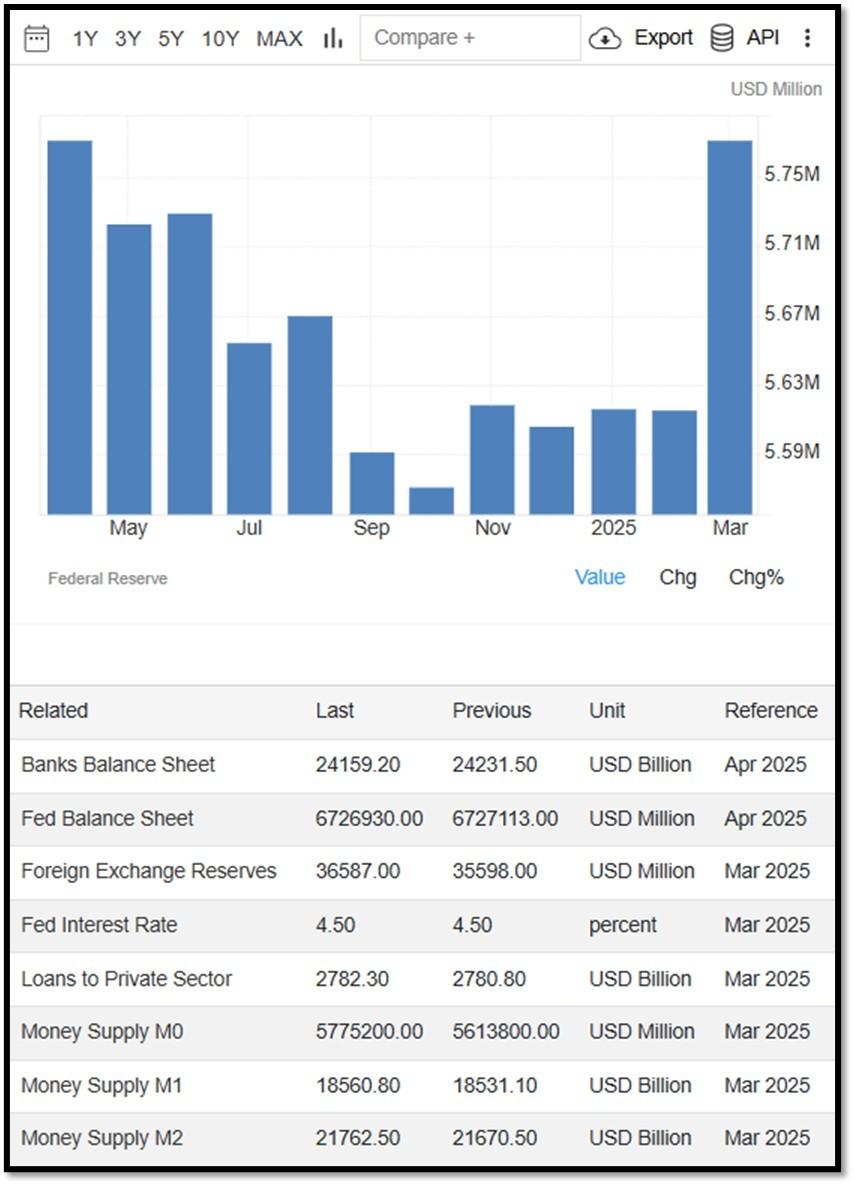
Money Supply M0 in the United States increased to 5,775,200 USD Million in March from 5,613,800 USD Million in February of 2025. Money Supply M0 in the United States averaged 1,183,266.29 USD Million from 1959 until 2025, reaching an all-time high of 6,413,100.00 USD Million in December of 2021 and a record low of 48,400.00 USD Million in February of 1961. REF: TradingEconomics, M0
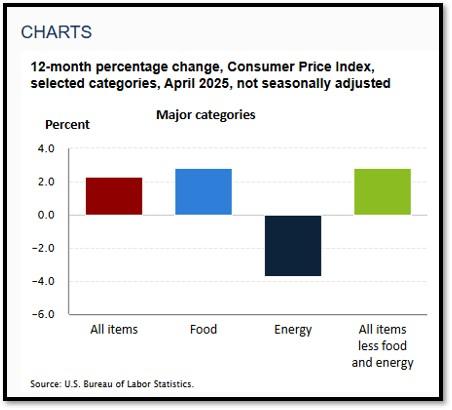
5K. In April, the Consumer Price Index for All Urban Consumers rose 0.2 percent, seasonally adjusted, and rose 2.3 percent over the last 12 months, not seasonally adjusted. The index for all items less food and energy increased 0.2 percent in April (SA); up 2.8 percent over the year (NSA). May 2025 CPI data are scheduled to be released on June 11, 2025, at 8:30AM-ET. REF: BLS, BLS.GOV
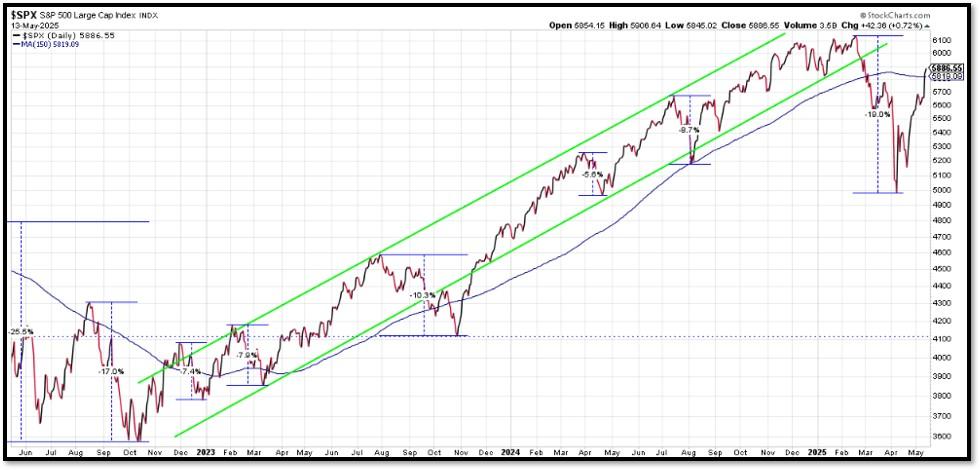
5L. Technical Analysis of the S&P500 Index. Click onto reference links below for images.
- Short-term Chart: Trend Bearish to Bullish on 5/13/2025 – REF: Short-term S&P500 Chart by Marc Slavin (Click Here to Access Chart)
- Medium-term Chart: Trend Bearish to Rising on 5/13/2025 – REF: Medium-term S&P500 Chart by Marc Slavin (Click Here to Access Chart)
- Market Timing Indicators – S&P500 Index as of 5/13/2025 – REF: S&P500 Charts (7 of them) by Joanne Klein’s Top 7 (Click Here to Access Updated Charts)
- A well-defined uptrend channel shown in green with S&P500 broke away from the uptrend. REF: Stockcharts
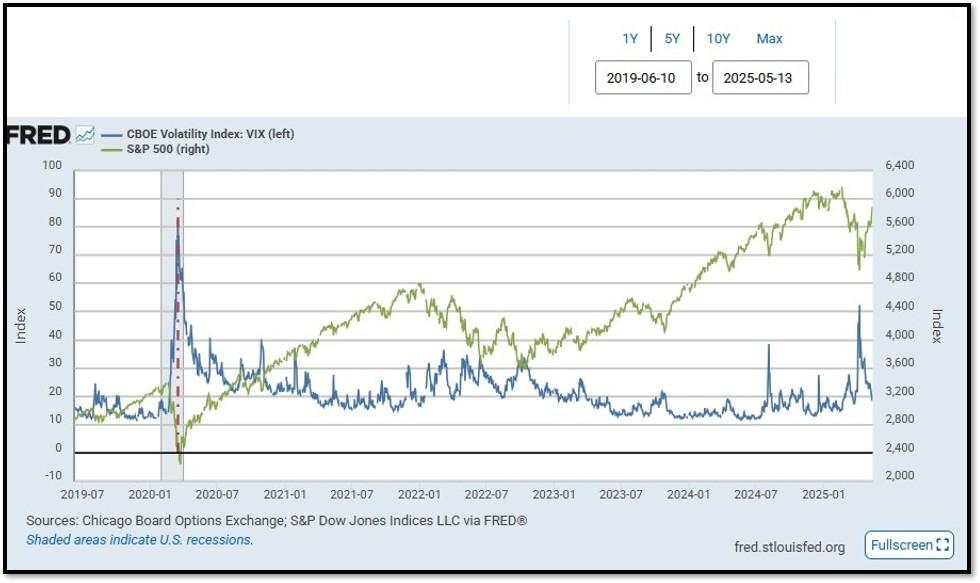
- S&P500 and CBOE Volatility Index (VIX) as of 5/13/2025. REF: FRED, Today’s Print
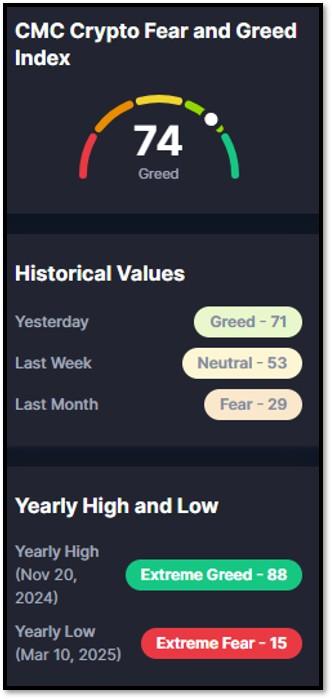
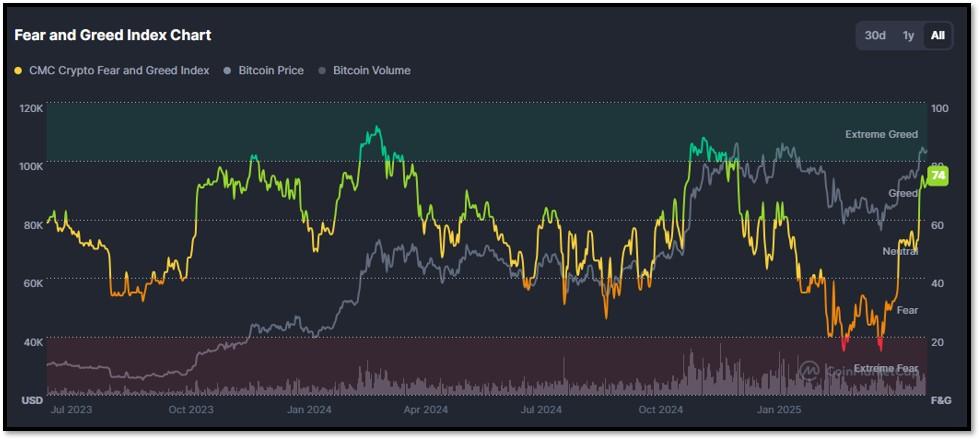
5M. Most recent read on the Crypto Fear & Greed Index with data as of 5/13/2025 is 74 (Greed). Last week’s data was 53 (Neutral) (1-100). Fear & Greed Index – A Contrarian Data. The crypto market behavior is very emotional. People tend to get greedy when the market is rising which results in FOMO (Fear of missing out). Also, people often sell their coins in irrational reaction of seeing red numbers. With the Crypto Fear and Greed Index, the data try to help save investors from their own emotional overreactions. There are two simple assumptions:
- Extreme fear can be a sign that investors are too worried. That could be a buying opportunity.
- When Investors are getting too greedy, that means the market is due for a correction.
Therefore, the program for this index analyzes the current sentiment of the Bitcoin market and crunch the numbers into a simple meter from 0 to 100. Zero means “Extreme Fear”, while 100 means “Extreme Greed”. REF: Coinmarketcap.com, Today’sReading
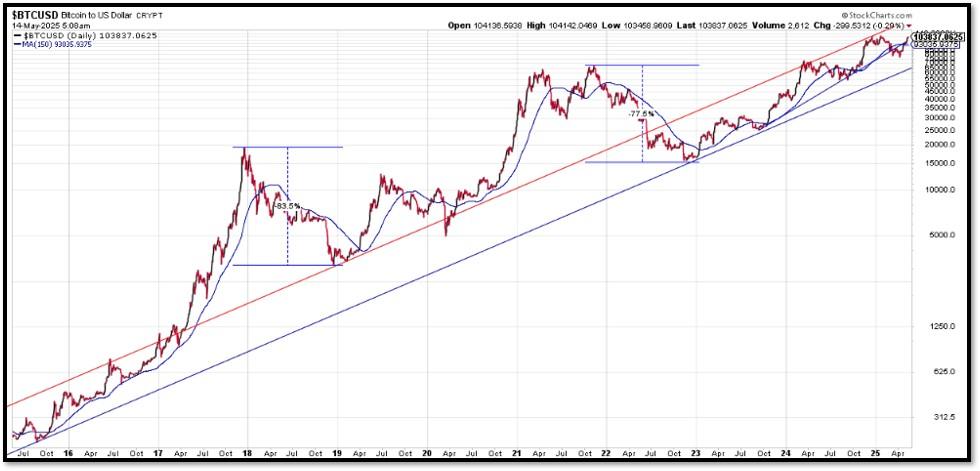
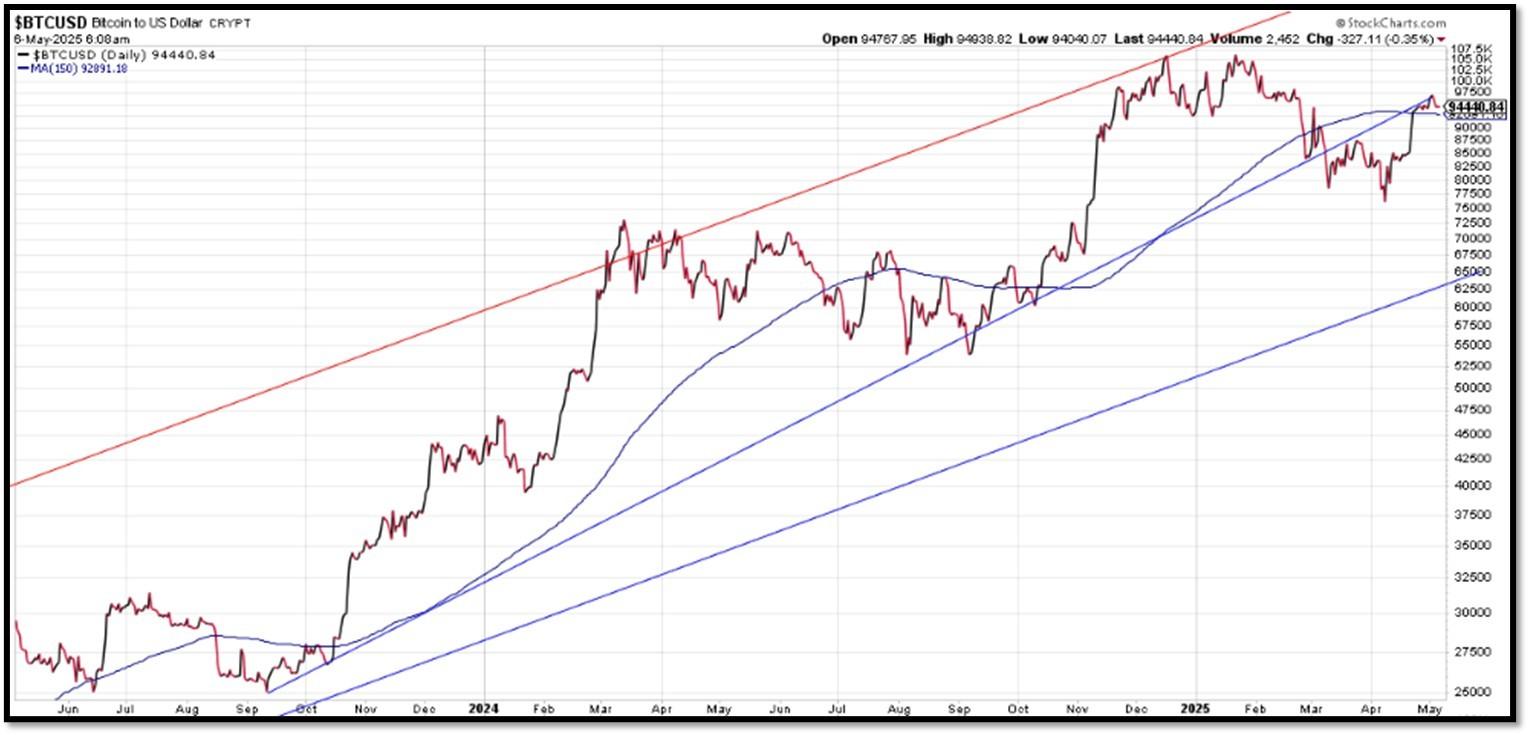
Bitcoin – 10-Year & 2-Year Charts. REF: Stockcharts10Y, Stockcharts2Y
From the desk of our Chief Investment Officer
As an investment professional with over twenty-six years of experience in the financial services industry, Andrew helps clients to protect, grow and transfer wealth during their lifetime with objective, unbiased, customized and efficient strategies.
Education, Professional Licenses Acquired & Affiliations
- Passed the Series 7, 63, 65 and 24 license examinations
- Currently holding Series 65 License
- BA in Economics – Boston University (Boston, MA) 1993
- Certificate in Commodities Trading – New York University (New York, NY) 1991
- Certificate in Financial Planning – New York University (New York, NY) April 2011
With extensive experience in the Financial Services Industry, Andrew Tang and Turner Financial Group provides disciplined wealth management with an intelligent caring approach to each and every client that compliments the Dedicated Financial offering.


Len writes much of his own content, and also shares helpful content from other trusted providers like Turner Financial Group (TFG).
The material contained herein is intended as a general market commentary, solely for informational purposes and is not intended to make an offer or solicitation for the sale or purchase of any securities. Such views are subject to change at any time without notice due to changes in market or economic conditions and may not necessarily come to pass. This information is not intended as a specific offer of investment services by Dedicated Financial and Turner Financial Group, Inc.
Dedicated Financial and Turner Financial Group, Inc., do not provide tax, legal or accounting advice. You should consult your own tax, legal and accounting advisors before engaging in any transaction.
Any hyperlinks in this document that connect to Web Sites maintained by third parties are provided for convenience only. Turner Financial Group, Inc. has not verified the accuracy of any information contained within the links and the provision of such links does not constitute a recommendation or endorsement of the company or the content by Dedicated Financial or Turner Financial Group, Inc. The prices/quotes/statistics referenced herein have been obtained from sources verified to be reliable for their accuracy or completeness and may be subject to change.
Past performance is no guarantee of future returns. Investing involves risk and possible loss of principal capital. The views and strategies described herein may not be suitable for all investors. To the extent referenced herein, real estate, hedge funds, and other private investments can present significant risks, including loss of the original amount invested. All indexes are unmanaged, and an individual cannot invest directly in an index. Index returns do not include fees or expenses.
Turner Financial Group, Inc. is an Investment Adviser registered with the United States Securities and Exchange Commission however, such registration does not imply a certain level of skill or training and no inference to the contrary should be made. Additional information about Turner Financial Group, Inc. is also available at www.adviserinfo.sec.gov. Advisory services are only offered to clients or prospective clients where Turner Financial Group, Inc. and its representatives are properly licensed or exempt from licensure. No advice may be rendered by Turner Financial Group, Inc. unless a client service agreement is in place.


