

- 1. The United States government shutdown began October 1, 2025.
- 2. Main story this week focuses on defining the Stages of AI Growth.
- 3. Convertible securities funds, which invest in diversified portfolios of convertible bonds and preferred stocks, can enhance the role of bonds in low-beta buckets by offering equity-like returns with reduced volatility.
- 4. World Watch
- 4A. In a dramatic diplomatic breakthrough, U.S. President Donald Trump brokered a cease-fire between Israel and Hamas during a high-stakes summit in Sharm El-Sheikh, Egypt; joined by key mediators from Egypt, Qatar, and Turkey.
- 4B. President Trump has reignited tensions with Beijing by threatening to impose a 100 percent tariff on all Chinese imports, escalating a new chapter in the ongoing trade confrontation.
- 4C. An updated snapshot of the current global state of economy.
- 5. Quant & Technical Corner – A selection of quantitative & technical data we monitor on a regular basis to help gauge the overall financial market conditions and the investment environment.
1. The United States government shutdown began October 1, 2025.
It disrupted agencies like the Bureau of Labor Statistics and Bureau of Economic Analysis. Most economic data releases for October 13 to 17 are delayed. This includes the Consumer Price Index, set for October 24. Other delayed reports are Producer Price Index, Retail Sales, Jobless Claims, Import and Export Prices, and Housing Starts. Markets and the Federal Reserve rely on limited private data. The shutdown causes a 15-billion-dollar weekly GDP drag. Senate talks remain stalled.
The $50 to 53 billion Gaza rebuilding effort over ten years could boost global economic growth. It will fund infrastructure, housing, and green technologies. This creates jobs and increases demand for materials and logistics worldwide. Gaza could become a Mediterranean trade hub with ports, airports, and gas fields. This may raise Middle East North Africa GDP by 1 to 3 percent through trade corridors like the Abrahamic Infrastructure Corridor. It could also ease Suez Canal disruptions. The United States could see a $2 to 5 billion GDP gain from equipment exports, engineering contracts, and USAID projects. This is offset by $5 to 7.5 billion in aid. Rebuilding may stabilize energy markets and enhance United States trade partnerships.
Click onto picture below to access video. REF: Worldbank, UN

2. Main story this week focuses on defining the Stages of AI Growth.
- Memorizing AI: This refers to early AI systems that rely heavily on storing and retrieving data or patterns, such as rule-based systems or simple machine learning models trained on fixed datasets. These systems excel at tasks like pattern recognition or lookup (e.g., early chatbots, basic recommendation systems). They lack adaptability beyond their training data and have limited reasoning or contextual understanding. (early 2000s–2010s): Rule-based systems, basic ML (For example: spam filters).
- Generalizing AI: This stage involves AI systems that can extrapolate from training data to handle new, unseen scenarios. Generalization is a hallmark of modern machine learning, particularly in models like neural networks used for image recognition or natural language processing (For example: early GPT models). These systems infer patterns and apply them broadly but still operate within predefined tasks and lack true autonomy. (2010s–early 2020s): Deep learning, early LLMs (For example: BERT, GPT-3).
- Research AI: This phase describes AI capable of conducting or assisting with research, such as analyzing large datasets, synthesizing information, or generating hypotheses. Research AI often integrates with human workflows, providing insights or automating parts of the scientific process (e.g., AlphaFold solving protein folding). It requires advanced reasoning and data processing but is typically task-specific and human-directed. (mid-2010s–2020s): Specialized AI for science (For example: AlphaFold, IBM Watson).
- Tool Use AI: This stage involves AI systems that can interact with external tools or environments to accomplish tasks, such as APIs, software, or physical systems. Examples include AI that automates workflows by calling code interpreters, web browsers, or robotic interfaces. Tool use requires planning and integration but may not involve full autonomy or goal-setting. (2020s): AI with external integrations. (For example: ChatGPT plugins, code interpreters).
- Thinking AI: This refers to AI with advanced reasoning capabilities, capable of complex problem-solving, introspection, and abstract thought. Thinking AI approaches human-like cognition, potentially including self-reflection or the ability to tackle novel problems without explicit programming (e.g., advanced reasoning in models like o1 by OpenAI). It’s a step toward general intelligence but may still lack full autonomy. (mid-2020s): Advanced reasoning models (For example: OpenAI’s o1, DeepMind’s AlphaCode).
- Agentic AI: Emerges as a distinct phase because it shifts from task-specific intelligence to systems that can independently navigate complex, real-world scenarios. For example, xAI’s Macrohard project – envisions AI agents autonomously running a software company—coding, testing, and managing workflows without human developers. This requires integrating memorization (storing codebases), generalization (adapting to new software needs), research (exploring tech solutions), tool use (interfacing with compilers or cloud platforms), and thinking (planning project timelines). (late 2020s–2030s): Autonomous, goal-directed systems. (For example: xAI’s Macrohard agents, multi-agent frameworks).
- AGI (Speculative Future): Fully general, human-like intelligence. Artificial General Intelligence (AGI) refers to AI systems capable of performing any intellectual task that a human can do, with similar or superior proficiency across diverse domains. Unlike narrow AI, which excels at specific tasks (For example: image recognition), AGI can learn, reason, and adapt to new challenges in an open-ended, general manner, mimicking human-like cognitive flexibility. It represents a theoretical goal of AI development, not yet achieved, with potential to revolutionize fields but raising significant ethical and safety concerns.
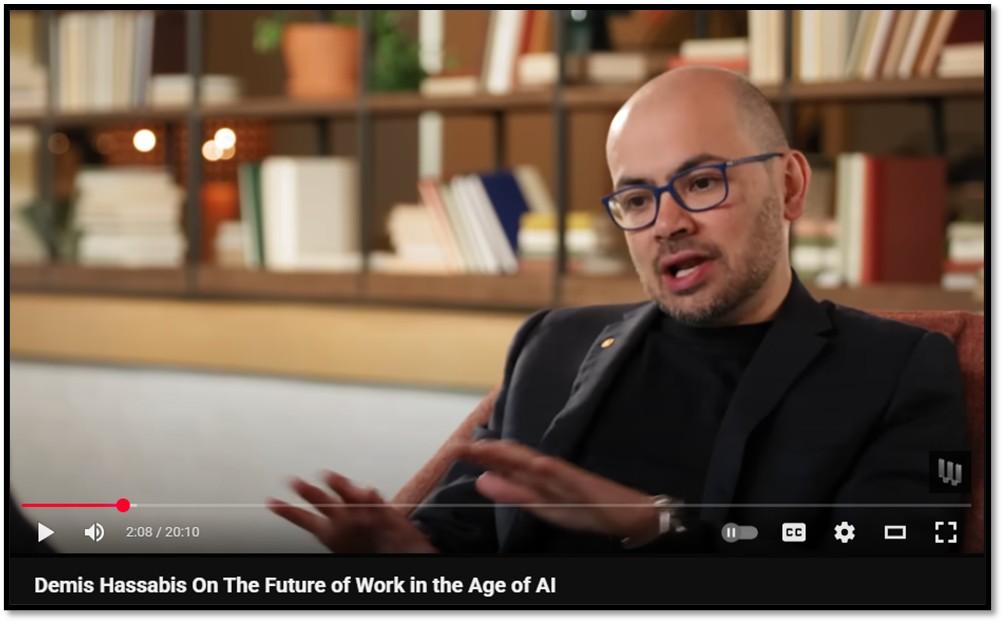
WIRED Editor At Large Steven Levy sits down with Google DeepMind CEO Demis Hassabis for a deep dive discussion on the emergence of AI, the path to Artificial General Intelligence (AGI), and how Google is positioning itself to compete in the future of the workplace. Click onto picture below to access video. REF: WIRED
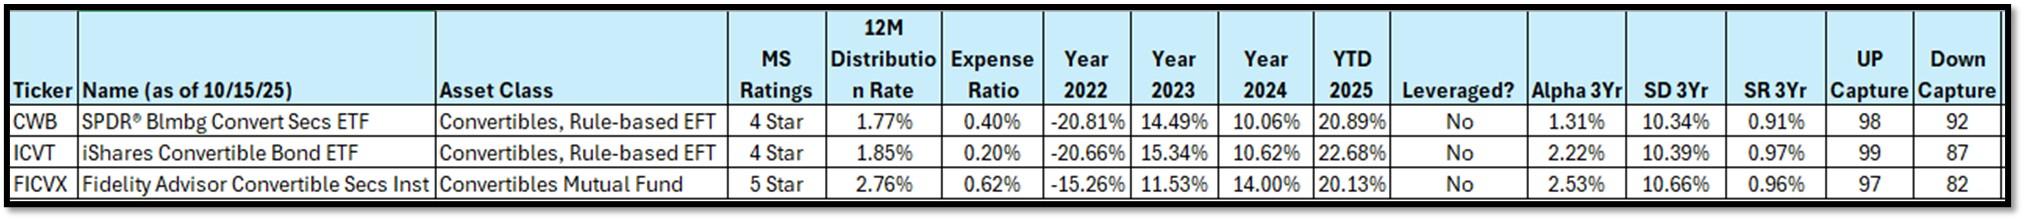
3. Convertible securities funds, which invest in diversified portfolios of convertible bonds and preferred stocks, can enhance the role of bonds in low-beta buckets by offering equity-like returns with reduced volatility.
These funds may provide downside protection through fixed-income characteristics, acting as a bond floor, while capturing stock market
upside via conversion options, making them less volatile than pure equities (For example: typical convertible fund beta of 0.5-0.7 vs. stocks’ 1.0). With at least three Federal Reserve rate cuts expected in 2026, convertibles can benefit from increased bond price appreciation in falling rate environments, as their embedded equity options amplify returns, making them a strategic addition to stabilize and diversify low-beta portion of portfolios.
However, convertible securities funds carry reinvestment risk if rates drop significantly, forcing reinvestment into lower-yielding securities, and may lag pure bonds in risk-off environments or during yield curve inversions. They also face equity market sensitivity, which can introduce moderate volatility. Still, in the current rate-cut cycle, these funds can enhance low-beta portion of the portfolios by balancing income, growth, and stability, but investors should consult a financial advisor to align with equity market trends and risk tolerance as this is not investment advice. I have included a few convertible securities funds for reference. RE: MorningStar, Convertibles Comparison
NOTE: Not investment advice or recommendations. Investors should carefully consider the investment objectives, risks, charges, and expenses before investing. For additional information about the securities mentioned above or in the videos, please visit the respective funds’ documents pages for the funds’ prospectus. Please read all materials carefully before investing.
CWB: https://www.ssga.com/us/en/intermediary/etfs/spdr-bloomberg-convertible-securities-etf-cwb
ICVT: https://www.ishares.com/us/products/272819/ishares-convertible-bond-etf
With the current macro-economic backdrop, below are areas we currently favor:
- Fixed Income – (Corporates & Muni) High Yield as Opportunistic Allocation (Low-Beta)
- Fixed Income – Short-term Corporates & Muni (Low-Beta)
- Businesses that contribute to and benefit from AI & Automation (Market-Risk)
- Fintech & Financials (Market-Risk)
- Digital Asset – Bitcoin (Market-Risk/Hedge)
- Neo-Cloud Computing (Market-Risk)
- India & China-Tech (Market-Risk)
- Cyber-Security & Software (Market-Risk)
- Quantum Computing (Market-Risk)
4. World Watch
4A. In a dramatic diplomatic breakthrough, U.S. President Donald Trump brokered a cease-fire between Israel and Hamas during a high-stakes summit in Sharm El-Sheikh, Egypt; joined by key mediators from Egypt, Qatar, and Turkey.
The agreement followed months of back-channel negotiations and culminated in the release of the last surviving Israeli hostages. Hamas had originally abducted 251 hostages during its October 7, 2023, assault on Israel. Under the cease-fire terms, 20 living hostages were released and returned to Israel, while 28 bodies of deceased hostages are being repatriated as part of the humanitarian exchange. In return, Israel freed nearly 2,000 Palestinian prisoners, marking one of the largest swaps in decades. The accord, signed under Trump’s direct supervision, is being hailed as a tentative first step toward ending two years of devastating conflict in Gaza. It forms part of Trump’s broader 20-point peace plan, which envisions demilitarization of Gaza, regional reconstruction partnerships, and a long-term economic framework aimed at preventing future violence.
By taking center stage among world leaders, Trump sought to reposition himself as a global statesman capable of navigating the Middle East’s most entrenched conflicts. At the summit, he issued a pointed warning that Hamas must fully disarm, or face renewed international pressure, urging neighboring Arab states to “put aside decades of division” and unite behind a new regional security architecture. Although Israeli Prime Minister Benjamin Netanyahu was notably absent, Trump proclaimed the accord a “historic dawn for peace,” emphasizing America’s role as a stabilizing force. Yet analysts remain skeptical. The agreement lacks clear enforcement mechanisms, Hamas did not formally sign the document, and critical issues—such as Gaza’s future governance and the role of Iran-backed militias—remain unresolved. As such, while the Egypt summit underscored Trump’s ability to command global attention, it also highlighted the fragile and uncertain nature of the peace that now hangs over the region. Click onto pictures below to access videos. REF: WSJ, CNBC

The President reversed the Biden administration’s approach by prioritizing Israel’s security above all else. The agreement aims to fulfill Israel’s core war objectives: disarming Hamas, demilitarizing Gaza, and ensuring that Hamas neither governs the territory nor poses any future threat to Israel’s safety.

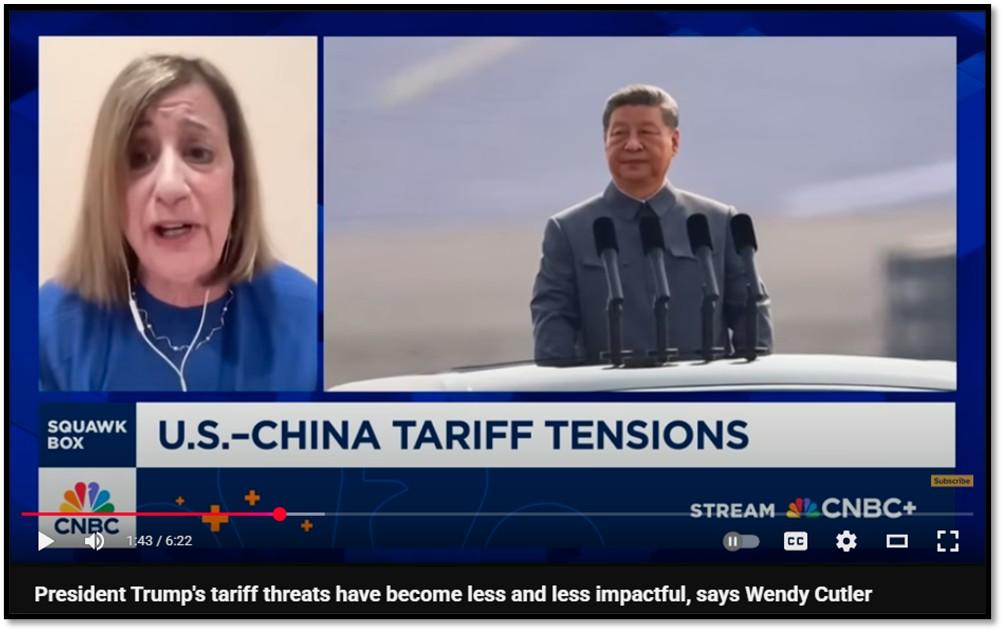
4B. President Trump has reignited tensions with Beijing by threatening to impose a 100 percent tariff on all Chinese imports, escalating a new chapter in the ongoing trade confrontation.
The move followed China’s decision to tighten export controls on rare earth minerals and advanced technologies, which it framed as necessary for national security. Washington, however, saw the restrictions as a strategic effort to weaken U.S. manufacturing and disrupt supply chains. Trump’s response represents a firmer stance in trade policy, underscoring his willingness to use tariffs as a bargaining tool to push China toward concessions on technology transfers, manufacturing practices, and currency policies.
China swiftly condemned the tariff threats, warning they would trigger countermeasures and destabilize global commerce. In response, Beijing introduced new port fees on U.S. vessels and hinted at limits on agricultural imports. Behind closed doors, U.S. Trade Representative Jamieson Greer suggested the timing of the new tariffs, tentatively scheduled for November 1, depends on China’s willingness to negotiate in good faith. Analysts see the standoff as a test of leverage between two economic giants: China holds dominance in rare earth production, while the United States wields its market access as pressure. Yet despite the sharp rhetoric, Trump’s repeated tariff threats appear to be losing impact, as both markets and policymakers have grown accustomed to his negotiating style—blunting the immediate shock value such measures once carried. Click onto picture below to access video. REF: BARRON’S, CNBC
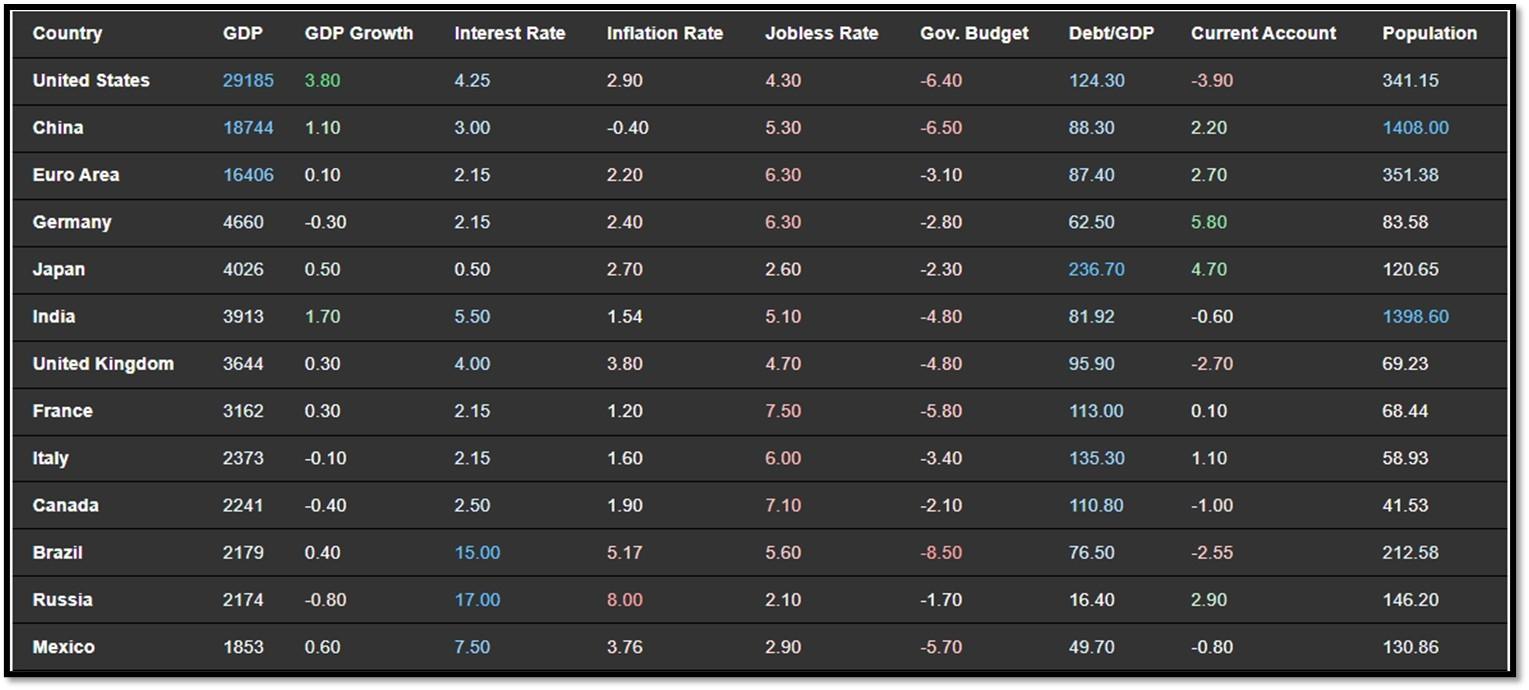
4C. An updated snapshot of the current global state of economy.
According to TradingEconomics as of 10/13/2025 (REF: TradingEconomics)
- India’s consumer price inflation eased to 1.54% in September 2025, down from 2.07% in August and below market expectations of 1.7%.
- Brazil’s annual inflation rate edged up to 5.17% in September 2025 from 5.13% in August, slightly below market expectations of 5.22%.
- The annual inflation rate in Russia fell for a sixth straight month to 8% in September 2025 from 8% in the previous month, the softest rate since April of 2024.
- Annual inflation in Mexico quickened for the second month to 3.76% in September 2025 from 3.57% in August, though staying comfortably within the central bank’s 2%–4% target.
5. Quant & Technical Corner – A selection of quantitative & technical data we monitor on a regular basis to help gauge the overall financial market conditions and the investment environment.
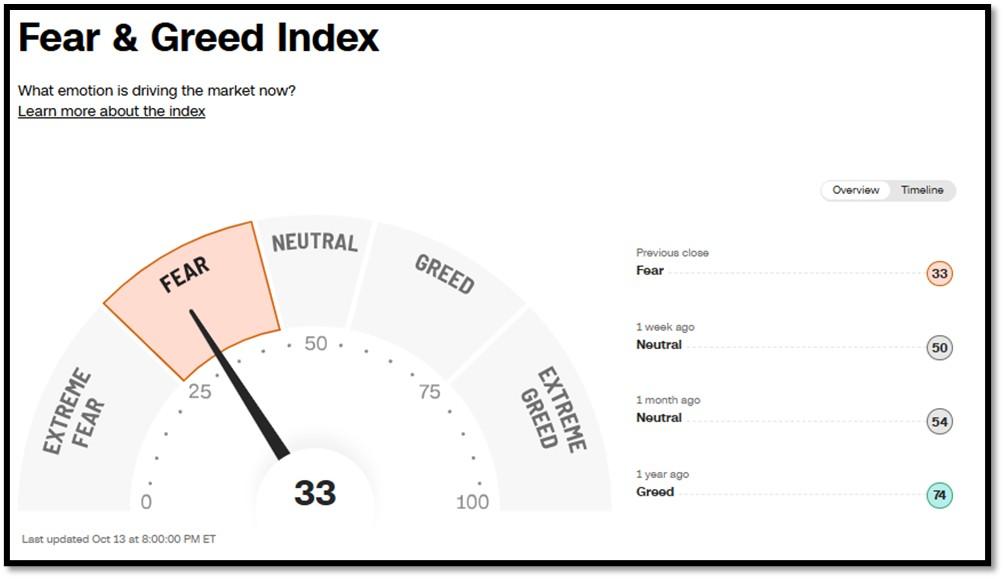
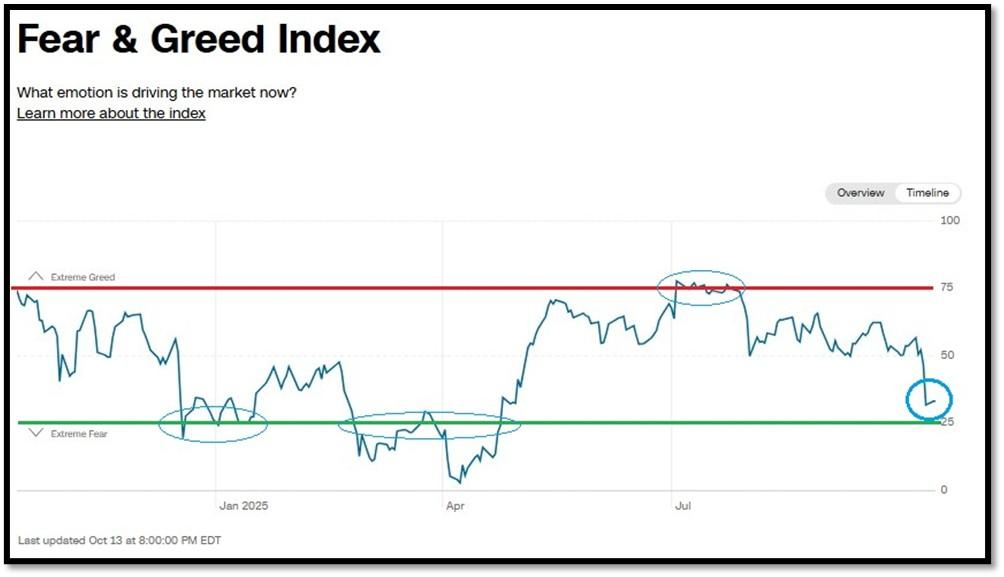
5A. Most recent read on the Fear & Greed Index with data as of 10/13/2025 – 8:00 PM-ET is 33 (Fear). Last week’s data was 50 (Neutral) (1-100). CNNMoney’s Fear & Greed index looks at 7 indicators (Stock Price Momentum, Stock Price Strength, Stock Price Breadth, Put and Call Options, Junk Bond Demand, Market Volatility, and Safe Haven Demand). Keep in mind this is a contrarian indicator! REF: Fear&Greed via CNNMoney
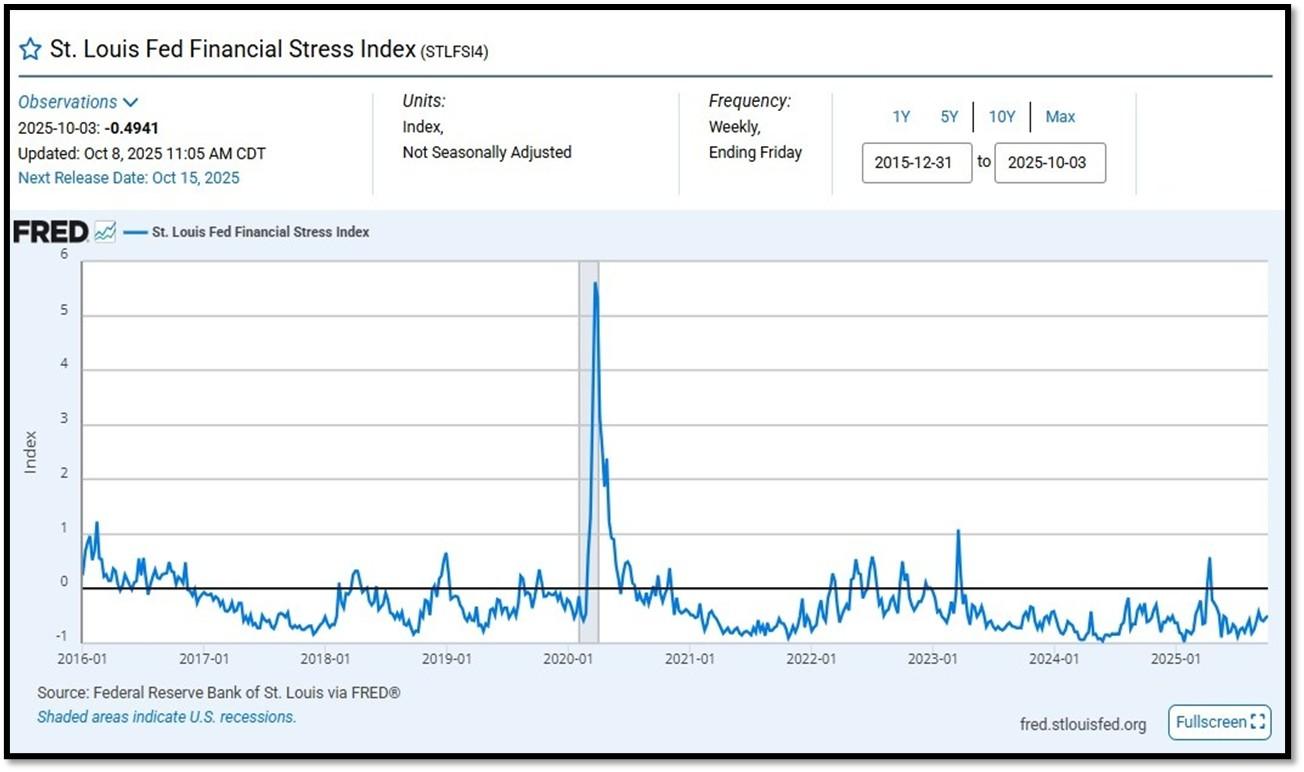
5B. St. Louis Fed Financial Stress Index’s (STLFSI4) most recent read is at –0.4941 as of October 8, 2025. Previous week’s data was -0.5340. A big spike up from previous readings reflecting the turmoil in the banking sector back in 2023. This weekly index is not seasonally adjusted. The STLFSI4 measures the degree of financial stress in the markets and is constructed from 18 weekly data series: seven interest rate series, six yield spreads and five other indicators. Each of these variables captures some aspect of financial stress. Accordingly, as the level of financial stress in the economy changes, the data series are likely to move together. REF: St. Louis Fed
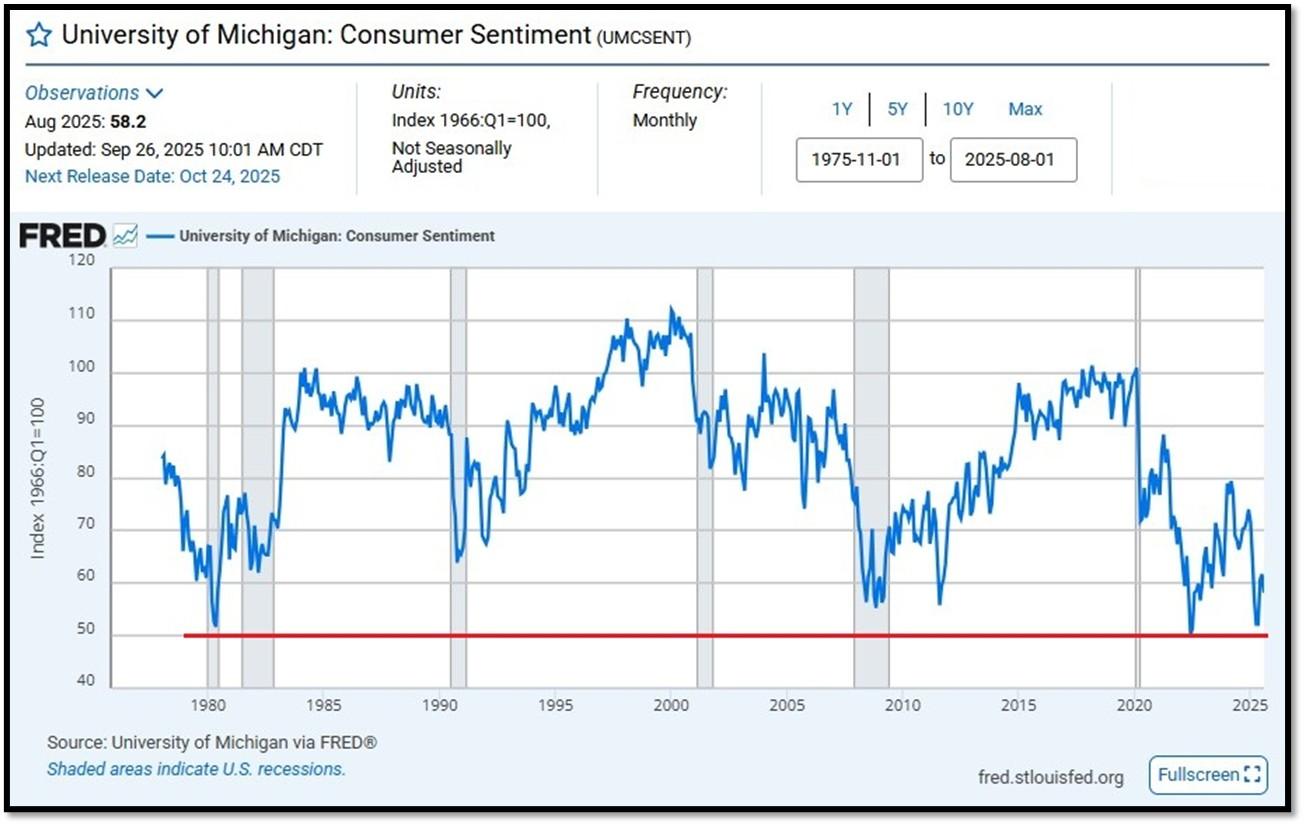
5C. University of Michigan, University of Michigan: Consumer Sentiment [UMCSEMT] for August at 58.2, retrieved from FRED, Federal Reserve Bank of St. Louis, September 26, 2025. Back in June 2022, Consumer Sentiment hit a low point going back to April 1980. REF: UofM
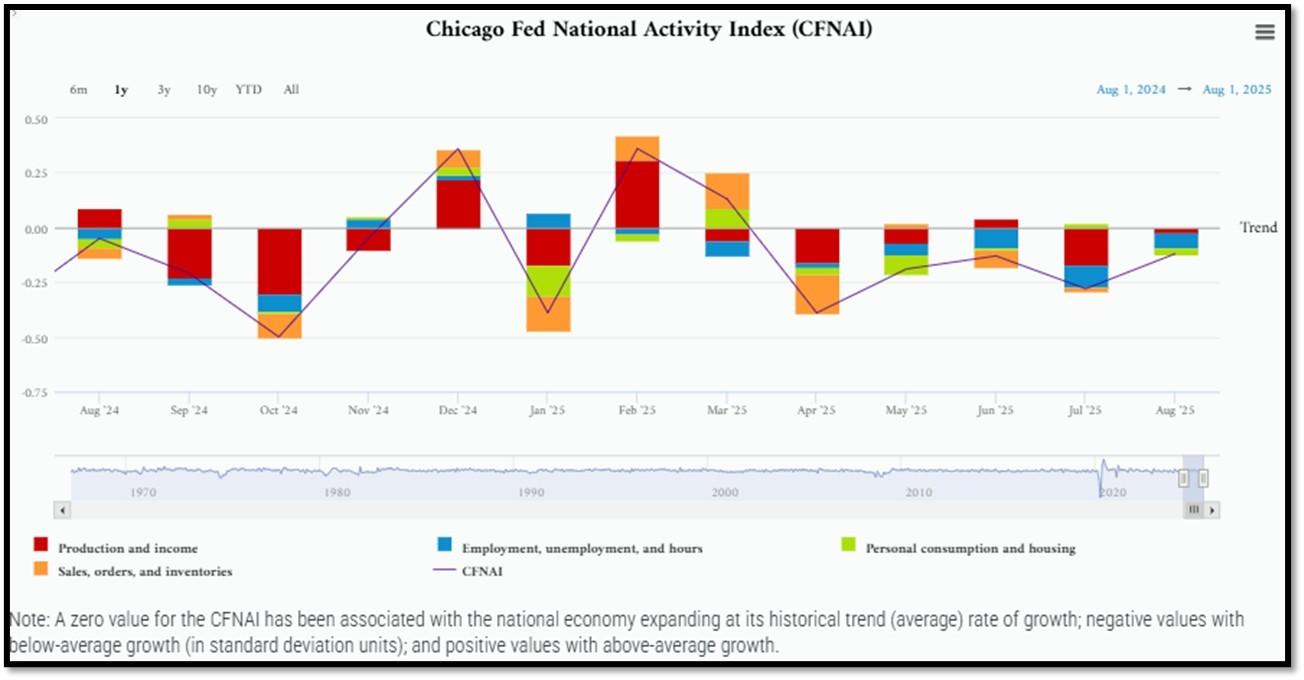
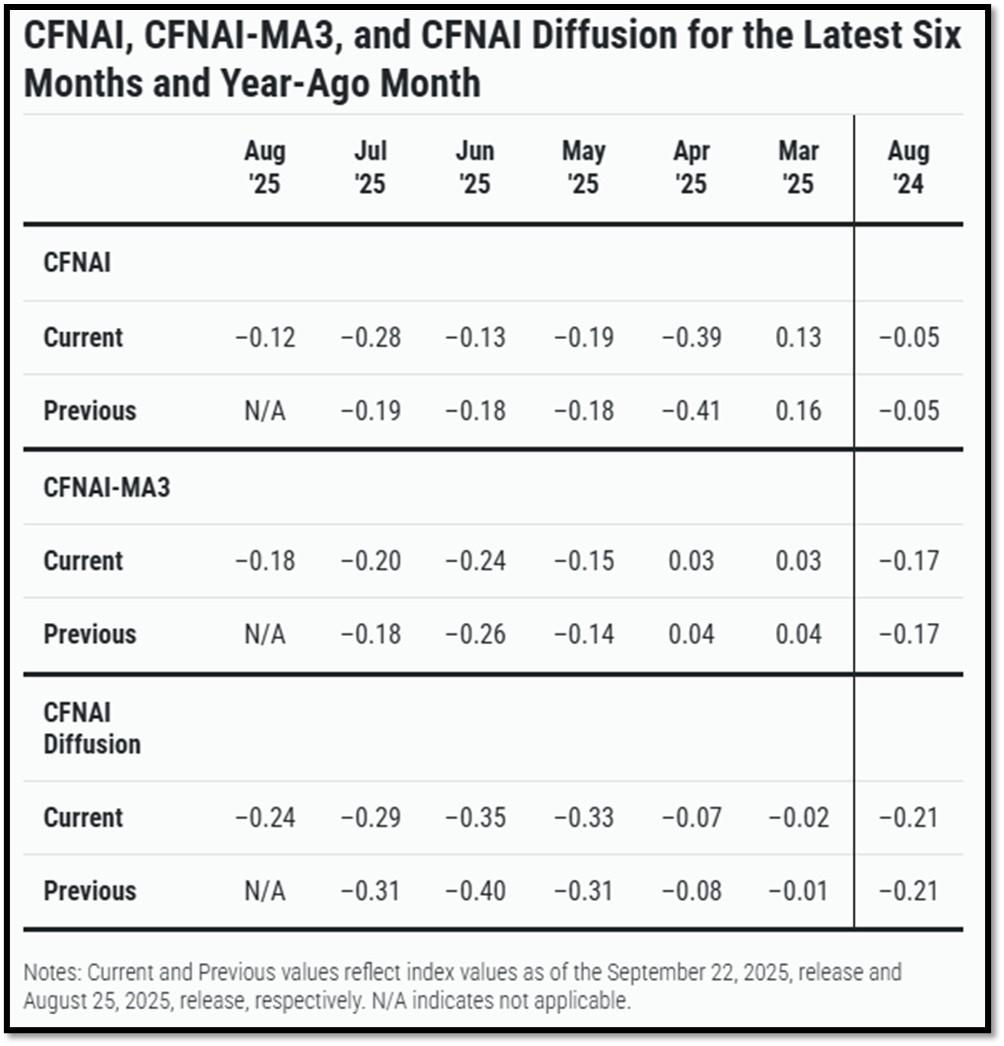
5D. The Chicago Fed National Activity Index (CFNAI) increased to –0.12 in August from –0.28 in July. Three of the four broad categories of indicators used to construct the index increased from July, but three categories made negative contributions in August. The index’s three-month moving average, CFNAI-MA3, increased to –0.18 in August from –0.20 in July. REF: ChicagoFed, August’s Report
5E. (9/18/2025) The Conference Board Leading Economic Index (LEI) for the US declined by 0.5% in August 2025 to 98.4 (2016=100), after a small 0.1% increase in July (upwardly revised from an originally reported 0.1% decline). The LEI fell by 2.8% over the six months between February and August 2025, a faster rate of decline than its 0.9% contraction over the previous six-month period (August 2024 to February 2025). The composite economic indexes are the key elements in an analytic system designed to signal peaks and troughs in the business cycle. The indexes are constructed to summarize and reveal common turning points in the economy in a clearer and more convincing manner than any individual component. The CEI is highly correlated with real GDP. The LEI is a predictive variable that anticipates (or “leads”) turning points in the business cycle by around 7 months. Shaded areas denote recession periods or economic contractions. The dates above the shaded areas show the chronology of peaks and troughs in the business cycle. The ten components of The Conference Board Leading Economic Index® for the U.S. include: Average weekly hours in manufacturing; Average weekly initial claims for unemployment insurance; Manufacturers’ new orders for consumer goods and materials; ISM® Index of New Orders; Manufacturers’ new orders for nondefense capital goods excluding aircraft orders; Building permits for new private housing units; S&P 500® Index of Stock Prices; Leading Credit Index™; Interest rate spread (10-year Treasury bonds less federal funds rate); Average consumer expectations for business conditions. REF: ConferenceBoard, LEI Report for August (ReceesionAlert) (Released on 9/30/2025)
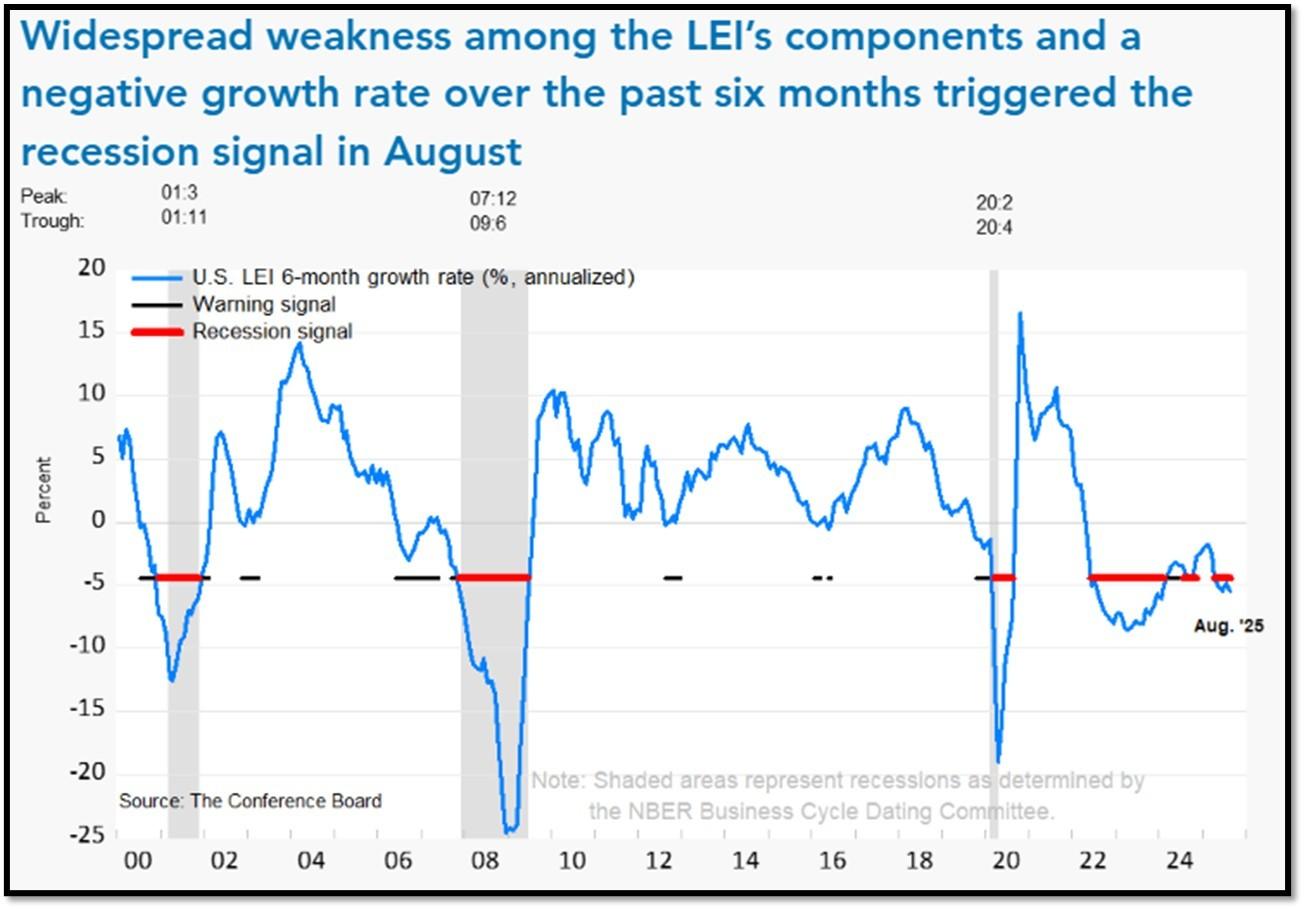
We have experienced a “rolling recession” since June 2022 and are only now emerging from it. However, authorities are not labeling it a recession due to high employment data from June 2022-2025.
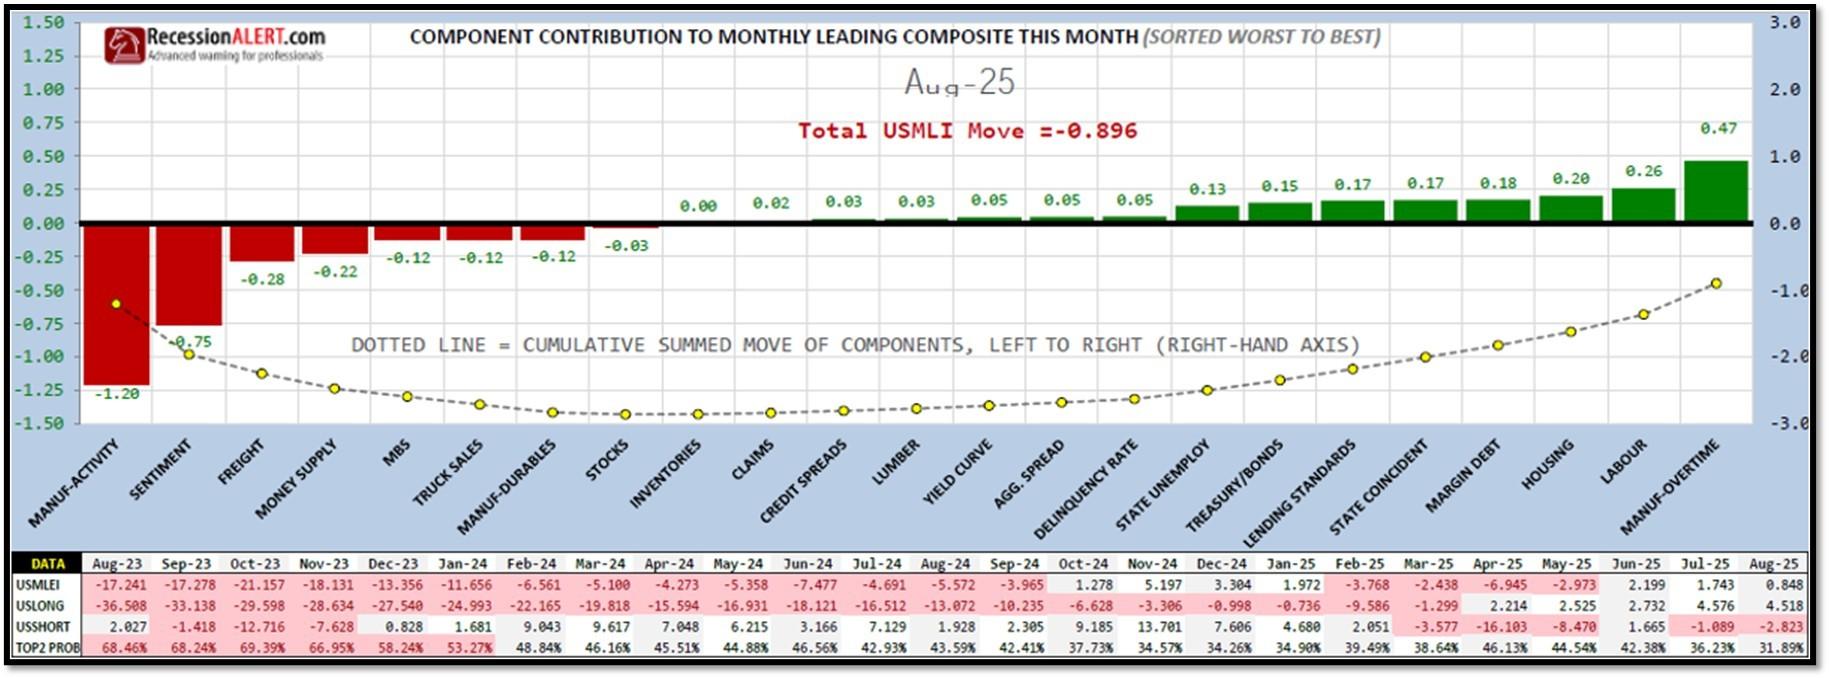
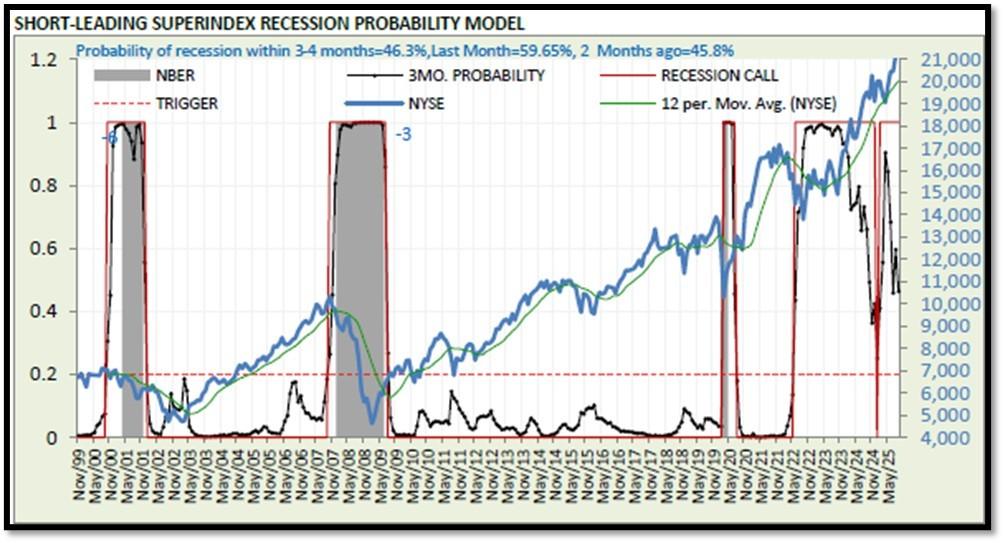
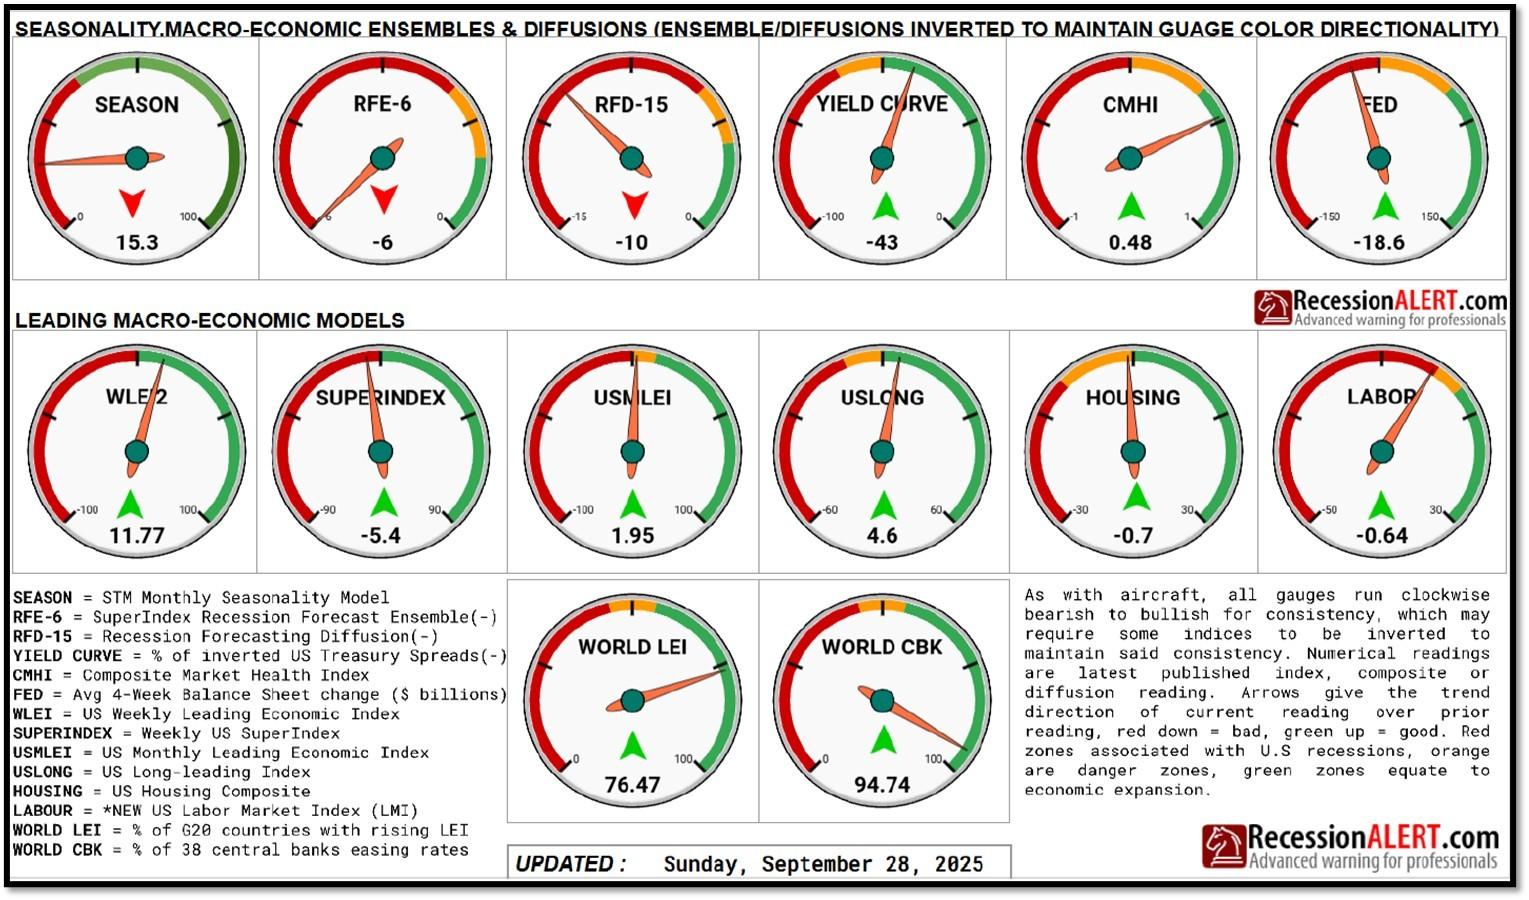
5F. Probability of U.S. falling into Recession within 3 to 4 months is currently at 46.3% (with data as of 09/28/2025 – Next Report 10/12/2025) according to RecessionAlert Research. Last release’s data was at 59.51%. This report is updated every two weeks. REF: RecessionAlertResearch
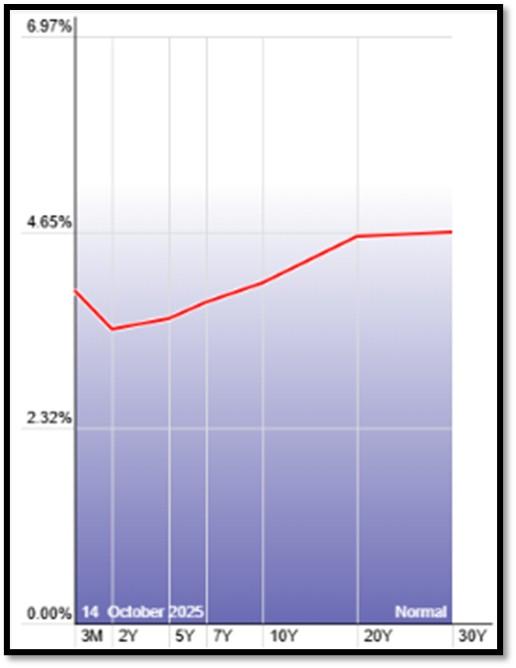
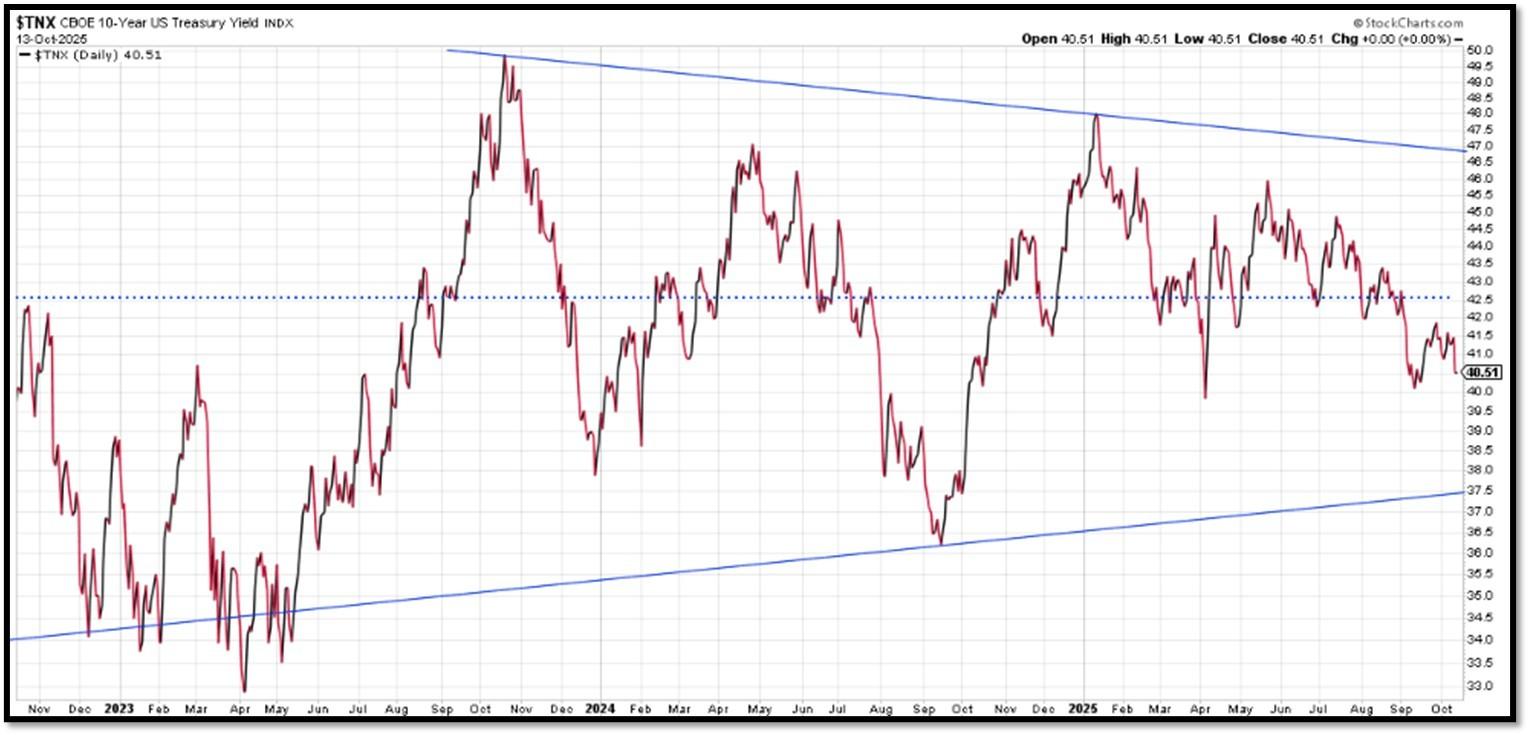
5G. Yield Curve as of 10/13/2025 is showing Normal. Spread on the 10-yr Treasury Yield (4.25%) minus yield on the 2-yr Treasury Yield (3.50%) is currently at 75bps. REF: Stockcharts The yield curve—specifically, the spread between the interest rates on the ten-year Treasury note and the three-month Treasury bill—is a valuable forecasting tool. It is simple to use and significantly outperforms other financial and macroeconomic indicators in predicting recessions two to six quarters ahead. REF: NYFED
5H. Recent Yields in 10-Year Government Bonds. REF: Source is from Bloomberg.com, dated 10/13/2025, rates shown below are as of 10/13/2025, subject to change.
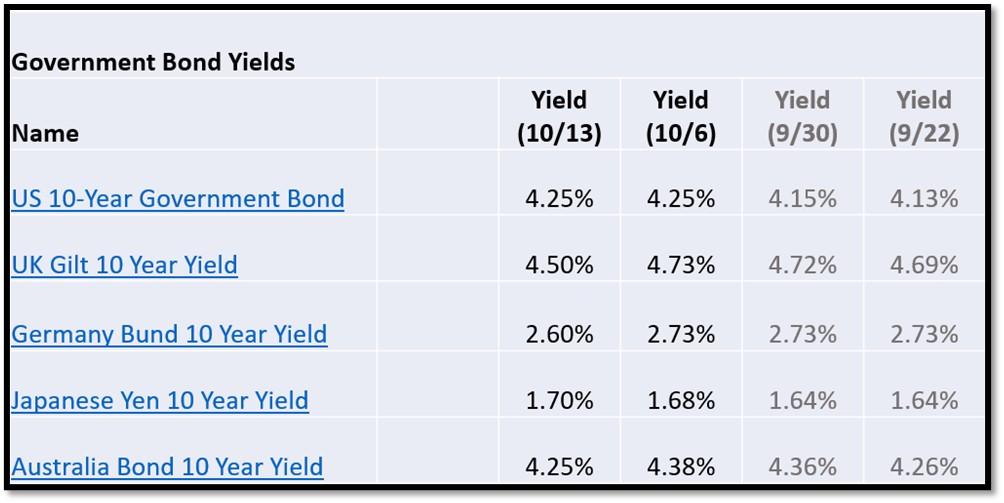
The 10-Year US Treasury Yield… The 10-Year Yield is indirectly related to inflation. I expect the 10-Year Yield to drop further as dis-inflation kicks in from the recent economic expansion from innovation. REF: StockCharts1
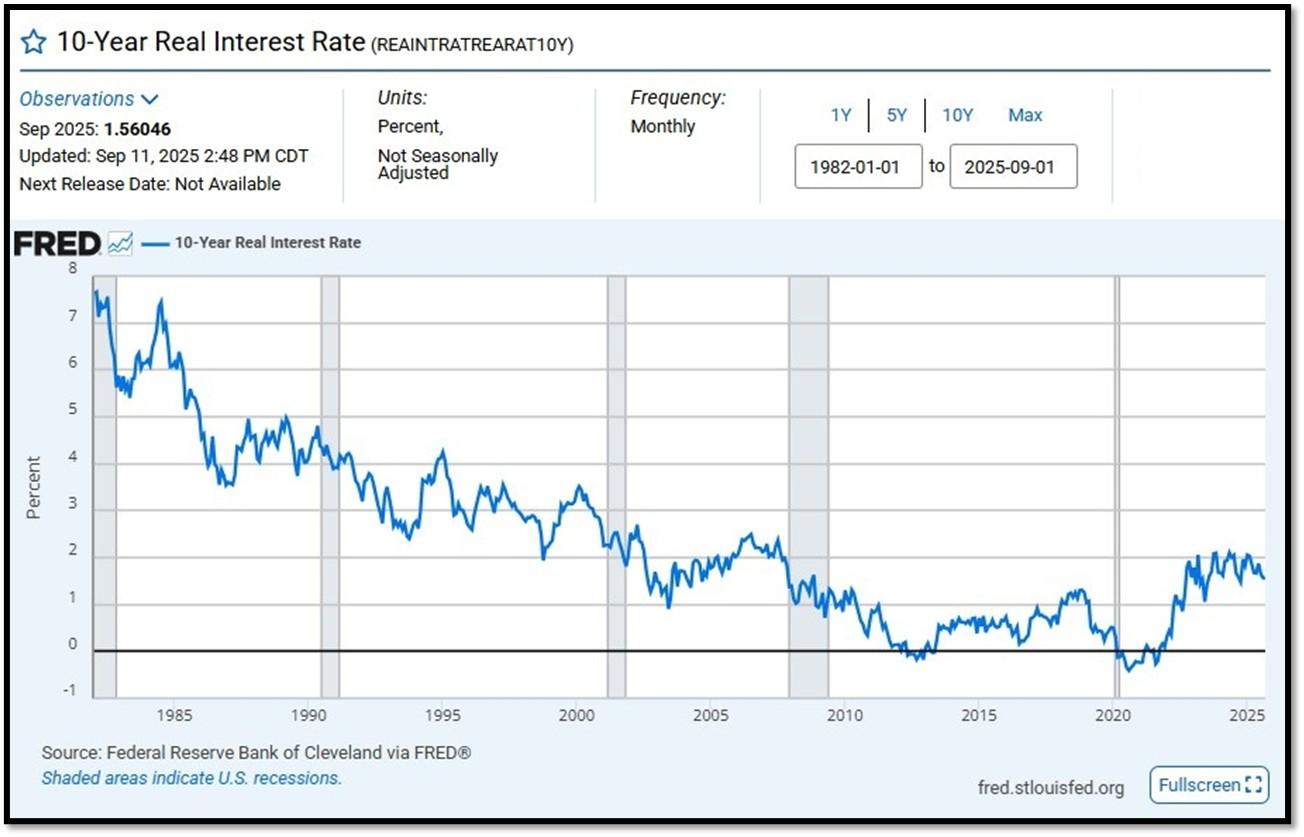
10-Year Real Interest Rate at 1.56046% as of 9/11/25. Last month’s data was 1.56633%. REF: REAINTRATREARAT10Y
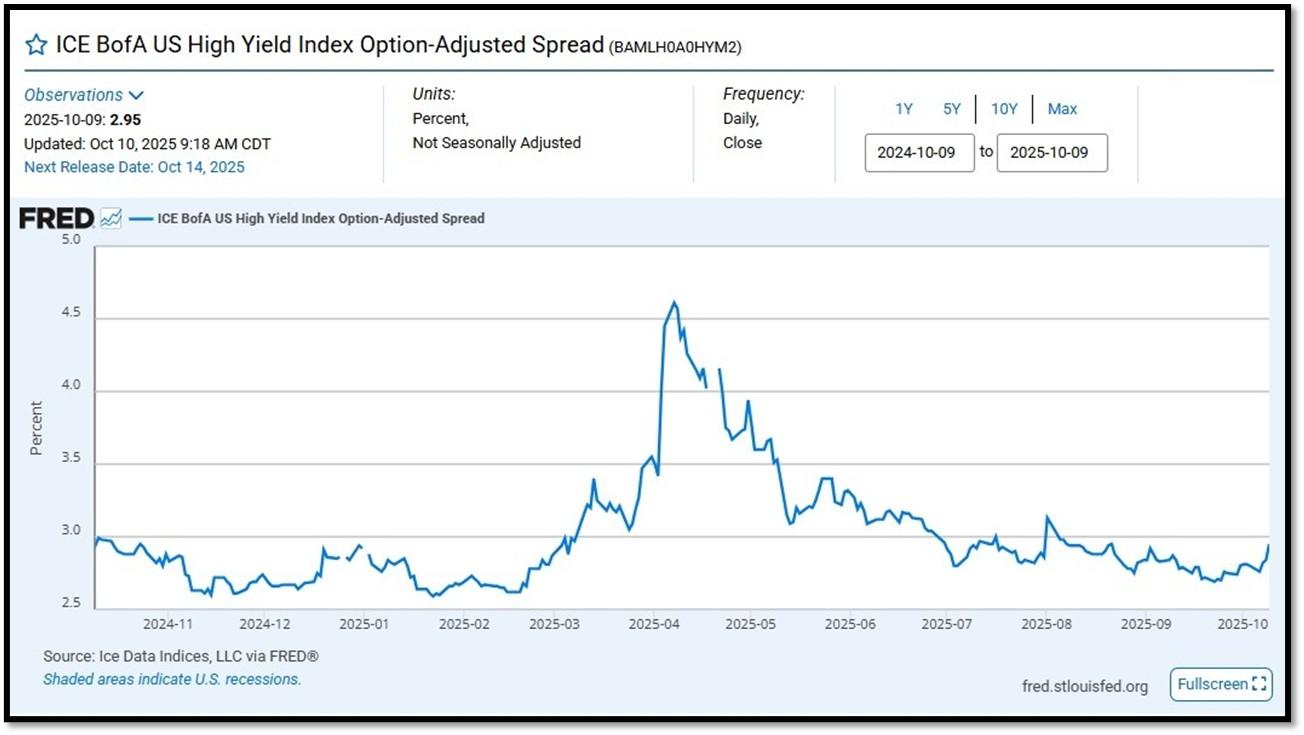
ICE BofA US High Yield Index Option-Adjusted Spread (BAMLH0A0HYM2) currently at 2.95 as of October 10, 2025. This is a key indicator of market sentiment, particularly regarding risk and economic health. At its core, the spread reflects the extra return investors demand to hold riskier corporate debt over safer government securities. High-yield bonds are issued by companies with lower credit ratings (below investment grade, like BB or lower), meaning they carry a higher chance of default. The spread compensates for this risk. When the spread is narrow—say, around 2.5% to 3%, as seen recently—it suggests investors are confident, willing to accept less extra yield because they perceive lower default risk or a strong economy. Narrow spreads often align with bullish markets, where cash is flowing, growth is steady, and fear is low. REF: FRED-BAMLH0A0HYM2
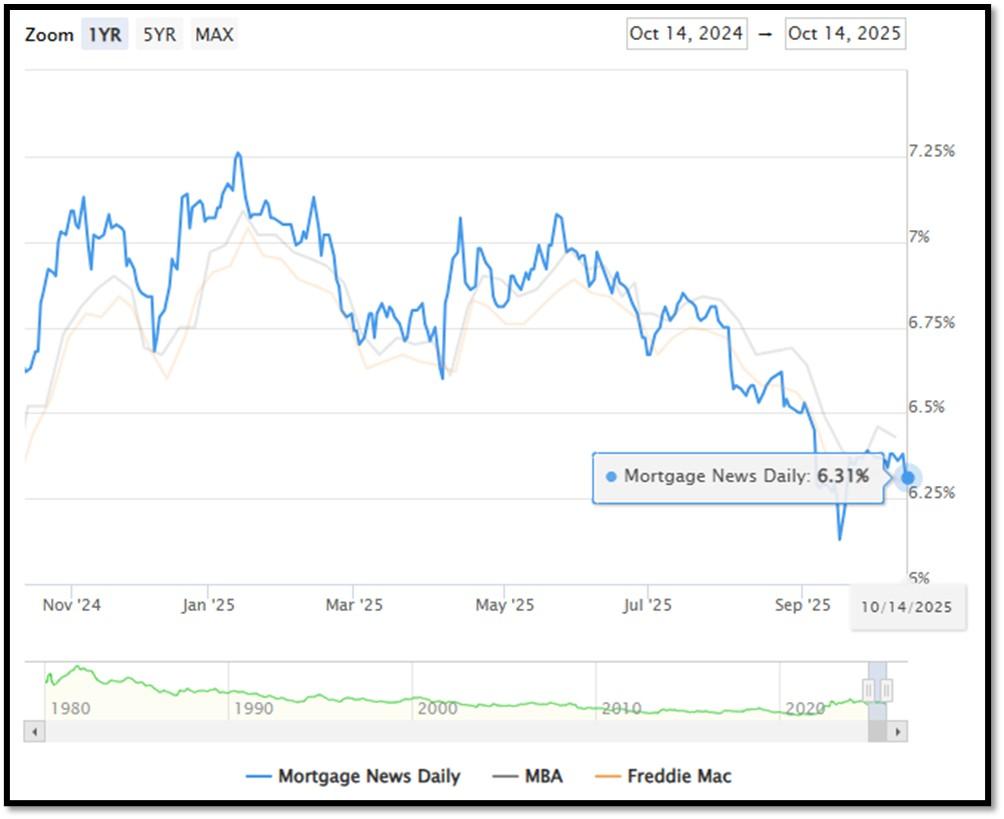
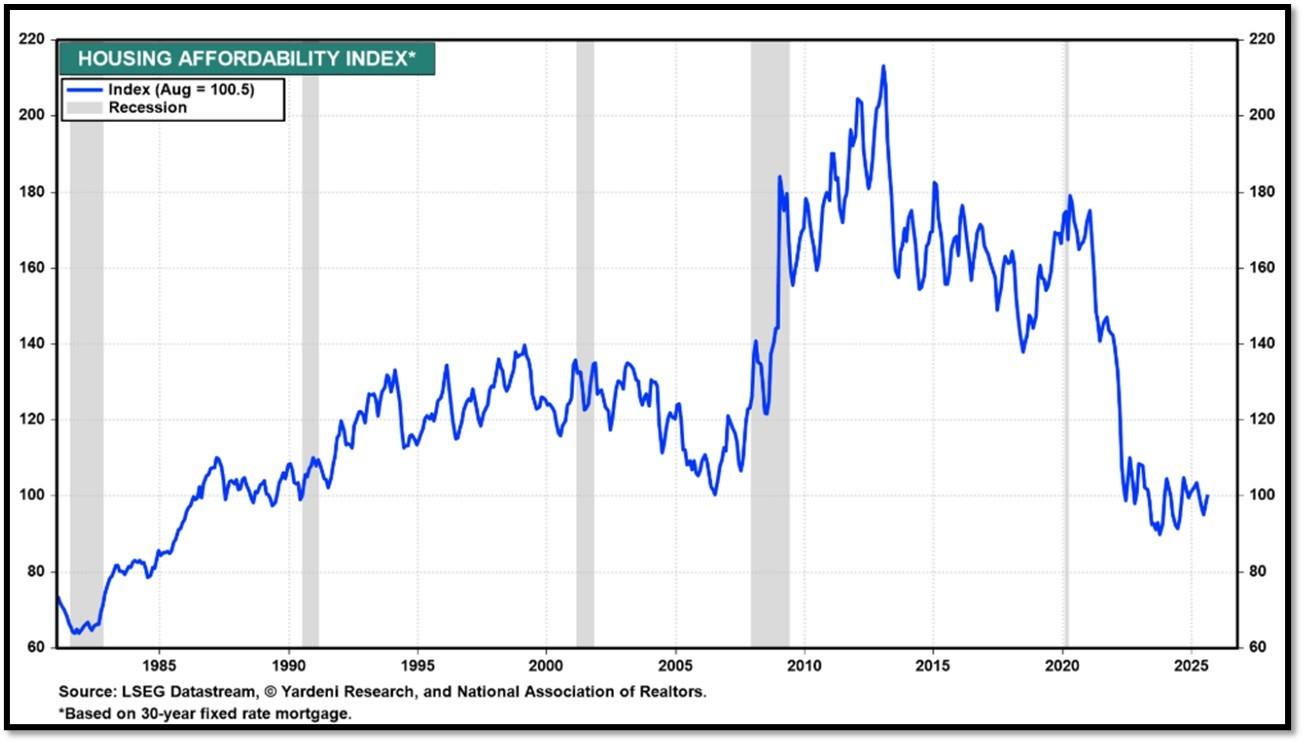
5I. (10/14/2025) Today’s National Average 30-Year Fixed Mortgage Rate is 6.31% (All Time High was 8.03% on 10/19/23). Last week’s data was 6.35%. This rate is the average 30-year fixed mortgage rates from several different surveys including Mortgage News Daily (daily index), Freddie Mac (weekly survey), Mortgage Bankers Association (weekly survey) and FHFA (monthly survey). REF: MortgageNewsDaily, Today’s Average Rate
The recent spike in the 30-year fixed-rate jumbo mortgage to 6.31%, compared to Freddie Mac’s rate at 6.30% and the Mortgage Bankers Association (MBA) rate at 6.43%, highlights key differences in the mortgage market. Jumbo mortgages, which exceed the conforming loan limits set by government agencies like Freddie Mac, typically carry higher interest rates because they are riskier for lenders. These loans are not backed by government entities, which increases the risk for lenders and, consequently, leads to higher rates. In contrast, Freddie Mac and MBA provide averages for conforming loans, which meet federal guidelines and have lower risk due to government backing, keeping their rates lower.
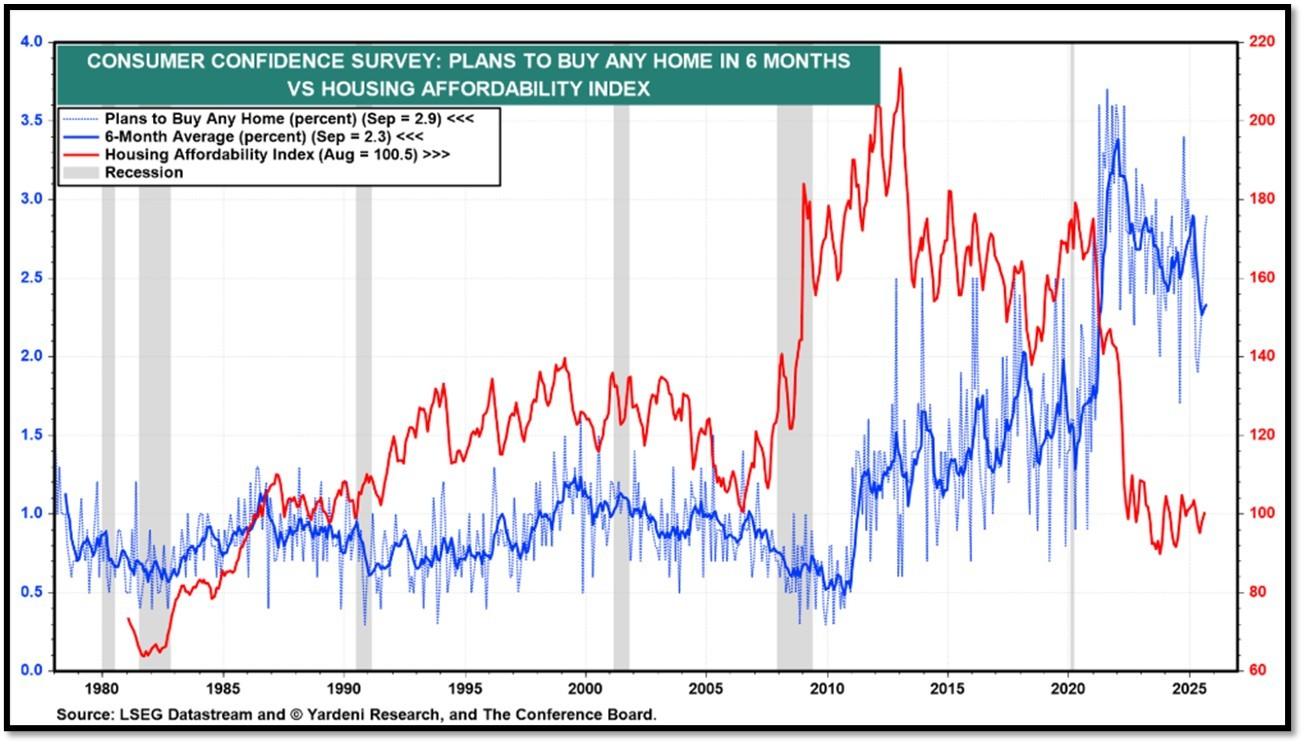
Housing Affordability Index for Aug = 100.5 // July = 98.8 // Jun = 94.4 // May = 97.2 // Apr = 101.0 // Mar = 103.2 // Feb = 102.2. Data provided by Yardeni Research. REF: Yardeni
5J. Velocity of M2 Money Stock (M2V) with current read at 1.392 as of (Q2-2025 updated September 25, 2025). Previous quarter’s data was 1.386. The velocity of money is the frequency at which one unit of currency is used to purchase domestically- produced goods and services within a given time period. In other words, it is the number of times one dollar is spent to buy goods and services per unit of time. If the velocity of money is increasing, then more transactions are occurring between individuals in an economy. Current Money Stock (M2) report can be viewed in the reference link. REF: St.LouisFed-M2V
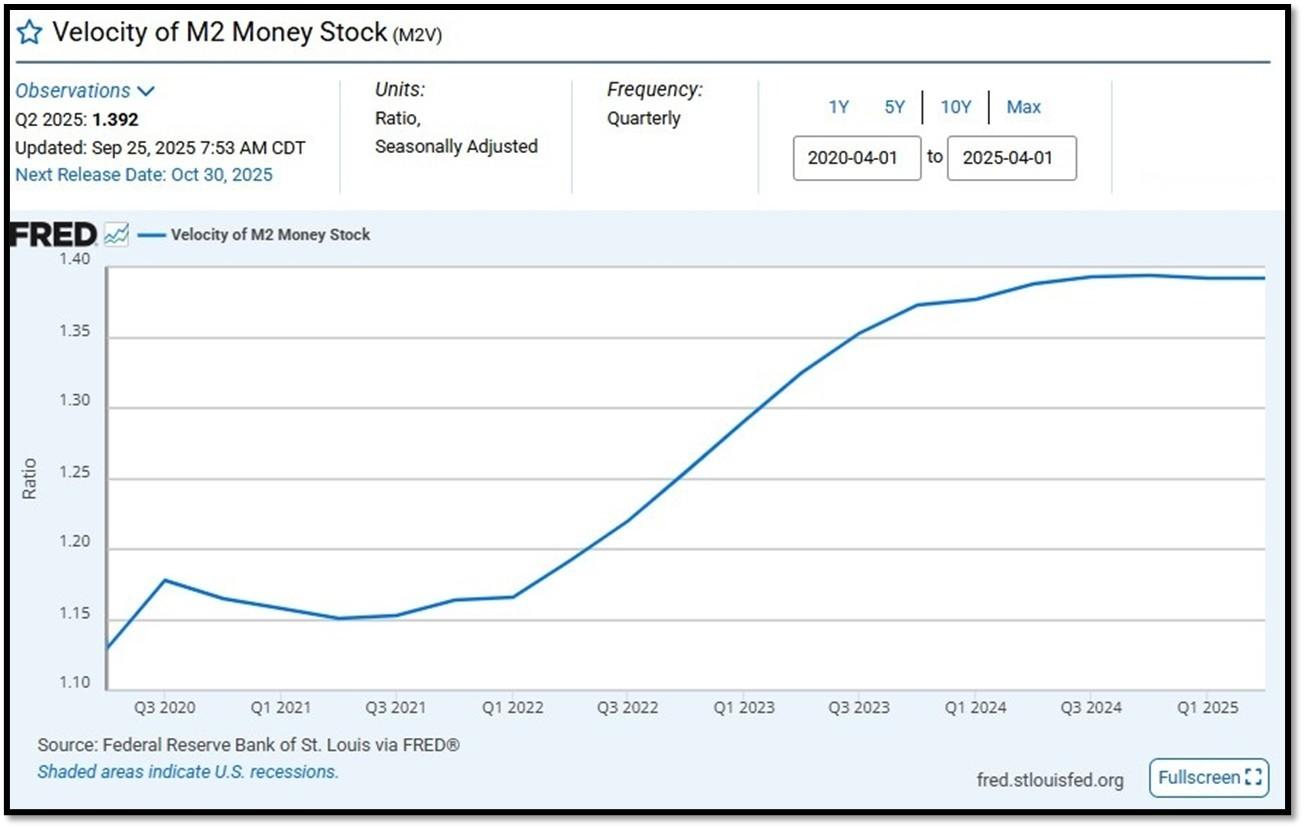
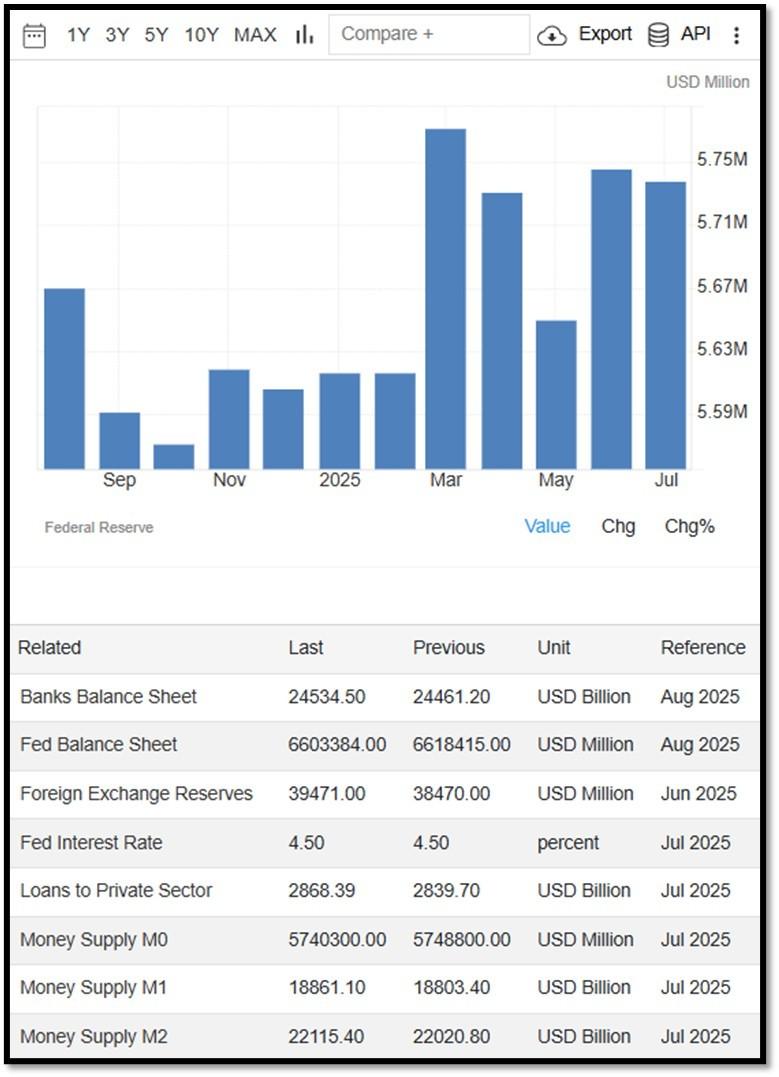
M2 consists of M1 plus (1) small-denomination time deposits (time deposits in amounts of less than $100,000) less IRA and Keogh balances at depository institutions; and (2) balances in retail MMFs less IRA and Keogh balances at MMFs. Seasonally adjusted M2 is constructed by summing savings deposits (before May 2020), small-denomination time deposits, and retail MMFs, each seasonally adjusted separately, and adding this result to seasonally adjusted M1. Board of Governors of the Federal Reserve System (US), M2 [M2SL], retrieved from FRED, Federal Reserve Bank of St. Louis; Updated on September 23, 2025. REF: St.LouisFed-M2
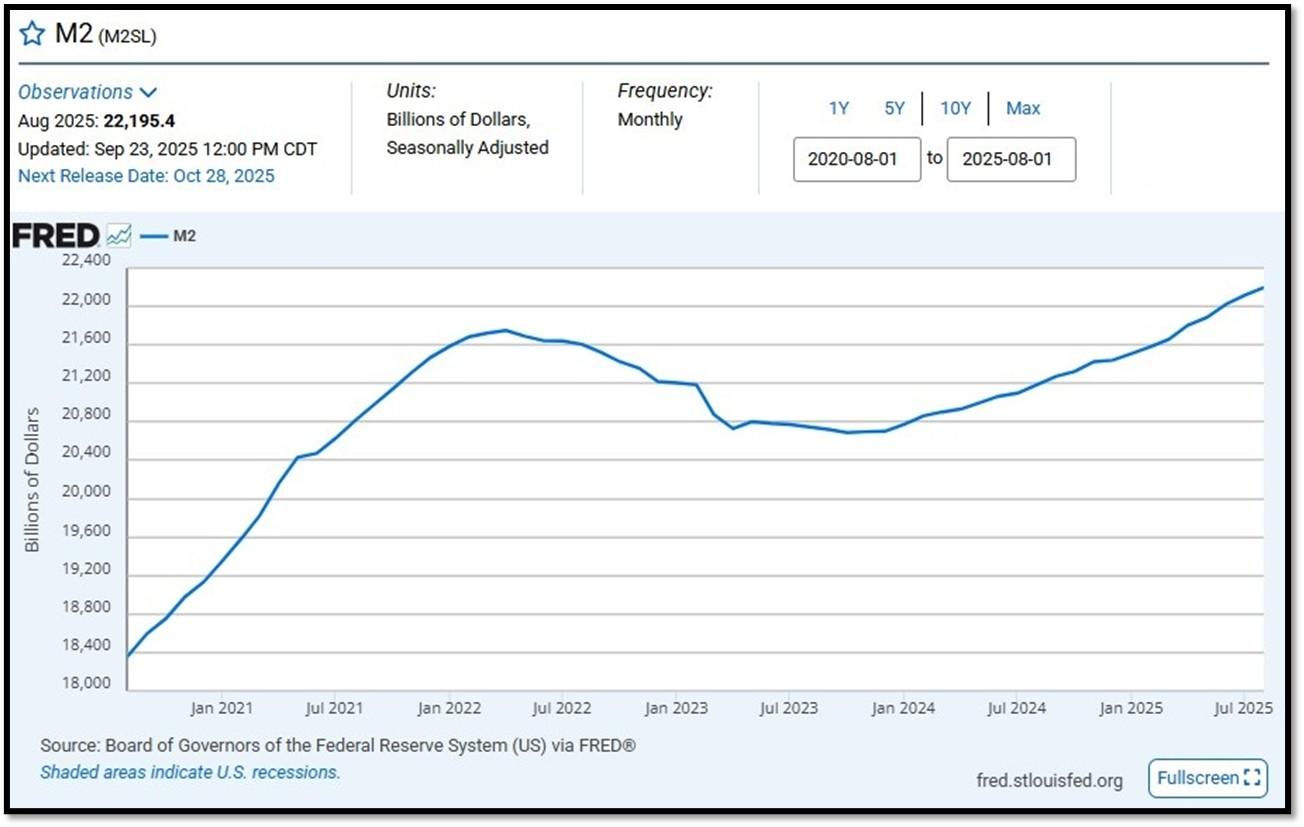
Money Supply M0 in the United States decreased to 5,686,400 USD Million in August from 5,740,300 USD Million in July of 2025. Money Supply M0 in the United States averaged 1,211,562.63 USD Million from 1959 until 2025, reaching an all-time high of 6,413,100.00 USD Million in December of 2021 and a record low of 484,00.00 USD Million in February of 1961.. REF: TradingEconomics, M0
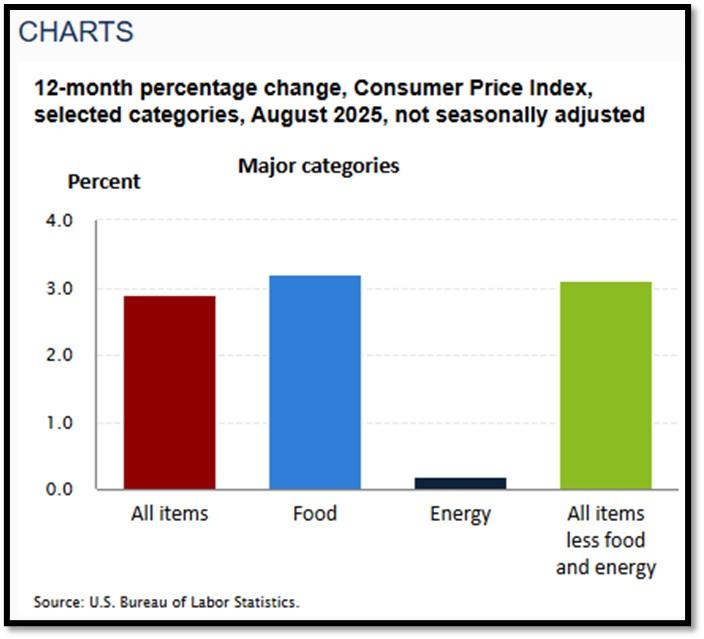
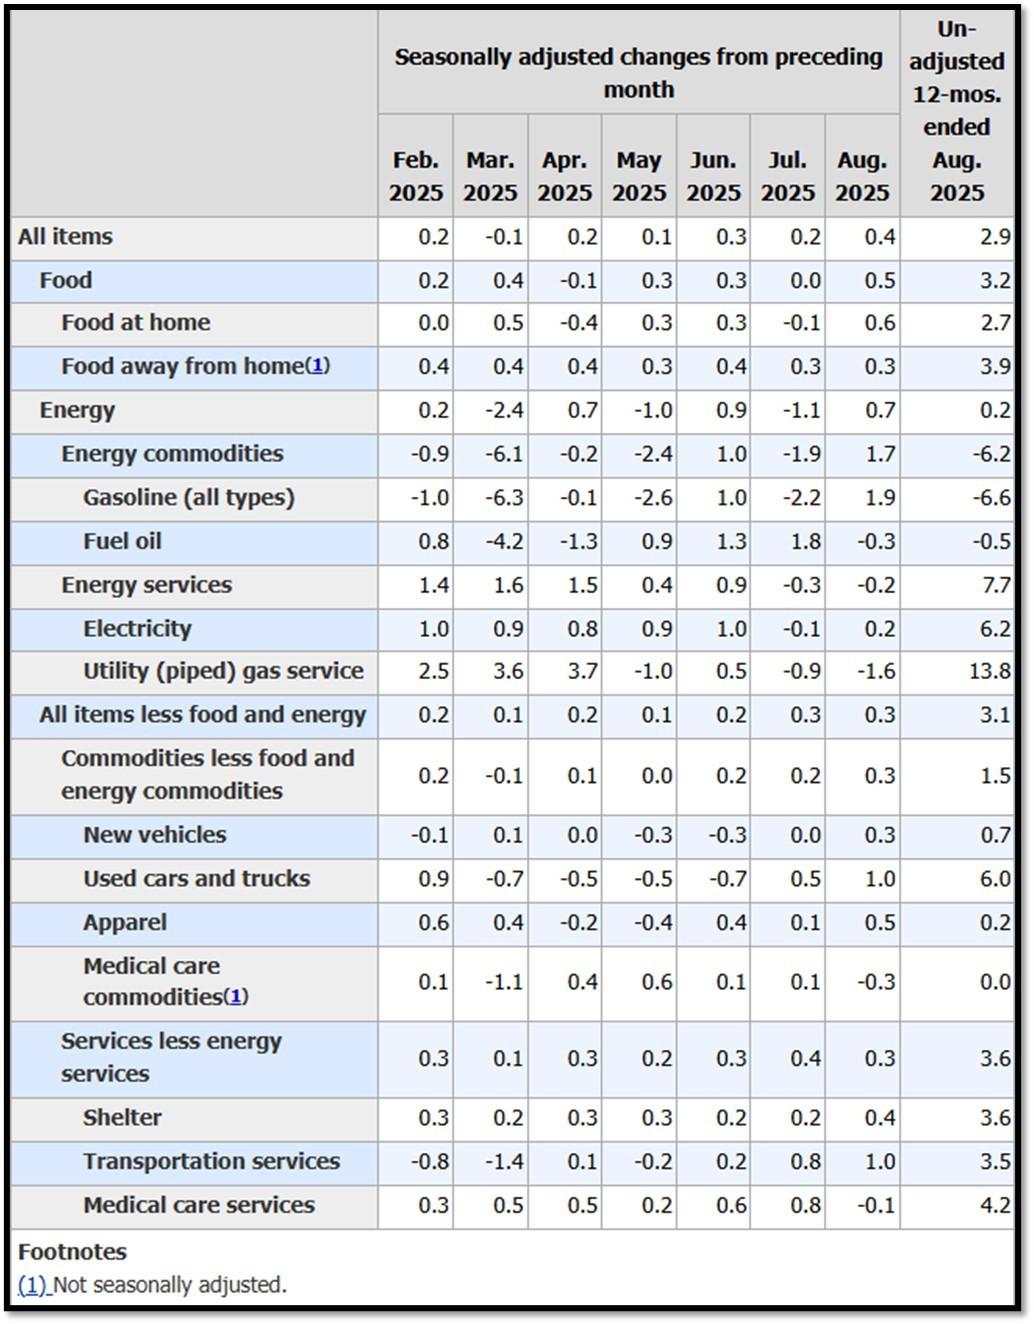
5K. In August, the Consumer Price Index for All Urban Consumers rose 0.4 percent, seasonally adjusted, and rose 2.9 percent over the last 12 months, not seasonally adjusted. The index for all items less food and energy increased 0.3 percent in August (SA); up 3.1 percent over the year (NSA). September 2025 CPI data are scheduled to be released on October 24, 2025, at 8:30AM-ET. REF: BLS, BLS.GOV
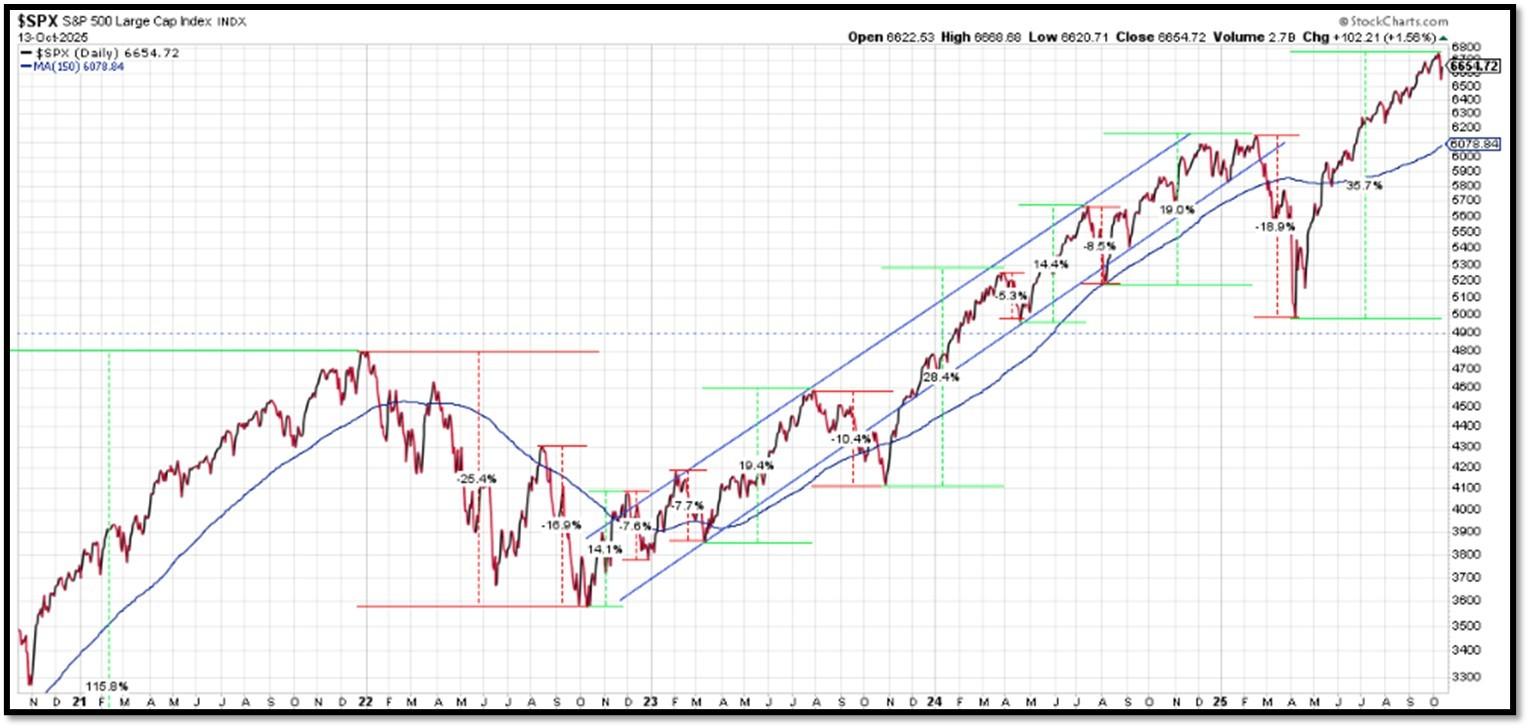
5L. Technical Analysis of the S&P500 Index. Click onto reference links below for images.
- Short-term Chart: Trend Bullish on 10/13/2025 – REF: Short-term S&P500 Chart by Marc Slavin (Click Here to Access Chart)
- Medium-term Chart: Trend Bullish on 10/13/2025 – REF: Medium-term S&P500 Chart by Marc Slavin (Click Here to Access Chart)
- Market Timing Indicators – S&P500 Index as of 10/13/2025 – REF: S&P500 Charts (7 of them) by Joanne Klein’s Top 7 (Click Here to Access Updated Charts)
- The S&P500 is hitting all-time-high, rebounding from a V-shaped recovery to all-time high. REF: Stockcharts
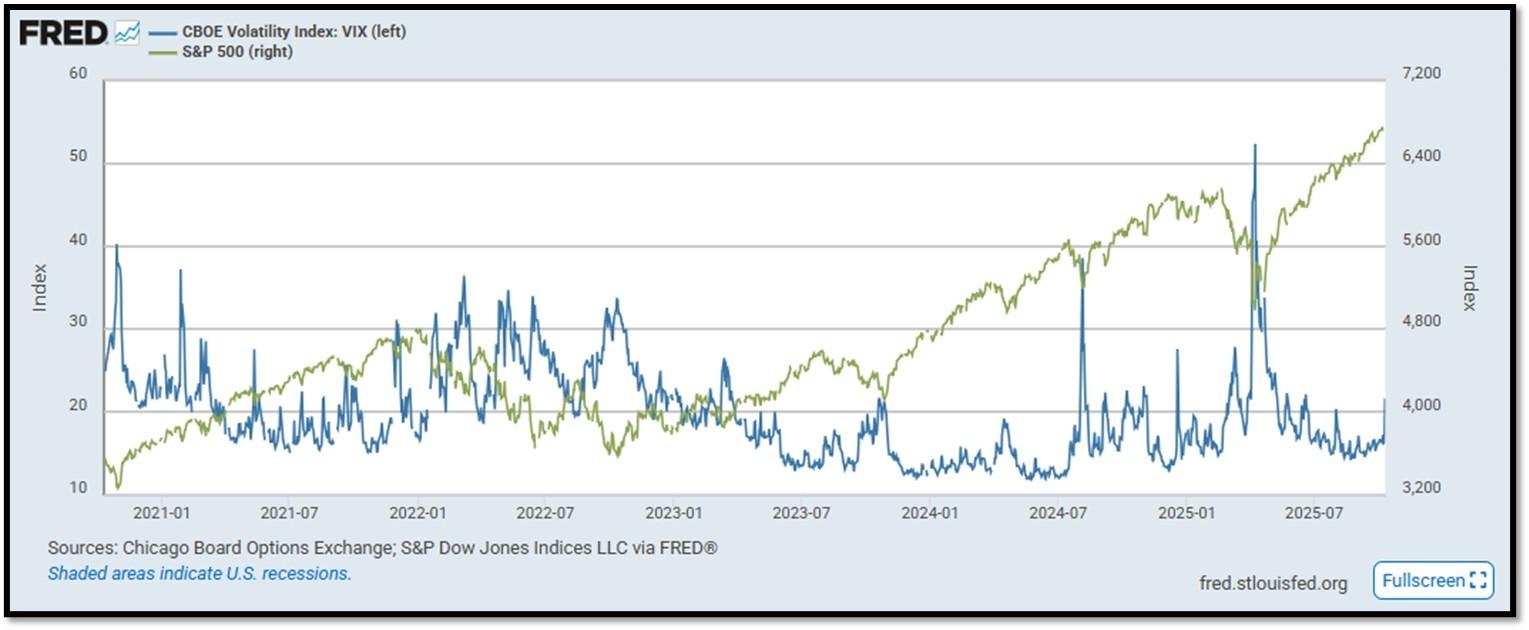
- S&P500 and CBOE Volatility Index (VIX) as of 10/13/2025. REF: FRED, Today’s Print
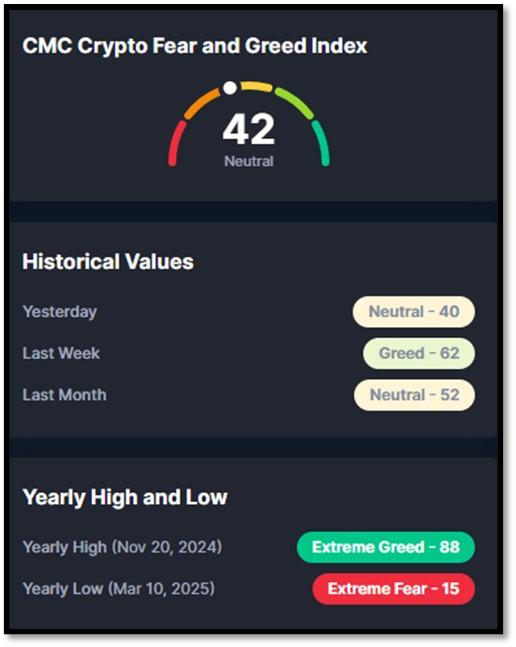
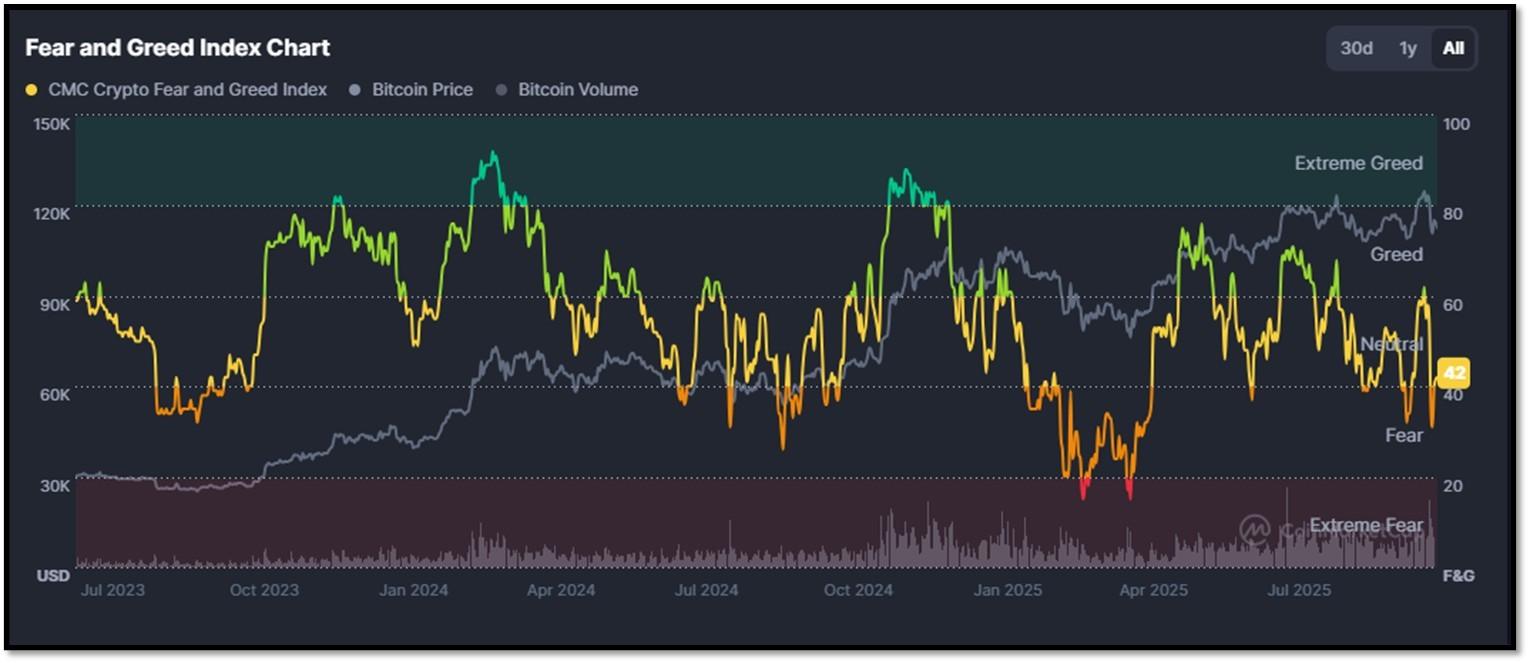
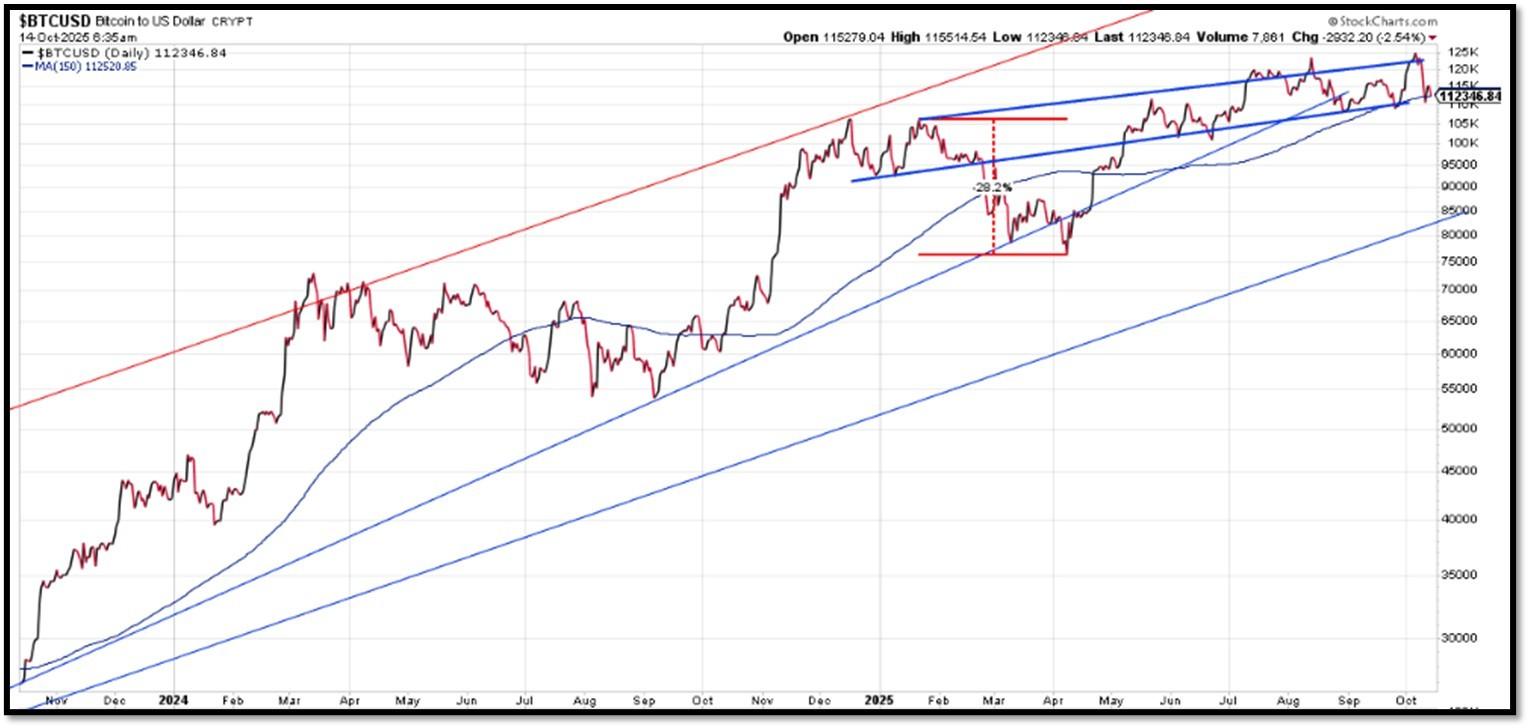
5M. Most recent read on the Crypto Fear & Greed Index with data as of 10/14/2025 is 42 (Neutral). Last week’s data was 62 (Greed) (1-100). Fear & Greed Index – A Contrarian Data. The crypto market behavior is very emotional. People tend to get greedy when the market is rising which results in FOMO (Fear of missing out). Also, people often sell their coins in irrational reaction of seeing red numbers. With the Crypto Fear and Greed Index, the data try to help save investors from their own emotional overreactions. There are two simple assumptions:
- Extreme fear can be a sign that investors are too worried. That could be a buying opportunity.
- When Investors are getting too greedy, that means the market is due for a correction.
Therefore, the program for this index analyzes the current sentiment of the Bitcoin market and crunch the numbers into a simple meter from 0 to 100. Zero means “Extreme Fear”, while 100 means “Extreme Greed”. REF: Coinmarketcap.com, Today’sReading
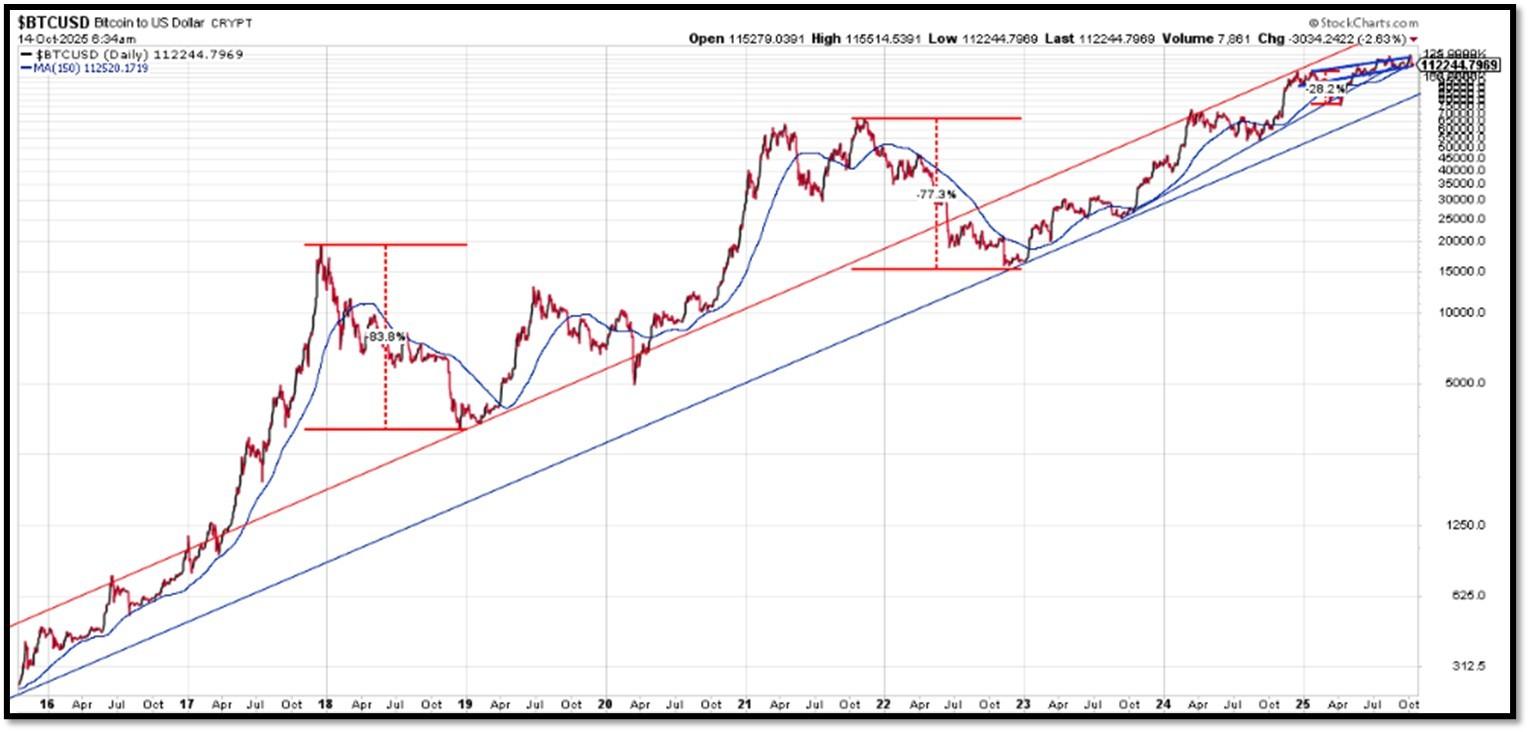
Bitcoin – 10-Year & 2-Year Charts. REF: Stockcharts10Y, Stockcharts2Y
From the desk of our Chief Investment Officer
As an investment professional with over twenty-six years of experience in the financial services industry, Andrew helps clients to protect, grow and transfer wealth during their lifetime with objective, unbiased, customized and efficient strategies.
Education, Professional Licenses Acquired & Affiliations
- Passed the Series 7, 63, 65 and 24 license examinations
- Currently holding Series 65 License
- BA in Economics – Boston University (Boston, MA) 1993
- Certificate in Commodities Trading – New York University (New York, NY) 1991
- Certificate in Financial Planning – New York University (New York, NY) April 2011
With extensive experience in the Financial Services Industry, Andrew Tang and Turner Financial Group provides disciplined wealth management with an intelligent caring approach to each and every client that compliments the Dedicated Financial offering.


Len writes much of his own content, and also shares helpful content from other trusted providers like Turner Financial Group (TFG).
The material contained herein is intended as a general market commentary, solely for informational purposes and is not intended to make an offer or solicitation for the sale or purchase of any securities. Such views are subject to change at any time without notice due to changes in market or economic conditions and may not necessarily come to pass. This information is not intended as a specific offer of investment services by Dedicated Financial and Turner Financial Group, Inc.
Dedicated Financial and Turner Financial Group, Inc., do not provide tax, legal or accounting advice. You should consult your own tax, legal and accounting advisors before engaging in any transaction.
Any hyperlinks in this document that connect to Web Sites maintained by third parties are provided for convenience only. Turner Financial Group, Inc. has not verified the accuracy of any information contained within the links and the provision of such links does not constitute a recommendation or endorsement of the company or the content by Dedicated Financial or Turner Financial Group, Inc. The prices/quotes/statistics referenced herein have been obtained from sources verified to be reliable for their accuracy or completeness and may be subject to change.
Past performance is no guarantee of future returns. Investing involves risk and possible loss of principal capital. The views and strategies described herein may not be suitable for all investors. To the extent referenced herein, real estate, hedge funds, and other private investments can present significant risks, including loss of the original amount invested. All indexes are unmanaged, and an individual cannot invest directly in an index. Index returns do not include fees or expenses.
Turner Financial Group, Inc. is an Investment Adviser registered with the United States Securities and Exchange Commission however, such registration does not imply a certain level of skill or training and no inference to the contrary should be made. Additional information about Turner Financial Group, Inc. is also available at www.adviserinfo.sec.gov. Advisory services are only offered to clients or prospective clients where Turner Financial Group, Inc. and its representatives are properly licensed or exempt from licensure. No advice may be rendered by Turner Financial Group, Inc. unless a client service agreement is in place.


