

- 1. Recent volatility across the stock and bond markets has been amplified by a series of financial disruptions involving regional banks and leveraged sectors.
- 2. Main story this week focuses on Manufacturing… According to Bloomberg data, there were approximately 59 corporate bankruptcies filed under Chapter 7 and Chapter 11 in the first half of the year, and about 32 percent of them came from the manufacturing sector, far outpacing the next highest, which was the services industry.
- 3. SpaceX continues to strengthen its position as the dominant force in private space exploration and satellite communications.
- 4. World Watch
- 4A. Sanae Takaichi has become Japan’s first female prime minister, marking a historic moment in a country where women have long been under-represented in top political roles.
- 4B. Amazon Web Services (AWS) suffered a major outage on October 20, 2025, disrupting critical systems and applications around the world.
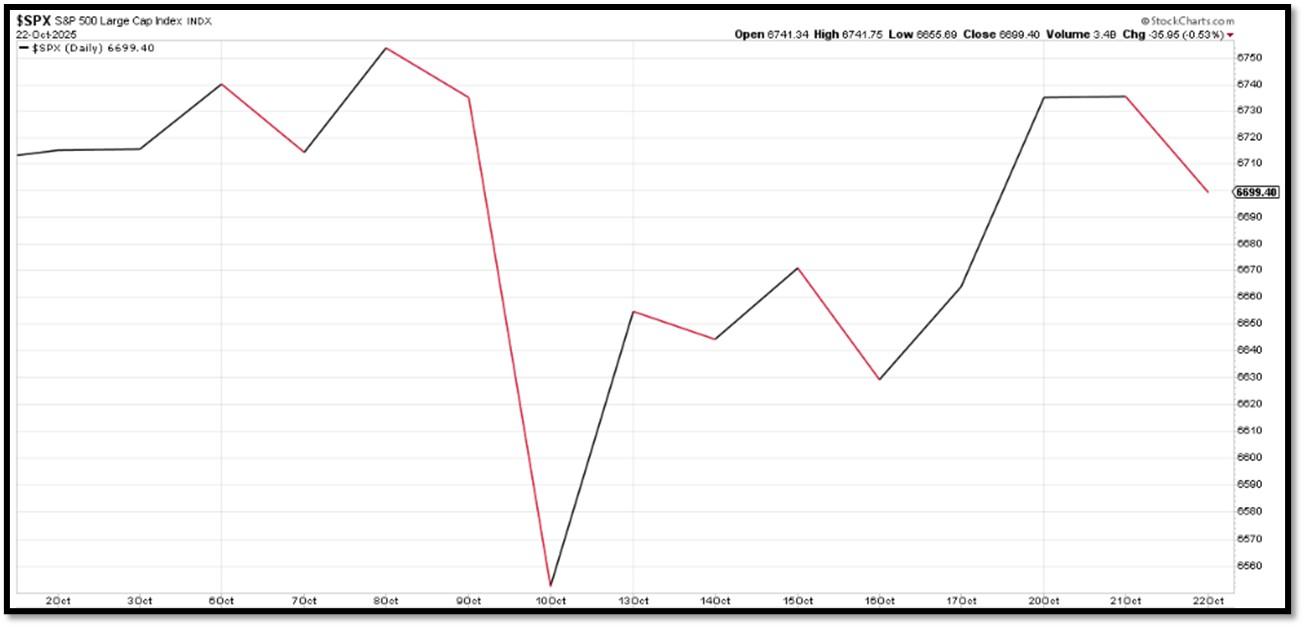
1. Recent volatility across the stock and bond markets has been amplified by a series of financial disruptions involving regional banks and leveraged sectors.
Concerns resurfaced after reports of distress at Zions Bank and Western Alliance, which reignited fears of weakness within the regional banking system. The sudden collapses of First Brands and Tricolor added to the sense of unease, highlighting how certain overextended firms remain vulnerable in a higher interest rate environment. The forced liquidation of heavily leveraged crypto positions last week sent fresh jitters through the digital asset market, triggering sharp price declines across major tokens. This sudden wave of selling also dampened investor confidence, reminding markets of the fragility and interconnectedness of speculative assets. Investors responded with a flight to safety, driving Treasury yields lower and creating short term liquidity pressure in parts of the credit market. The resulting pullback weighed on equity sentiment, especially in financials and small cap sectors that are more exposed to credit stress.
In my view, while these developments are legitimate signs of strain, their magnitude does not appear strong enough to trigger a broader and sustained selloff in stocks or bonds. Rather, this phase of market consolidation should be seen as a healthy reset within a longer-term upward trend. With roughly $72 trillion dollars sitting in money market funds, there is significant dry powder that can be redeployed once short-term uncertainty fades. I see this environment as an attractive entry point for long term investors, as capital is likely to rotate back into equities and bonds once confidence stabilizes and yields begin to moderate. REF: REUTERS, CNBC, Bloomberg, Insights4VC
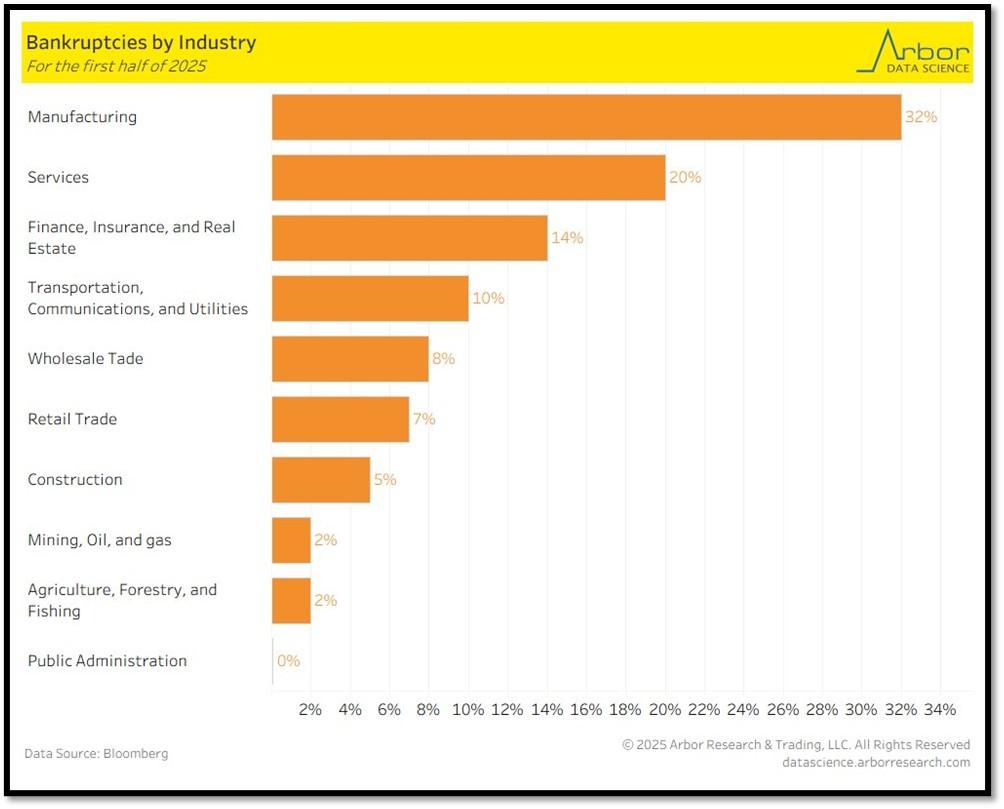
2. Main story this week focuses on Manufacturing… According to Bloomberg data, there were approximately 59 corporate bankruptcies filed under Chapter 7 and Chapter 11 in the first half of the year, and about 32 percent of them came from the manufacturing sector, far outpacing the next highest, which was the services industry.
This disproportionate share suggests that manufacturing firms are under greater financial pressure compared with other parts of the economy. The combination of elevated borrowing costs, volatile input prices, and uneven global demand has weighed heavily on producers, particularly those with thin margins and high leverage. In addition, the process of reshoring and reconfiguring supply chains has raised transitional costs, while technological shifts toward automation and energy efficiency have required substantial capital reinvestment. Many smaller and mid-sized manufacturers have struggled to adapt to these structural demands, leading to a spike in distress and insolvency filings.
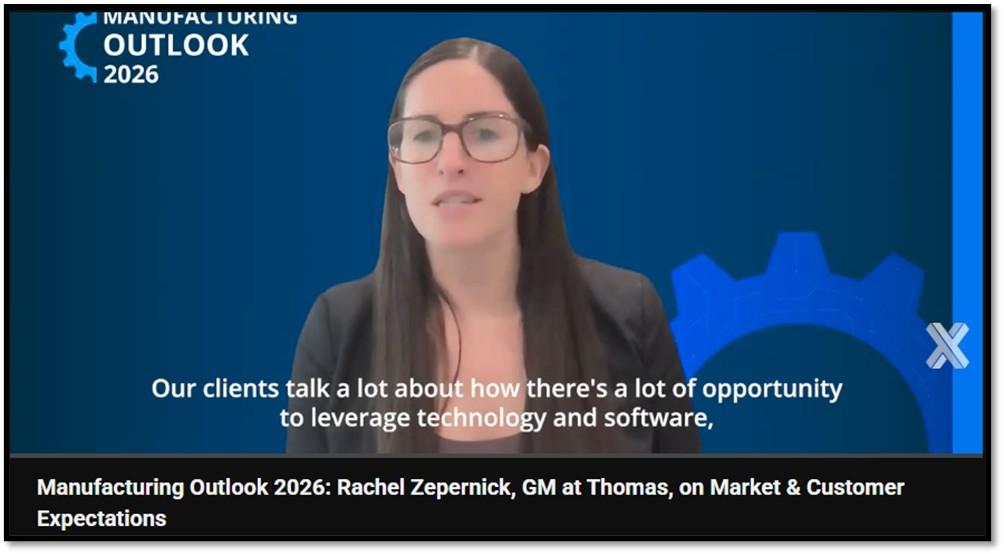
In my view, this trend, while painful in the short term, represents a natural process of creative renewal within the industrial base. The current wave of bankruptcies is not solely a sign of weakness but rather an early stage of transformation—where outdated, inefficient operations are being cleared out to make room for a new generation of manufacturing enterprises built around higher efficiency, better capital discipline, and advanced technology integration. Over time, these adjustments should strengthen the sector’s competitiveness, allowing leaner, better-capitalized firms to thrive in a landscape that rewards innovation, automation, and energy-efficient production. In that sense, the stress visible in the data may actually be part of a healthy evolution toward a more resilient and modern manufacturing economy. Click onto picture below to access video with Rachel Zepernick of Thomas, a leading industrial sourcing and marketing platform. REF: LizAnnSonders, Cornerstone Research, Rachel Zepernick of Thomas
3. SpaceX continues to strengthen its position as the dominant force in private space exploration and satellite communications.
The company is reportedly in advanced talks for a new share sale that would value it at roughly $400 billion, reflecting strong investor confidence in its growth trajectory. Recent developments include continued progress on the Starship program, its fully reusable next generation rocket, and the rapid global expansion of Starlink, SpaceX’s satellite internet network, which has become a major revenue driver. The company’s reusable launch technology has dramatically reduced costs and increased launch frequency, securing a growing share of government and commercial contracts. These advancements have transformed SpaceX from a launch provider into a full spectrum space infrastructure company that spans connectivity, transportation, and deep space exploration.
Investor models project even greater upside ahead. Analysts such as ARK Invest estimate that SpaceX’s valuation could reach $2.5 trillion by 2030, driven by Starlink’s global market penetration and the commercialization of space transport. While such projections depend on flawless execution across technology, regulation, and market demand, they illustrate the scale of investor optimism. The current valuation surge underscores how SpaceX has come to symbolize the future of private aerospace, blending innovation, vertical integration, and operational efficiency into a business model that could redefine global communications and space logistics in the decade ahead. Click onto picture below to access video from CNET. REF: SpaceX, CNET

There are several ways for investors to get access to invest in SpaceX, although not a direct allocation, the following funds have allocations to SpaceX.
- ARK Venture Fund – ARK Invest
- Baron Focused Growth Fund – REF: Baron Capital
- The Private Shares Fund – PrivateSharesFund
NOTE: Not investment advice or recommendations. Investors should carefully consider the investment objectives, risks, charges, and expenses before investing. For additional information about the securities mentioned above or in the videos, please visit the respective funds’ documents pages for the funds’ prospectus. Please read all materials carefully before investing.
With the current macro-economic backdrop, below are areas we currently favor:
- Fixed Income – (Corporates & Muni) High Yield as Opportunistic Allocation (Low-Beta)
- Fixed Income – Short-term Corporates & Muni (Low-Beta)
- Businesses that contribute to and benefit from AI & Automation (Market-Risk)
- Fintech & Financials (Market-Risk)
- Digital Asset – Bitcoin (Market-Risk/Hedge)
- Neo-Cloud Computing (Market-Risk)
- India & China-Tech (Market-Risk)
- Cyber-Security & Software (Market-Risk)
- Quantum Computing (Market-Risk)
4. World Watch
4A. Sanae Takaichi has become Japan’s first female prime minister, marking a historic moment in a country where women have long been under-represented in top political roles.
She succeeds Shigeru Ishiba as head of the long-ruling Liberal Democratic Party (LDP), following a parliamentary vote and a new coalition arrangement with the Japan Innovation Party (Ishin). Her election is being seen not only as a break in gender barriers but also as signaling a clear ideological shift within Japan’s ruling party and government.
Takaichi is known for her staunch conservative views, particularly her advocacy for strengthening Japan’s military and expanding the role of its self-defense forces. She supports constitutional revision to recognize the military’s role more explicitly, tighter immigration controls, and closer strategic ties with the United States. Her nationalist bent and visits to controversial sites have generated concern among some of Japan’s neighbors about potential tensions in regional diplomacy. Her leadership thus represents a new chapter in Japan’s politics—combining a historic breakthrough for a woman in power with a more assertive security posture for the country. Click onto picture below to access video from BBC. REF: WSJ, BBC

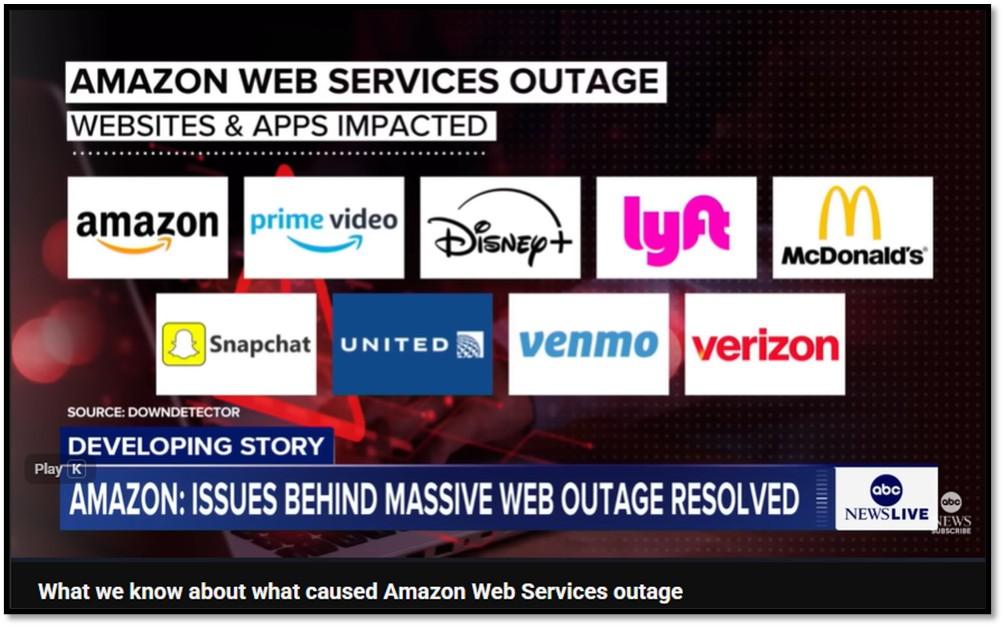
4B. Amazon Web Services (AWS) suffered a major outage on October 20, 2025, disrupting critical systems and applications around the world.
The incident originated in the US East 1 region due to a DNS resolution failure affecting the DynamoDB database service, which caused cascading disruptions across dependent cloud applications. As one of the largest cloud infrastructure providers globally, AWS hosts a vast number of corporate systems, e commerce platforms, financial institutions, and consumer applications. As a result, major companies and popular services from banking platforms and airlines to communication tools and gaming networks experienced hours of downtime. By midafternoon Pacific time, Amazon restored most functions, but the event underscored just how deeply integrated cloud infrastructure has become in modern business and daily life.
The outage carried significant productivity and economic consequences. Analysts estimated the global cost could range from tens to hundreds of billions of dollars when accounting for halted transactions, idle workforces, and disrupted digital operations. With key systems like retail checkout, financial transfers, and enterprise communication tools inaccessible, companies faced both immediate losses and extended recovery costs from backlogs and delayed workflows. Beyond financial impact, the event reignited debate over the world’s dependence on a few dominant cloud providers and the systemic risks such concentration creates. Many organizations are now reassessing their digital resilience strategies, exploring multi-cloud and redundancy solutions to prevent similar productivity collapses in the future. Click onto picture below to access video from ABCNews. REF: AmazonAWS, Bloomberg, ABCNews
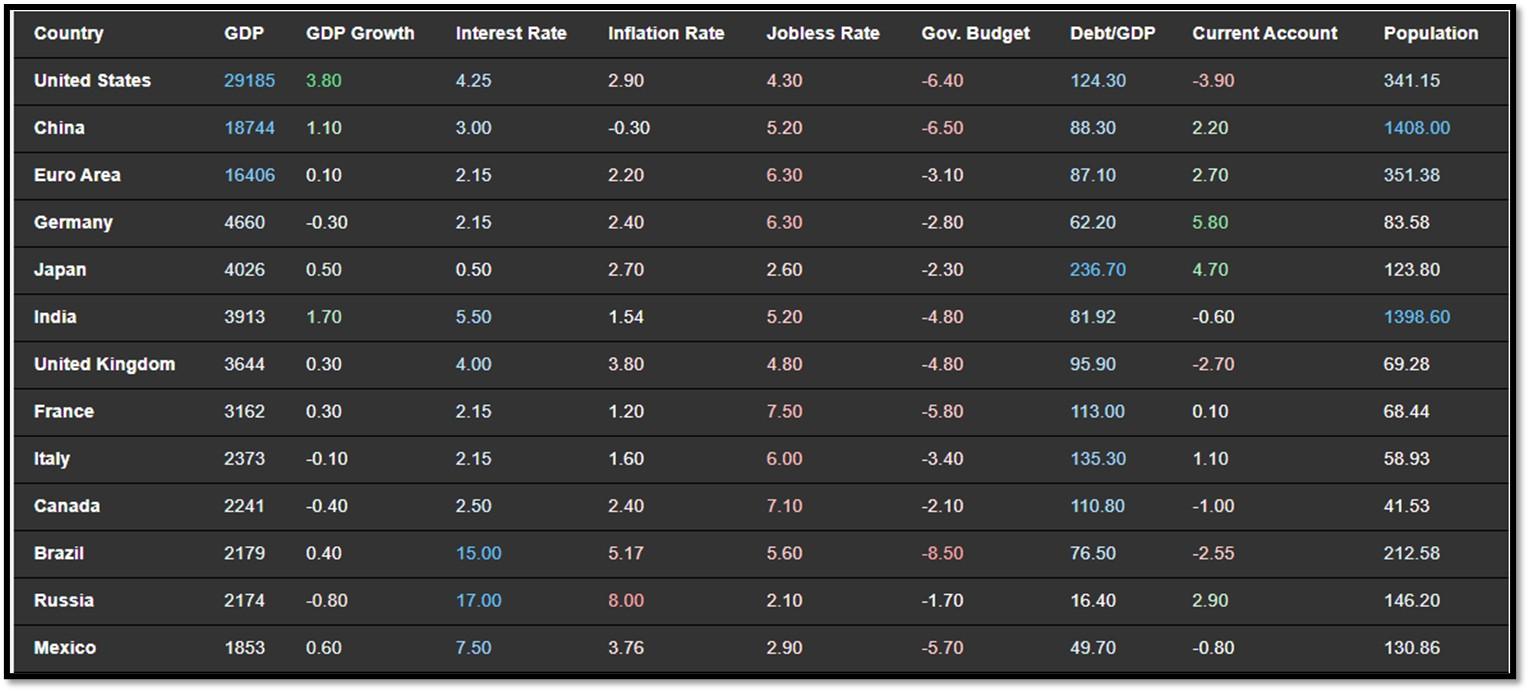
4C. Below is an updated snapshot of the current global state of economy according to TradingEconomics as of 10/22/2025. REF: TradingEconomics
- China’s consumer prices dropped 0.3% yoy in September 2025, steeper than market estimates of a 0.1% decline but slightly less than a 0.4% fall in the previous month.
- China’s surveyed unemployment rate fell to 5.2% in September 2025, compared to market expectations and August’s six-month high of 5.3%.
- India’s unemployment rate rose slightly to 5.2% in September 2025 from 5.1% in August, in line with market expectations, following two consecutive months of declines.
- The United Kingdom’s unemployment rate rose to 4.8% in the three months to August 2025, above market expectations of 4.7% in July.
5. Quant & Technical Corner – Below is a selection of quantitative & technical data we monitor on a regular basis to help gauge the overall financial market conditions and the investment environment.
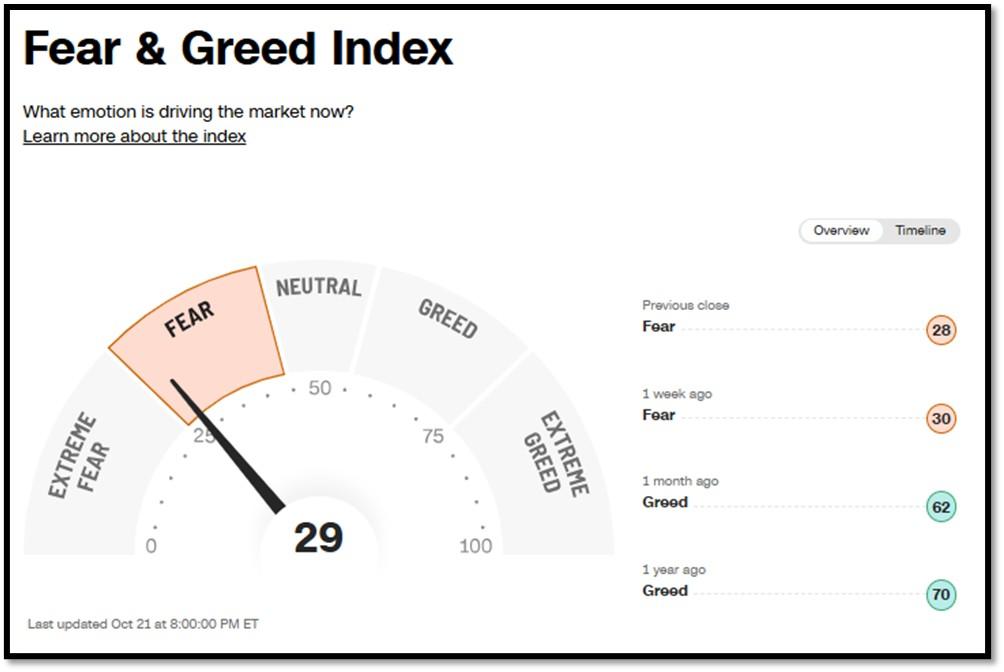
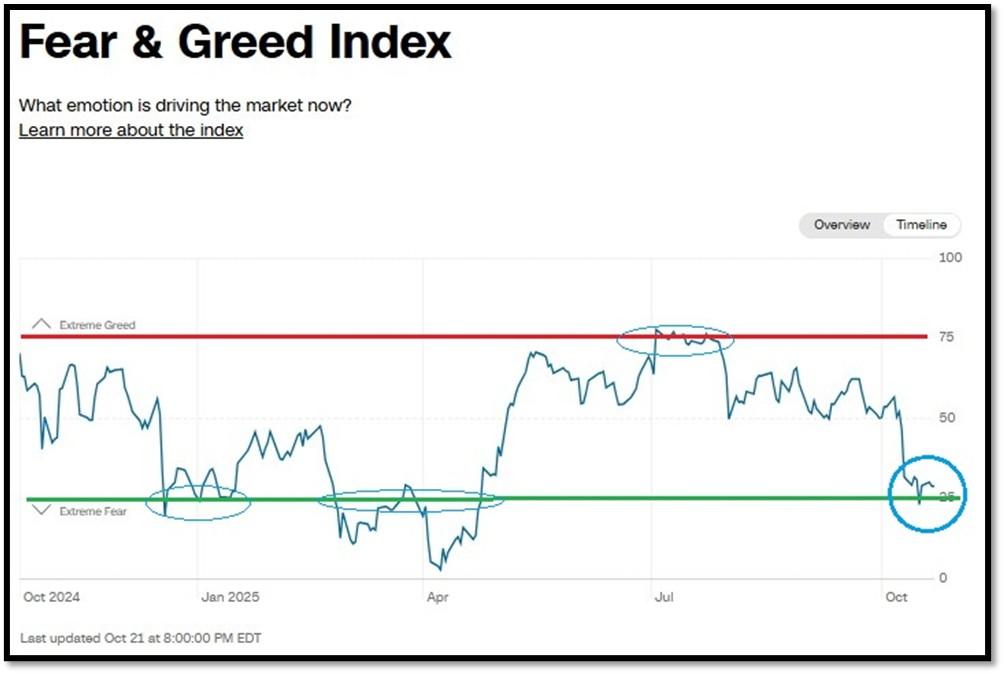
5A. Most recent read on the Fear & Greed Index with data as of 10/21/2025 – 8:00 PM-ET is 29 (Fear). Last week’s data was 30 (Fear) (1-100). CNNMoney’s Fear & Greed index looks at 7 indicators (Stock Price Momentum, Stock Price Strength, Stock Price Breadth, Put and Call Options, Junk Bond Demand, Market Volatility, and Safe Haven Demand). Keep in mind this is a contrarian indicator! REF: Fear&Greed via CNNMoney
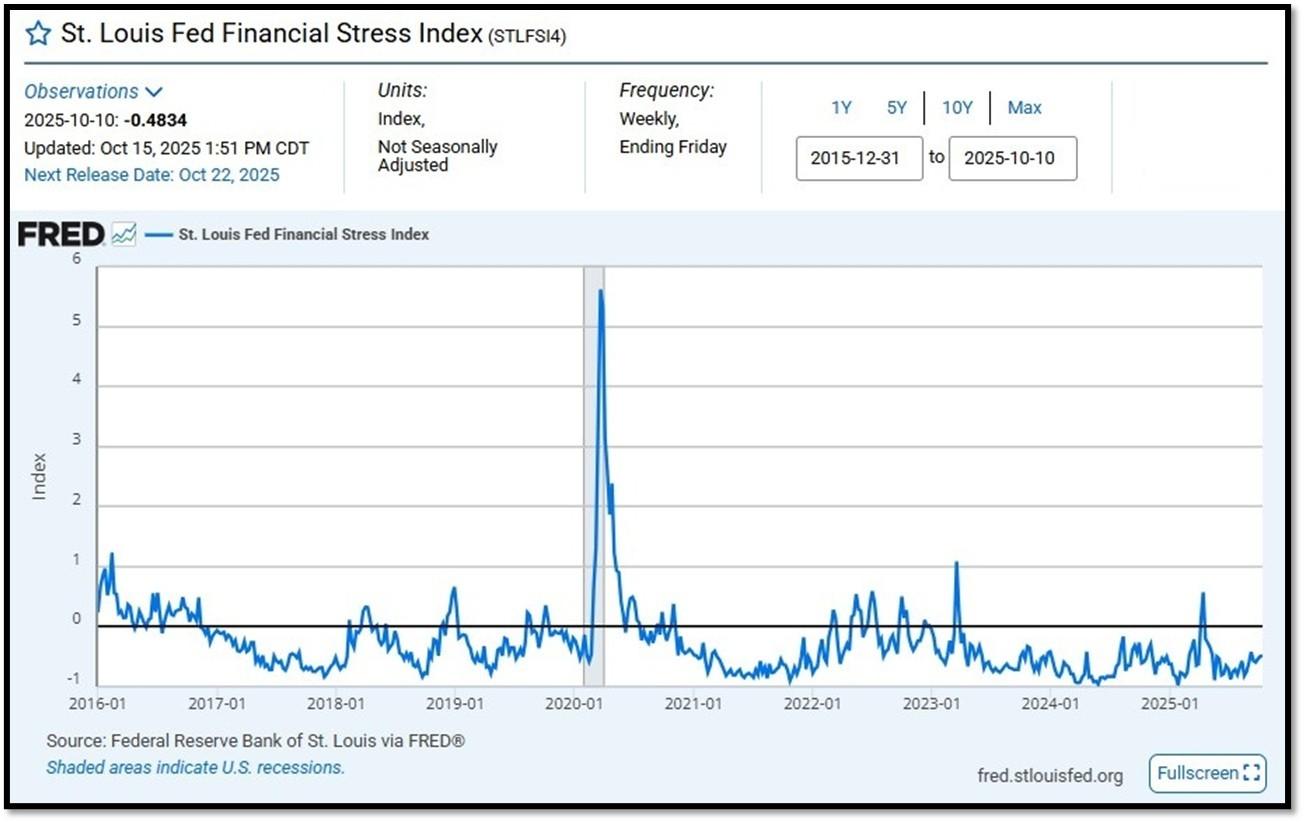
5B. St. Louis Fed Financial Stress Index’s (STLFSI4) most recent read is at –0.4834 as of October 15, 2025. Previous week’s data was -0.4941. A big spike up from previous readings reflecting the turmoil in the banking sector back in 2023. This weekly index is not seasonally adjusted. The STLFSI4 measures the degree of financial stress in the markets and is constructed from 18 weekly data series: seven interest rate series, six yield spreads and five other indicators. Each of these variables captures some aspect of financial stress. Accordingly, as the level of financial stress in the economy changes, the data series are likely to move together. REF: St. Louis Fed
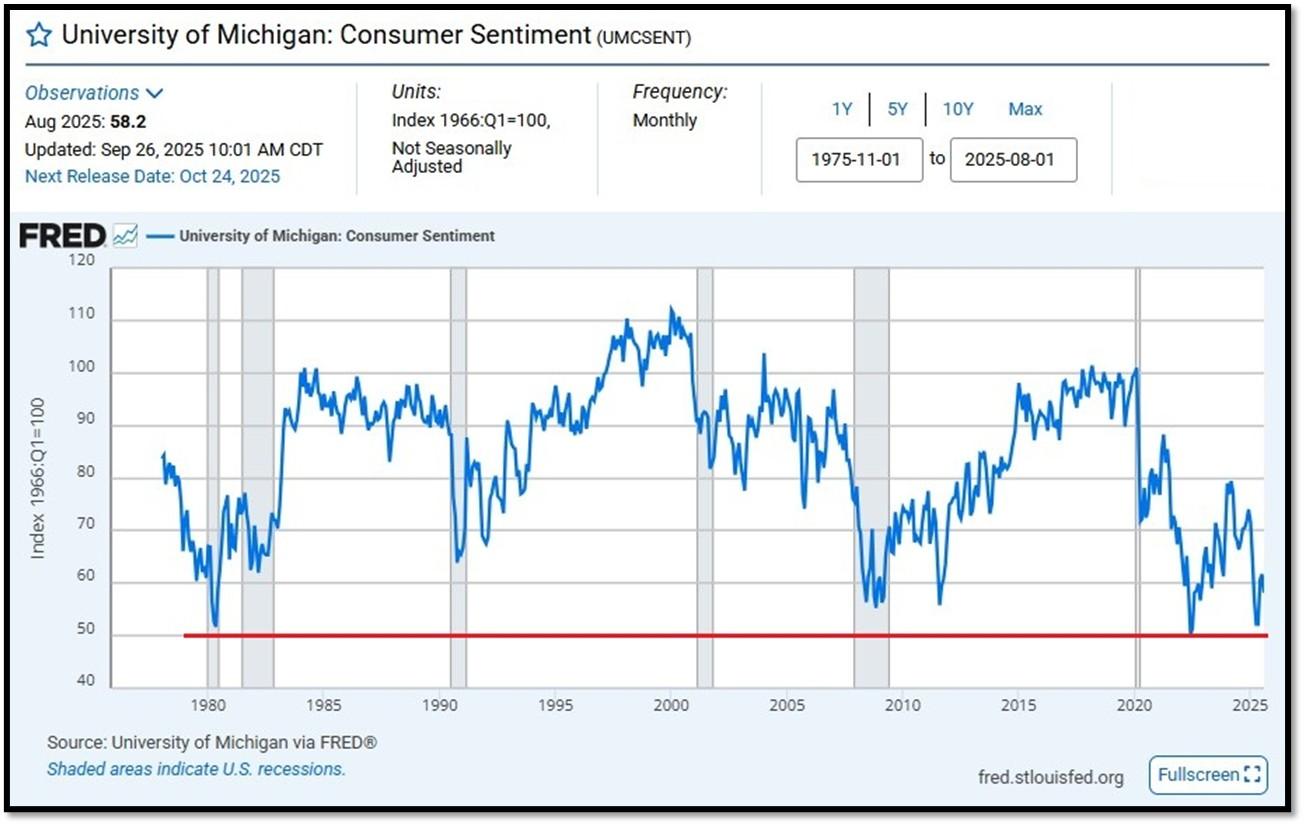
5C. University of Michigan, University of Michigan: Consumer Sentiment [UMCSEMT] for August at 58.2, retrieved from FRED, Federal Reserve Bank of St. Louis, September 26, 2025. Back in June 2022, Consumer Sentiment hit a low point going back to April 1980. REF: UofM
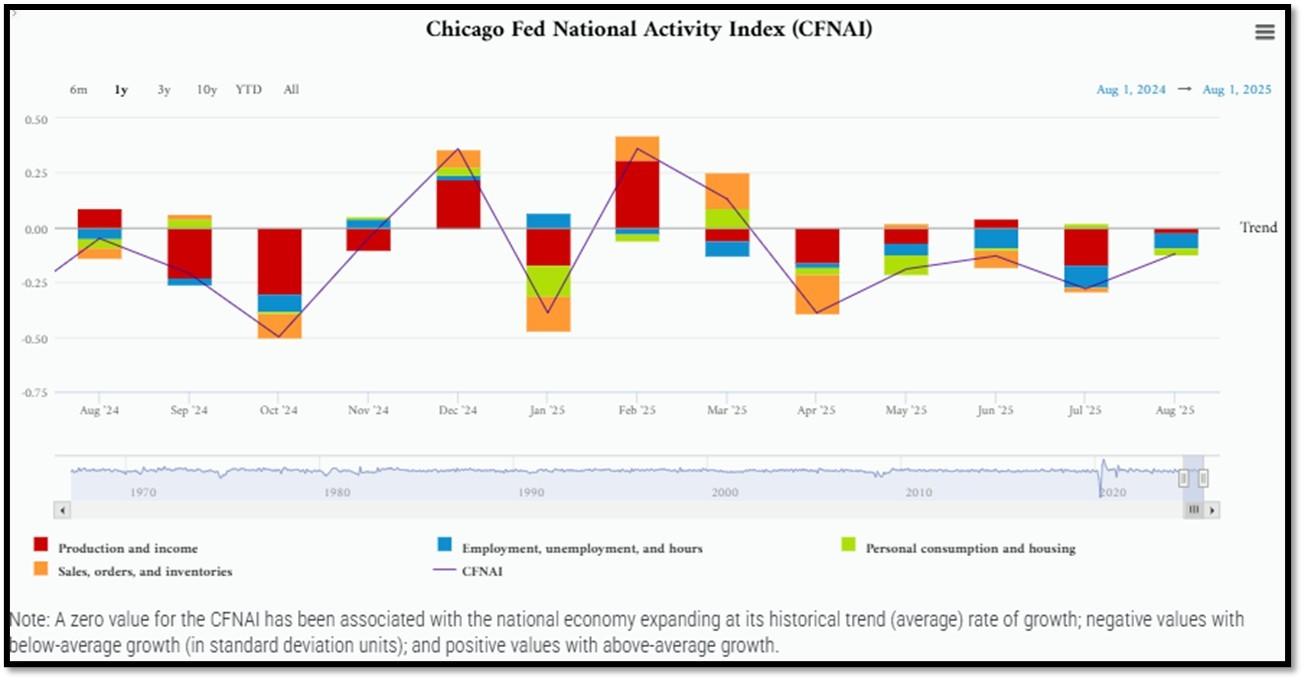
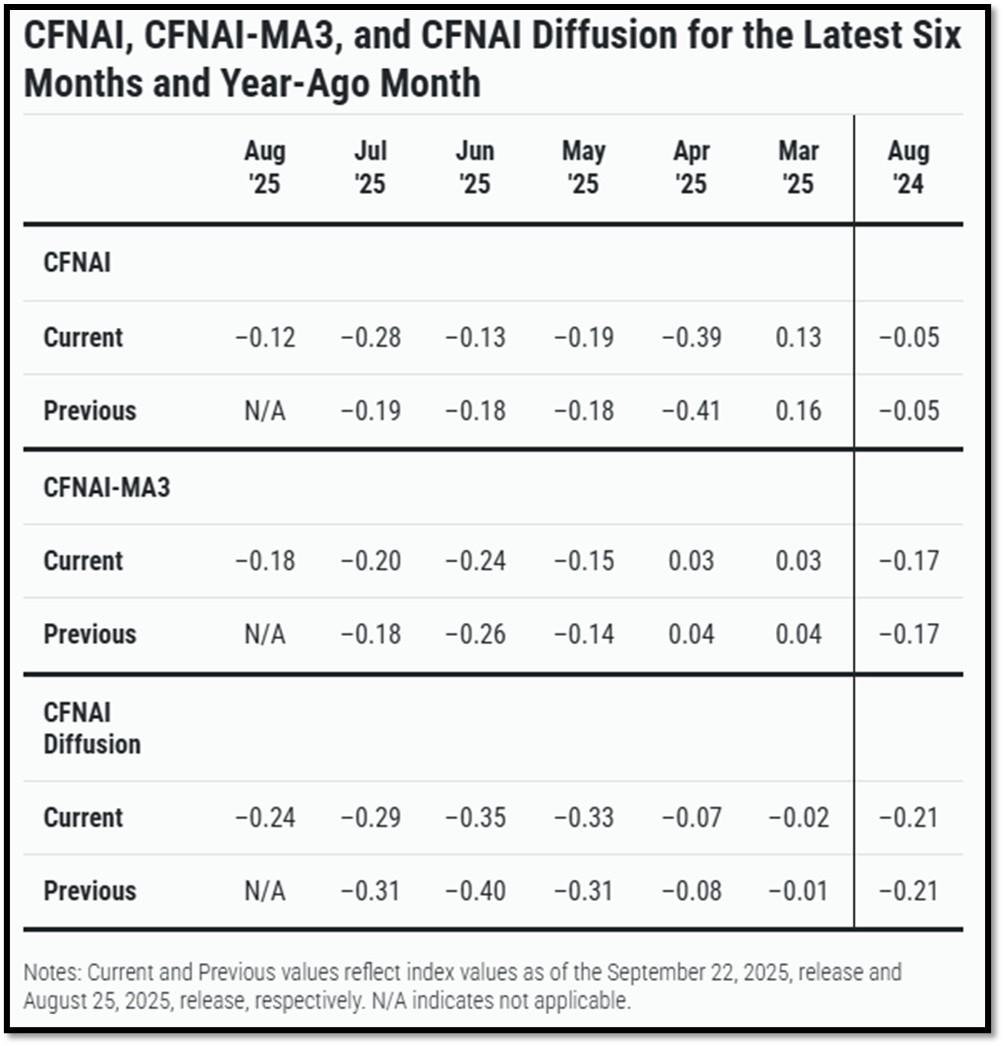
5D. The Chicago Fed National Activity Index (CFNAI) increased to –0.12 in August from –0.28 in July. Three of the four broad categories of indicators used to construct the index increased from July, but three categories made negative contributions in August. The index’s three-month moving average, CFNAI-MA3, increased to –0.18 in August from –0.20 in July. REF: ChicagoFed, August’s Report
5E. (9/18/2025) The Conference Board Leading Economic Index (LEI) for the US declined by 0.5% in August 2025 to 98.4 (2016=100), after a small 0.1% increase in July (upwardly revised from an originally reported 0.1% decline). The LEI fell by 2.8% over the six months between February and August 2025, a faster rate of decline than its 0.9% contraction over the previous six-month period (August 2024 to February 2025). The composite economic indexes are the key elements in an analytic system designed to signal peaks and troughs in the business cycle. The indexes are constructed to summarize and reveal common turning points in the economy in a clearer and more convincing manner than any individual component. The CEI is highly correlated with real GDP. The LEI is a predictive variable that anticipates (or “leads”) turning points in the business cycle by around 7 months. Shaded areas denote recession periods or economic contractions. The dates above the shaded areas show the chronology of peaks and troughs in the business cycle. The ten components of The Conference Board Leading Economic Index® for the U.S. include: Average weekly hours in manufacturing; Average weekly initial claims for unemployment insurance; Manufacturers’ new orders for consumer goods and materials; ISM® Index of New Orders; Manufacturers’ new orders for nondefense capital goods excluding aircraft orders; Building permits for new private housing units; S&P 500® Index of Stock Prices; Leading Credit Index™; Interest rate spread (10-year Treasury bonds less federal funds rate); Average consumer expectations for business conditions. REF: ConferenceBoard, LEI Report for August (ReceesionAlert) (Released on 9/30/2025)
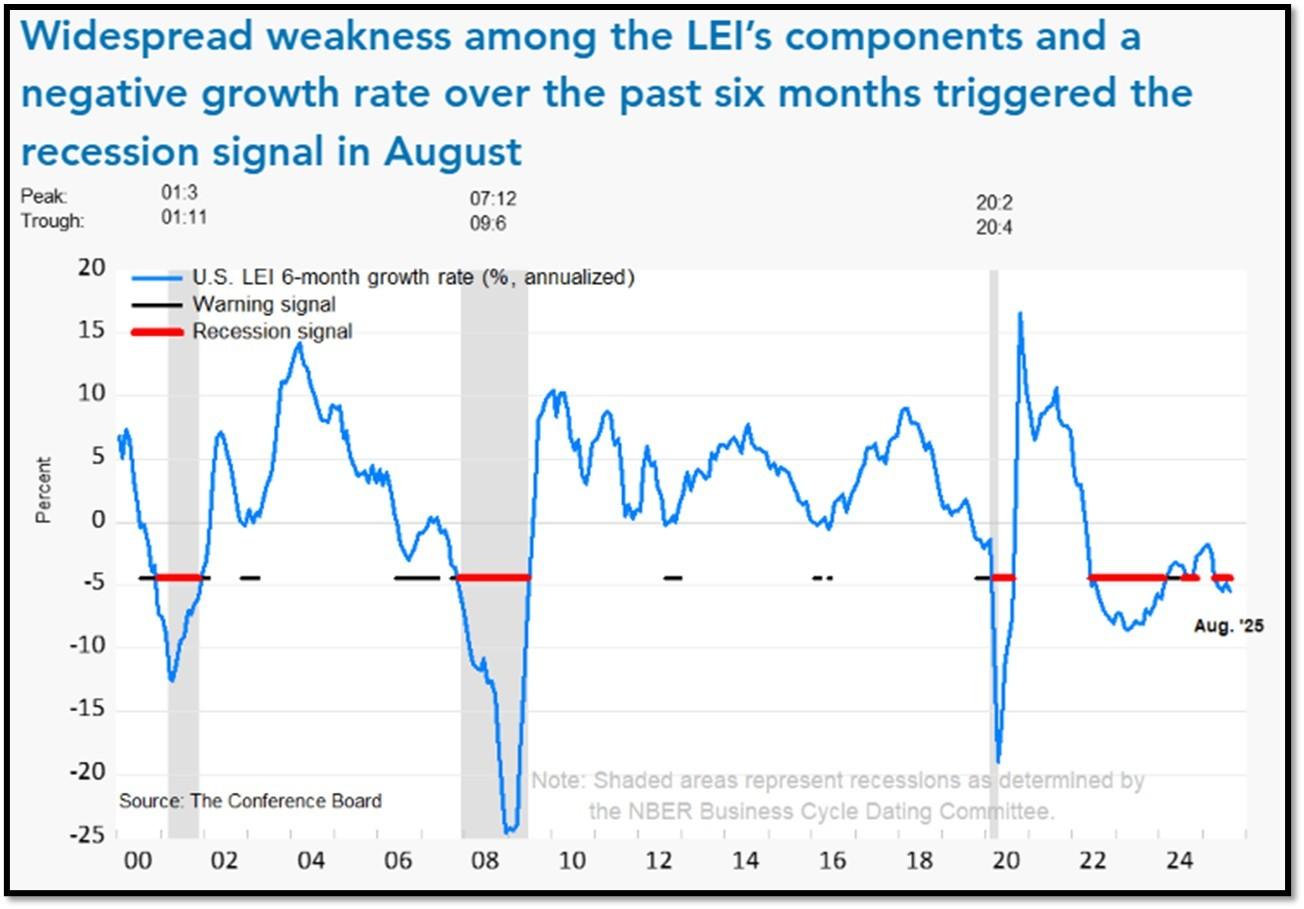
We have experienced a “rolling recession” since June 2022 and are only now emerging from it. However, authorities are not labeling it a recession due to high employment data from June 2022-2025.
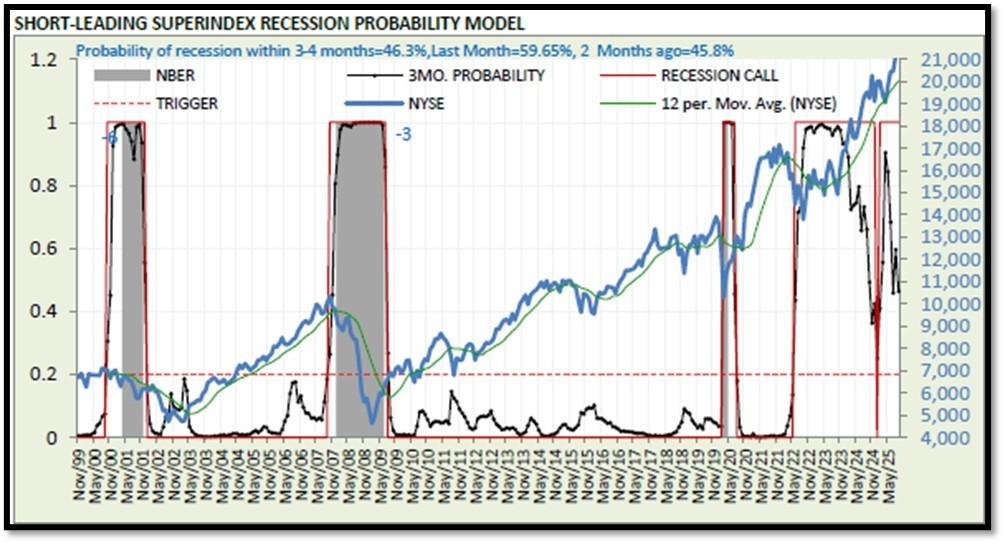
5F. Probability of U.S. falling into Recession within 3 to 4 months is currently at 46.3% (with data as of 09/28/2025 – Next Report 10/12/2025) according to RecessionAlert Research. Last release’s data was at 59.51%. This report is updated every two weeks. REF: RecessionAlertResearch
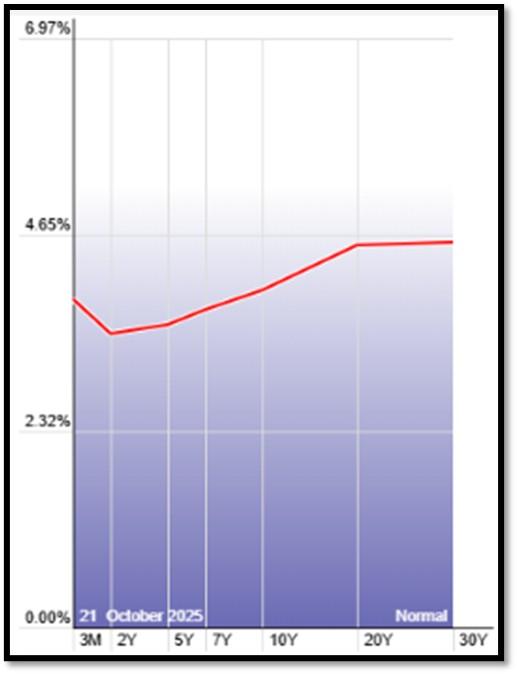
5G. Yield Curve as of 10/21/2025 is showing Normal. Spread on the 10-yr Treasury Yield (3.97%) minus yield on the 2-yr Treasury Yield (3.45%) is currently at 52bps as of 10/22/25. REF: Stockcharts The yield curve—specifically, the spread between the interest rates on the ten-year Treasury note and the three-month Treasury bill—is a valuable forecasting tool. It is simple to use and significantly outperforms other financial and macroeconomic indicators in predicting recessions two to six quarters ahead. REF: NYFED
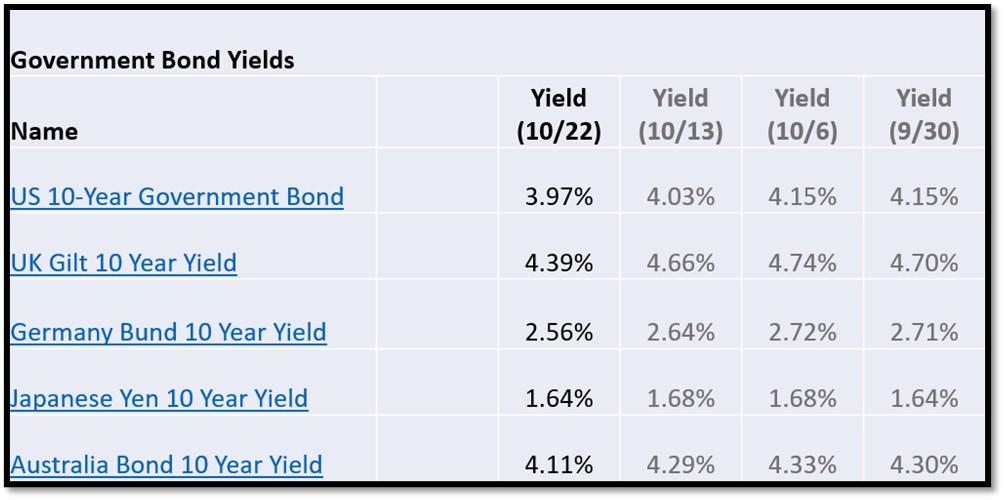
5H. Recent Yields in 10-Year Government Bonds. REF: Source is from Bloomberg.com, dated 10/22/2025, rates shown below are as of 10/22/2025, subject to change.
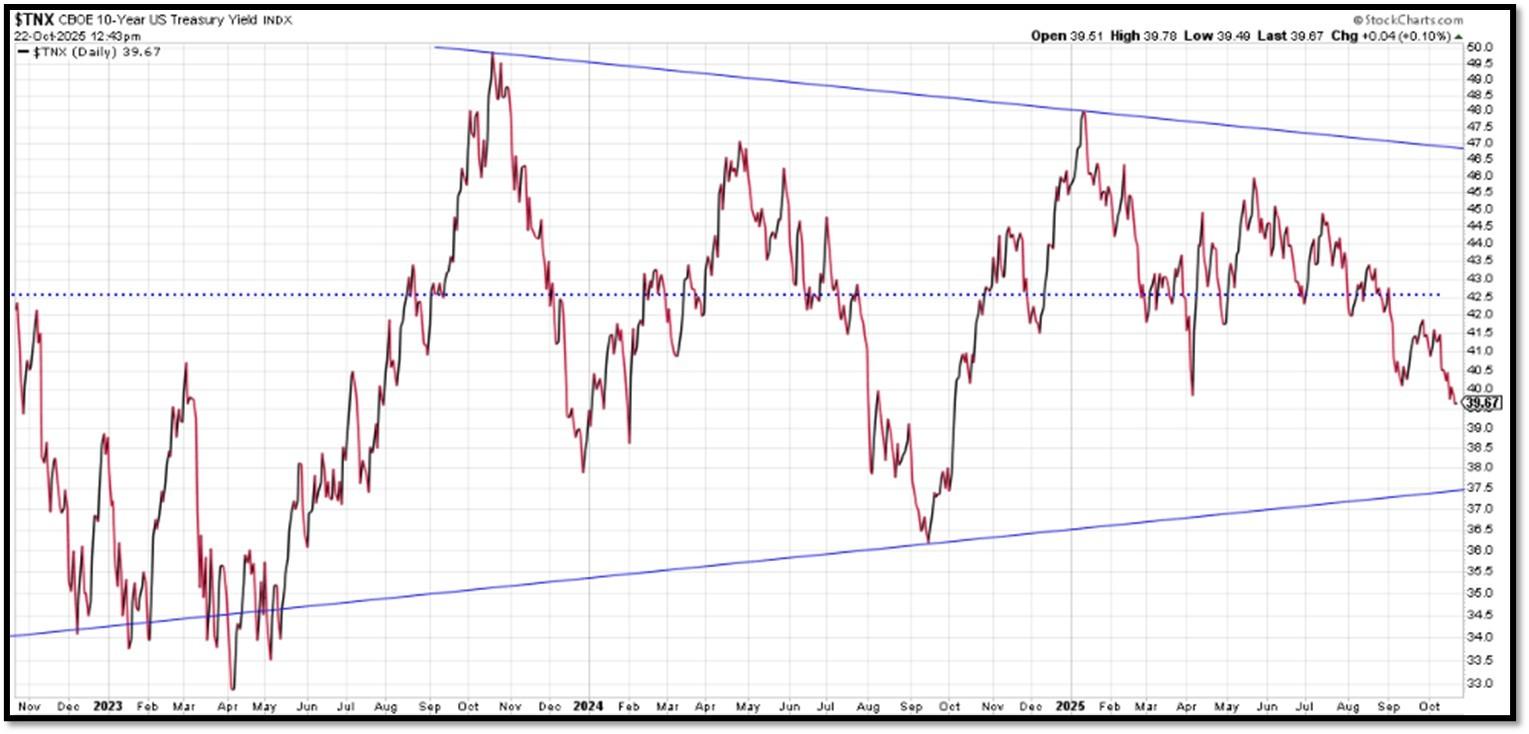
The 10-Year US Treasury Yield… The 10-Year Yield is indirectly related to inflation and prospect of the economy. I expect the 10-Year Yield to drop towards the support line. REF: StockCharts1
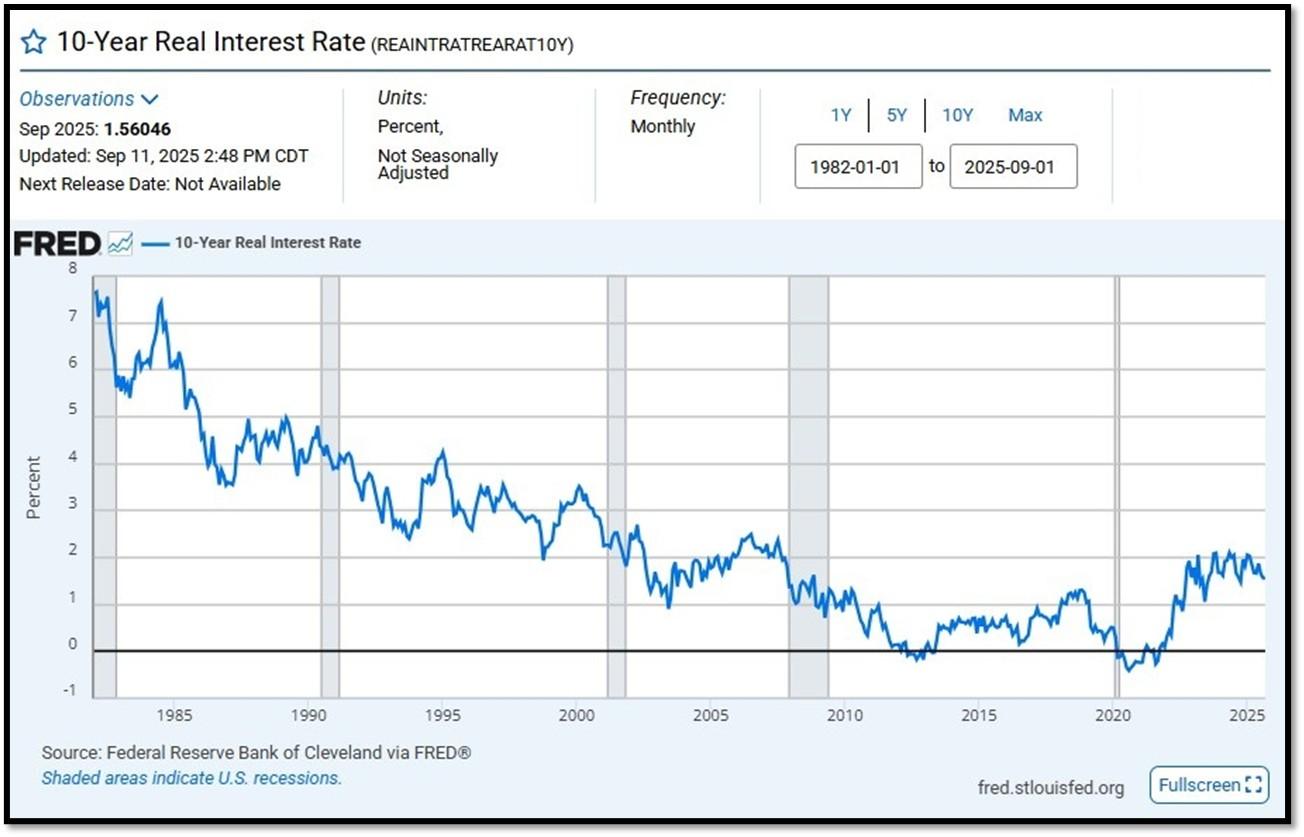
10-Year Real Interest Rate at 1.56046% as of 9/11/25. Last month’s data was 1.56633%. REF: REAINTRATREARAT10Y
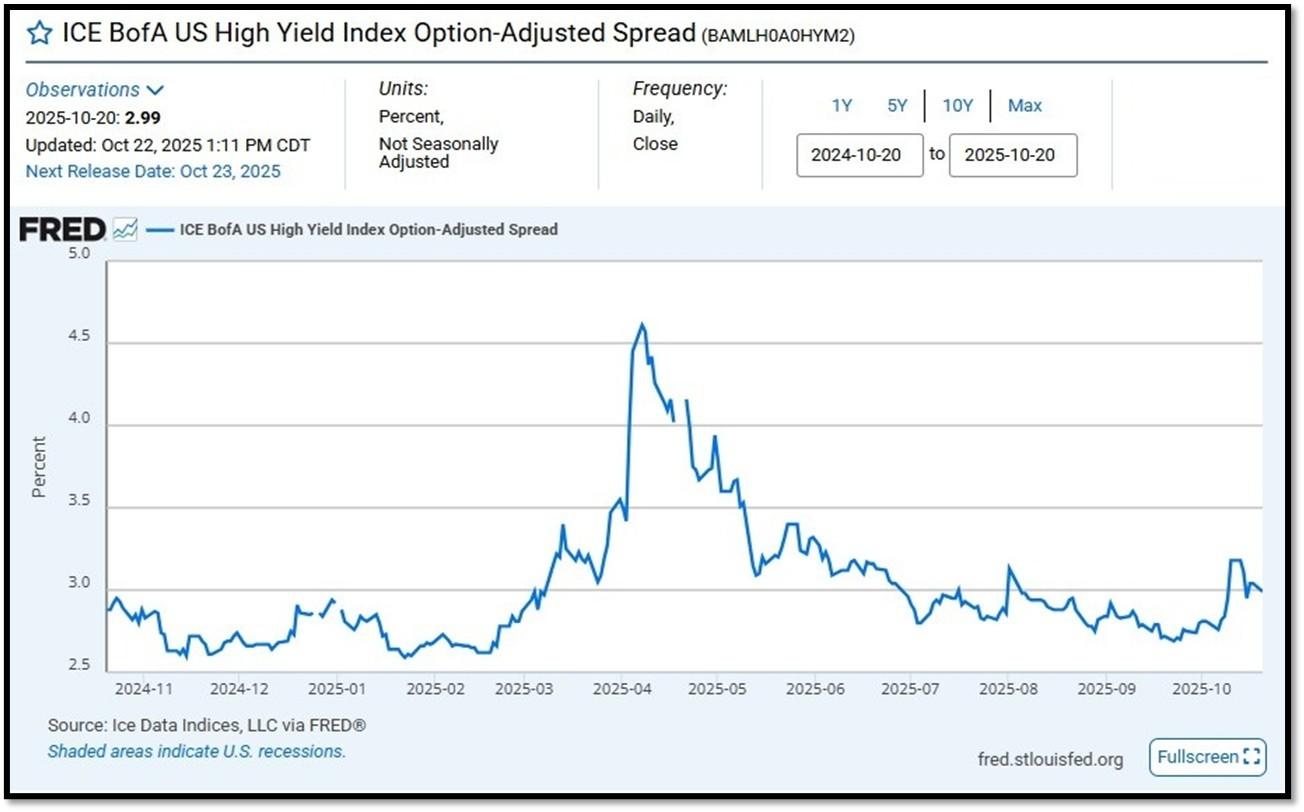
ICE BofA US High Yield Index Option-Adjusted Spread (BAMLH0A0HYM2) currently at 2.99 as of October 22, 2025. This is a key indicator of market sentiment, particularly regarding risk and economic health. At its core, the spread reflects the extra return investors demand to hold riskier corporate debt over safer government securities. High-yield bonds are issued by companies with lower credit ratings (below investment grade, like BB or lower), meaning they carry a higher chance of default. The spread compensates for this risk. When the spread is narrow—say, around 2.5% to 3%, as seen recently—it suggests investors are confident, willing to accept less extra yield because they perceive lower default risk or a strong economy. Narrow spreads often align with bullish markets, where cash is flowing, growth is steady, and fear is low. REF: FRED-BAMLH0A0HYM2
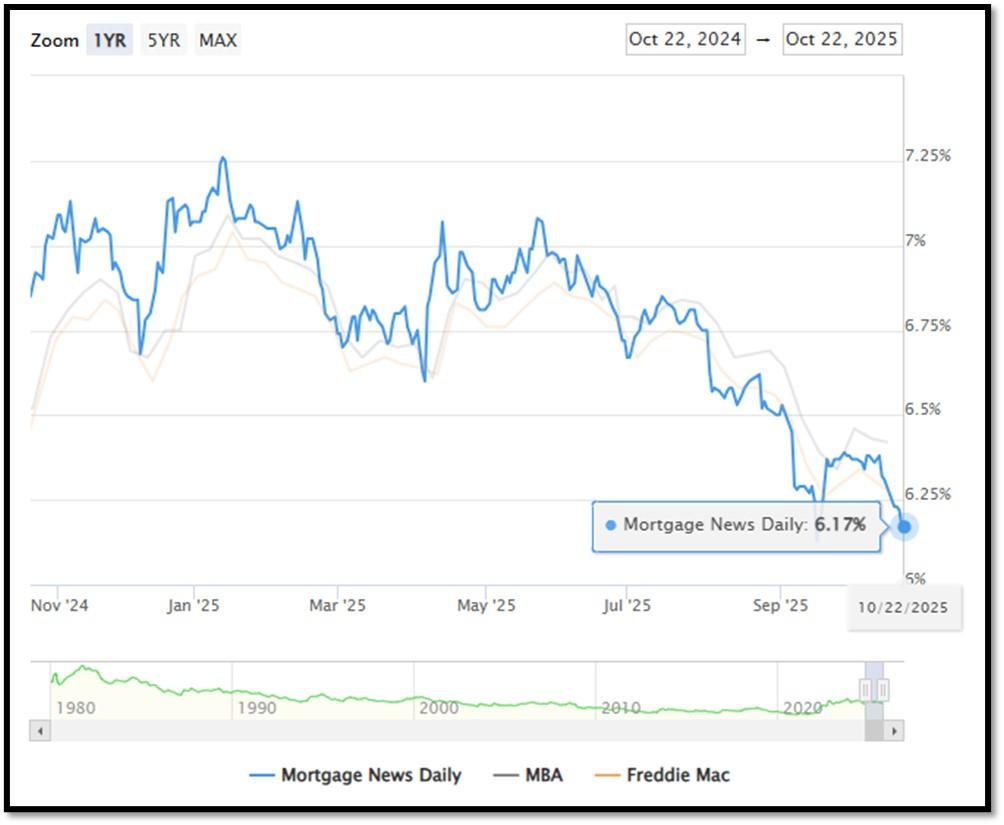
5I. (10/22/2025) Today’s National Average 30-Year Fixed Mortgage Rate is 6.17% (All Time High was 8.03% on 10/19/23). Last week’s data was 6.31%. This rate is the average 30-year fixed mortgage rates from several different surveys including Mortgage News Daily (daily index), Freddie Mac (weekly survey), Mortgage Bankers Association (weekly survey) and FHFA (monthly survey). REF: MortgageNewsDaily, Today’s Average Rate
The recent spike in the 30-year fixed-rate jumbo mortgage to 6.17%, compared to Freddie Mac’s rate at 6.27% and the Mortgage Bankers Association (MBA) rate at 6.42%, highlights key differences in the mortgage market. Jumbo mortgages, which exceed the conforming loan limits set by government agencies like Freddie Mac, typically carry higher interest rates because they are riskier for lenders. These loans are not backed by government entities, which increases the risk for lenders and, consequently, leads to higher rates. In contrast, Freddie Mac and MBA provide averages for conforming loans, which meet federal guidelines and have lower risk due to government backing, keeping their rates lower.
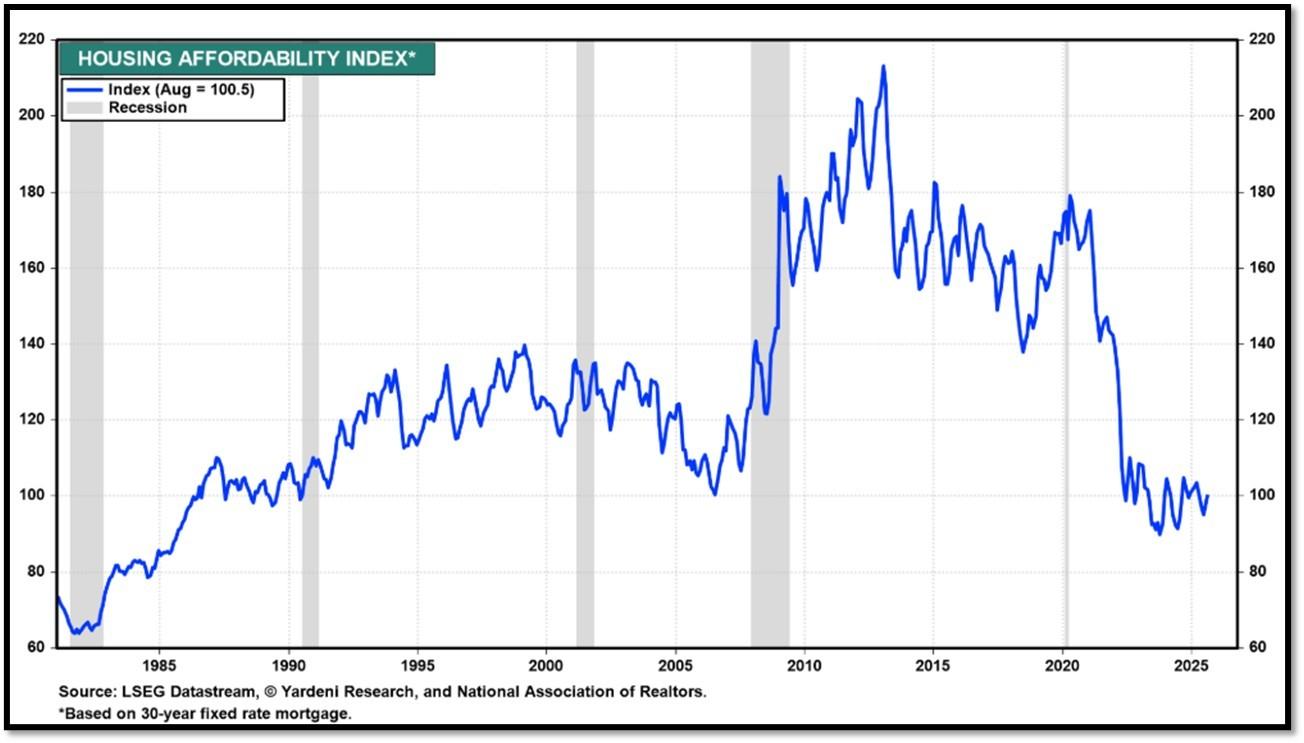
Housing Affordability Index for Aug = 100.5 // July = 98.8 // Jun = 94.4 // May = 97.2 // Apr = 101.0 // Mar = 103.2 // Feb = 102.2. Data provided by Yardeni Research. REF: Yardeni
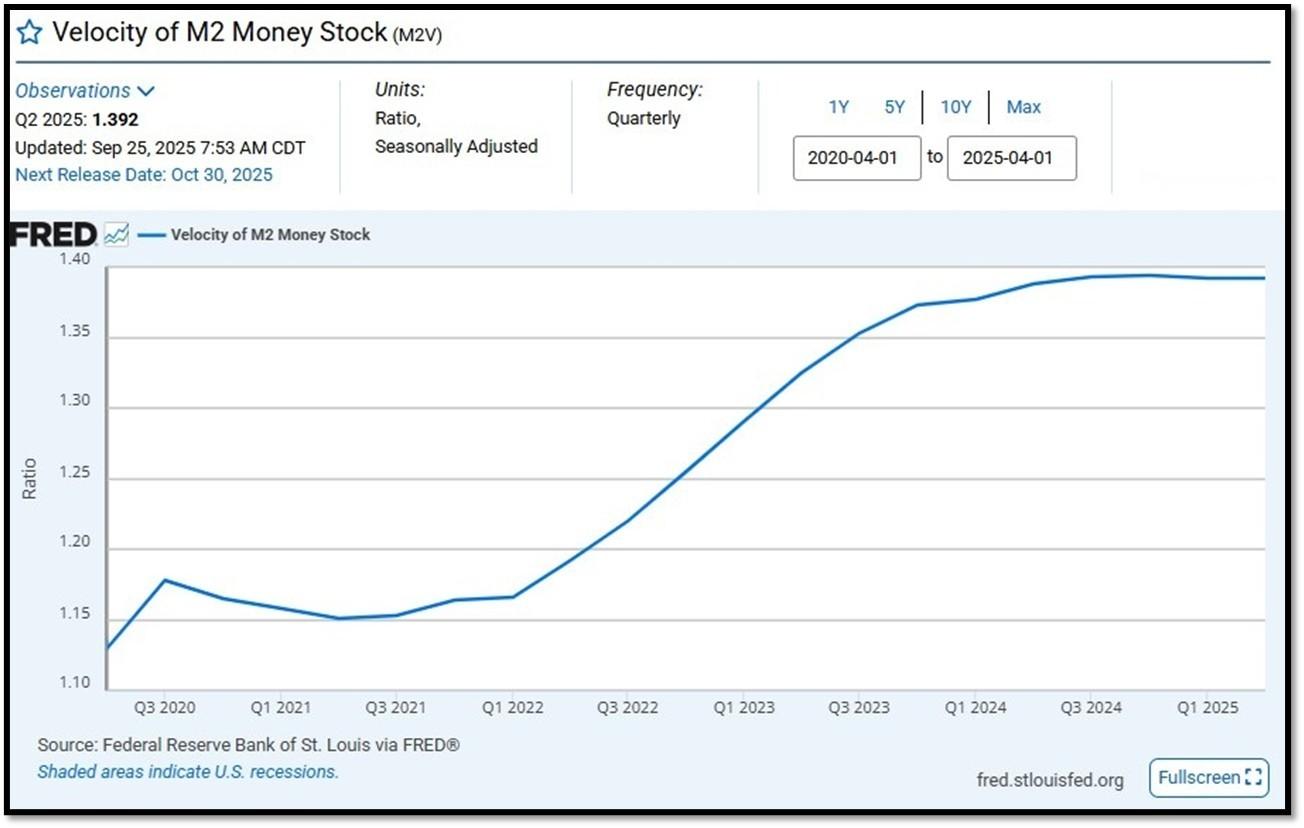
5J. Velocity of M2 Money Stock (M2V) with current read at 1.392 as of (Q2-2025 updated September 25, 2025). Previous quarter’s data was 1.386. The velocity of money is the frequency at which one unit of currency is used to purchase domestically- produced goods and services within a given time period. In other words, it is the number of times one dollar is spent to buy goods and services per unit of time. If the velocity of money is increasing, then more transactions are occurring between individuals in an economy. Current Money Stock (M2) report can be viewed in the reference link. REF: St.LouisFed-M2V
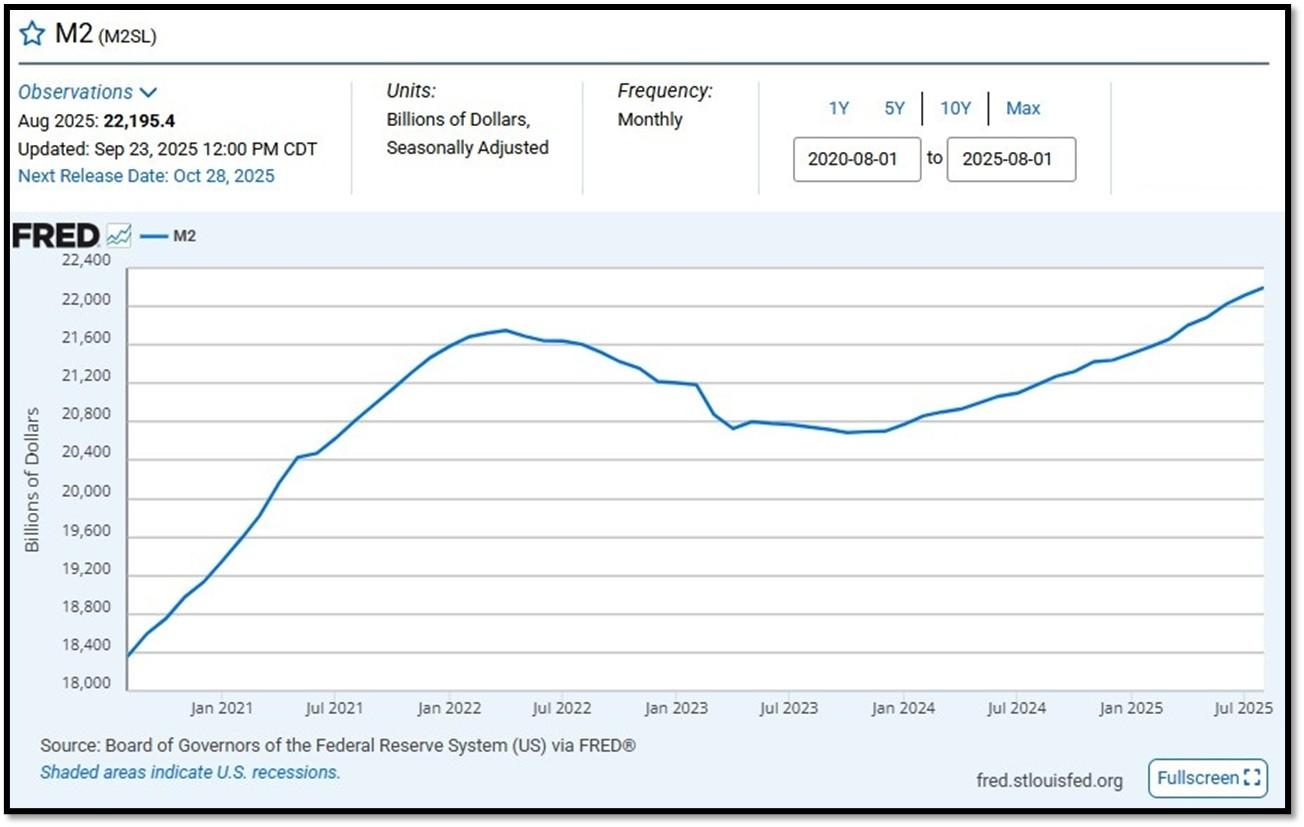
M2 consists of M1 plus (1) small-denomination time deposits (time deposits in amounts of less than $100,000) less IRA and Keogh balances at depository institutions; and (2) balances in retail MMFs less IRA and Keogh balances at MMFs. Seasonally adjusted M2 is constructed by summing savings deposits (before May 2020), small-denomination time deposits, and retail MMFs, each seasonally adjusted separately, and adding this result to seasonally adjusted M1. Board of Governors of the Federal Reserve System (US), M2 [M2SL], retrieved from FRED, Federal Reserve Bank of St. Louis; Updated on September 23, 2025. REF: St.LouisFed-M2
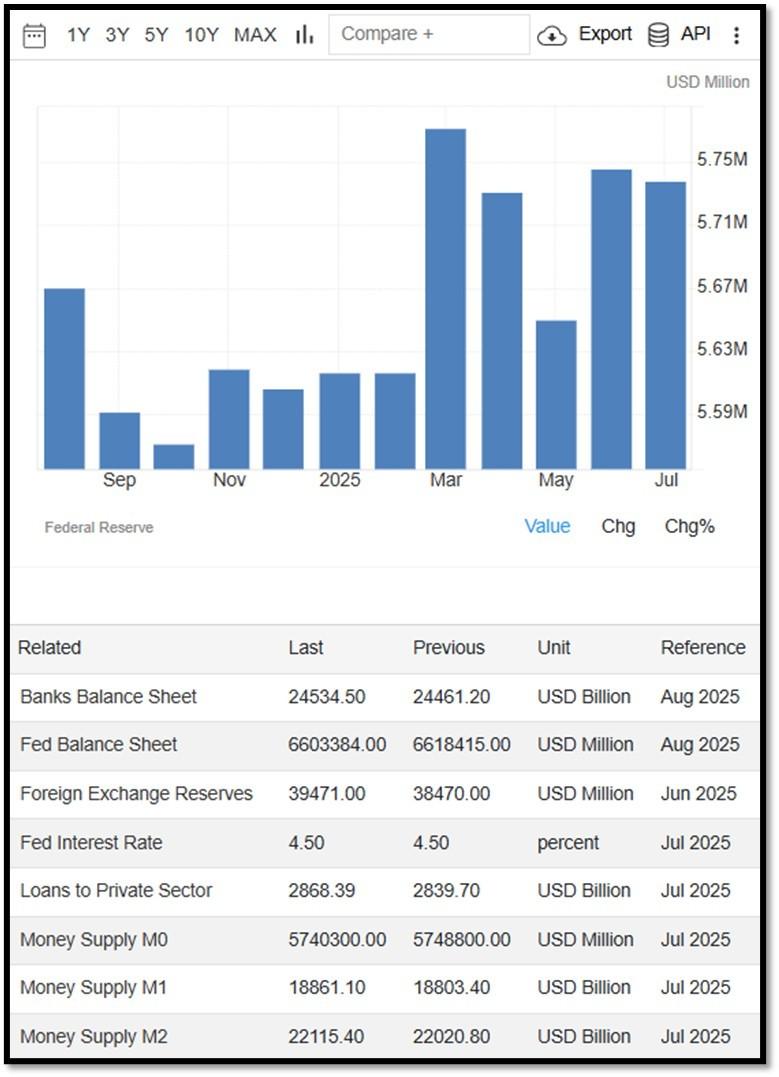
Money Supply M0 in the United States decreased to 5,686,400 USD Million in August from 5,740,300 USD Million in July of 2025. Money Supply M0 in the United States averaged 1,211,562.63 USD Million from 1959 until 2025, reaching an all-time high of 6,413,100.00 USD Million in December of 2021 and a record low of 484,00.00 USD Million in February of 1961.. REF: TradingEconomics, M0
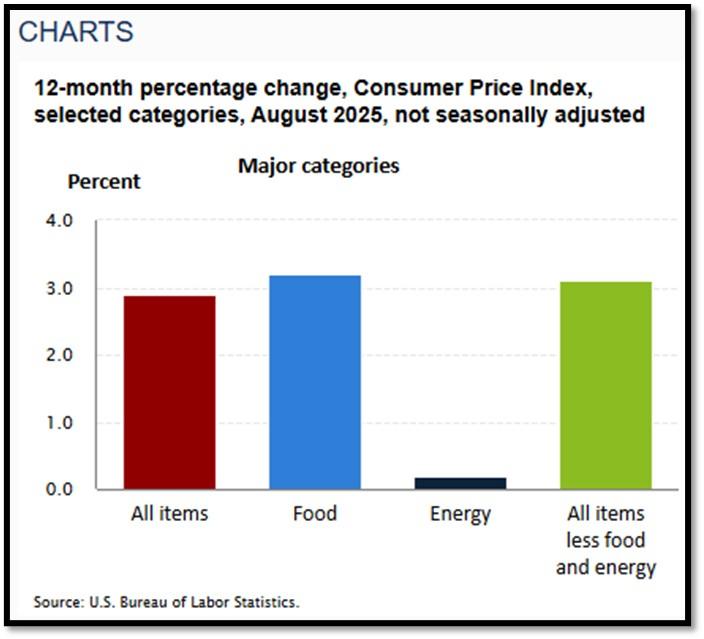
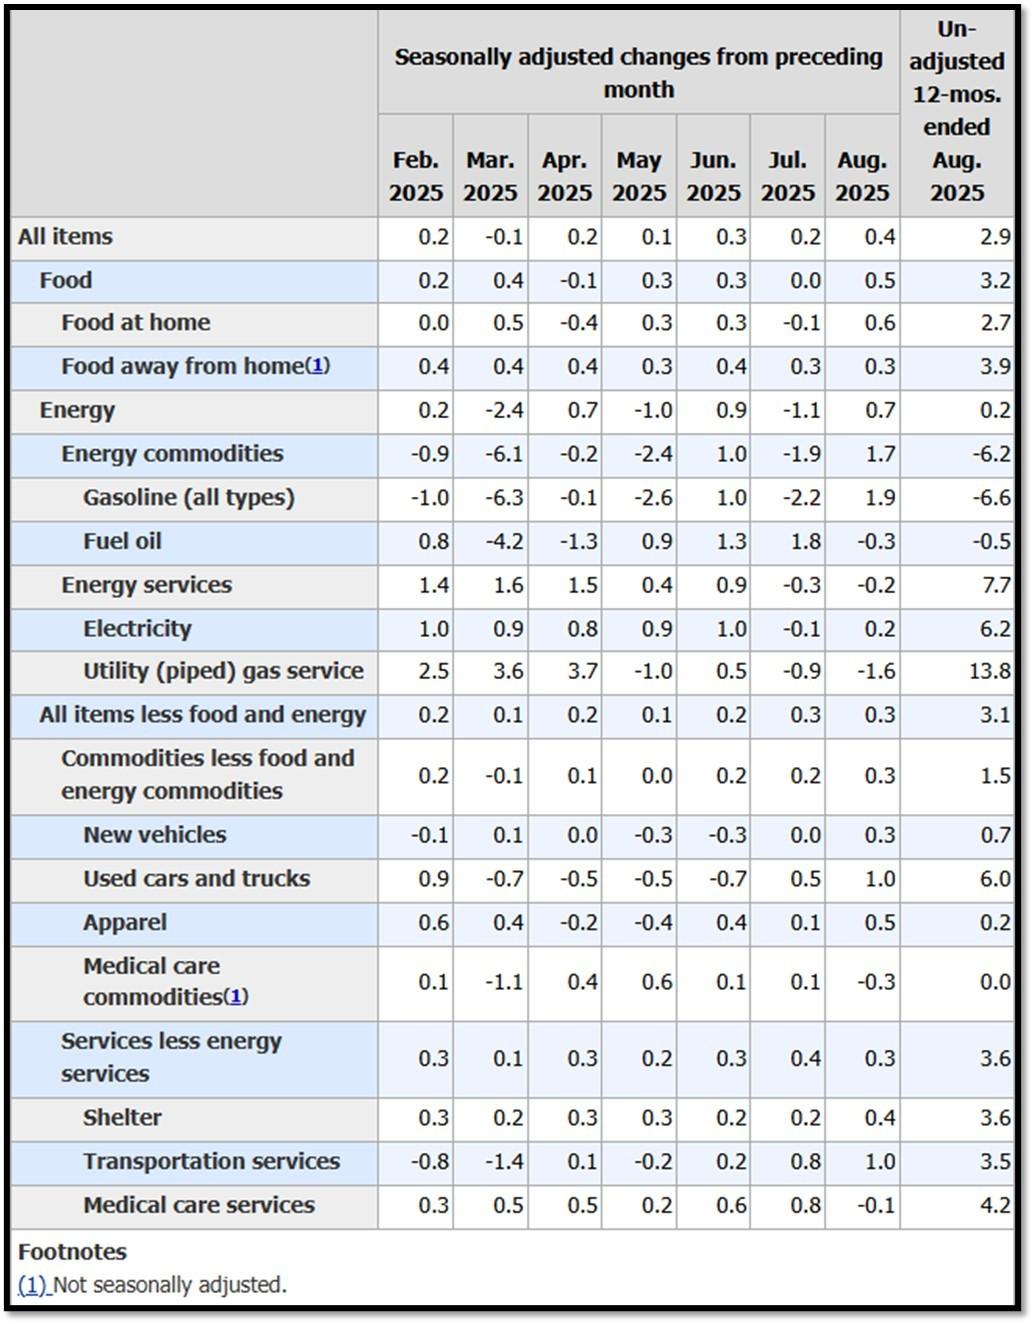
5K. In August, the Consumer Price Index for All Urban Consumers rose 0.4 percent, seasonally adjusted, and rose 2.9 percent over the last 12 months, not seasonally adjusted. The index for all items less food and energy increased 0.3 percent in August (SA); up 3.1 percent over the year (NSA). September 2025 CPI data are scheduled to be released on October 24, 2025, at 8:30AM-ET. REF: BLS, BLS.GOV
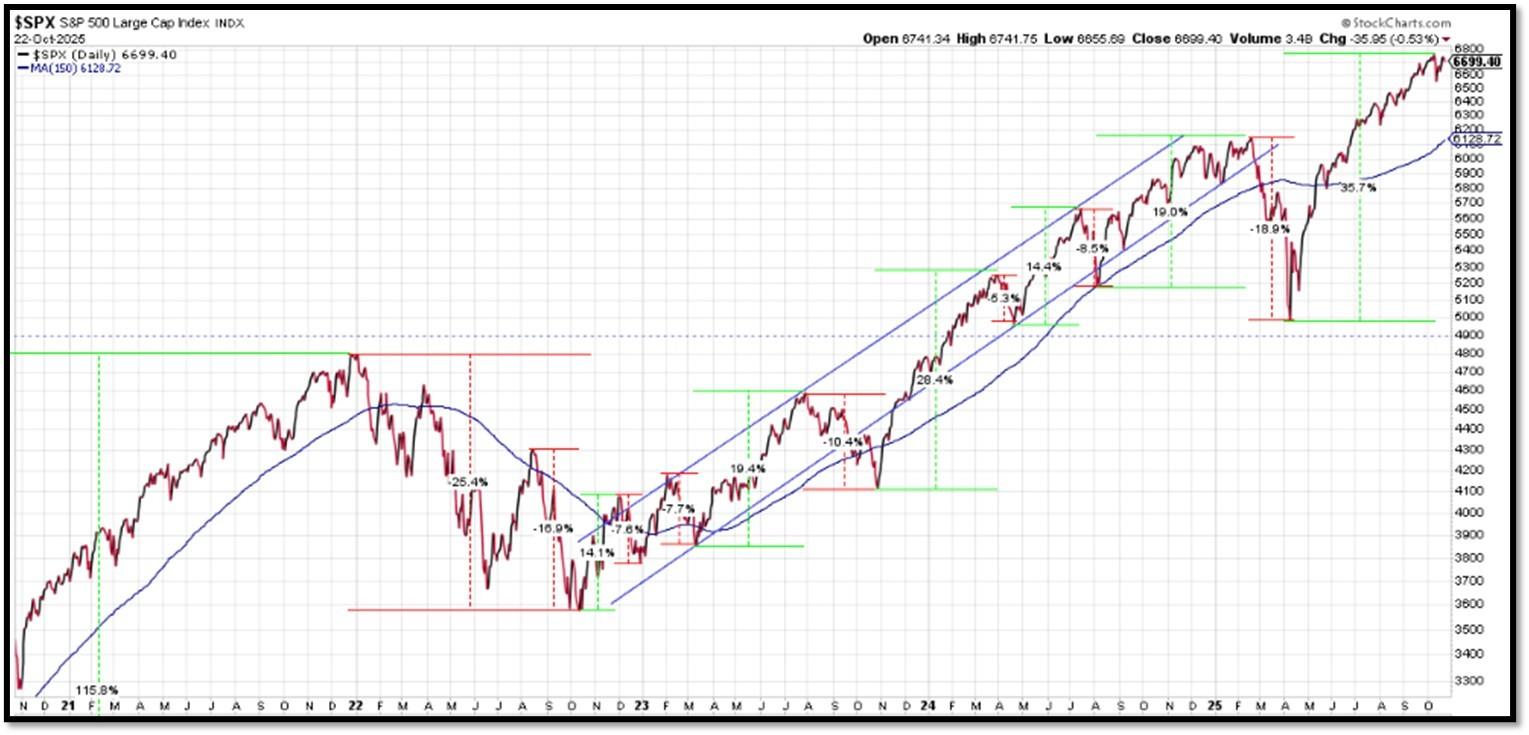
5L. Technical Analysis of the S&P500 Index. Click onto reference links below for images.
- Short-term Chart: Trend Less Bullish on 10/22/2025 – REF: Short-term S&P500 Chart by Marc Slavin (Click Here to Access Chart)
- Medium-term Chart: Trend Bullish on 10/22/2025 – REF: Medium-term S&P500 Chart by Marc Slavin (Click Here to Access Chart)
- Market Timing Indicators – S&P500 Index as of 10/22/2025 – REF: S&P500 Charts (7 of them) by Joanne Klein’s Top 7 (Click Here to Access Updated Charts)
- The S&P500 is hitting all-time-high, rebounding from a V-shaped recovery to all-time high. REF: Stockcharts
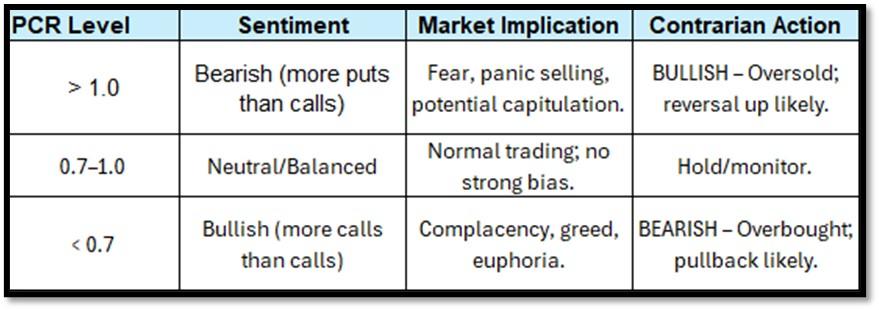
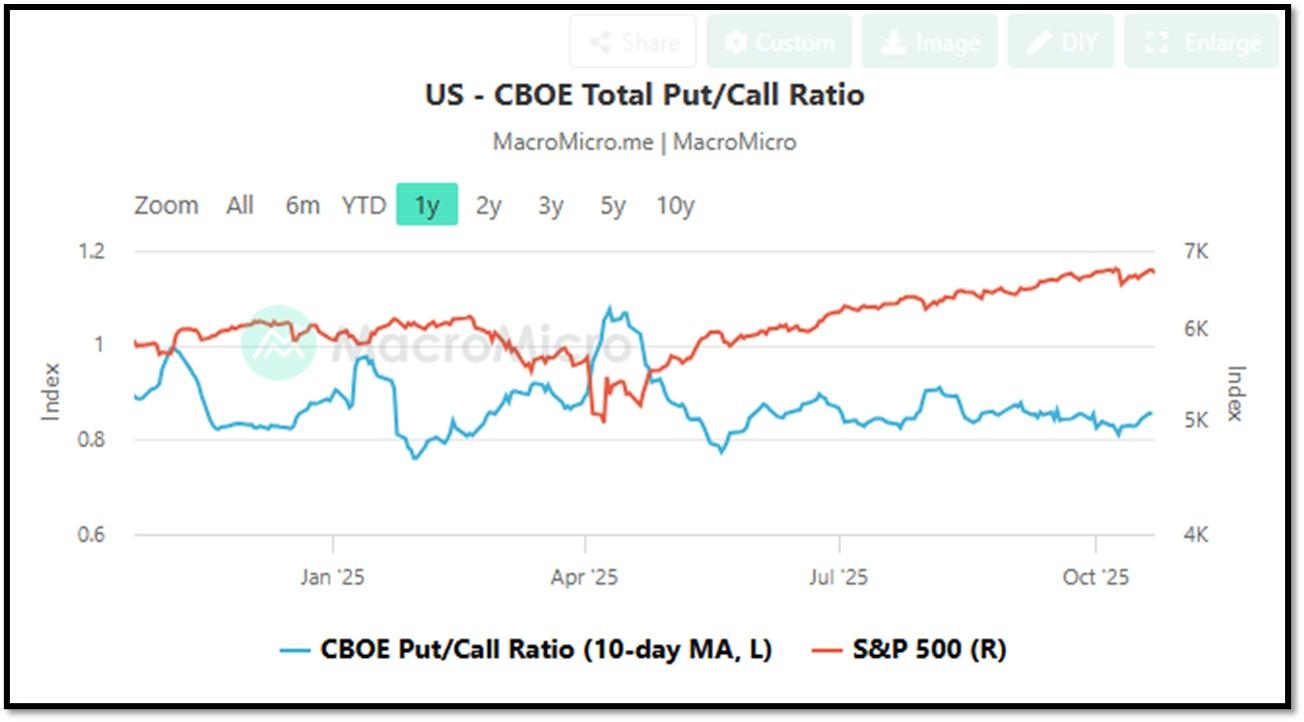
- CBOE Total Put/Call Ratio as of 10/22/2025. REF: MacroMicro
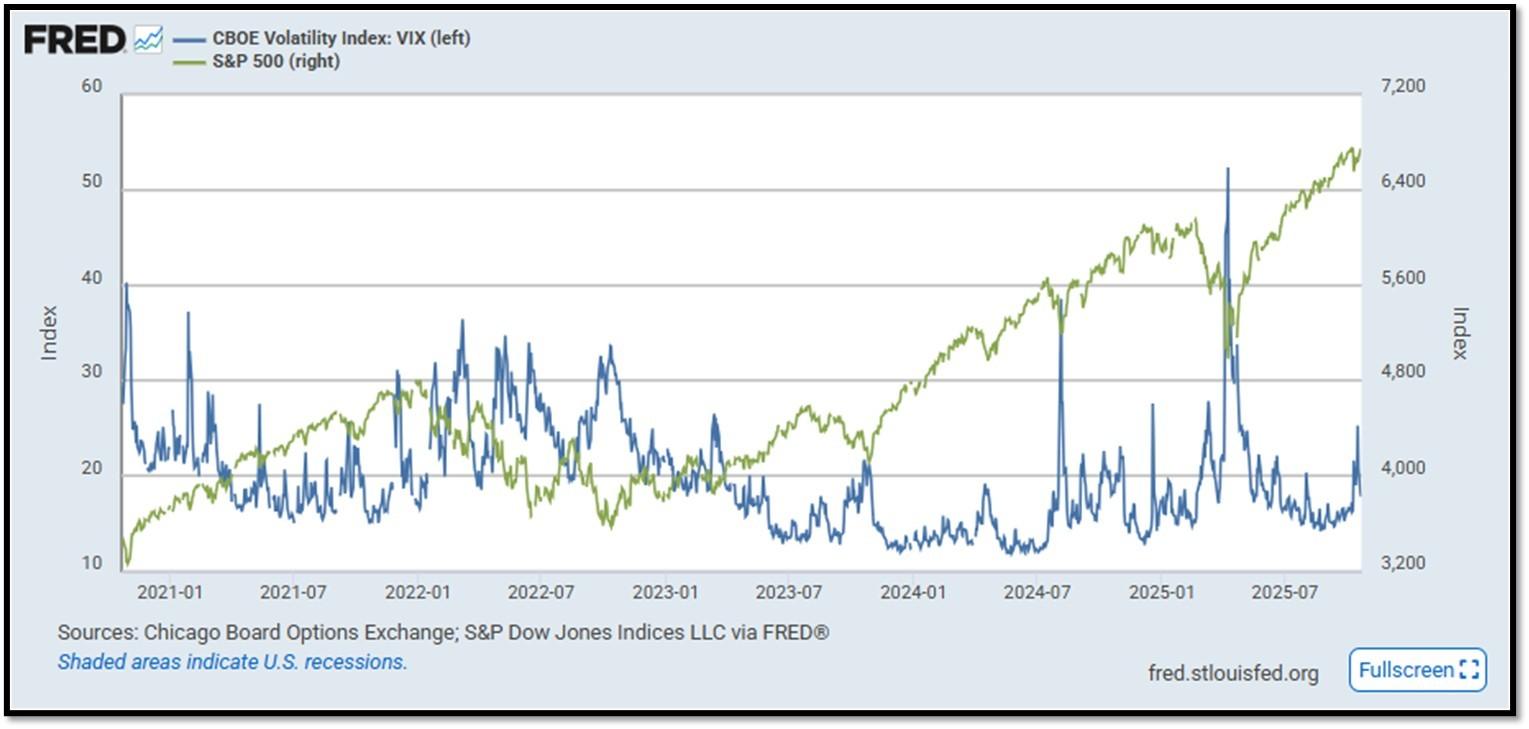
- S&P500 and CBOE Volatility Index (VIX) as of 10/21/2025. REF: FRED, Today’s Print
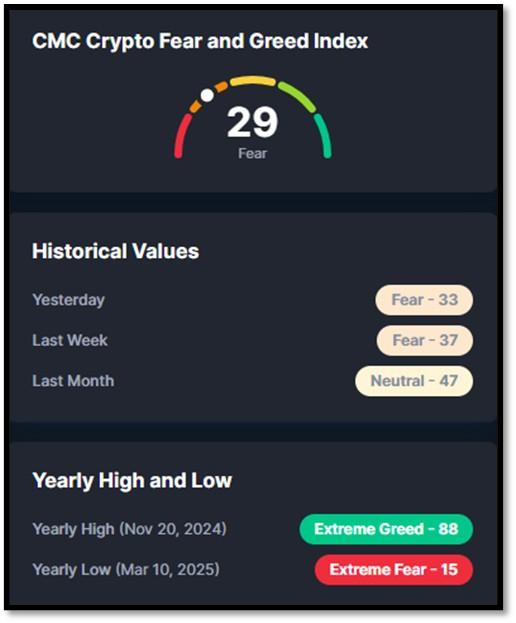
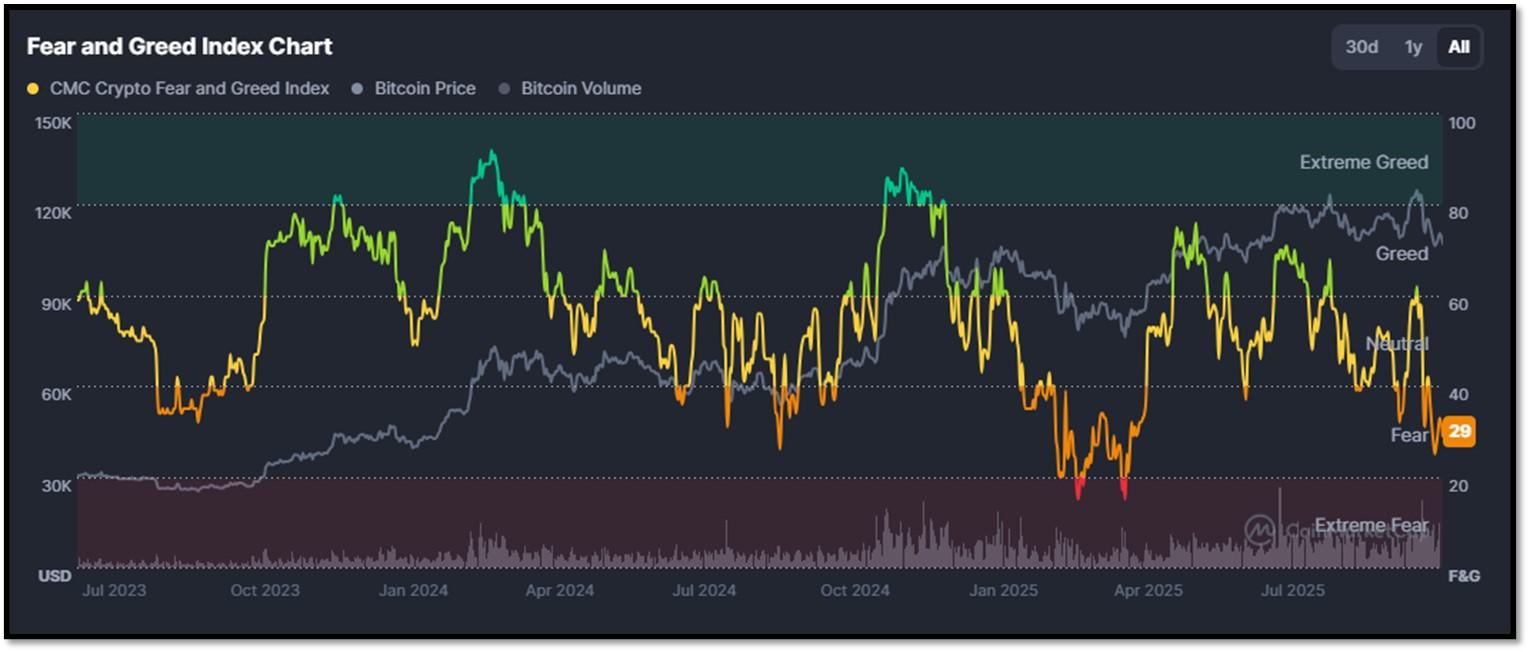
5M. Most recent read on the Crypto Fear & Greed Index with data as of 10/22/2025 is 42 (Neutral). Last week’s data was 62 (Greed) (1-100). Fear & Greed Index – A Contrarian Data. The crypto market behavior is very emotional. People tend to get greedy when the market is rising which results in FOMO (Fear of missing out). Also, people often sell their coins in irrational reaction of seeing red numbers. With the Crypto Fear and Greed Index, the data try to help save investors from their own emotional overreactions. There are two simple assumptions:
- Extreme fear can be a sign that investors are too worried. That could be a buying opportunity.
- When Investors are getting too greedy, that means the market is due for a correction.
Therefore, the program for this index analyzes the current sentiment of the Bitcoin market and crunch the numbers into a simple meter from 0 to 100. Zero means “Extreme Fear”, while 100 means “Extreme Greed”. REF: Coinmarketcap.com, Today’sReading
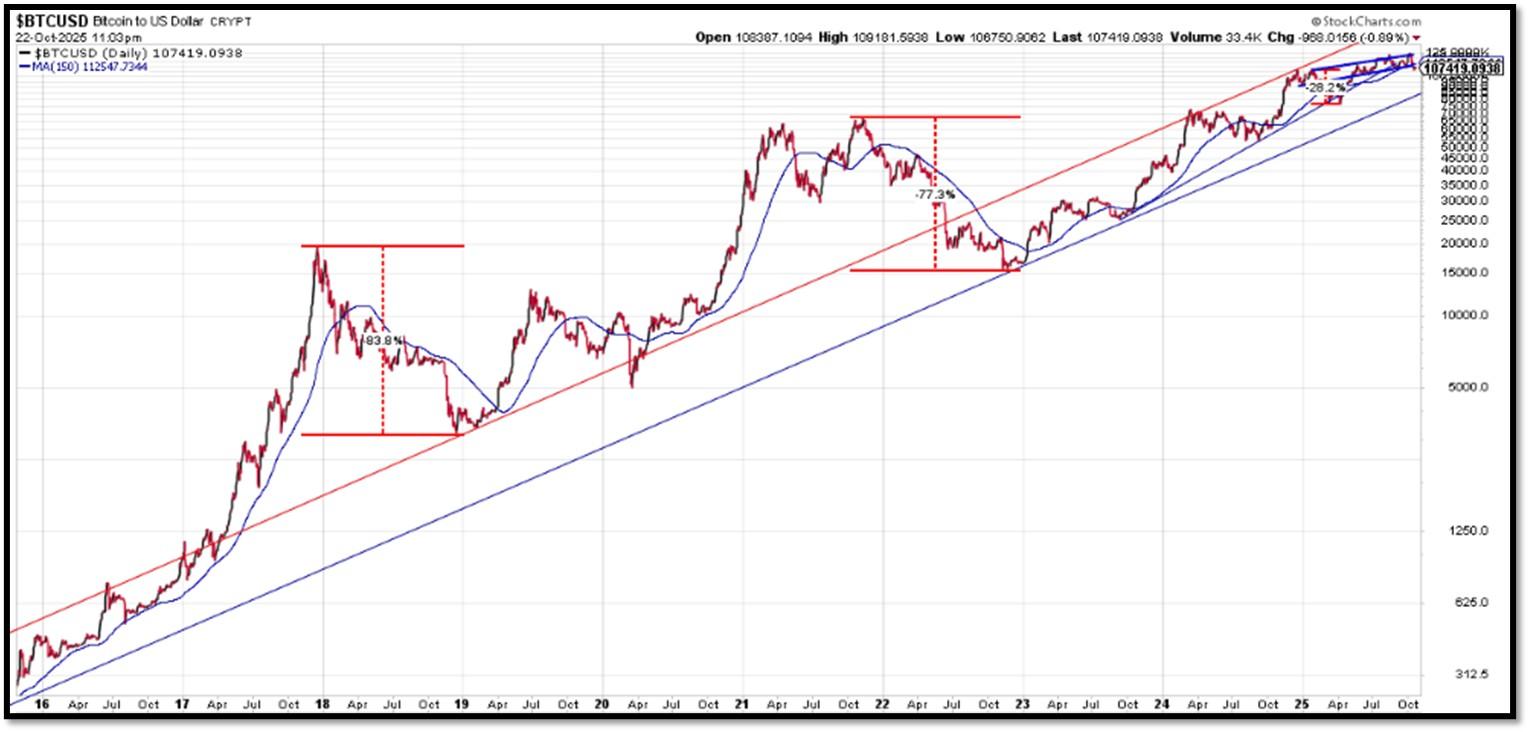
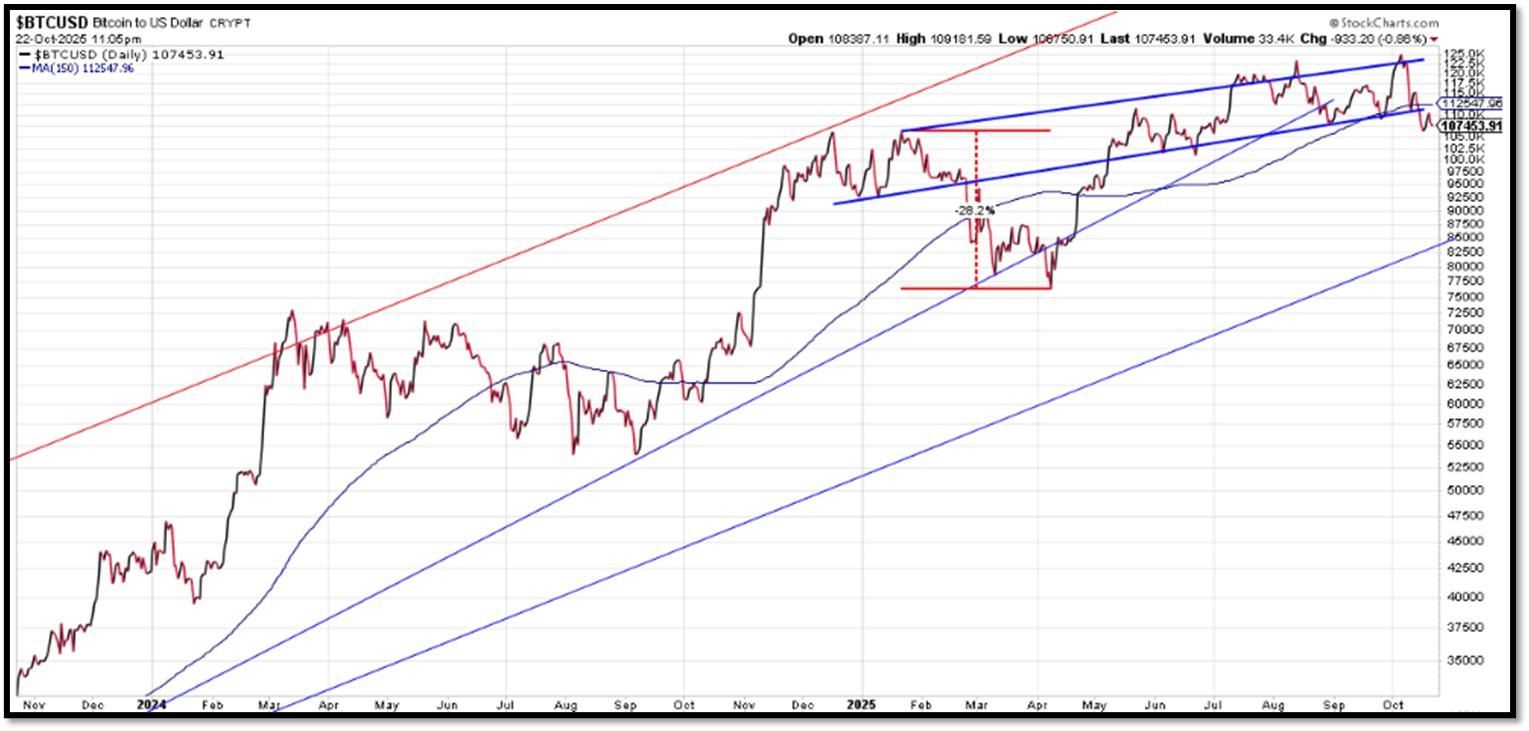
Bitcoin – 10-Year & 2-Year Charts. REF: Stockcharts10Y, Stockcharts2Y
From the desk of our Chief Investment Officer
As an investment professional with over twenty-six years of experience in the financial services industry, Andrew helps clients to protect, grow and transfer wealth during their lifetime with objective, unbiased, customized and efficient strategies.
Education, Professional Licenses Acquired & Affiliations
- Passed the Series 7, 63, 65 and 24 license examinations
- Currently holding Series 65 License
- BA in Economics – Boston University (Boston, MA) 1993
- Certificate in Commodities Trading – New York University (New York, NY) 1991
- Certificate in Financial Planning – New York University (New York, NY) April 2011
With extensive experience in the Financial Services Industry, Andrew Tang and Turner Financial Group provides disciplined wealth management with an intelligent caring approach to each and every client that compliments the Dedicated Financial offering.


Len writes much of his own content, and also shares helpful content from other trusted providers like Turner Financial Group (TFG).
The material contained herein is intended as a general market commentary, solely for informational purposes and is not intended to make an offer or solicitation for the sale or purchase of any securities. Such views are subject to change at any time without notice due to changes in market or economic conditions and may not necessarily come to pass. This information is not intended as a specific offer of investment services by Dedicated Financial and Turner Financial Group, Inc.
Dedicated Financial and Turner Financial Group, Inc., do not provide tax, legal or accounting advice. You should consult your own tax, legal and accounting advisors before engaging in any transaction.
Any hyperlinks in this document that connect to Web Sites maintained by third parties are provided for convenience only. Turner Financial Group, Inc. has not verified the accuracy of any information contained within the links and the provision of such links does not constitute a recommendation or endorsement of the company or the content by Dedicated Financial or Turner Financial Group, Inc. The prices/quotes/statistics referenced herein have been obtained from sources verified to be reliable for their accuracy or completeness and may be subject to change.
Past performance is no guarantee of future returns. Investing involves risk and possible loss of principal capital. The views and strategies described herein may not be suitable for all investors. To the extent referenced herein, real estate, hedge funds, and other private investments can present significant risks, including loss of the original amount invested. All indexes are unmanaged, and an individual cannot invest directly in an index. Index returns do not include fees or expenses.
Turner Financial Group, Inc. is an Investment Adviser registered with the United States Securities and Exchange Commission however, such registration does not imply a certain level of skill or training and no inference to the contrary should be made. Additional information about Turner Financial Group, Inc. is also available at www.adviserinfo.sec.gov. Advisory services are only offered to clients or prospective clients where Turner Financial Group, Inc. and its representatives are properly licensed or exempt from licensure. No advice may be rendered by Turner Financial Group, Inc. unless a client service agreement is in place.


