

- 1. Government shutdowns in the U.S. are largely viewed as political posturing rather than economic crises, which is why markets rarely react meaningfully.
- 2. Main story this week is the BG2 podcast episode featuring NVIDIA CEO Jensen Huang, hosted by Brad Gerstner and Clark Tang, the discussion at timestamp (56:55) delves into Elon Musk’s pivotal role in advancing AI infrastructure, spotlighting his xAI venture and the groundbreaking Colossus supercluster.
- 3. The Bluerock Total Income+ Real Estate Fund (TI+), a popular interval fund among many of our investors for its consistent 5.25% annual dividend yield and stable performance, has reached a transformative milestone.
- 4. World Watch
- 4A. Shenzhen (China) is often called the “Silicon Valley of the East” because of its unmatched concentration of innovation, manufacturing, and futuristic city planning — a reputation vividly captured in the video shown below.
- 4B. The OECD’s Interim Economic Outlook for September 2025 highlights a fragile global economic landscape marked by softening growth and stalled disinflation, particularly in emerging markets and the United States.
- 4C. An updated snapshot of the current global state of economy.
- 5. Quant & Technical Corner – A selection of quantitative & technical data we monitor on a regular basis to help gauge the overall financial market conditions and the investment environment.
1. Government shutdowns in the U.S. are largely viewed as political posturing rather than economic crises, which is why markets rarely react meaningfully.
While they may cause short-term disruptions to government services or delay data releases, shutdowns are typically brief and resolved without lasting harm to corporate earnings or the broader economy. Investors, focused on fundamentals such as interest rates, inflation, profits, and global growth, largely dismiss the drama as noise. With the limited economic impact already priced in and expectations that shutdowns are temporary standoffs, Wall Street tends to treat them as routine inconveniences rather than systemic risks.
What stands out this week is the dramatic downward revision in ADP’s September private-sector employment data, shifting from an initially reported +11,000 jobs to an actual loss of −32,000. For August, initial reporting of +54,000 jobs were revised down to -3,000. Such swings not only highlights a sudden stalling in hiring but also raises concerns about the reliability of preliminary figures, which increasingly prove outlandish when later revised. Since employment is a cornerstone for gauging economic health and guiding Federal Reserve policy, these wild adjustments undermine confidence in the data and complicate market interpretation, making it clear that early estimates should be taken with caution. Click onto picture below to access video. REF: WSJ, NBC, CNBC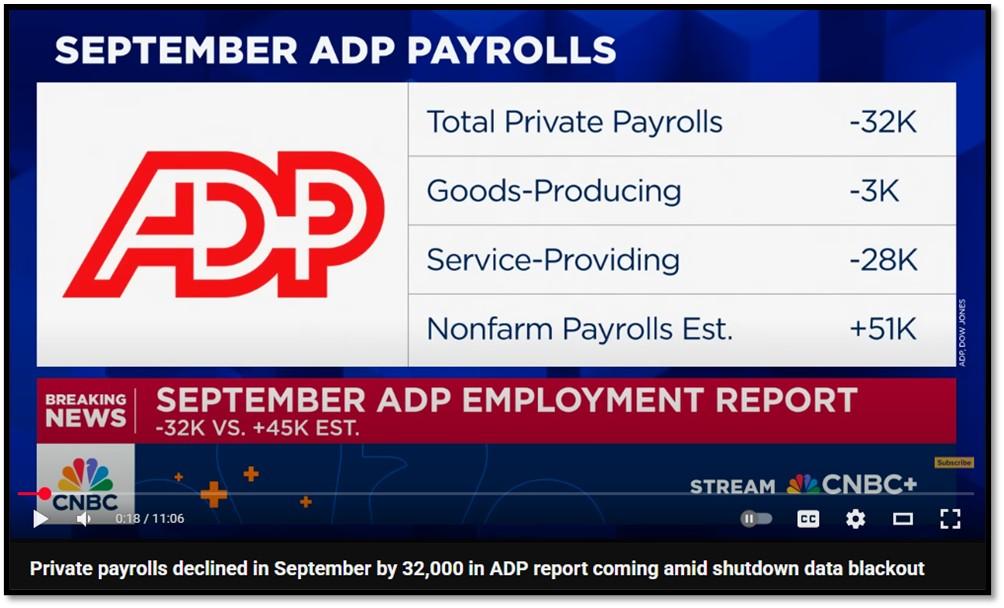
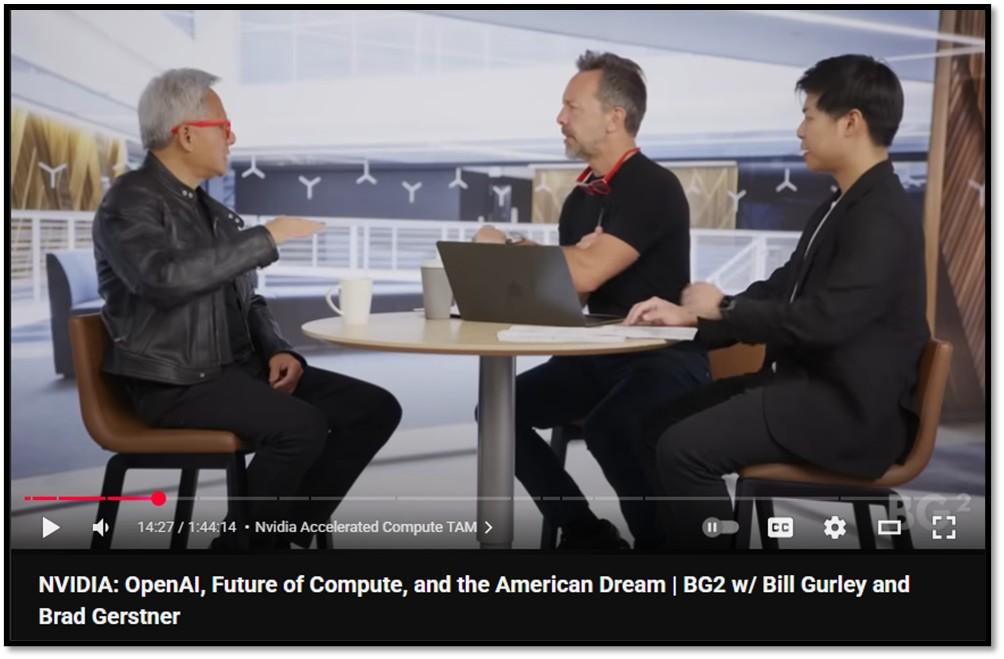
2. Main story this week is the BG2 podcast episode featuring NVIDIA CEO Jensen Huang, hosted by Brad Gerstner and Clark Tang, the discussion at timestamp (56:55) delves into Elon Musk’s pivotal role in advancing AI infrastructure, spotlighting his xAI venture and the groundbreaking Colossus supercluster.
Huang lavishes praise on Musk, dubbing him “the ultimate GPU” and a “big GPT himself” for his unparalleled blend of urgency, skill, and vision that propels extraordinary feats. A standout highlight is xAI’s assembly of a 100,000-GPU supercluster in Memphis (Colossus) in a mere 19 days, a task that conventionally demands at least a year, marking what Huang calls a “singularity moment” in engineering. This rapid deployment not only accelerates training for models like Grok 3 but also underscores Musk’s systems-level mastery, drawing parallels to Tesla’s innovative ethos in scaling autonomous driving and robotics, where similar bold timelines have redefined industry benchmarks.
- Huang’s admiration for Musk’s engineering prowess emphasizes how xAI’s Colossus positions it as a formidable contender in the AI race, potentially rivaling hyperscalers like OpenAI.
- The conversation ties Musk’s xAI efforts to broader Tesla synergies, such as leveraging NVIDIA hardware for Full Self-Driving (FSD) advancements and Optimus robots, hinting at a unified vision for AI-driven mobility and labor transformation.
- Later segments, like (1:37:40) on the future ahead, frame Musk’s initiatives as catalysts for sovereign AI buildouts, where Tesla’s global footprint could integrate with national AI strategies to bolster economic resilience.
- Amid discussions on the AI Administration (1:02:21) and talent via H-1B visas (1:17:24), Musk emerges as a champion of the American Dream, advocating for immigrant innovation—much like his own journey—to fuel Tesla’s and xAI’s growth, ensuring U.S. leadership against Chinese AI chips (1:07:43).
- Overall, the interview portrays Musk not just as a disruptor but as an indispensable architect of AI’s economic reshaping, with Tesla at the vanguard of democratizing accelerated computing for the “American right to rise” (1:29:33). Click onto to picture below to access video. REF: Bg2Pod, Colossus
(0:37) The Year in AI Recap
(3:24) OpenAI Stargate & Nvidia Investment
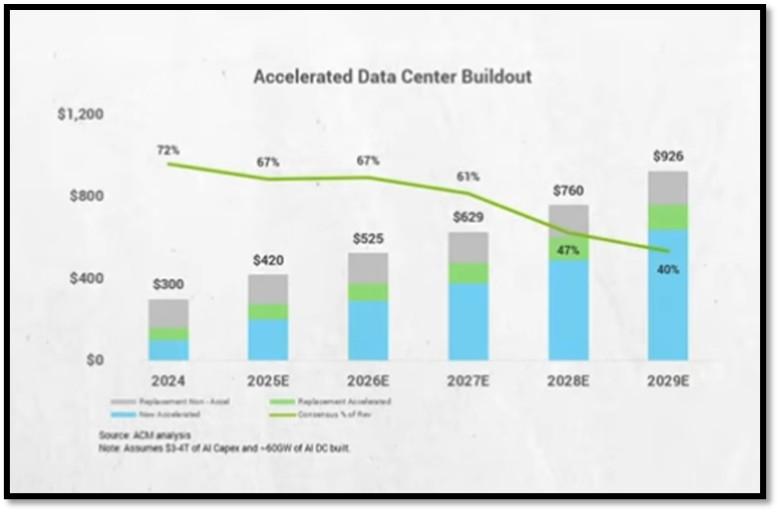
(8:41) Nvidia Accelerated Compute TAM
(18:55) $NVDA ROI – Glut or Bubble?
(27:45) Roundtripping Claims
(31:10) Annual Release Cadence & Extreme Co-design
(40:45) Future of ASICs & Economics
(53:47) Nvidia’s Competitive Moat
(56:55) Elon, X.ai & Colossus 2
(58:47) Sovereign AI & Global Buildout
(1:02:21) The AI Administration
(1:07:43) Chinese AI Chips & NVIDIA’s Role
(1:17:24) H-1B, Talent, & the American Dream
(1:29:33) Invest America & American Right to Rise
(1:37:40) The Future Ahead
3. The Bluerock Total Income+ Real Estate Fund (TI+), a popular interval fund among many of our investors for its consistent 5.25% annual dividend yield and stable performance, has reached a transformative milestone.
On September 25, 2025, shareholders overwhelmingly approved a proposal to list TI+ on the New York Stock Exchange (NYSE), with over 81% of votes in favor, as endorsed by independent proxy advisory firms Institutional Shareholder Services Inc. and Glass Lewis & Co., alongside the Fund’s Board of Trustees. This strong vote of confidence underscores the belief that listing on the NYSE is the optimal path to maximize the fund’s value, enhancing its appeal for investors who have long valued its daily purchase availability, quarterly redemptions, and diversified real estate portfolio.
Scheduled for mid-December 2025, the NYSE listing is poised to make TI+ the largest real estate listed closed-end fund globally, a significant achievement for a fund already recognized for its stability. The transition will introduce full daily liquidity, a major shift from the current quarterly redemption structure, and is expected to enhance total return potential, offering investors greater flexibility and growth opportunities. This move reflects Bluerock’s commitment to evolving the fund to meet investor needs while maintaining its focus on income-generating real estate assets. As the listing approaches, investors are encouraged to assess their positions to capitalize on this new chapter for TI+, which promises to elevate its standing in the competitive landscape of real estate investment funds. REF: BlueRock, Sep-Update

NOTE: Not investment advice or recommendations. Investors should carefully consider the investment objectives, risks, charges, and expenses before investing. For additional information about the securities mentioned above or in the video, please visit the respective companies’ investor relations pages or the websites of the companies discussed. Please read all materials carefully before investing.
With the current macro-economic backdrop, below are areas we currently favor:
- Fixed Income – (Corporates & Muni) High Yield as Opportunistic Allocation (Low-Beta)
- Fixed Income – Short-term Corporates & Muni (Low-Beta)
- Businesses that contribute to and benefit from AI & Automation (Market-Risk)
- India & China-Tech (Market-Risk)
- Fintech & Financials (Market-Risk)
- Digital Asset – Bitcoin (Market-Risk/Hedge)
- Neo-Cloud Computing (Market-Risk)
- Cyber-Security & Software (Market-Risk)
- Quantum Computing (Market-Risk)
4. World Watch
4A. Shenzhen (China) is often called the “Silicon Valley of the East” because of its unmatched concentration of innovation, manufacturing, and futuristic city planning — a reputation vividly captured in the video shown below.
Once a small fishing village, Shenzhen has transformed into a global tech powerhouse where cutting-edge ideas move rapidly from concept to market. The video showcases how the city blends high-rise modernity with smart infrastructure, from driverless trains and cashless payments to drone light shows and AI-powered experiences, offering visitors a glimpse into why Shenzhen is considered one of the most advanced and high-tech urban experiences on Earth. Click onto picture below to access video. REF: J&E

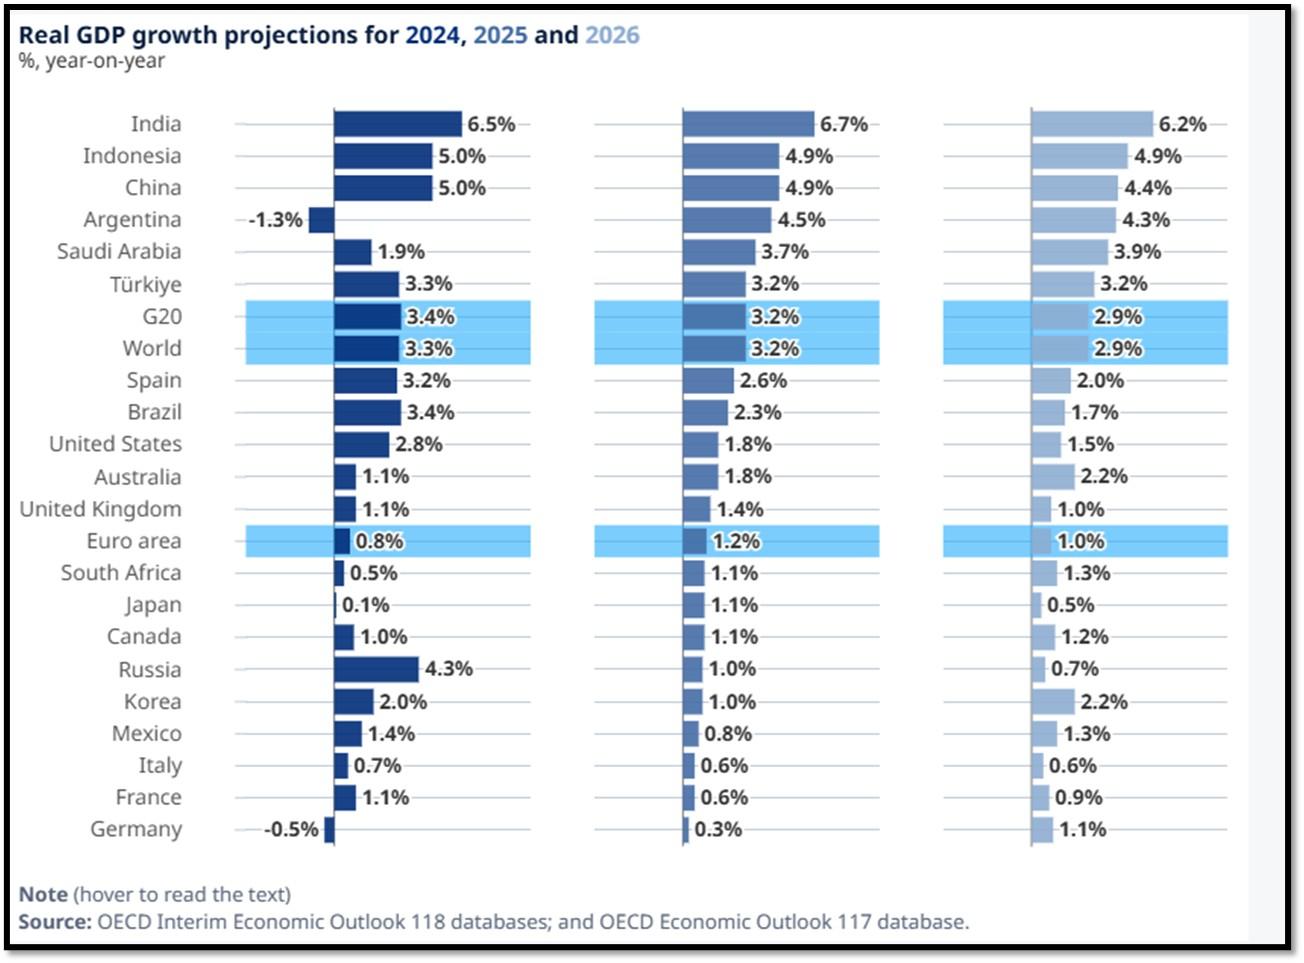
4B. The OECD’s Interim Economic Outlook for September 2025 highlights a fragile global economic landscape marked by softening growth and stalled disinflation, particularly in emerging markets and the United States.
OECD stands for Organization for Economic Co-operation and Development. The report notes that industrial production and trade have been temporarily boosted by front-loading in anticipation of higher U.S. tariffs, which reached an effective rate of 19.5% by August 2025, the highest since the mid-1930s. These tariffs are already influencing consumer behavior, labor markets, and prices, with softening labor markets evidenced by rising unemployment and fewer job openings, while persistent services inflation and rising food prices have halted disinflation in many economies. Looking forward, the OECD warns of significant downside risks, including further tariff hikes, fiscal uncertainties, and renewed inflation pressures, which could dampen growth, alongside potential financial instability from volatile crypto-assets. However, easing trade restrictions or accelerated AI advancements could provide upside potential for stronger economic outcomes. Below are key points mentioned in the report. Click onto the reference link to access the report. REF: OECD-Interim-Economic-Outlook, OECD
- Global Growth Remains Resilient…
- Inflation is Set to Ease but Risks Linger…
- The Full Effect of Tariff Increases have Yet to be Felt…
- Policymakers can:
- Promote transparency and predictability in trade policy…
- Monetary policy should remain vigilant…
- Governments need to safeguard fiscal sustainability…
- Stronger structural reforms are needed to boost growth and harness benefits from AI…
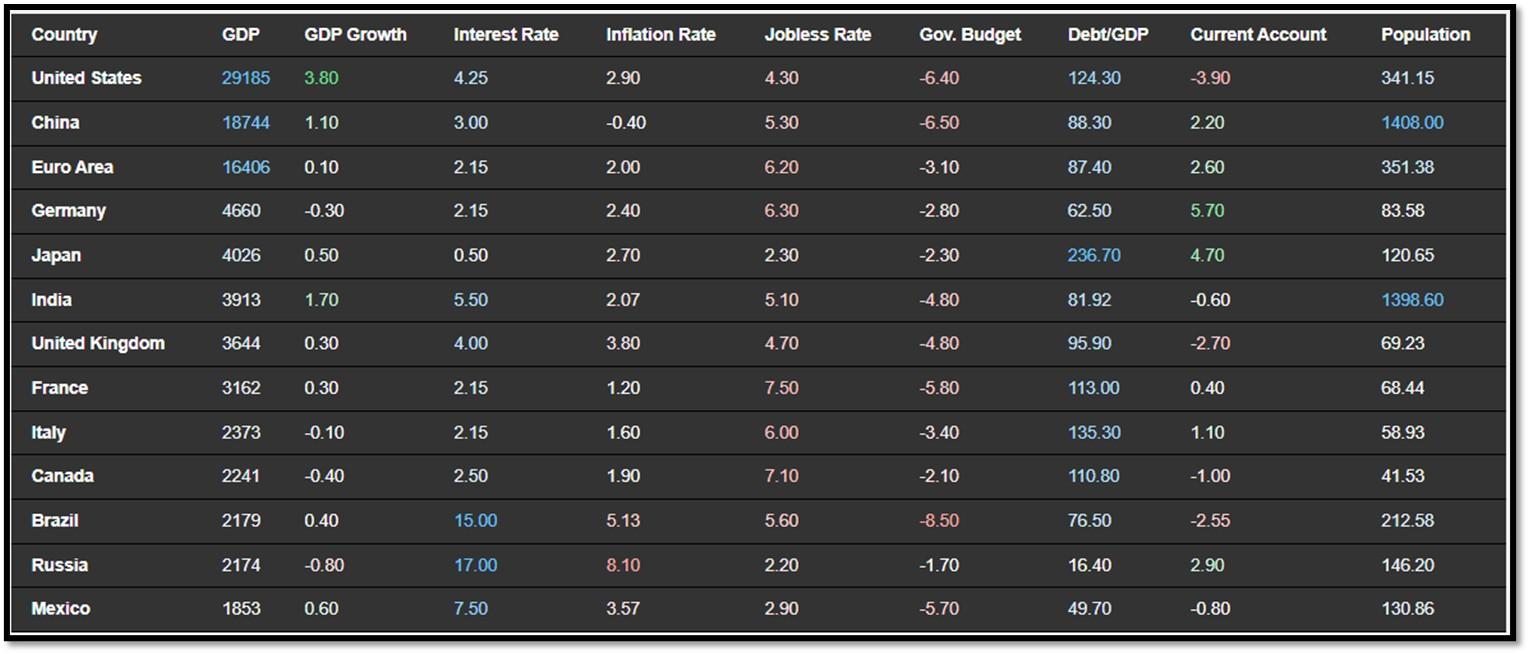
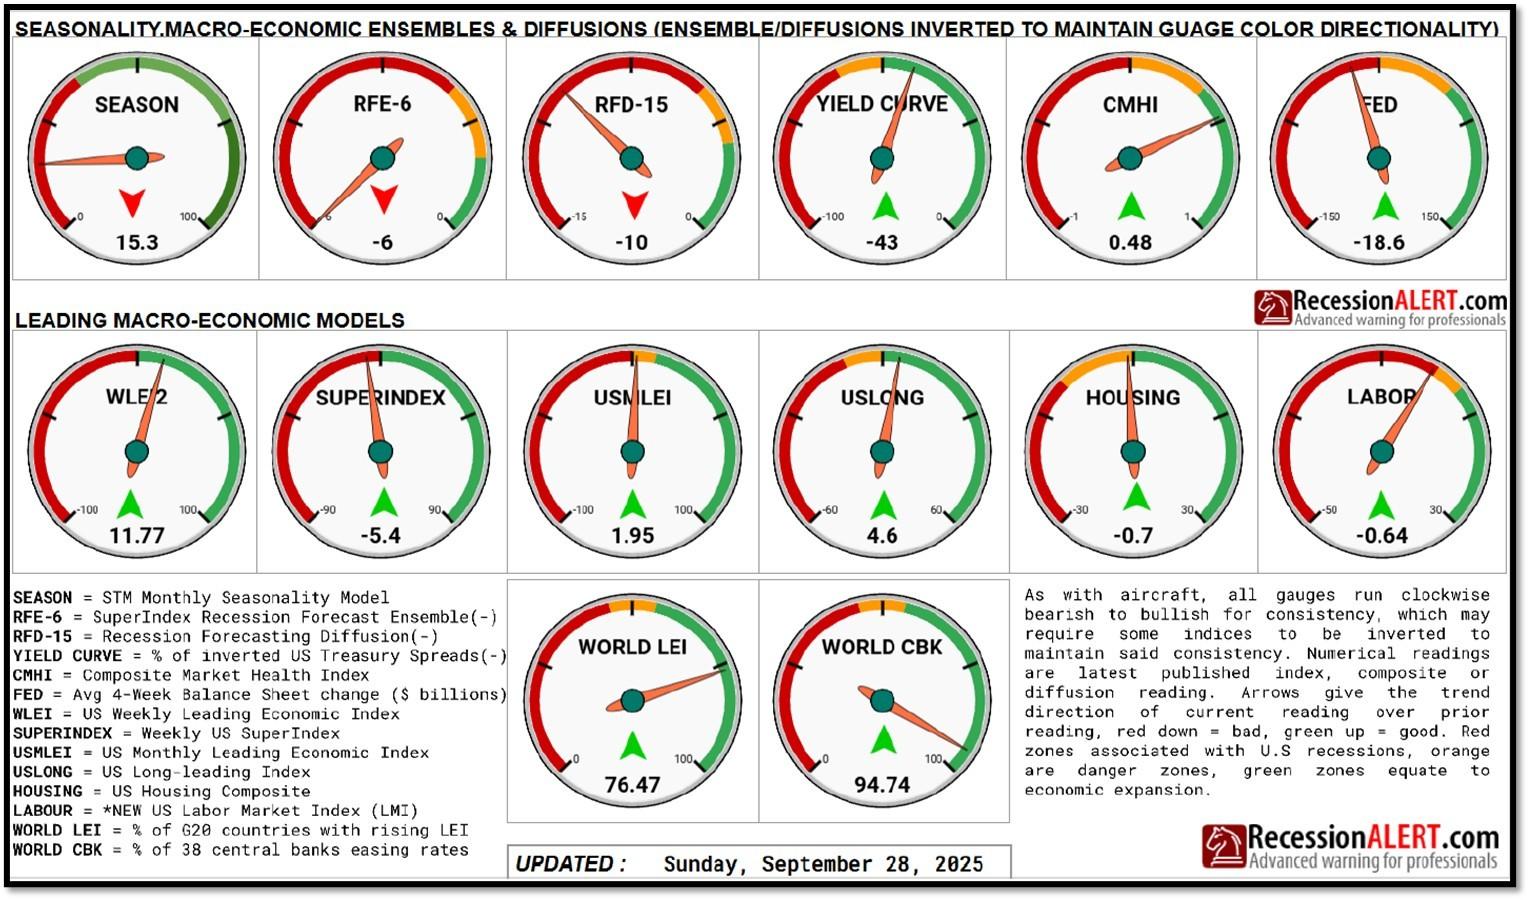
4C. An updated snapshot of the current global state of economy.
According to TradingEconomics as of 10/1/2025 (REF: TradingEconomics):
- Germany’s annual inflation rate rose for the second consecutive month to 2.4% in September 2025, up from 2.2% in August and slightly above forecasts of 2.3%, preliminary data showed.
- The annual inflation rate in France accelerated to 1.2% in September 2025 from 0.9% in August, its highest level since January but slightly below the expected 1.3%, preliminary estimates showed.
- The Bank of Mexico cut its benchmark interest rate by 25 bps to 7.5% in its September meeting, in line with market expectations, bringing it to its lowest level since May 2022, and indicated it would consider further easing at future meeting.
- The Reserve Bank of India (RBI) kept its key repo rate unchanged at 5.50% during its October 2025 meeting, in line with market expectations.
5. Quant & Technical Corner – A selection of quantitative & technical data we monitor on a regular basis to help gauge the overall financial market conditions and the investment environment.
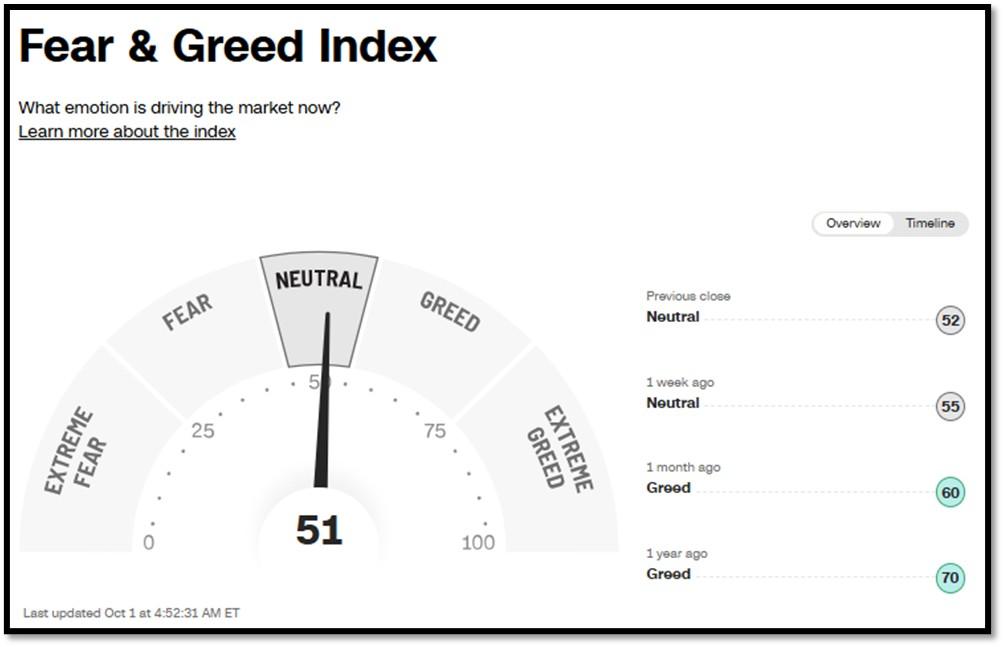
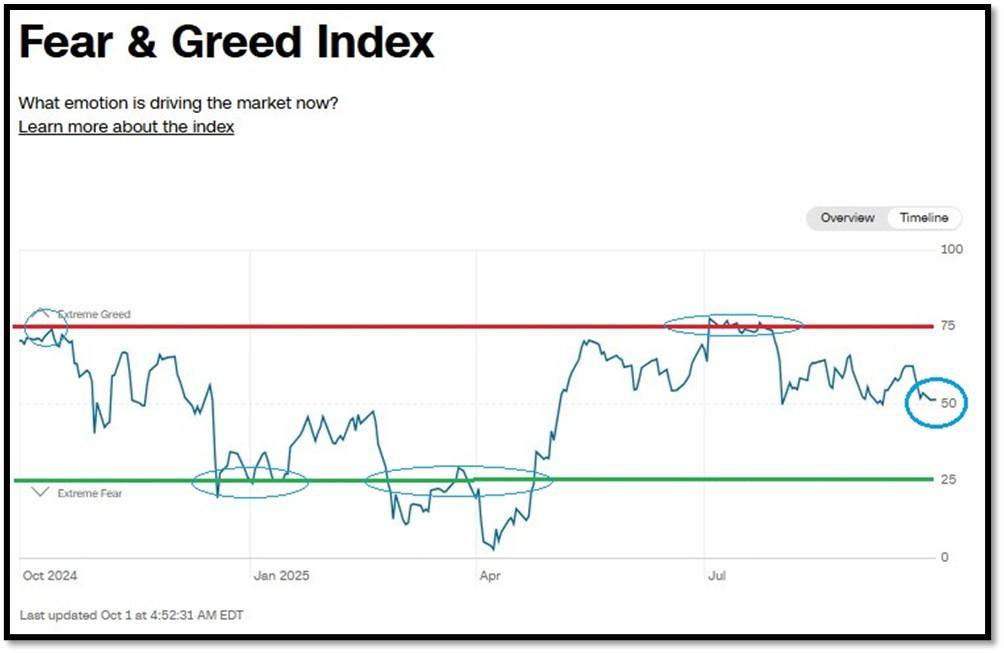
5A. Most recent read on the Fear & Greed Index with data as of 10/1/2025 – 4:52 AM-ET is 51 (Neutral). Last week’s data was 55 (Neutral) (1-100). CNNMoney’s Fear & Greed index looks at 7 indicators (Stock Price Momentum, Stock Price Strength, Stock Price Breadth, Put and Call Options, Junk Bond Demand, Market Volatility, and Safe Haven Demand). Keep in mind this is a contrarian indicator! REF: Fear&Greed via CNNMoney
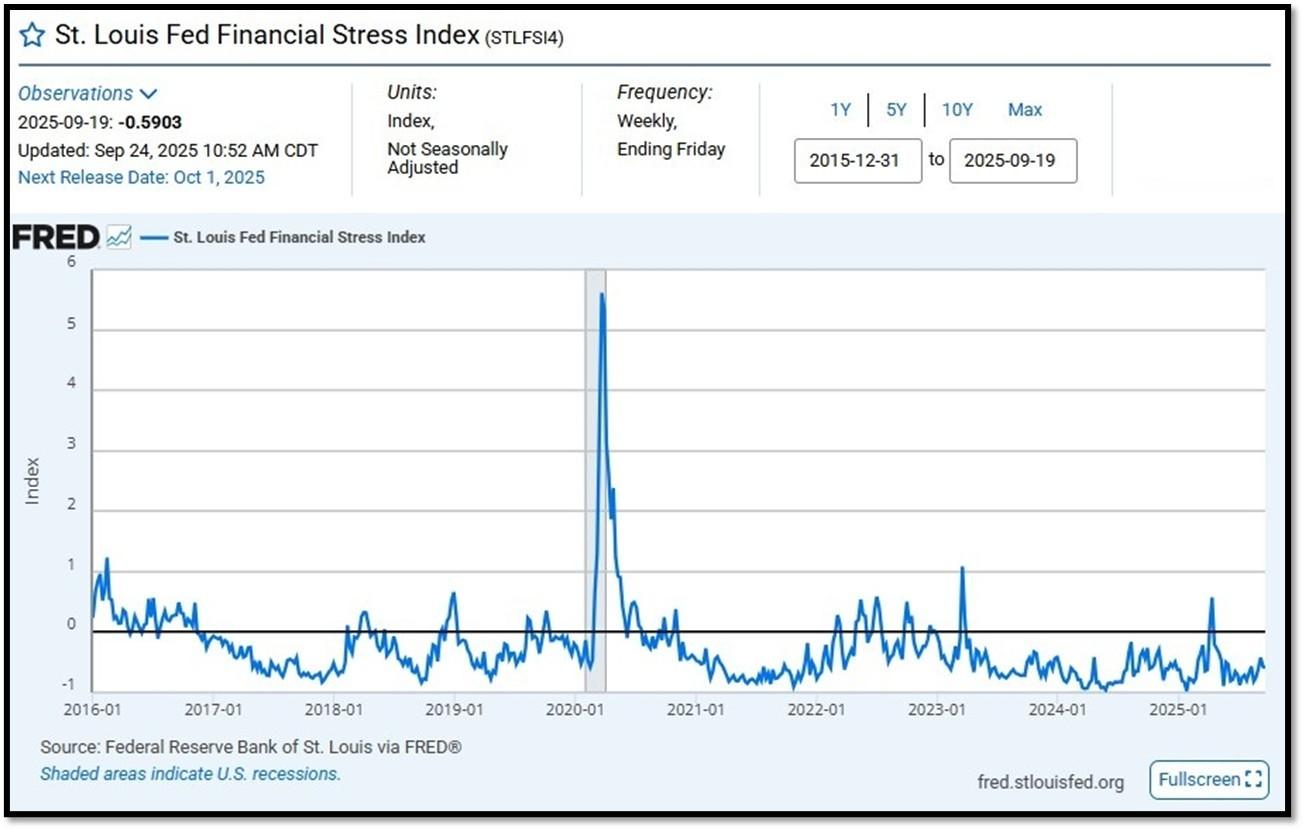
5B. St. Louis Fed Financial Stress Index’s (STLFSI4) most recent read is at –0.5903 as of September 24, 2025. Previous week’s data was -0.5655. A big spike up from previous readings reflecting the turmoil in the banking sector back in 2023. This weekly index is not seasonally adjusted. The STLFSI4 measures the degree of financial stress in the markets and is constructed from 18 weekly data series: seven interest rate series, six yield spreads and five other indicators. Each of these variables captures some aspect of financial stress. Accordingly, as the level of financial stress in the economy changes, the data series are likely to move together. REF: St. Louis Fed
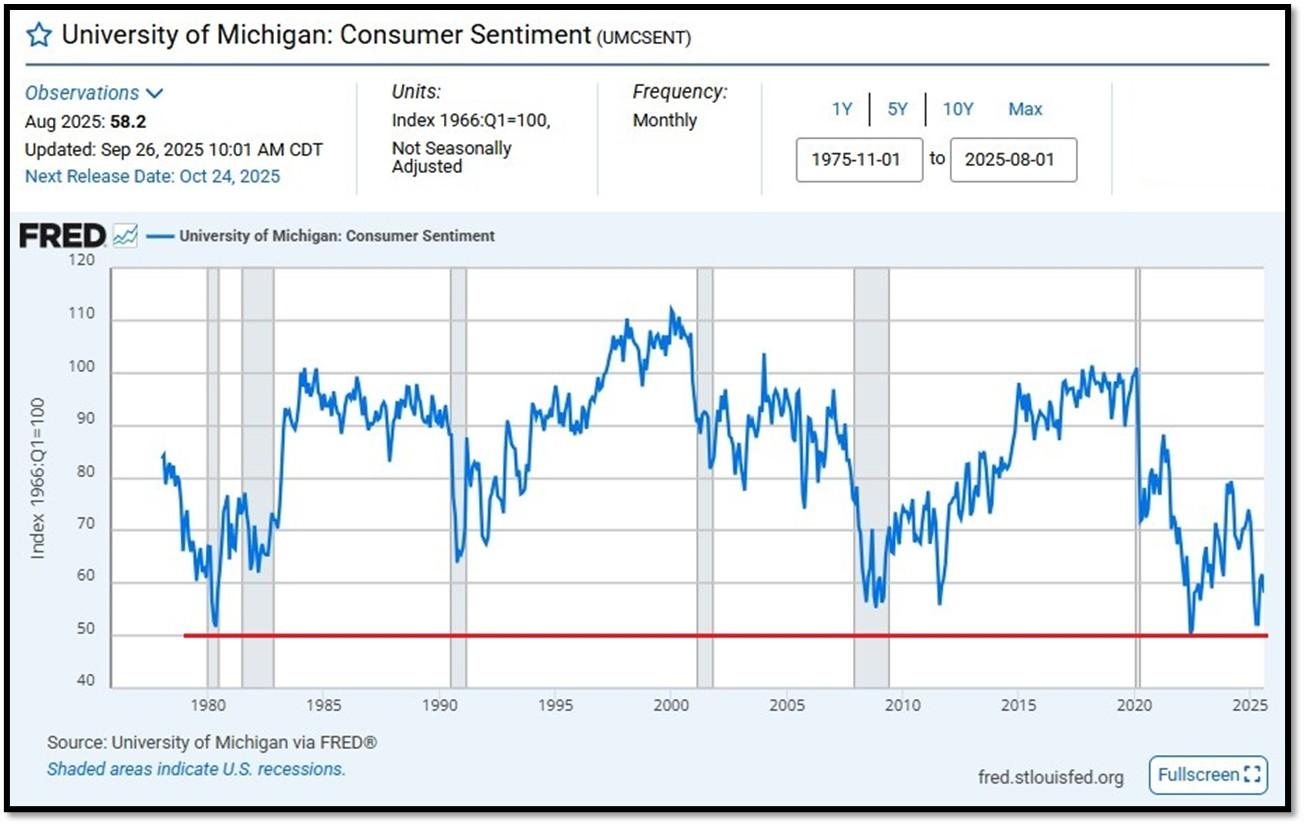
5C. University of Michigan, University of Michigan: Consumer Sentiment [UMCSEMT] for August at 58.2, retrieved from FRED, Federal Reserve Bank of St. Louis, September 26, 2025. Back in June 2022, Consumer Sentiment hit a low point going back to April 1980. REF: UofM
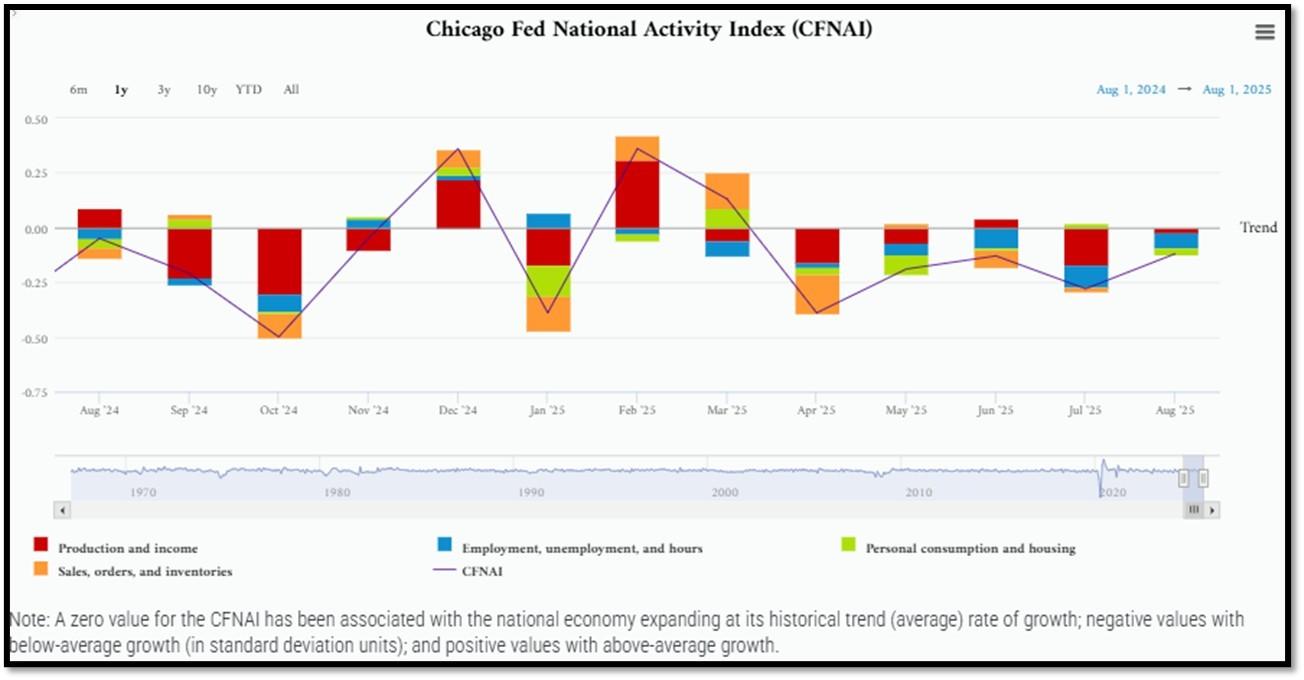
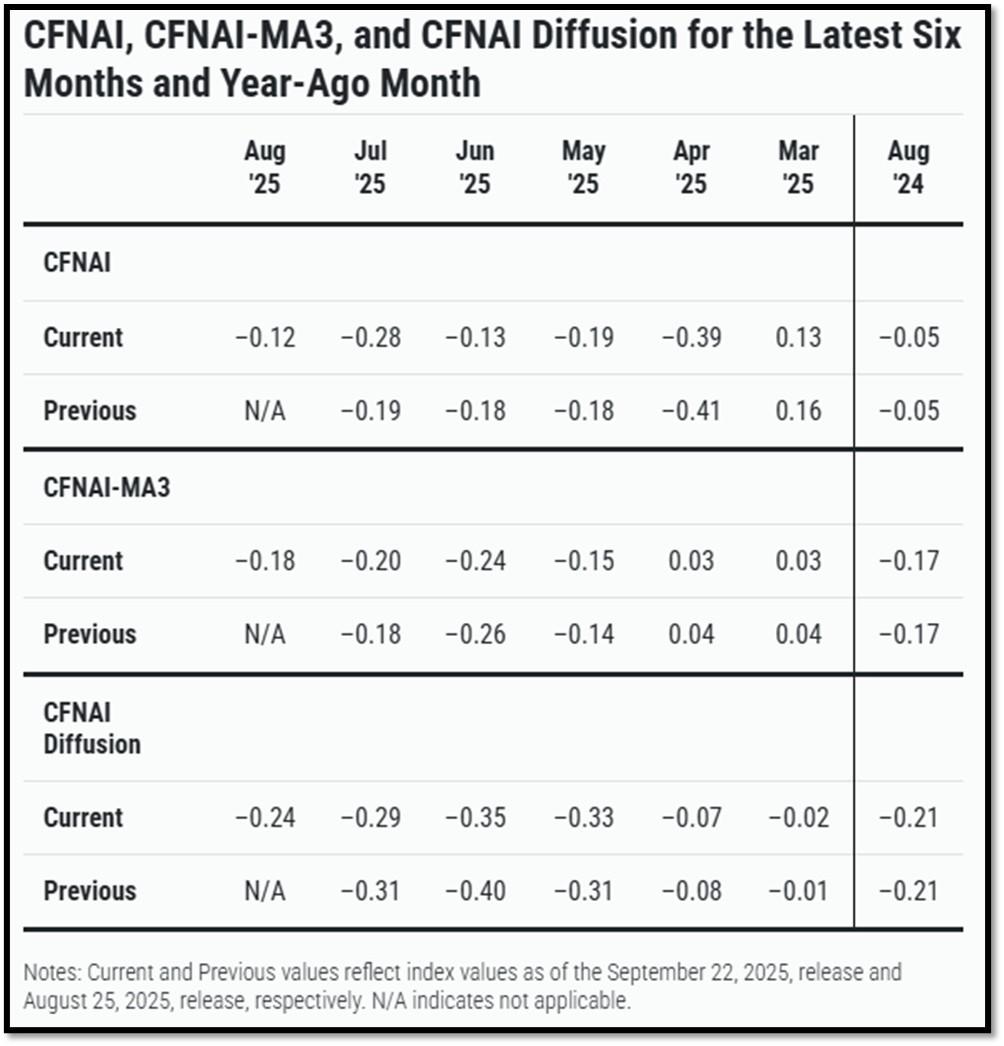
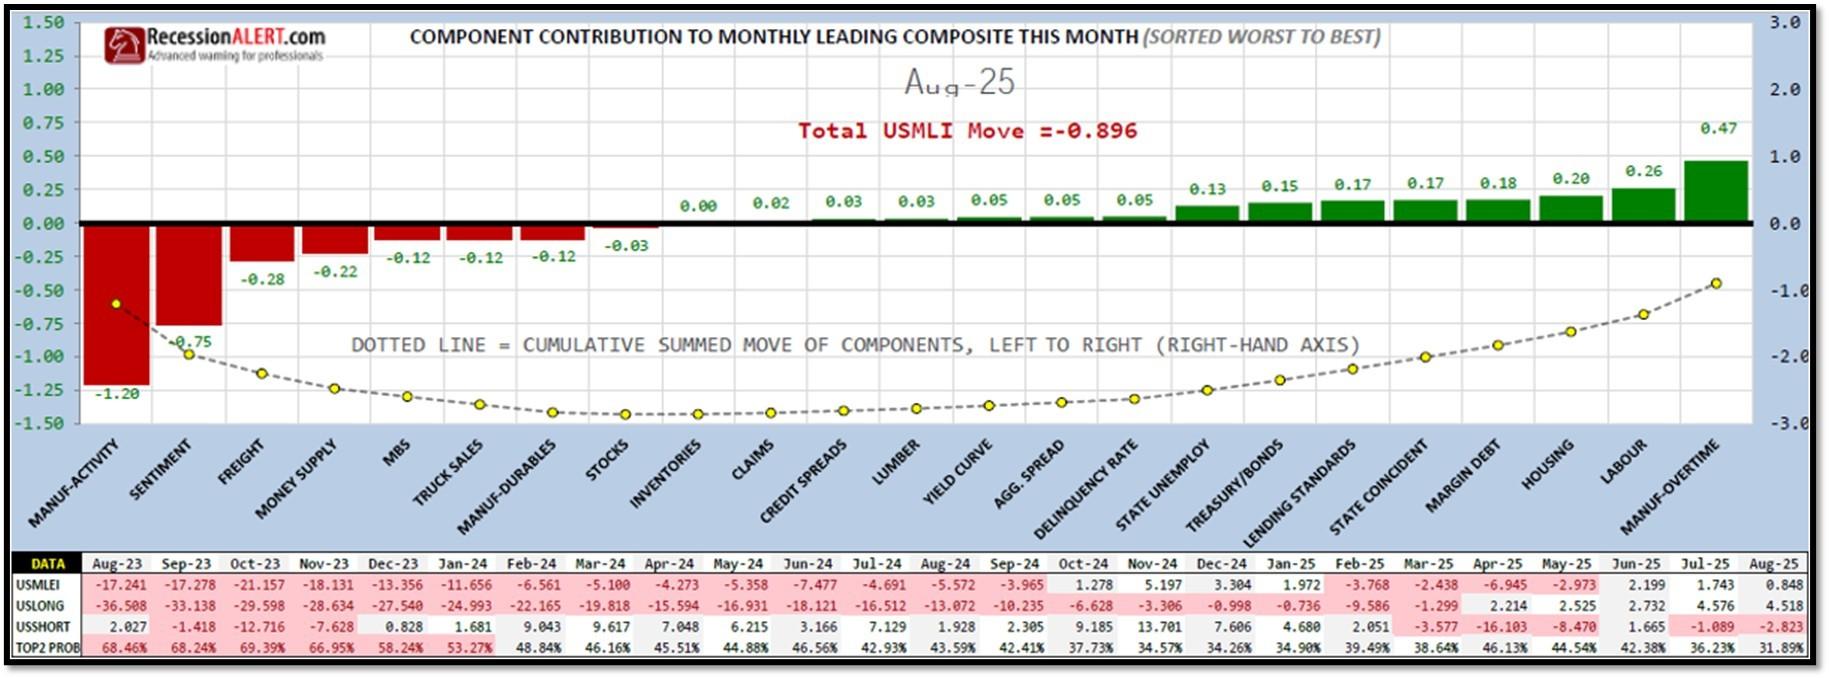
5D. The Chicago Fed National Activity Index (CFNAI) increased to –0.12 in August from –0.28 in July. Three of the four broad categories of indicators used to construct the index increased from July, but three categories made negative contributions in August. The index’s three-month moving average, CFNAI-MA3, increased to –0.18 in August from –0.20 in July. REF: ChicagoFed, August’s Report
5E. (9/18/2025) The Conference Board Leading Economic Index (LEI) for the US declined by 0.5% in August 2025 to 98.4 (2016=100), after a small 0.1% increase in July (upwardly revised from an originally reported 0.1% decline). The LEI fell by 2.8% over the six months between February and August 2025, a faster rate of decline than its 0.9% contraction over the previous six-month period (August 2024 to February 2025). The composite economic indexes are the key elements in an analytic system designed to signal peaks and troughs in the business cycle. The indexes are constructed to summarize and reveal common turning points in the economy in a clearer and more convincing manner than any individual component. The CEI is highly correlated with real GDP. The LEI is a predictive variable that anticipates (or “leads”) turning points in the business cycle by around 7 months. Shaded areas denote recession periods or economic contractions. The dates above the shaded areas show the chronology of peaks and troughs in the business cycle. The ten components of The Conference Board Leading Economic Index® for the U.S. include: Average weekly hours in manufacturing; Average weekly initial claims for unemployment insurance; Manufacturers’ new orders for consumer goods and materials; ISM® Index of New Orders; Manufacturers’ new orders for nondefense capital goods excluding aircraft orders; Building permits for new private housing units; S&P 500® Index of Stock Prices; Leading Credit Index™; Interest rate spread (10-year Treasury bonds less federal funds rate); Average consumer expectations for business conditions. REF: ConferenceBoard, LEI Report for August (ReceesionAlert) (Released on 9/30/2025)
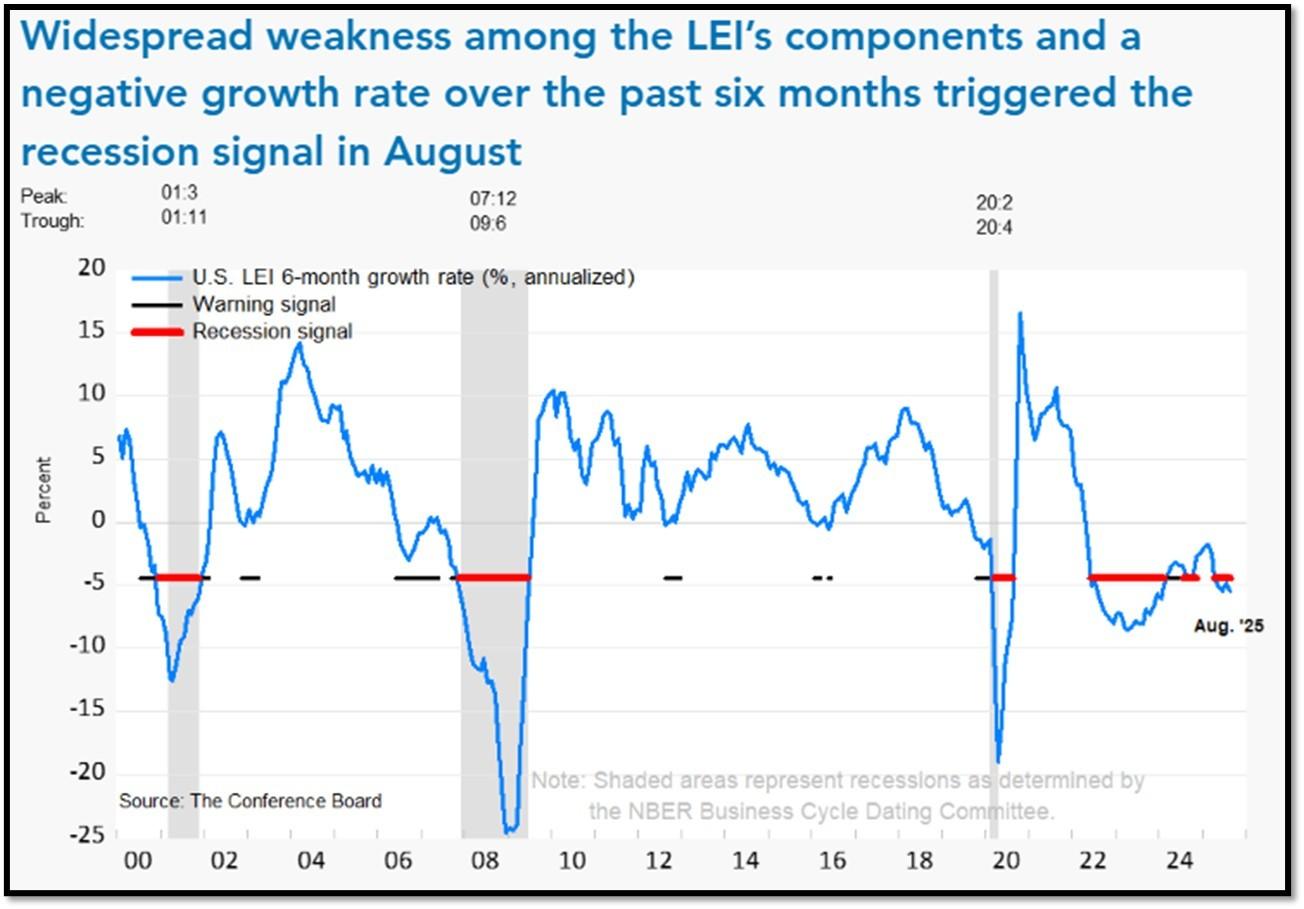
We have experienced a “rolling recession” since June 2022 and are only now emerging from it. However, authorities are not labeling it a recession due to high employment data from June 2022-2025.
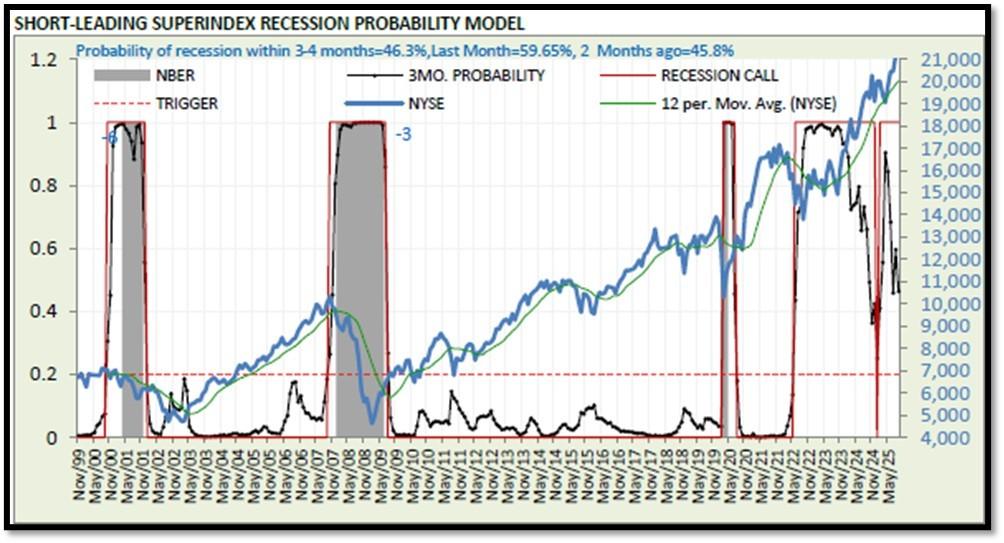
5F. Probability of U.S. falling into Recession within 3 to 4 months is currently at 46.3% (with data as of 09/28/2025 – Next Report 10/12/2025) according to RecessionAlert Research. Last release’s data was at 59.51%. This report is updated every two weeks. REF: RecessionAlertResearch
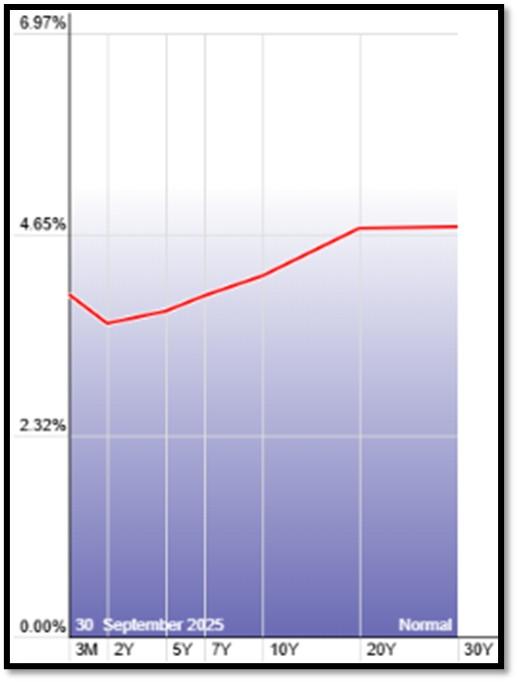
5G. Yield Curve as of 9/30/2025 is showing Normal. Spread on the 10-yr Treasury Yield (4.15%) minus yield on the 2-yr Treasury Yield (3.60%) is currently at 55bps. REF: Stockcharts The yield curve—specifically, the spread between the interest rates on the ten-year Treasury note and the three-month Treasury bill—is a valuable forecasting tool. It is simple to use and significantly outperforms other financial and macroeconomic indicators in predicting recessions two to six quarters ahead. REF: NYFED
5H. Recent Yields in 10-Year Government Bonds. REF: Source is from Bloomberg.com, dated 9/30/2025, rates shown below are as of 9/30/2025, subject to change.
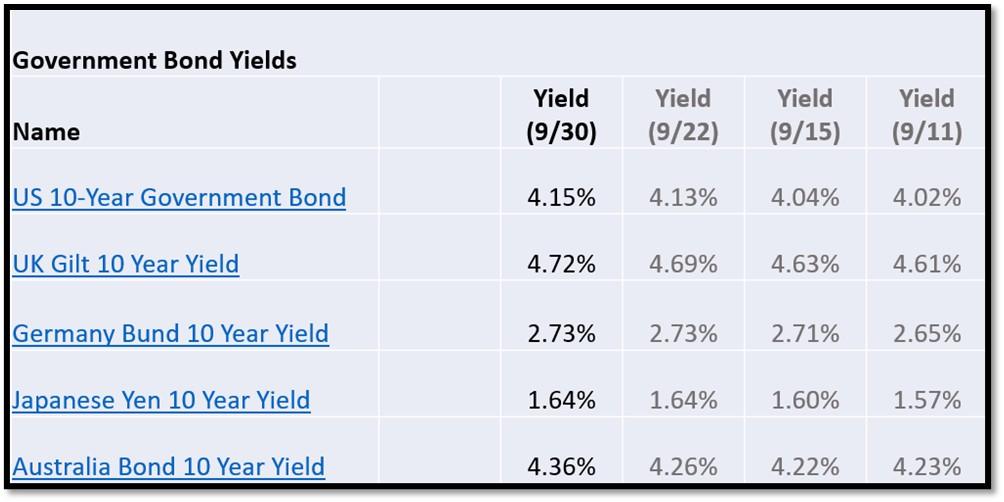
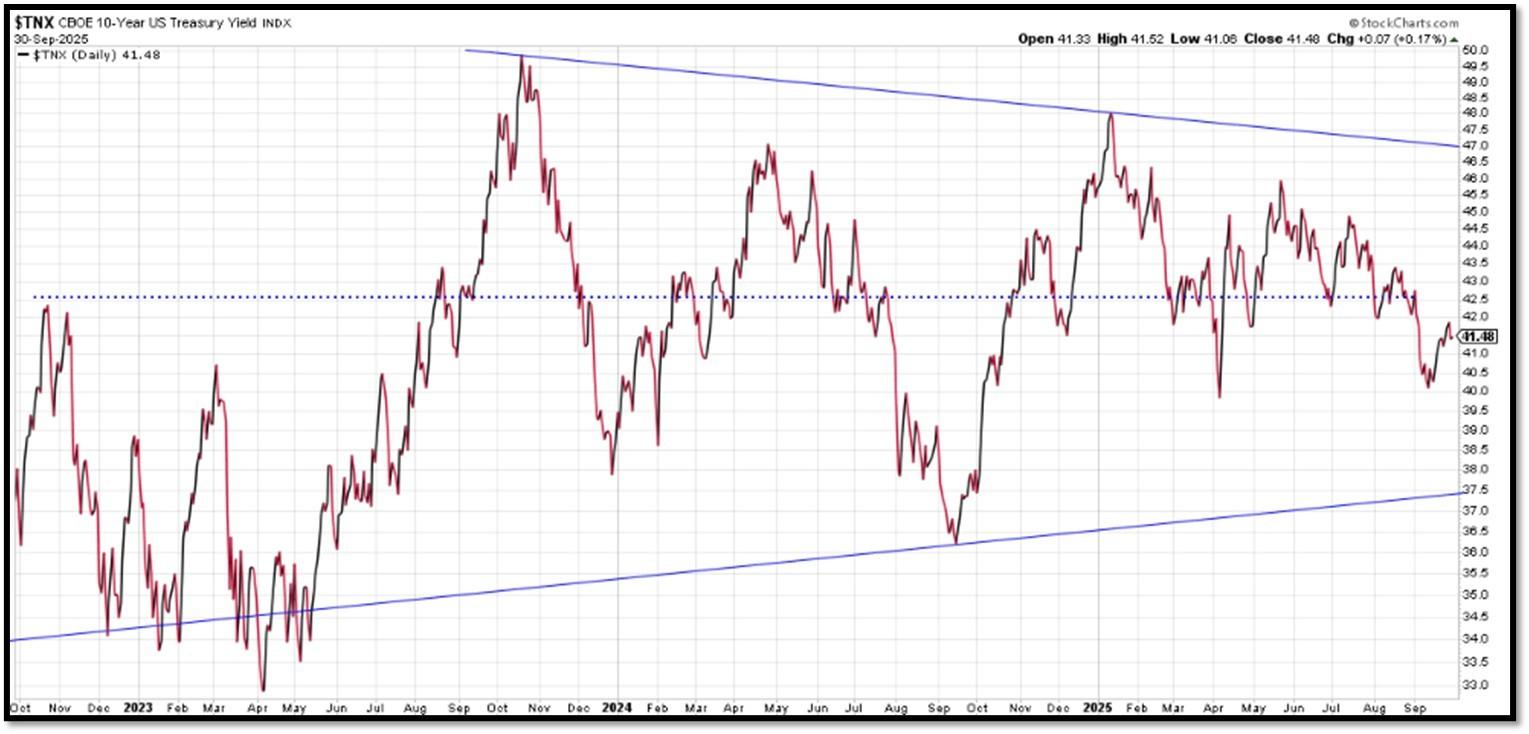
The 10-Year US Treasury Yield… The 10-Year Yield is indirectly related to inflation. I expect the 10-Year Yield to drop further as dis-inflation kicks in. REF: StockCharts1
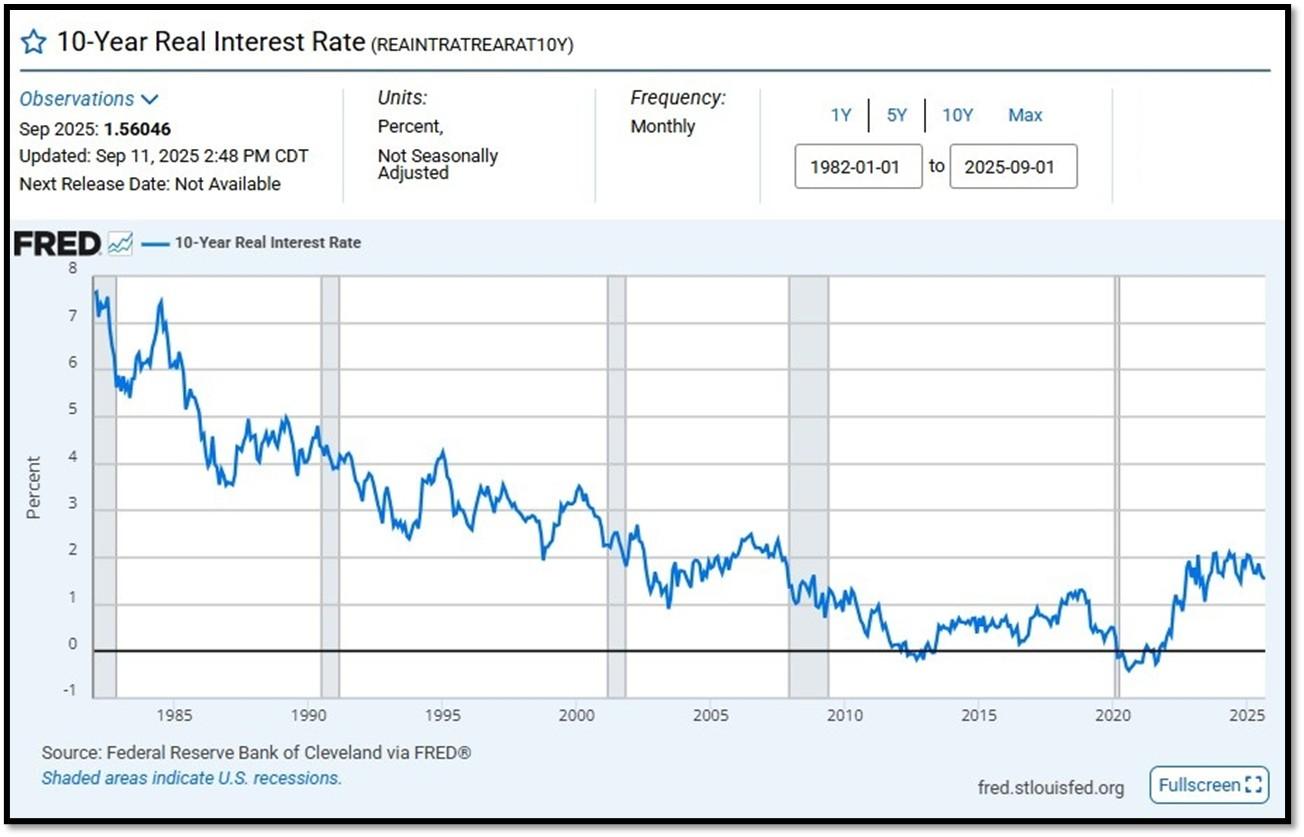
10-Year Real Interest Rate at 1.56046% as of 9/11/25. Last month’s data was 1.56633%. REF: REAINTRATREARAT10Y
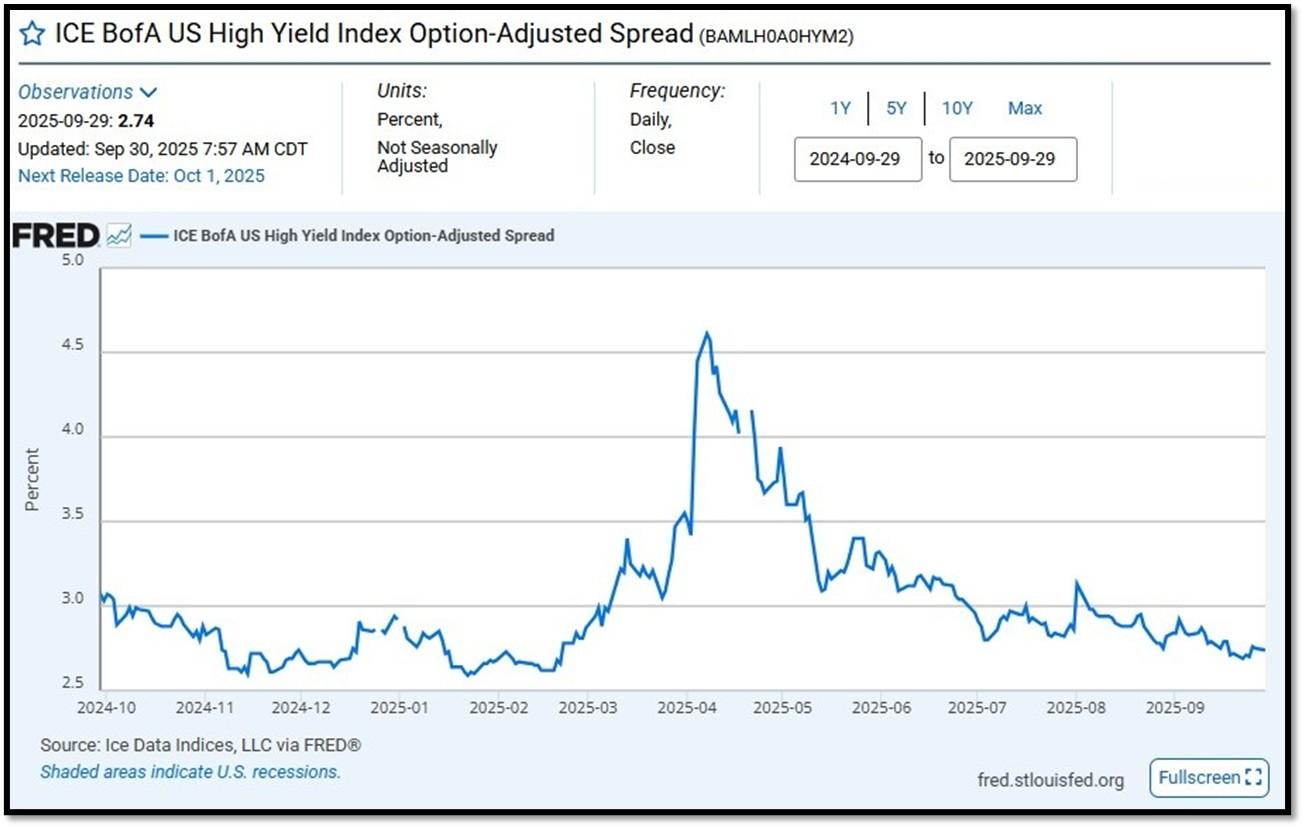
ICE BofA US High Yield Index Option-Adjusted Spread (BAMLH0A0HYM2) currently at 2.74 as of September 30, 2025. This is a key indicator of market sentiment, particularly regarding risk and economic health. At its core, the spread reflects the extra return investors demand to hold riskier corporate debt over safer government securities. High-yield bonds are issued by companies with lower credit ratings (below investment grade, like BB or lower), meaning they carry a higher chance of default. The spread compensates for this risk. When the spread is narrow—say, around 2.5% to 3%, as seen recently—it suggests investors are confident, willing to accept less extra yield because they perceive lower default risk or a strong economy. Narrow spreads often align with bullish markets, where cash is flowing, growth is steady, and fear is low. REF: FRED-BAMLH0A0HYM2
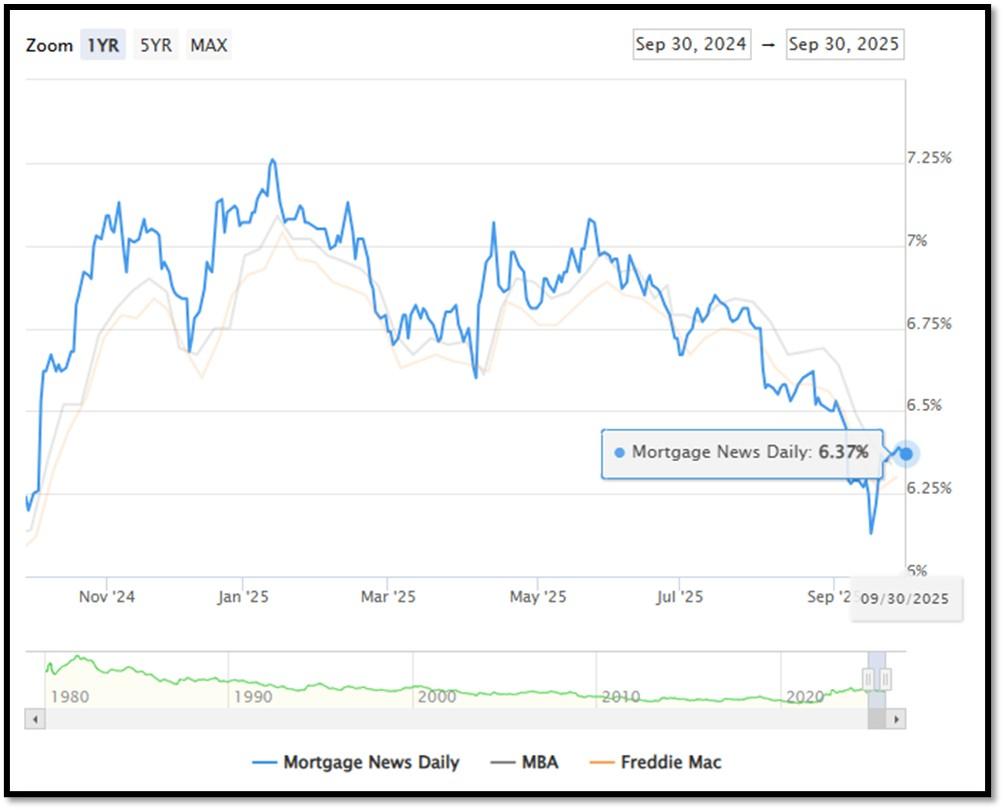
5I. (9/30/2025) Today’s National Average 30-Year Fixed Mortgage Rate is 6.37% (All Time High was 8.03% on 10/19/23). Last week’s data was 6.35%. This rate is the average 30-year fixed mortgage rates from several different surveys including Mortgage News Daily (daily index), Freddie Mac (weekly survey), Mortgage Bankers Association (weekly survey) and FHFA (monthly survey). REF: MortgageNewsDaily, Today’s Average Rate
The recent spike in the 30-year fixed-rate jumbo mortgage to 6.37%, compared to Freddie Mac’s rate at 6.30% and the Mortgage Bankers Association (MBA) rate at 6.34%, highlights key differences in the mortgage market. Jumbo mortgages, which exceed the conforming loan limits set by government agencies like Freddie Mac, typically carry higher interest rates because they are riskier for lenders. These loans are not backed by government entities, which increases the risk for lenders and, consequently, leads to higher rates. In contrast, Freddie Mac and MBA provide averages for conforming loans, which meet federal guidelines and have lower risk due to government backing, keeping their rates lower.
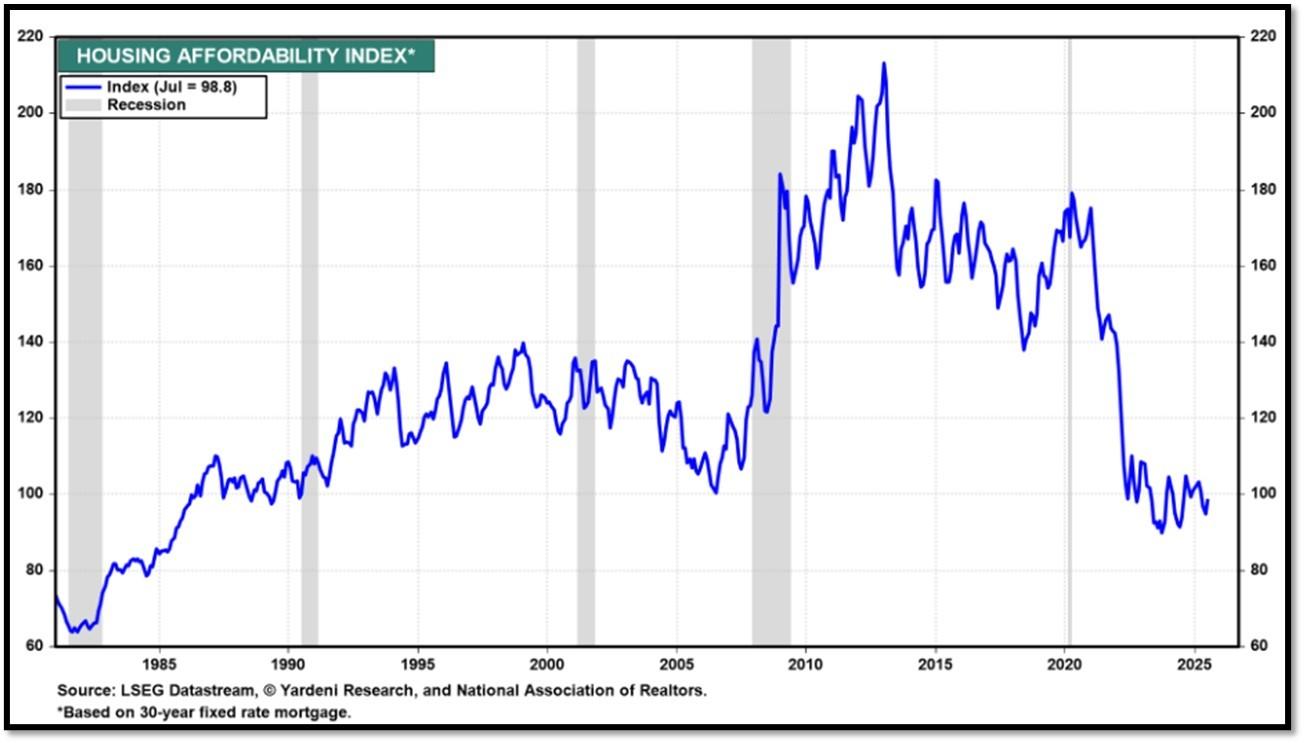
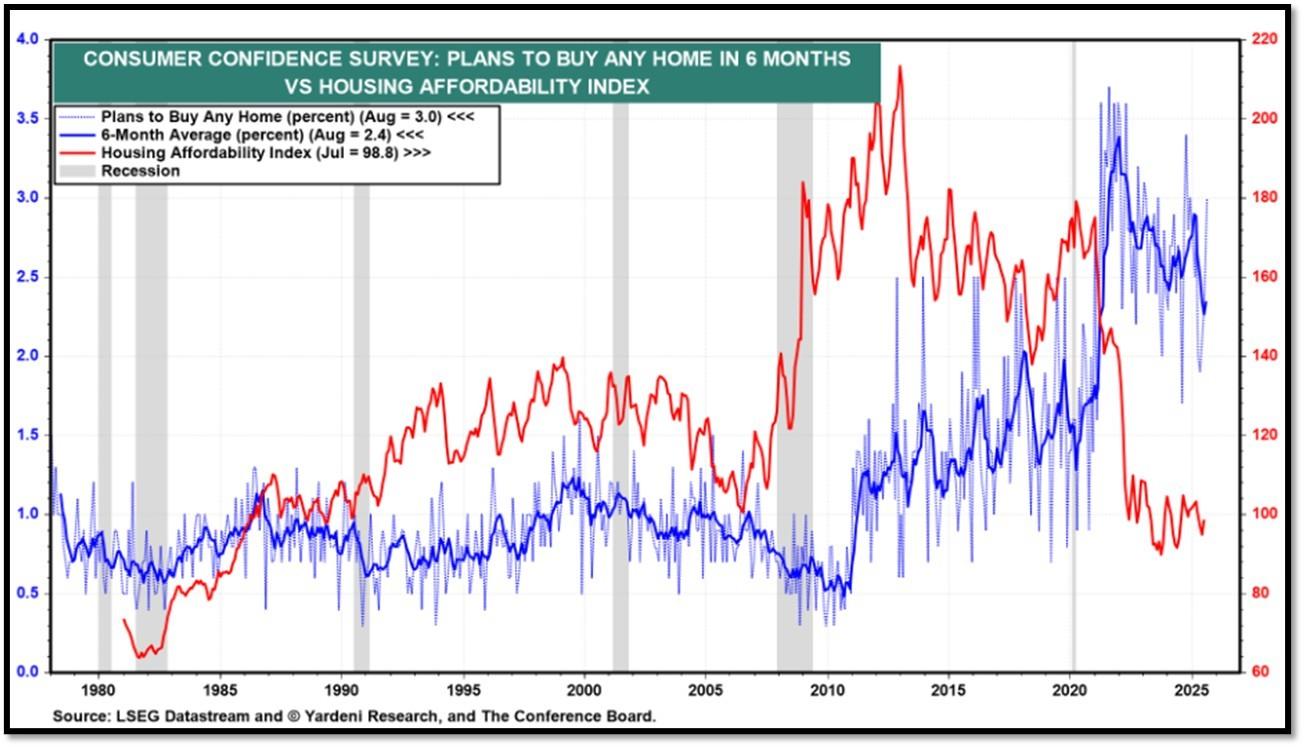
Housing Affordability Index for July = 98.8 // Jun = 94.4 // May = 97.2 // Apr = 101.0 // Mar = 103.2 // Feb = 102.2 // Jan = 100.7. Data provided by Yardeni Research. REF: Yardeni
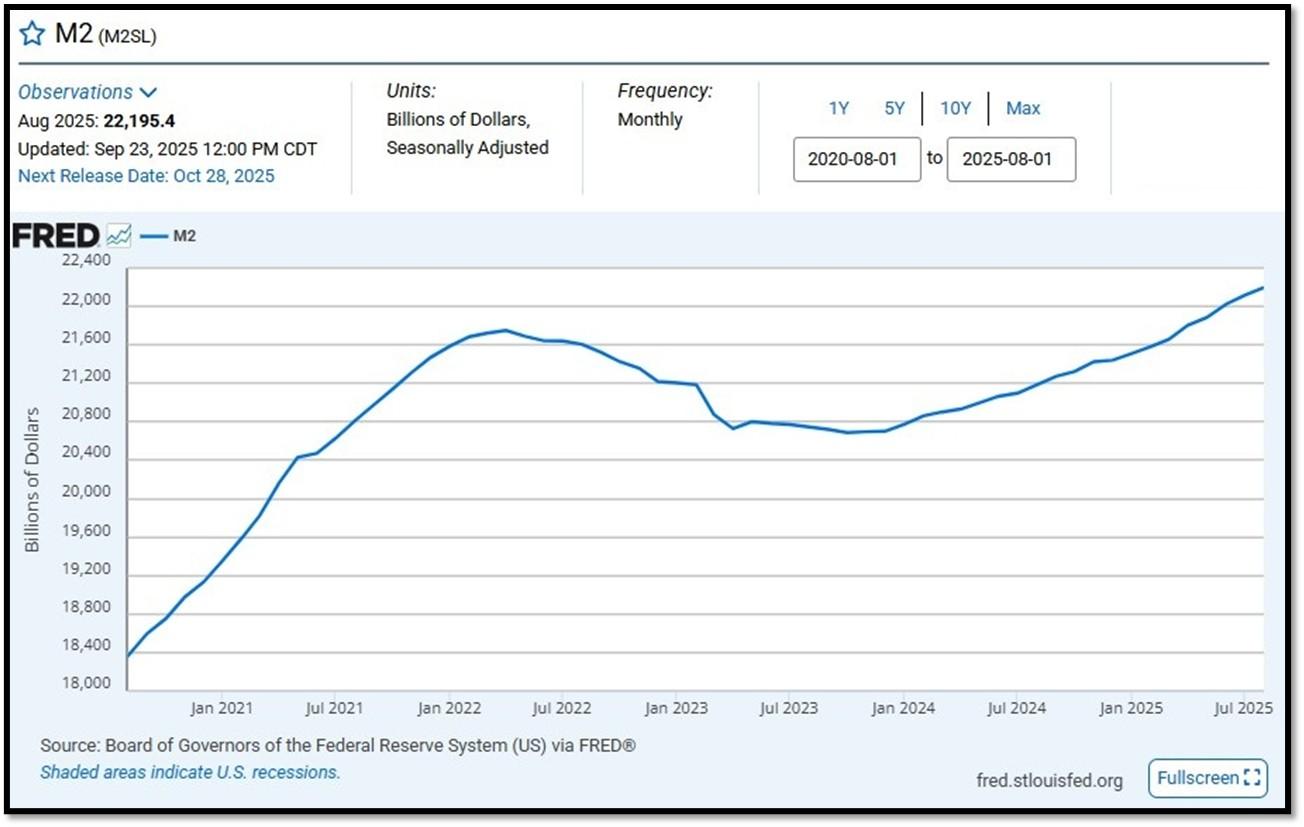
5J. Velocity of M2 Money Stock (M2V) with current read at 1.392 as of (Q2-2025 updated September 25, 2025). Previous quarter’s data was 1.386. The velocity of money is the frequency at which one unit of currency is used to purchase domestically- produced goods and services within a given time period. In other words, it is the number of times one dollar is spent to buy goods and services per unit of time. If the velocity of money is increasing, then more transactions are occurring between individuals in an economy. Current Money Stock (M2) report can be viewed in the reference link. REF: St.LouisFed-M2V
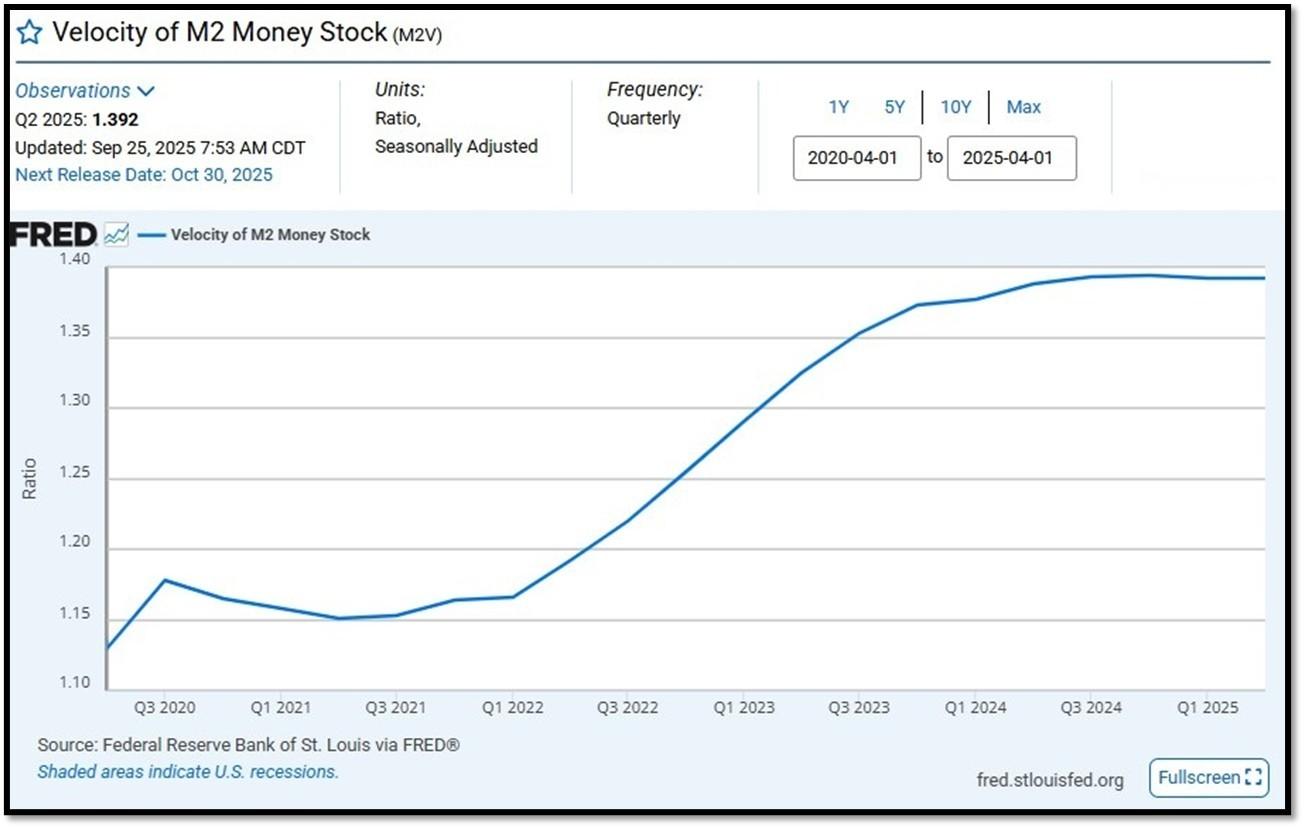
M2 consists of M1 plus (1) small-denomination time deposits (time deposits in amounts of less than $100,000) less IRA and Keogh balances at depository institutions; and (2) balances in retail MMFs less IRA and Keogh balances at MMFs. Seasonally adjusted M2 is constructed by summing savings deposits (before May 2020), small-denomination time deposits, and retail MMFs, each seasonally adjusted separately, and adding this result to seasonally adjusted M1. Board of Governors of the Federal Reserve System (US), M2 [M2SL], retrieved from FRED, Federal Reserve Bank of St. Louis; Updated on September 23, 2025. REF: St.LouisFed-M2
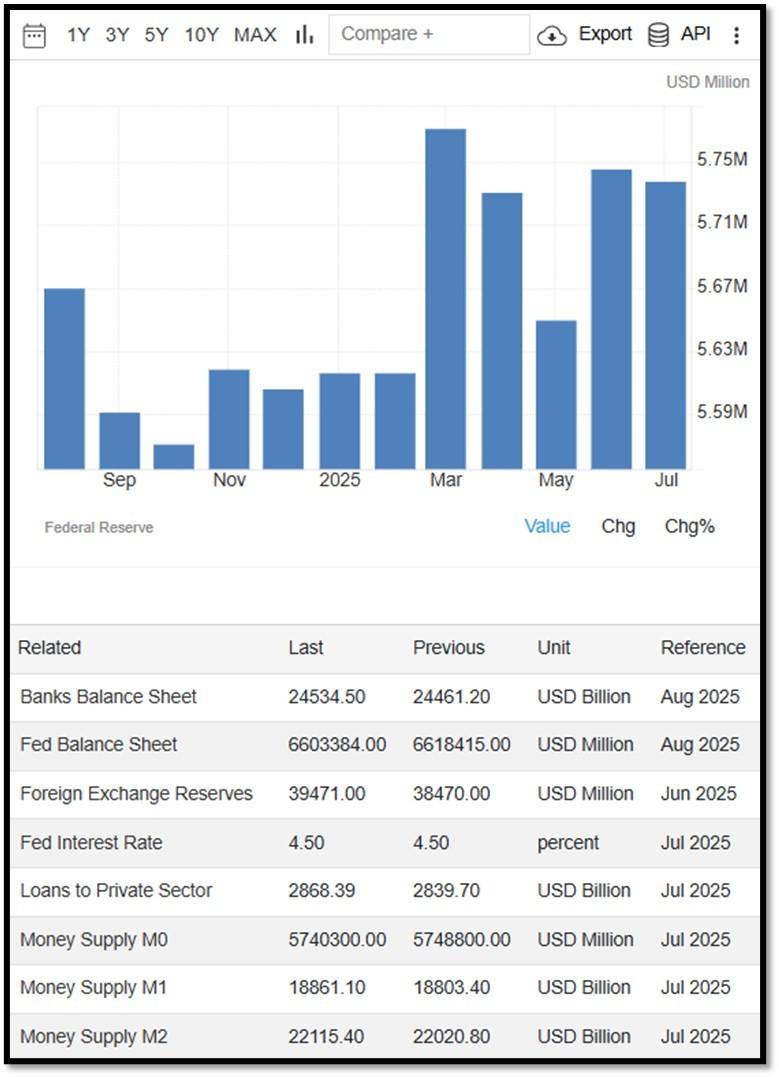
Money Supply M0 in the United States decreased to 5,686,400 USD Million in August from 5,740,300 USD Million in July of 2025. Money Supply M0 in the United States averaged 1,211,562.63 USD Million from 1959 until 2025, reaching an all-time high of 6,413,100.00 USD Million in December of 2021 and a record low of 484,00.00 USD Million in February of 1961.. REF: TradingEconomics, M0
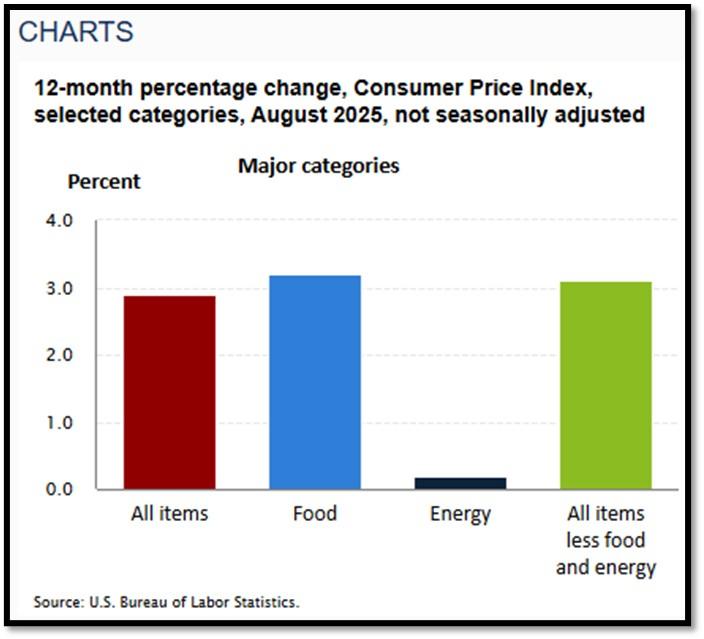
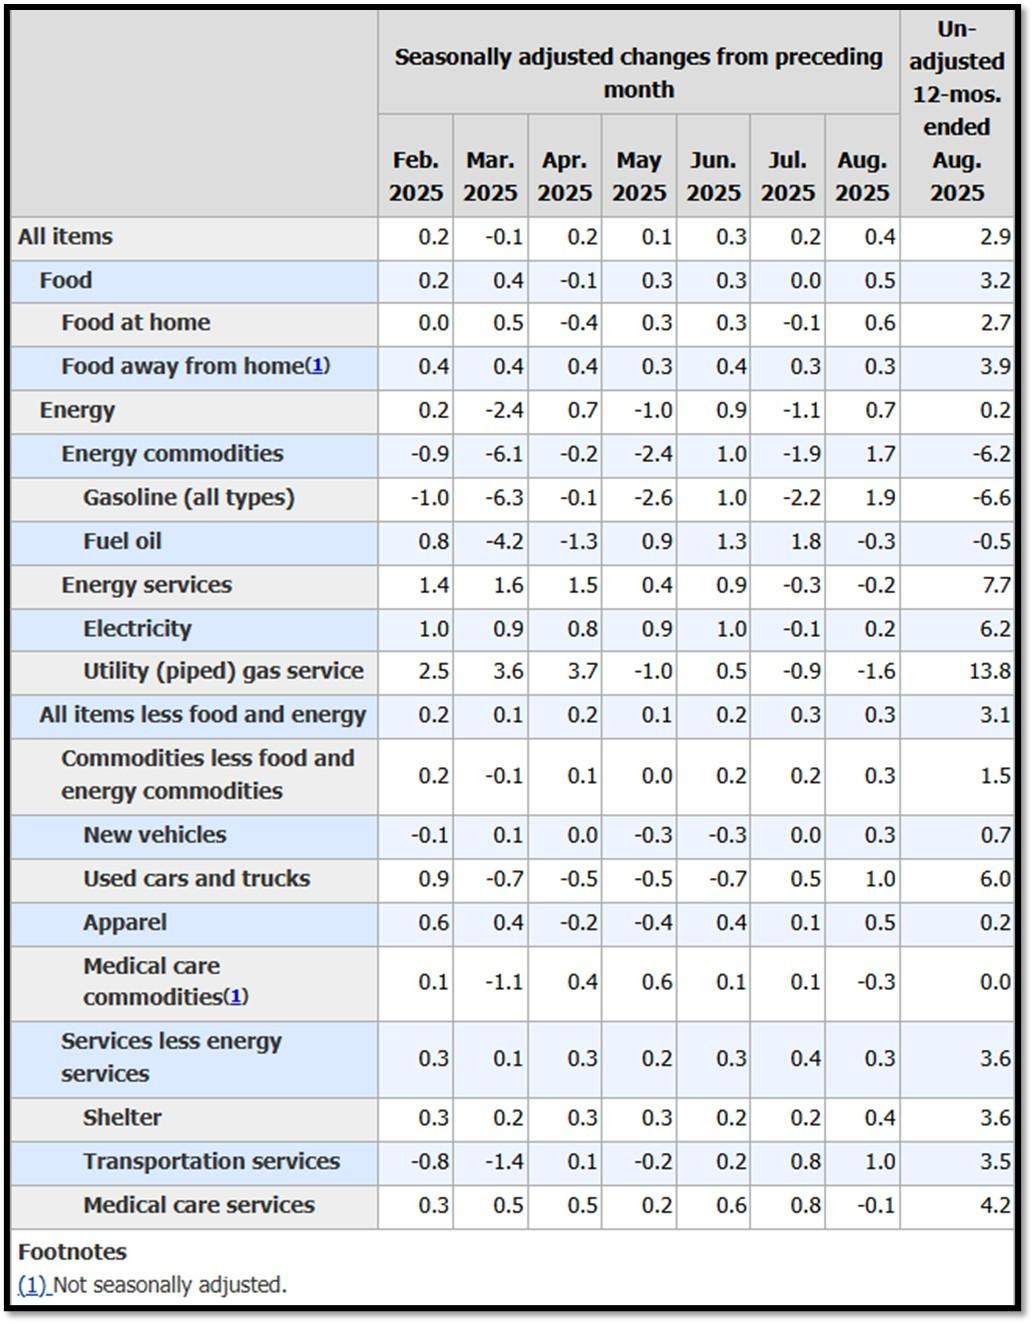
5K. In August, the Consumer Price Index for All Urban Consumers rose 0.4 percent, seasonally adjusted, and rose 2.9 percent over the last 12 months, not seasonally adjusted. The index for all items less food and energy increased 0.3 percent in August (SA); up 3.1 percent over the year (NSA). September 2025 CPI data are scheduled to be released on October 15, 2025, at 8:30AM-ET. REF: BLS, BLS.GOV
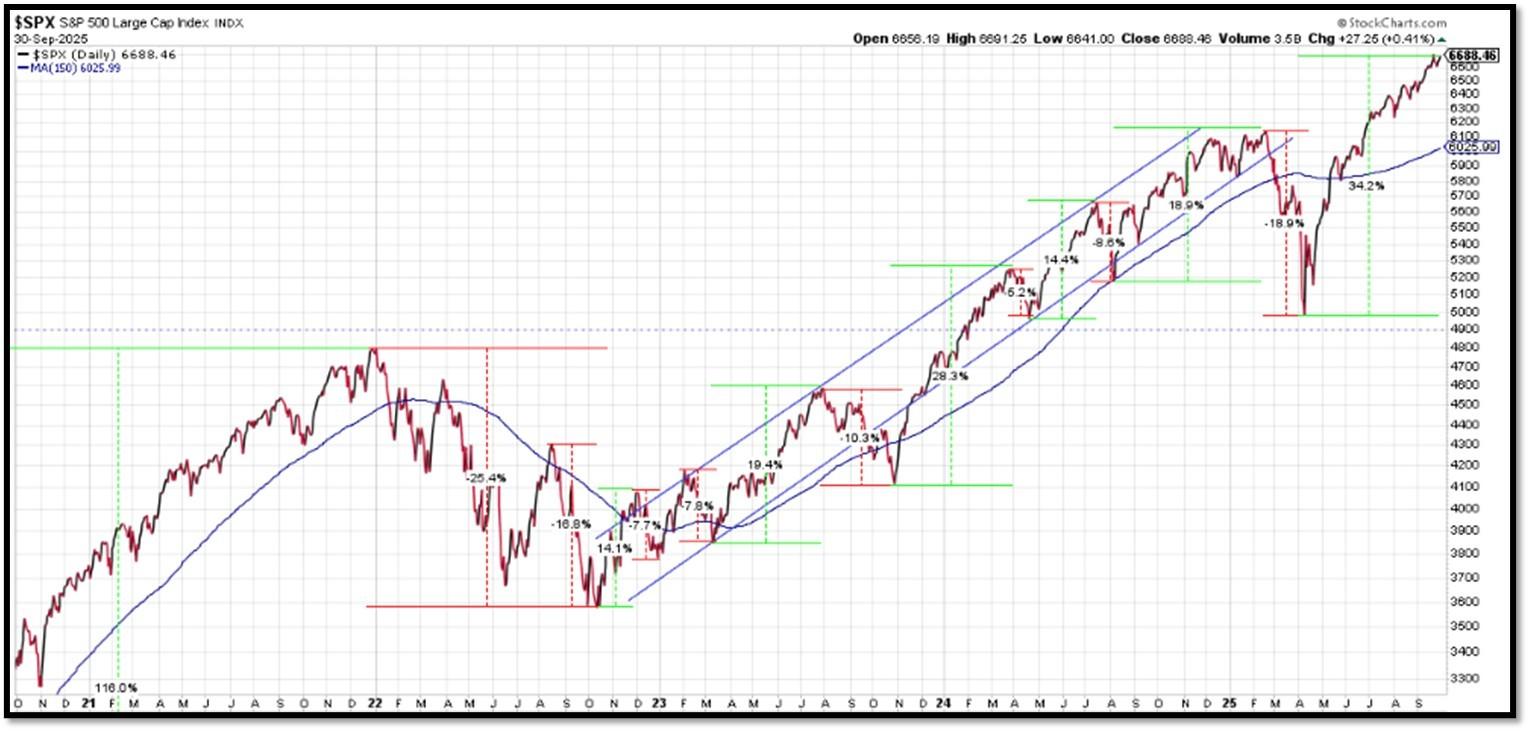
5L. Technical Analysis of the S&P500 Index. Click onto reference links below for images.
- Short-term Chart: Trend Bullish on 9/30/2025 – REF: Short-term S&P500 Chart by Marc Slavin (Click Here to Access Chart)
- Medium-term Chart: Trend Bearish to Bullish on 9/30/2025 – REF: Medium-term S&P500 Chart by Marc Slavin (Click Here to Access Chart)
- Market Timing Indicators – S&P500 Index as of 9/30/2025 – REF: S&P500 Charts (7 of them) by Joanne Klein’s Top 7 (Click Here to Access Updated Charts)
- The S&P500 is hitting all-time-high, rebounding from a V-shaped recovery to all-time high. REF: Stockcharts
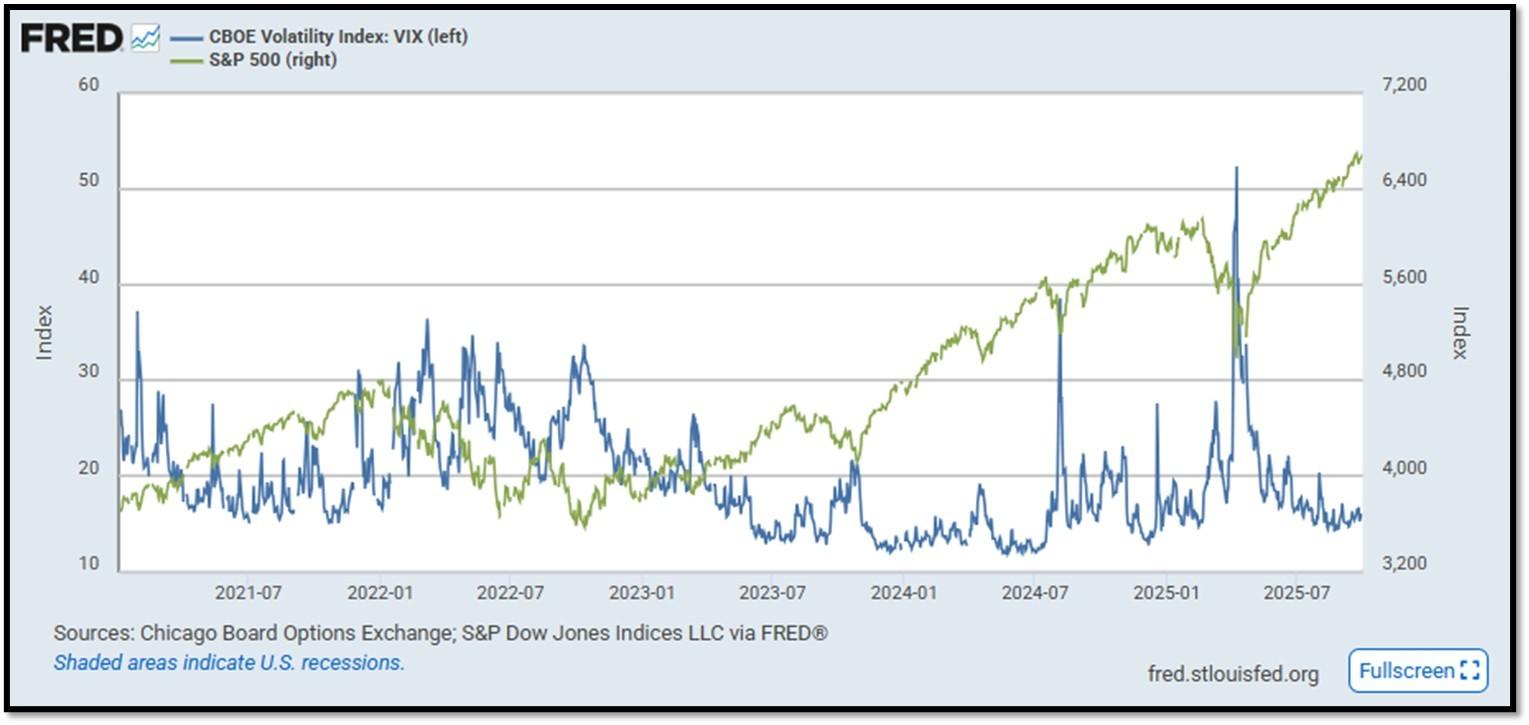
- S&P500 and CBOE Volatility Index (VIX) as of 9/30/2025. REF: FRED, Today’s Print
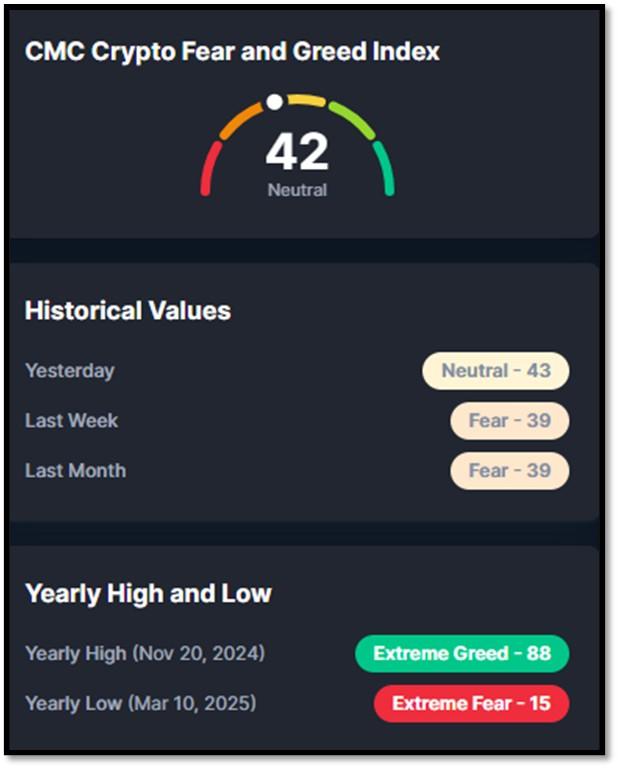
5M. Most recent read on the Crypto Fear & Greed Index with data as of 10/1/2025 is 42 (Neutral). Last week’s data was 39 (Fear) (1-100). Fear & Greed Index – A Contrarian Data. The crypto market behavior is very emotional. People tend to get greedy when the market is rising which results in FOMO (Fear of missing out). Also, people often sell their coins in irrational reaction of seeing red numbers. With the Crypto Fear and Greed Index, the data try to help save investors from their own emotional overreactions. There are two simple assumptions:
- Extreme fear can be a sign that investors are too worried. That could be a buying opportunity.
- When Investors are getting too greedy, that means the market is due for a correction.
Therefore, the program for this index analyzes the current sentiment of the Bitcoin market and crunch the numbers into a simple meter from 0 to 100. Zero means “Extreme Fear”, while 100 means “Extreme Greed”. REF: Coinmarketcap.com, Today’sReading
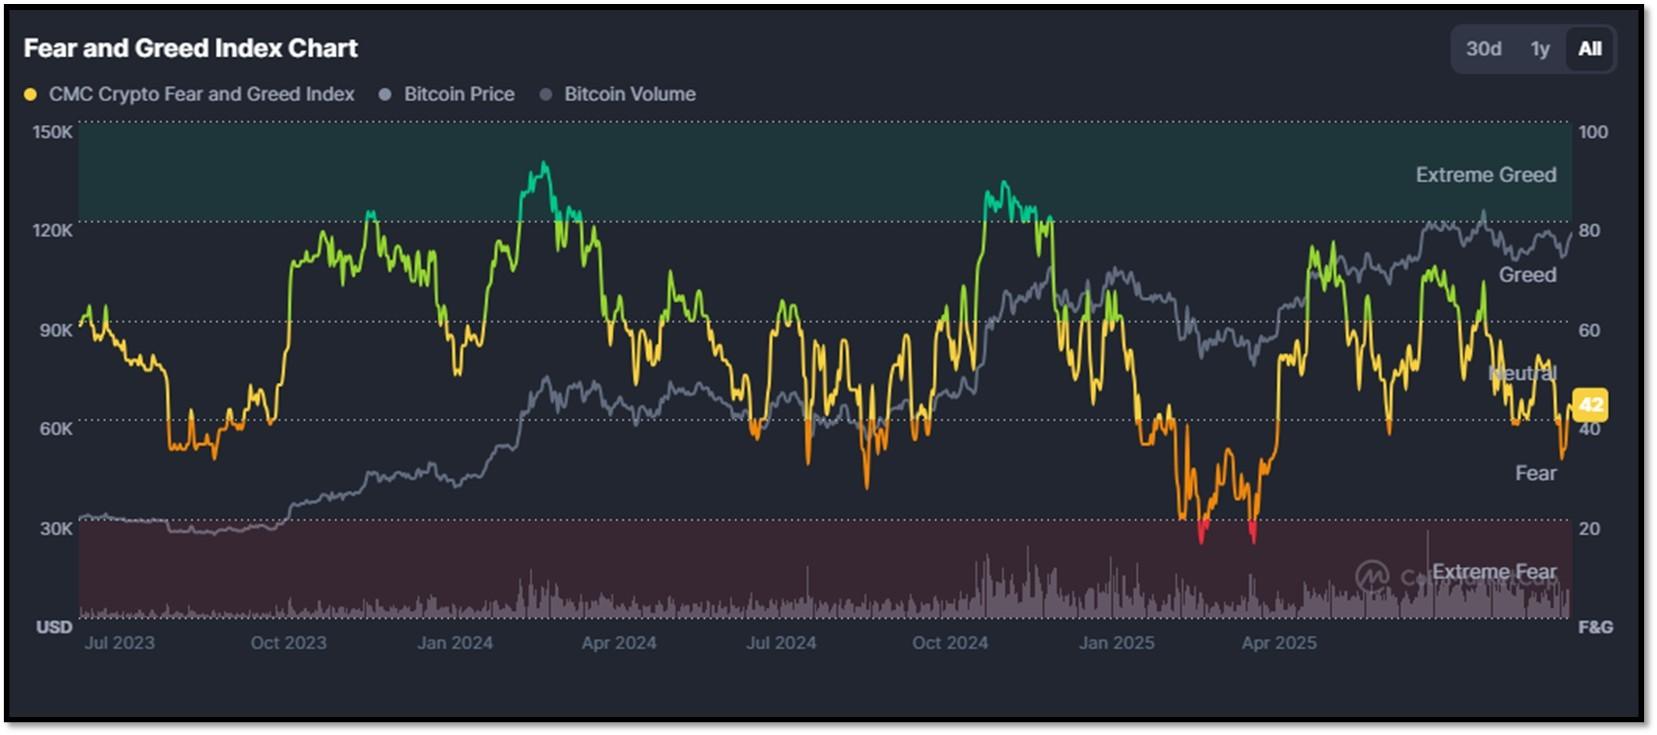
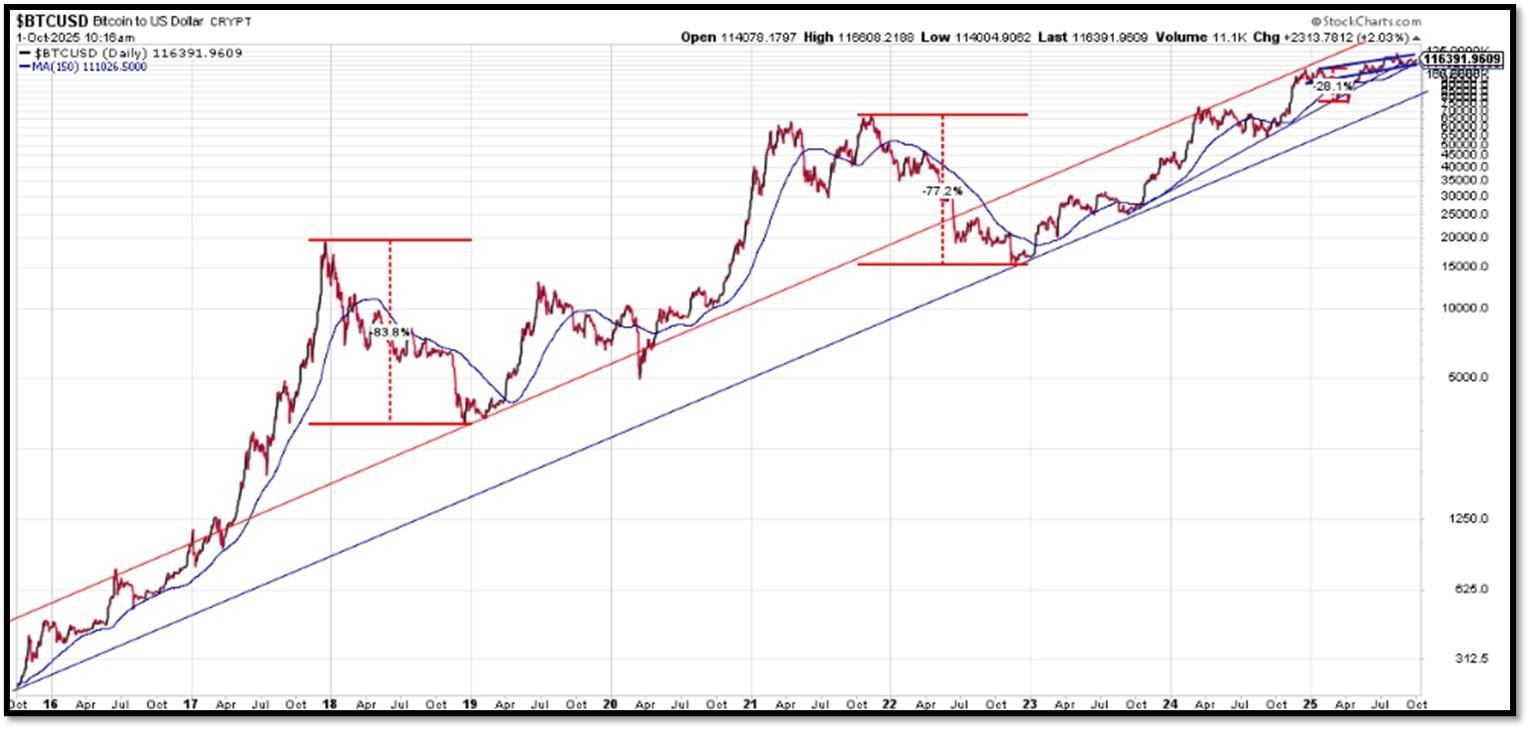
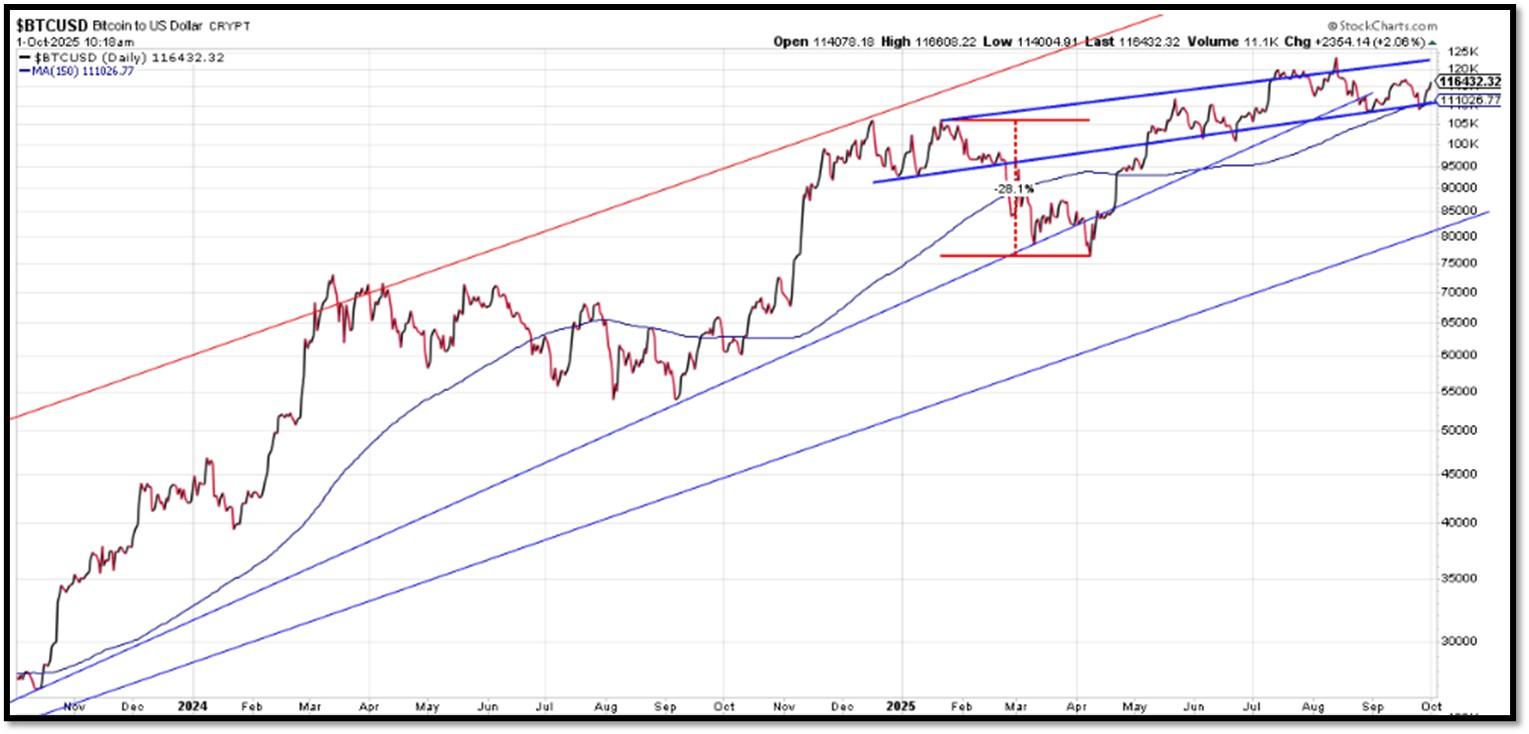
Bitcoin – 10-Year & 2-Year Charts. REF: Stockcharts10Y, Stockcharts2Y
From the desk of our Chief Investment Officer
As an investment professional with over twenty-six years of experience in the financial services industry, Andrew helps clients to protect, grow and transfer wealth during their lifetime with objective, unbiased, customized and efficient strategies.
Education, Professional Licenses Acquired & Affiliations
- Passed the Series 7, 63, 65 and 24 license examinations
- Currently holding Series 65 License
- BA in Economics – Boston University (Boston, MA) 1993
- Certificate in Commodities Trading – New York University (New York, NY) 1991
- Certificate in Financial Planning – New York University (New York, NY) April 2011
With extensive experience in the Financial Services Industry, Andrew Tang and Turner Financial Group provides disciplined wealth management with an intelligent caring approach to each and every client that compliments the Dedicated Financial offering.


Len writes much of his own content, and also shares helpful content from other trusted providers like Turner Financial Group (TFG).
The material contained herein is intended as a general market commentary, solely for informational purposes and is not intended to make an offer or solicitation for the sale or purchase of any securities. Such views are subject to change at any time without notice due to changes in market or economic conditions and may not necessarily come to pass. This information is not intended as a specific offer of investment services by Dedicated Financial and Turner Financial Group, Inc.
Dedicated Financial and Turner Financial Group, Inc., do not provide tax, legal or accounting advice. You should consult your own tax, legal and accounting advisors before engaging in any transaction.
Any hyperlinks in this document that connect to Web Sites maintained by third parties are provided for convenience only. Turner Financial Group, Inc. has not verified the accuracy of any information contained within the links and the provision of such links does not constitute a recommendation or endorsement of the company or the content by Dedicated Financial or Turner Financial Group, Inc. The prices/quotes/statistics referenced herein have been obtained from sources verified to be reliable for their accuracy or completeness and may be subject to change.
Past performance is no guarantee of future returns. Investing involves risk and possible loss of principal capital. The views and strategies described herein may not be suitable for all investors. To the extent referenced herein, real estate, hedge funds, and other private investments can present significant risks, including loss of the original amount invested. All indexes are unmanaged, and an individual cannot invest directly in an index. Index returns do not include fees or expenses.
Turner Financial Group, Inc. is an Investment Adviser registered with the United States Securities and Exchange Commission however, such registration does not imply a certain level of skill or training and no inference to the contrary should be made. Additional information about Turner Financial Group, Inc. is also available at www.adviserinfo.sec.gov. Advisory services are only offered to clients or prospective clients where Turner Financial Group, Inc. and its representatives are properly licensed or exempt from licensure. No advice may be rendered by Turner Financial Group, Inc. unless a client service agreement is in place.


