

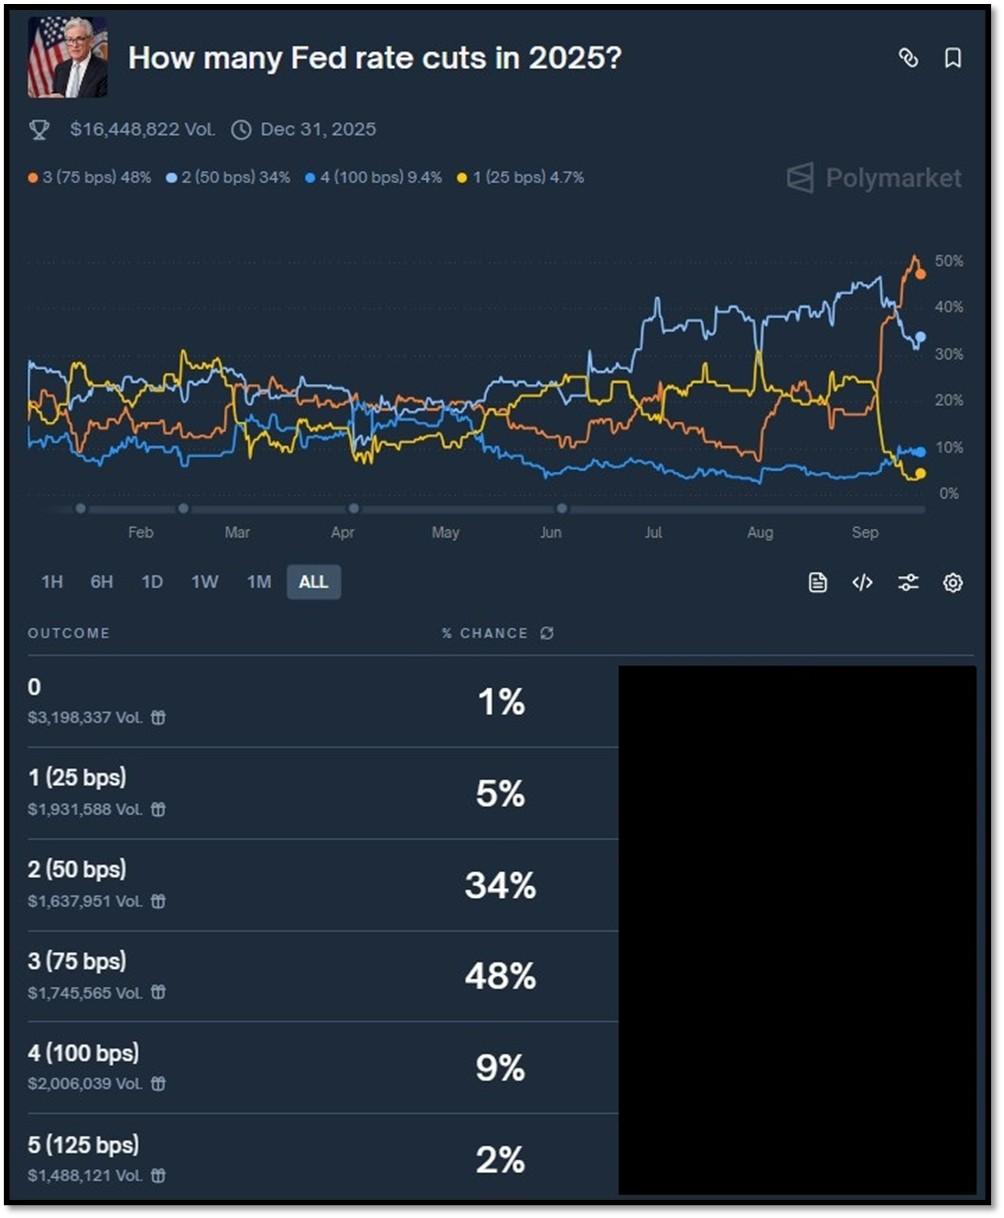
- 1. The Federal Reserve has reduced interest rates by 25 basis points at its September meeting, emphasizing a data-dependent stance with further cuts possible to bolster economic growth.
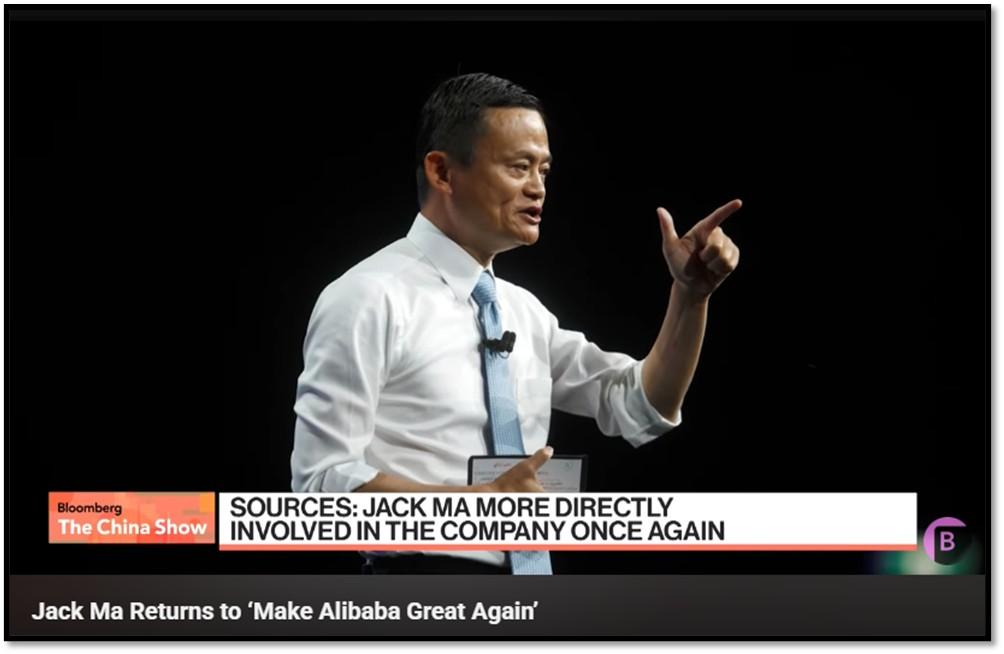
- 2. Jack Ma’s reemergence in the news, coupled with his vow to make Alibaba great again, highlights a symbolic and strategic turning point for China’s innovation and technology sector.
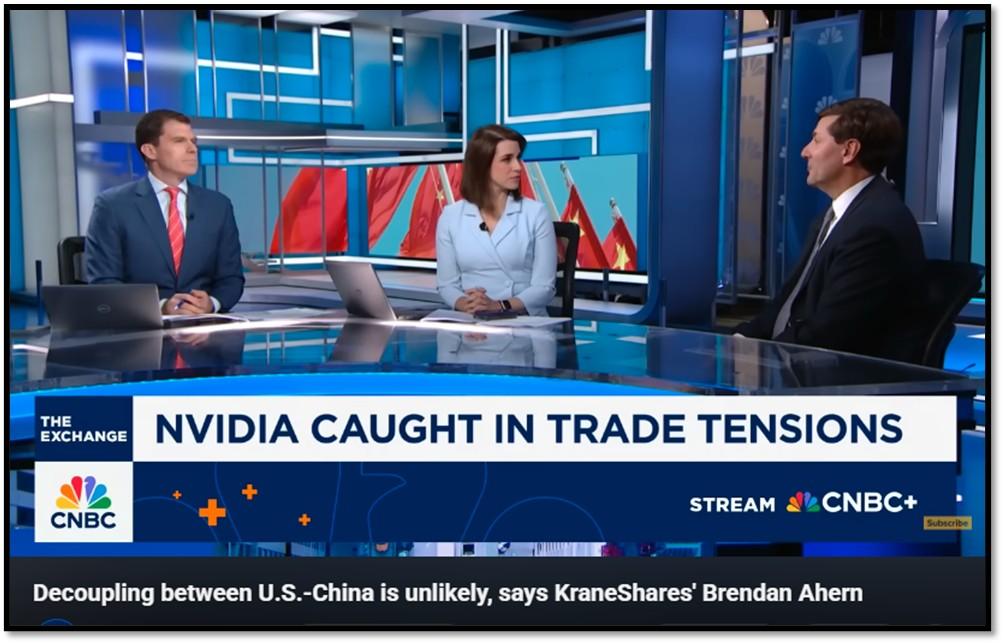
- 3. The KraneShares CSI China Internet ETF (KWEB) provides investors with exposure to a basket of leading China-based companies whose core businesses revolve around internet and internet-related technologies.
- 4. World Watch
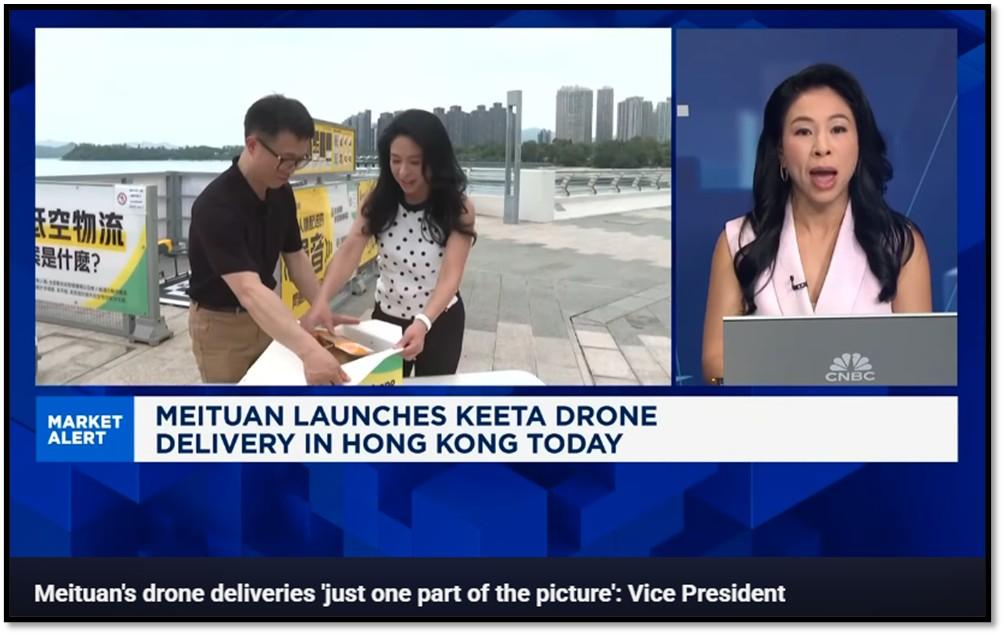
- 4A. In Shenzhen (China), drone delivery has become a reality, vividly captured in early 2025 videos on platforms like TikTok, X, FaceBook and YouTube, showing drones weaving through skyscrapers to deliver meals, drinks, and seafood in 20–30 minutes.
- 4B. Beyond China, several countries have operational drone food delivery services as of September 2025, primarily in suburban or rural areas rather than dense urban centers like Shenzhen.
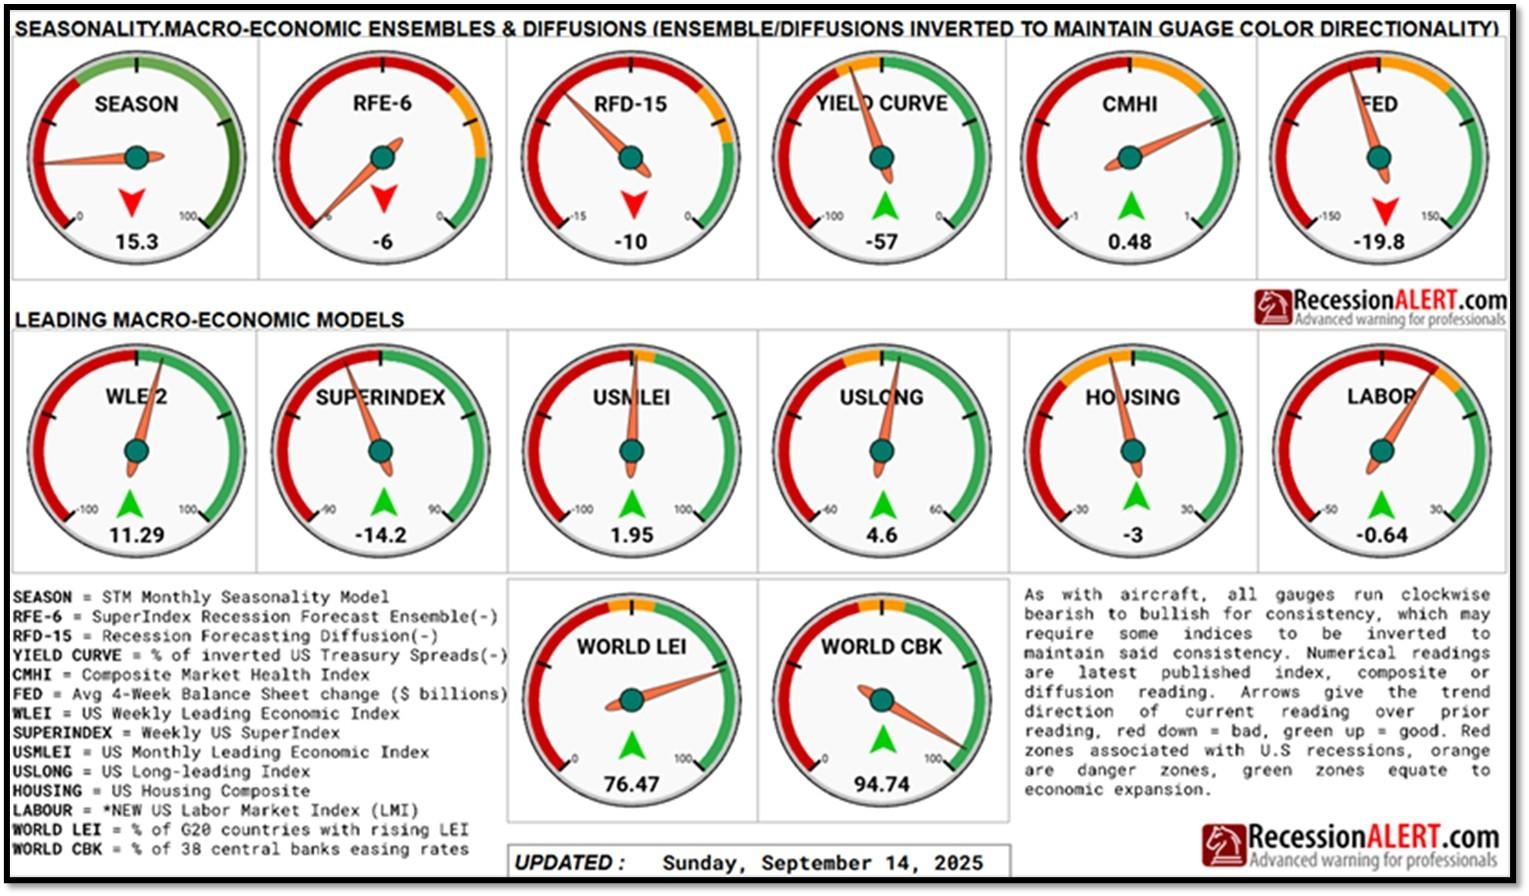
- 4C. An updated snapshot of the current global state of economy.
- 5. Quant & Technical Corner – A selection of quantitative & technical data we monitor on a regular basis to help gauge the overall financial market conditions and the investment environment.
1. The Federal Reserve has reduced interest rates by 25 basis points at its September meeting, emphasizing a data-dependent stance with further cuts possible to bolster economic growth.
The critical question is: How deep will this cut be, and how far will rates drop in 2025? The labor market provides a key insight, with the Bureau of Labor Statistics’ September 9, 2025, preliminary benchmark revision cutting job growth estimates by a record 911,000 for the 12 months ending March 2025, far surpassing forecasts of 600,000 to 1 million. This adjustment, the largest since at least 2002, revealed monthly job gains averaged only 71,000, compared to the previously reported 147,000, signaling a significant economic slowdown.
The weak labor market, underscored by August 2025’s mere 22,000 nonfarm payrolls against expectations of 160,000, suggests the economy was less robust than thought, potentially leading to downward GDP revisions for 2024–2025. Government-related sectors, including healthcare and social assistance, drove all net job growth in March 2025, while private sectors like leisure and retail contracted. The other piece of the puzzle is inflation, which, per the latest Producer Price Index data, shows businesses largely absorbed price adjustments from tariffs, keeping inflation under control but stubbornly sticky at 3.1% core CPI year-over-year in August. These factors support expectations for three rate cuts in 2025, likely totaling 75 to 100 basis points, with markets anticipating a 25 to 50 basis point cut in September, guided by upcoming data like October’s jobs report. REF: BLS-Revision, Bloomberg, CNN, Polymarket
2. Jack Ma’s reemergence in the news, coupled with his vow to make Alibaba great again, highlights a symbolic and strategic turning point for China’s innovation and technology sector.
As one of the most prominent figures in Chinese business, Ma’s renewed presence reinforces confidence not just in Alibaba, but in the broader capacity of Chinese firms to rival global peers. His return comes at a time when companies like Tencent, Huawei, and ByteDance are already proving China’s resilience in e-commerce, telecommunications, and social media. Together, these tech titans demonstrate that China’s innovative ecosystem is not lagging far behind the U.S., but rather recalibrating with fresh energy and ambition.
This resurgence showcases how China’s technology giants, despite regulatory pressures and external challenges, remain formidable competitors in the global marketplace. With Alibaba seeking renewed growth, Tencent dominating gaming and digital ecosystems, Huawei advancing in 5G and hardware, and ByteDance reshaping global social media, China is signaling its intent to be either first or a close second in the global technology race. Jack Ma’s return embodies this determination, illustrating how Chinese entrepreneurs and corporations alike are pushing forward to ensure their place at the top of the innovation hierarchy. The message is clear: U.S. dominance in technology is no longer uncontested, as China’s tech titans continue to build momentum and close the gap. Click onto picture below to access video. REF: Bloomberg, WSJ, Video
3. The KraneShares CSI China Internet ETF (KWEB) provides investors with exposure to a basket of leading China-based companies whose core businesses revolve around internet and internet-related technologies.
Its holdings include major players such as Alibaba, Tencent, Baidu, JD.com, Meituan, and ByteDance affiliates, covering sectors like e-commerce, online entertainment, cloud computing, digital advertising, and fintech. By tracking the growth of these Chinese tech titans, KWEB captures the innovation and expansion of China’s digital economy, offering a direct way to participate in the country’s ambition to compete with, and in some areas rival, U.S. technology giants. Click on picture below to access video with Brendon Ahern, PM of KWEB.
NOTE: Not investment advice or recommendations. Investors should carefully consider the investment objectives, risks, charges, and expenses before investing. For additional information about the securities mentioned above or in the video, please visit the respective companies’ investor relations pages or the websites of the funds discussed. Please read all materials carefully before investing.
KWEB – https://kraneshares.com/kweb/
With the current macro-economic backdrop, below are areas we currently favor:
- Fixed Income – Short-term Corporates (Low-Beta)
- Fixed Income – (Corporates & Muni) High Yield as Opportunistic Allocation (Low-Beta)
- Businesses that contribute to and benefit from AI & Automation (Market-Risk)
- India (Market-Risk)
- Fintech & Financials (Market-Risk)
- Digital Asset – Bitcoin (Market-Risk/Hedge)
- Cloud Computing (Market-Risk)
- Cyber-Security & Software (Market-Risk)
4. World Watch
4A. In Shenzhen (China), drone delivery has become a reality, vividly captured in early 2025 videos on platforms like TikTok, X, FaceBook and YouTube, showing drones weaving through skyscrapers to deliver meals, drinks, and seafood in 20–30 minutes.
Footage from Shenzhen Talent Park and Central Park highlights Meituan’s yellow-and-black drones landing at kiosk-like stations, unloading insulated boxes with precision. Meituan, backed by Tencent, has pioneered this since 2017, completing over 100,000 deliveries in Shenzhen by 2022 and expanding to 28 routes across 11 districts by 2024, including Tsinghua University Shenzhen. SF Express, a subsidiary of SF Holding with domestic investor support, runs specialized routes, such as seafood delivery from Nan’ao Shuangyong Pier to Longgang, with drones carrying up to 20 kilograms. SF Express secured China’s first drone delivery trial license in 2022, operating 66 routes in areas like Nanshan. DJI, a Shenzhen-based drone giant with 70% global market share, supplies hardware but focuses less on delivery services. The concept of drone delivery took shape in China around 2013, with early trials by SF Express and JD.com, evolving into a mature ecosystem in Shenzhen over the past decade.
Shenzhen’s drone delivery system drives significant economic activity, with the government investing US$1.7 billion by 2026 for 1,200+ landing platforms to support a “low-altitude economy.” In 2024, drones delivered 2.7 million packages nationwide, with Shenzhen adding 94 routes for 600,000+ flights. Meituan served 20,000 customers with 19,000 meals in Shenzhen by 2022, and China’s drone delivery market is projected to reach US$1.064 billion by 2030, growing 42.9% annually. Backed by Tencent and state policies, Meituan and SF Express are leading a logistics transformation, positioning Shenzhen as a global drone delivery hub. Click onto pictures below to access videos. REF: Bloomberg, CNBC, Meituan, SF Express

4B. Beyond China, several countries have operational drone food delivery services as of September 2025, primarily in suburban or rural areas rather than dense urban centers like Shenzhen.
In the United States, Flytrex and Wing lead the way. Flytrex, Israeli-founded, partners with DoorDash to deliver from Papa John’s and Jersey Mike’s in Texas and North Carolina, serving 30,000+ households in places like Frisco since June 2025. Wing, an Alphabet subsidiary, operates in Christiansburg, Virginia, delivering Walmart and local eatery orders with daily flights and payloads up to 4 kg. Zipline, backed by Sequoia Capital, expanded from medical to food deliveries with Chipotle in Rowlett, Texas, by August 2025, focusing on suburban opt-in programs. These U.S. services, enabled by FAA exemptions for beyond-visual-line-of-sight flights, completed over 100,000 deliveries by mid-2025.
In Europe and beyond, drone food delivery is growing with regulatory support. Ireland’s Manna, backed by Main Street and Atlantic Bridge, holds Europe’s first commercial drone license, delivering Tesco and takeaway orders, with 100,000+ flights by 2022 and urban expansions in 2025. The UK’s Skyports (backed by Mitsui & Co.) and Windracers (UK government-funded) test rural food deliveries, planning broader rollouts post-2025. Sweden trials hot food drones for a 2026 launch. The UAE integrates drones in Dubai and Abu Dhabi smart city projects via Matternet (Swiss-based, regionally funded). Rwanda’s Zipline, supported by the Gates Foundation, is shifting from medical to urban food deliveries by 2026. The global drone delivery market is projected to grow from $709 million in 2025 to $8.5 billion by 2032. Click onto pictures below to access videos. REF: Flytrex, Wing, Zipline, Manna, Skyports, Windracers, Matternet


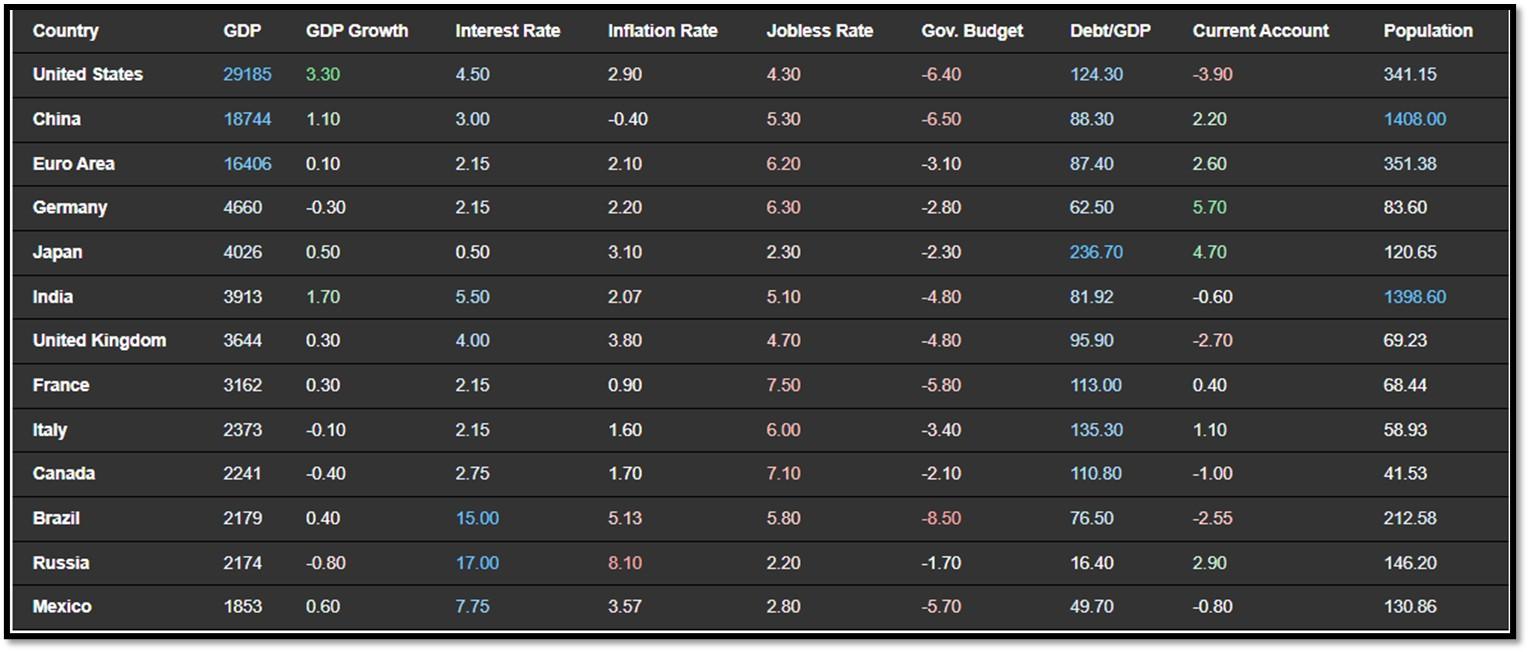
4C. An updated snapshot of the current global state of economy.
According to TradingEconomics as of 9/15/2025 (REF: TradingEconomics):
- China’s surveyed unemployment rate edged higher to 5.3% in August 2025, compared to market expectations and the prior month’s 5.2%.
- The gross domestic product in India expanded 1.7% quarter-on-quarter in the three months to June 2025, easing from a 2% growth in the previous period, according to data from OECD. GDP Growth Rate in India averaged 1.65 percent from 1996 until 2025, reaching an all time high of 22.60 percent in the third quarter of 2020 and a record low of -22.80 percent in the second quarter of 2020.
- Gold prices hit another fresh record at around $3,690 per ounce on Tuesday, supported by a weaker US dollar ahead of the Federal Reserve’s two-day policy meeting that starts today.
- Brent crude oil futures fell to $67.1 per barrel on Tuesday, erasing earlier gains that had been driven by concerns over supply disruptions from Russia amid continued Ukrainian strikes on its energy infrastructure.
5. Quant & Technical Corner – A selection of quantitative & technical data we monitor on a regular basis to help gauge the overall financial market conditions and the investment environment.
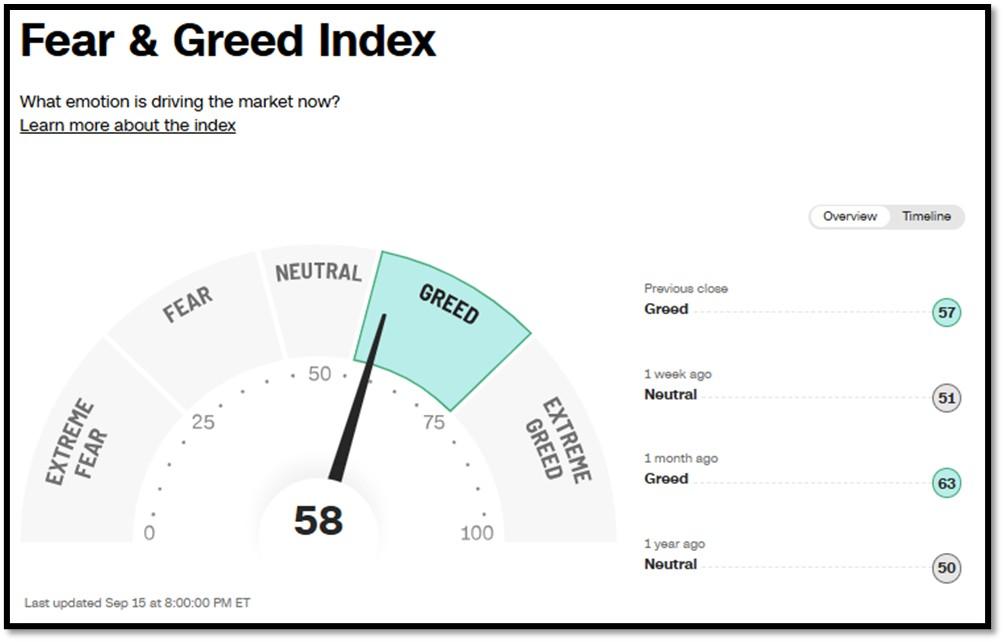
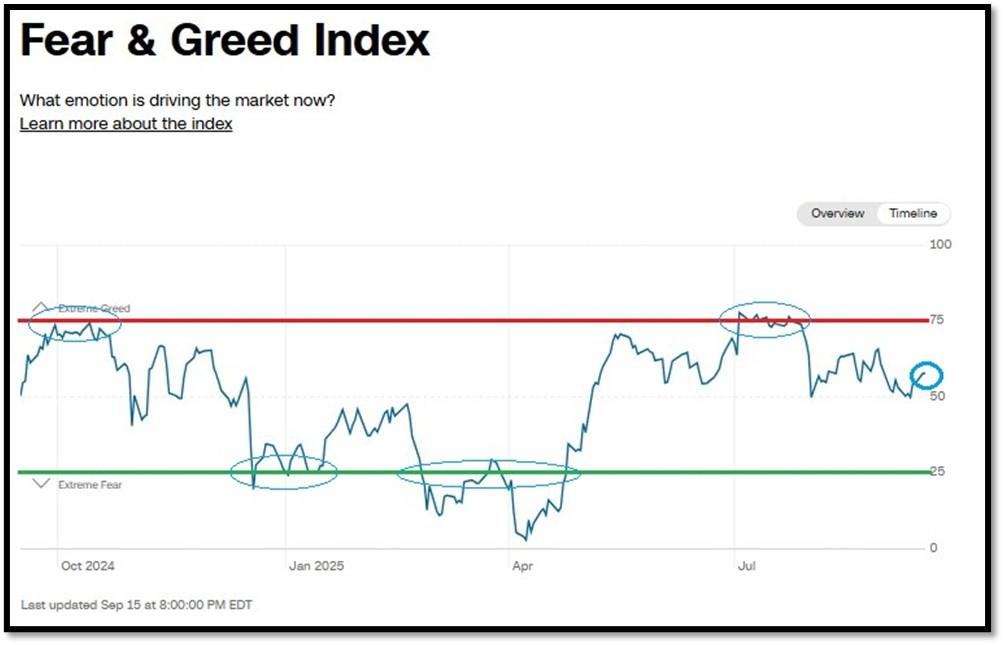
5A. Most recent read on the Fear & Greed Index with data as of 9/15/2025 – 8:00 PM-ET is 58 (Greed). Last week’s data was 51 (Neutral) (1-100). CNNMoney’s Fear & Greed index looks at 7 indicators (Stock Price Momentum, Stock Price Strength, Stock Price Breadth, Put and Call Options, Junk Bond Demand, Market Volatility, and Safe Haven Demand). Keep in mind this is a contrarian indicator! REF: Fear&Greed via CNNMoney
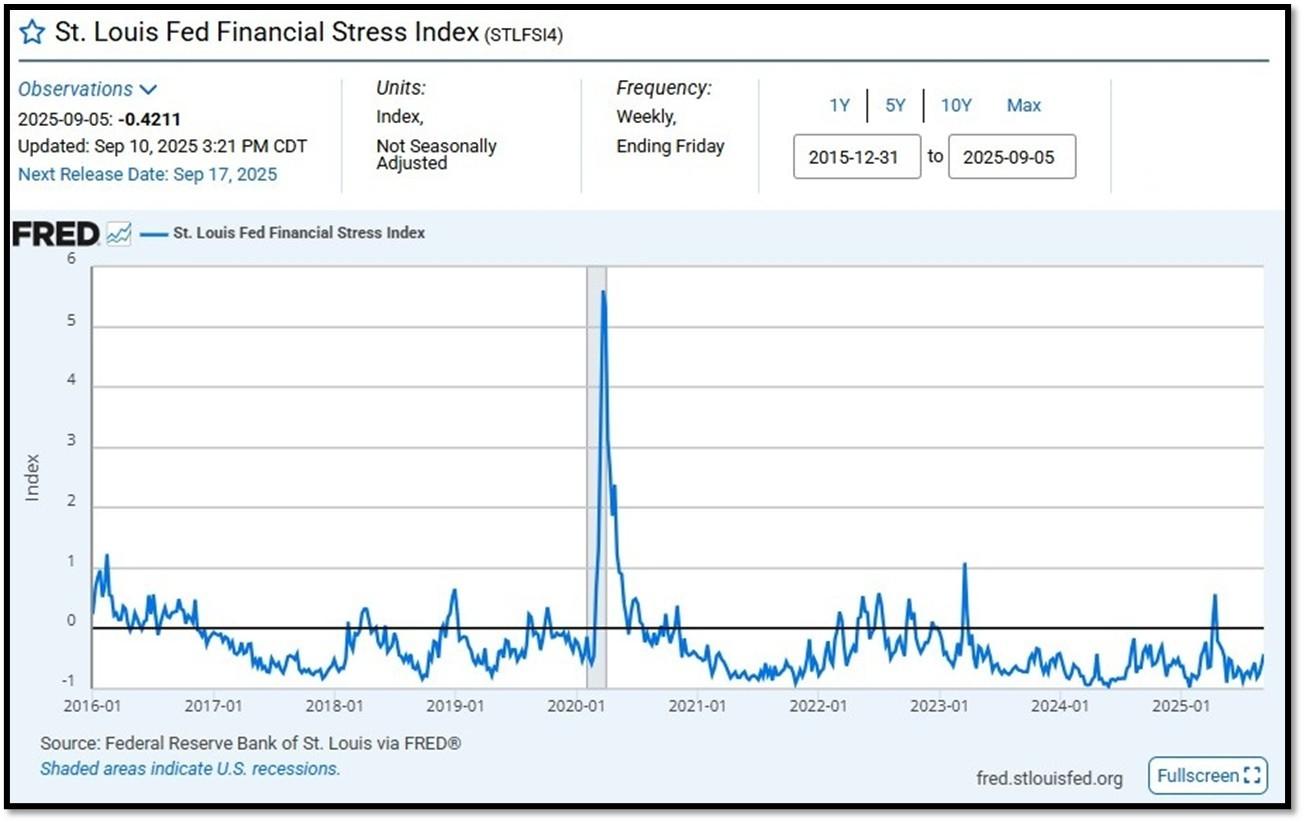
5B. St. Louis Fed Financial Stress Index’s (STLFSI4) most recent read is at –0.4211 as of September 10, 2025. Previous week’s data was -0.7505. A big spike up from previous readings reflecting the turmoil in the banking sector back in 2023. This weekly index is not seasonally adjusted. The STLFSI4 measures the degree of financial stress in the markets and is constructed from 18 weekly data series: seven interest rate series, six yield spreads and five other indicators. Each of these variables captures some aspect of financial stress. Accordingly, as the level of financial stress in the economy changes, the data series are likely to move together. REF: St. Louis Fed
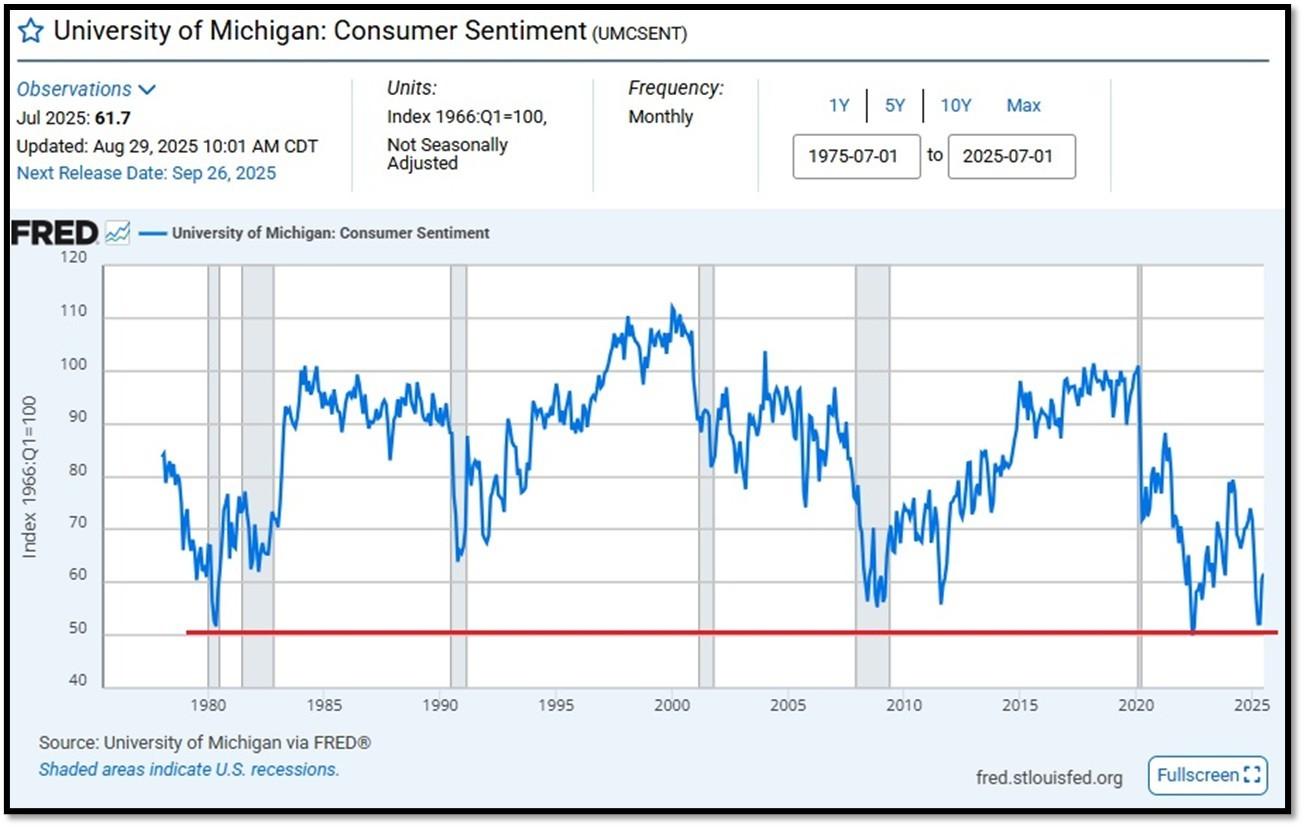
5C. University of Michigan, University of Michigan: Consumer Sentiment [UMCSEMT] for July at 61.7, retrieved from FRED, Federal Reserve Bank of St. Louis, August 29, 2025. Back in June 2022, Consumer Sentiment hit a low point going back to April 1980. REF: UofM
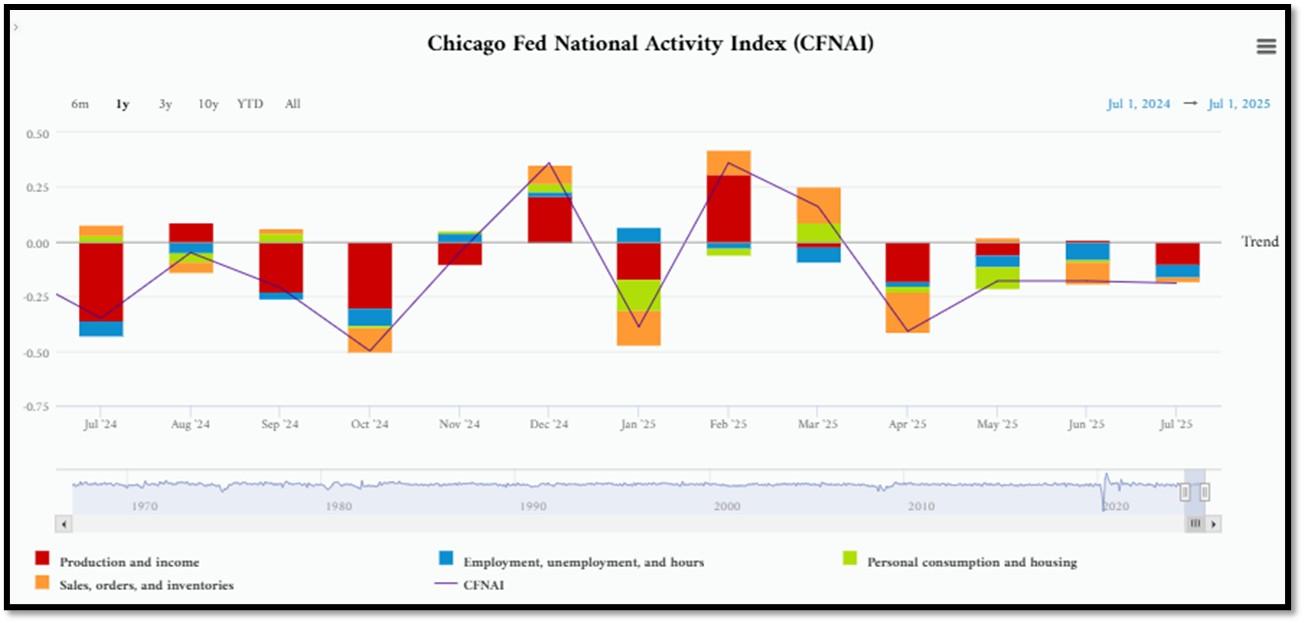
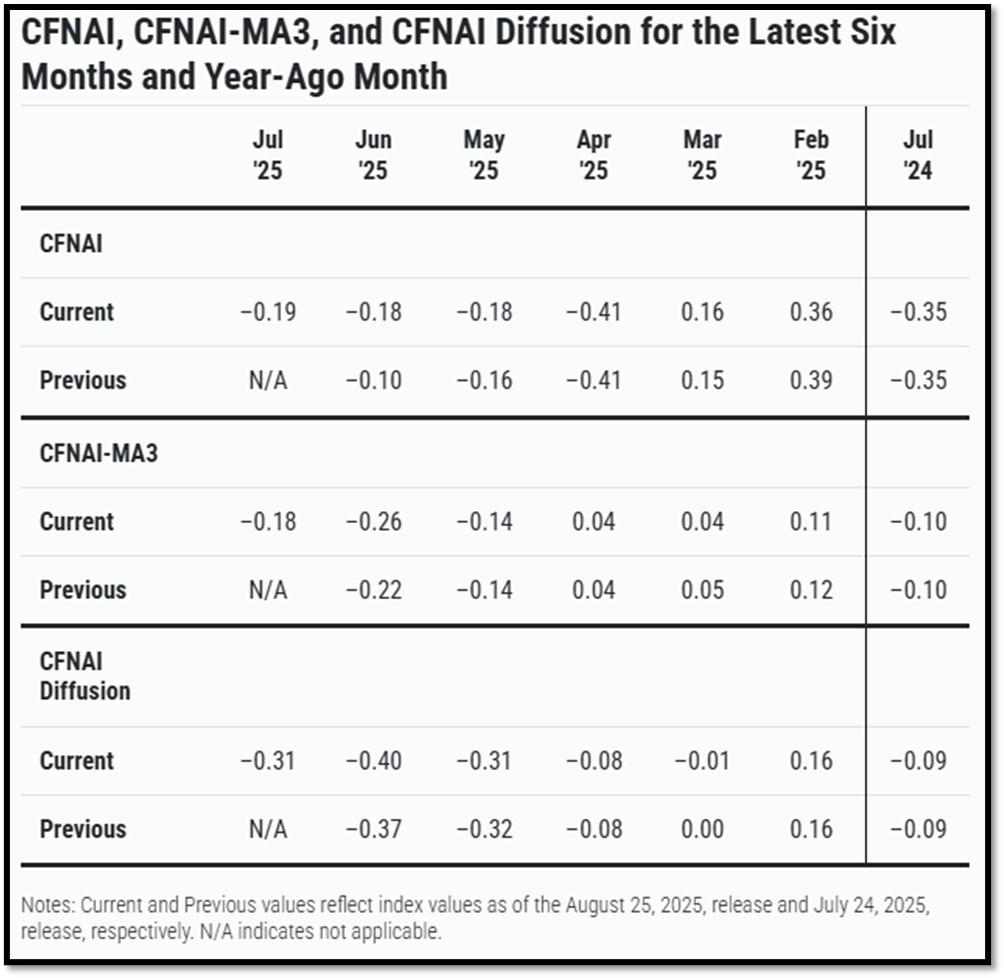
5D. The Chicago Fed National Activity Index (CFNAI) decreased to –0.19 in July from –0.18 in June. One of the four broad categories of indicators used to construct the index decreased from June, and three categories made negative contributions in July. The index’s three-month moving average, CFNAI-MA3, increased to –0.18 in July from –0.26 in June. REF: ChicagoFed, June’s Report
5E. (8/21/2025) The Conference Board Leading Economic Index (LEI) for the US inched down by 0.1% in July 2025 to 98.7 (2016=100), after declining by 0.3% in June. The LEI fell by 2.7% over the six months between January and July 2025, a faster rate of decline than its –1.0% contraction over the previous six-month period (July 2024 to January 2025. The composite economic indexes are the key elements in an analytic system designed to signal peaks and troughs in the business cycle. The indexes are constructed to summarize and reveal common turning points in the economy in a clearer and more convincing manner than any individual component. The CEI is highly correlated with real GDP. The LEI is a predictive variable that anticipates (or “leads”) turning points in the business cycle by around 7 months. Shaded areas denote recession periods or economic contractions. The dates above the shaded areas show the chronology of peaks and troughs in the business cycle. The ten components of The Conference Board Leading Economic Index® for the U.S. include: Average weekly hours in manufacturing; Average weekly initial claims for unemployment insurance; Manufacturers’ new orders for consumer goods and materials; ISM® Index of New Orders; Manufacturers’ new orders for nondefense capital goods excluding aircraft orders; Building permits for new private housing units; S&P 500® Index of Stock Prices; Leading Credit Index™; Interest rate spread (10-year Treasury bonds less federal funds rate); Average consumer expectations for business conditions. REF: ConferenceBoard, LEI Report for July (ReceesionAlert) (Released on 9/1/2025)
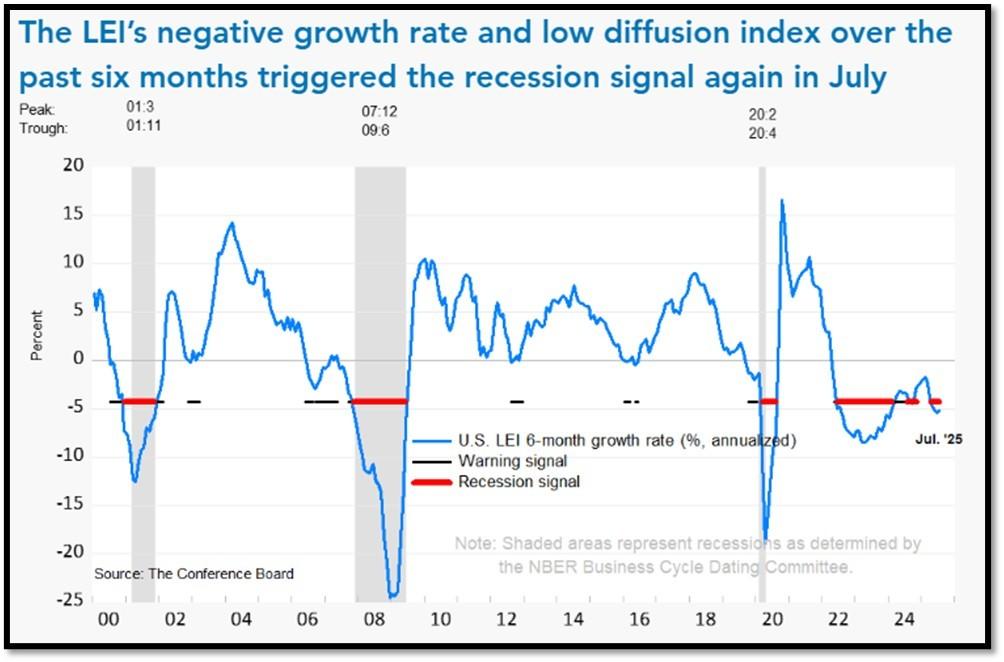
We have experienced a “rolling recession” since June 2022 and are only now emerging from it. However, authorities are not labeling it a recession due to high employment data.
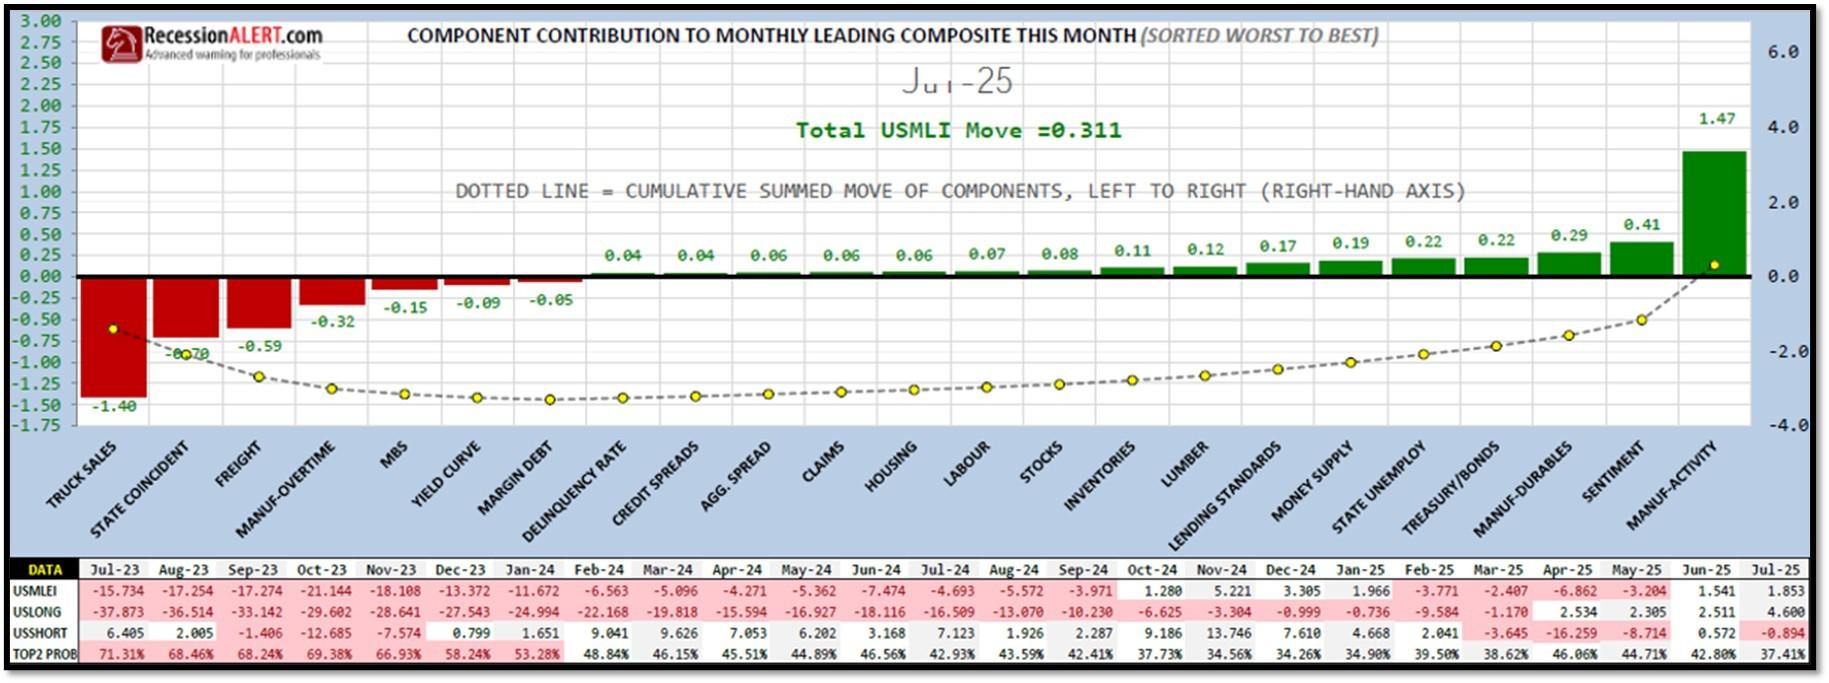
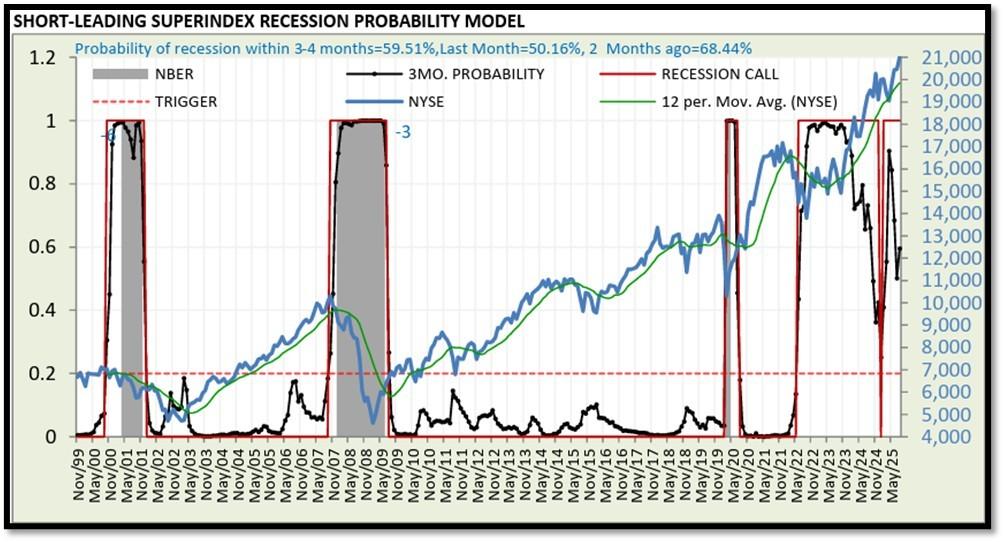
5F. Probability of U.S. falling into Recession within 3 to 4 months is currently at 59.51% (with data as of 09/14/2025 – Next Report 09/29/2025) according to RecessionAlert Research. Last release’s data was at 58.54%. This report is updated every two weeks. REF: RecessionAlertResearch
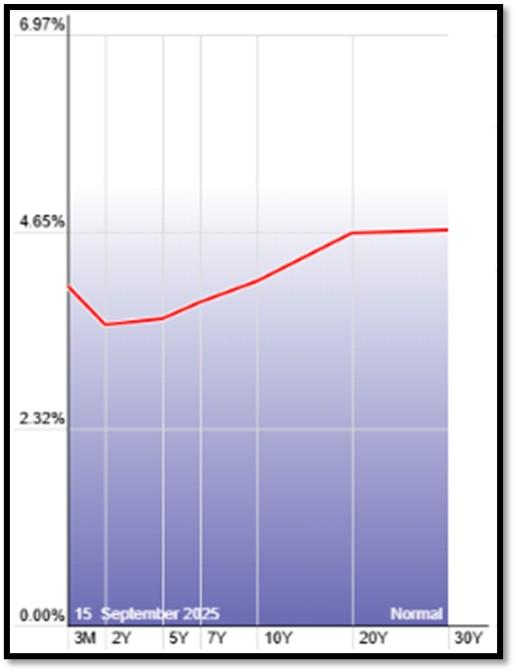
5G. Yield Curve as of 9/15/2025 is showing Normal. Spread on the 10-yr Treasury Yield (4.04%) minus yield on the 2-yr Treasury Yield (3.54%) is currently at 50bps. REF: Stockcharts The yield curve—specifically, the spread between the interest rates on the ten-year Treasury note and the three-month Treasury bill—is a valuable forecasting tool. It is simple to use and significantly outperforms other financial and macroeconomic indicators in predicting recessions two to six quarters ahead. REF: NYFED
5H. Recent Yields in 10-Year Government Bonds. REF: Source is from Bloomberg.com, dated 9/15/2025, rates shown below are as of 9/15/2025, subject to change.
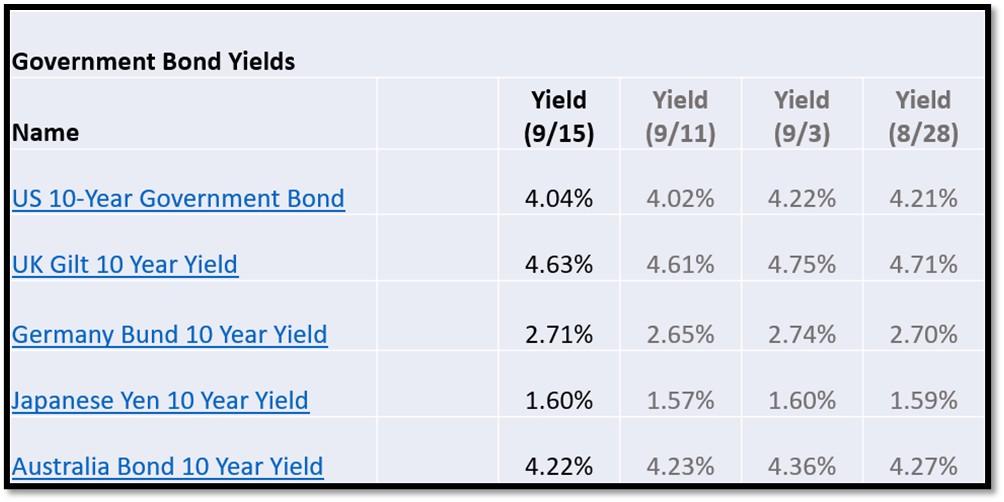
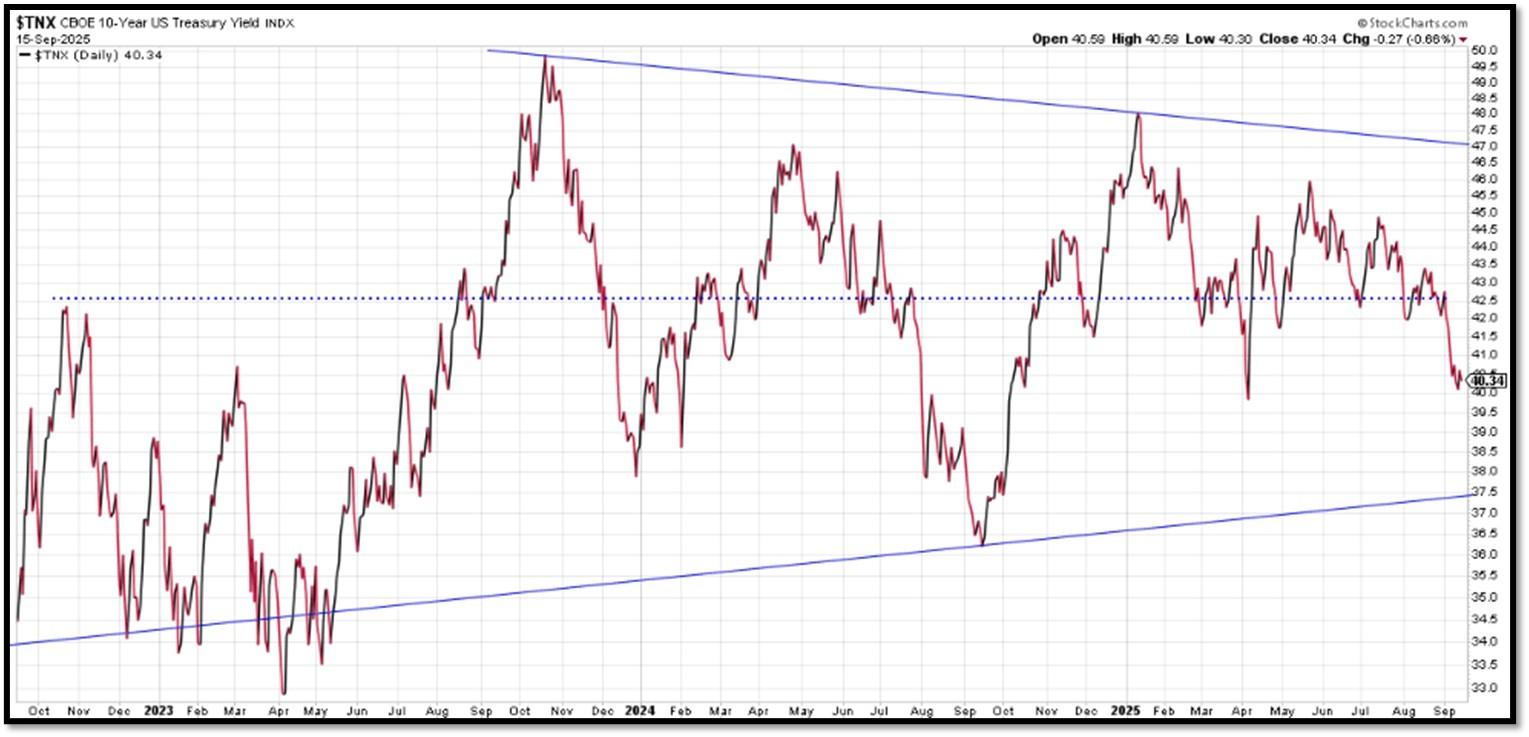
The 10-Year US Treasury Yield… The 10-Year Yield is indirectly related to inflation. I expect the 10-Year Yield to drop further as dis-inflation kicks in. REF: StockCharts1
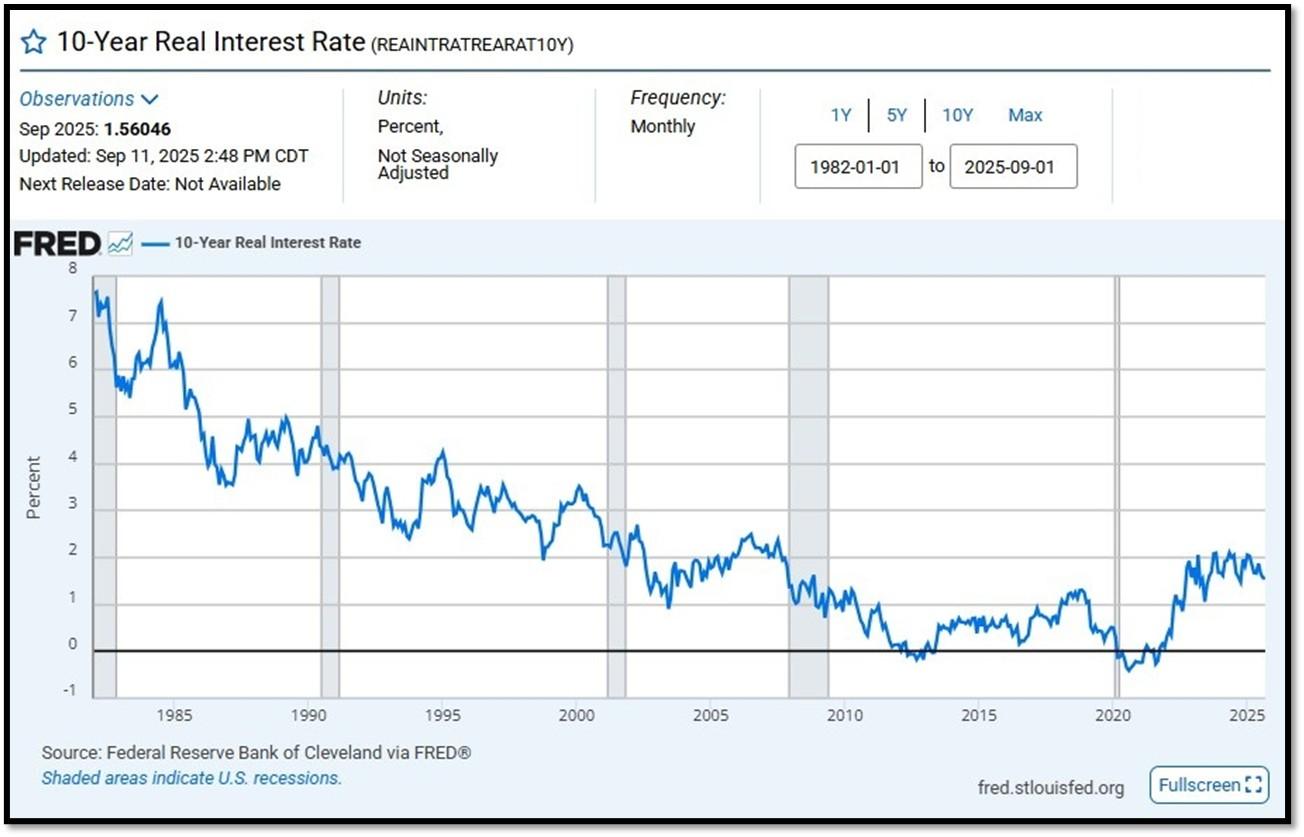
10-Year Real Interest Rate at 1.56046% as of 9/11/25. Last month’s data was 1.56633%. REF: REAINTRATREARAT10Y
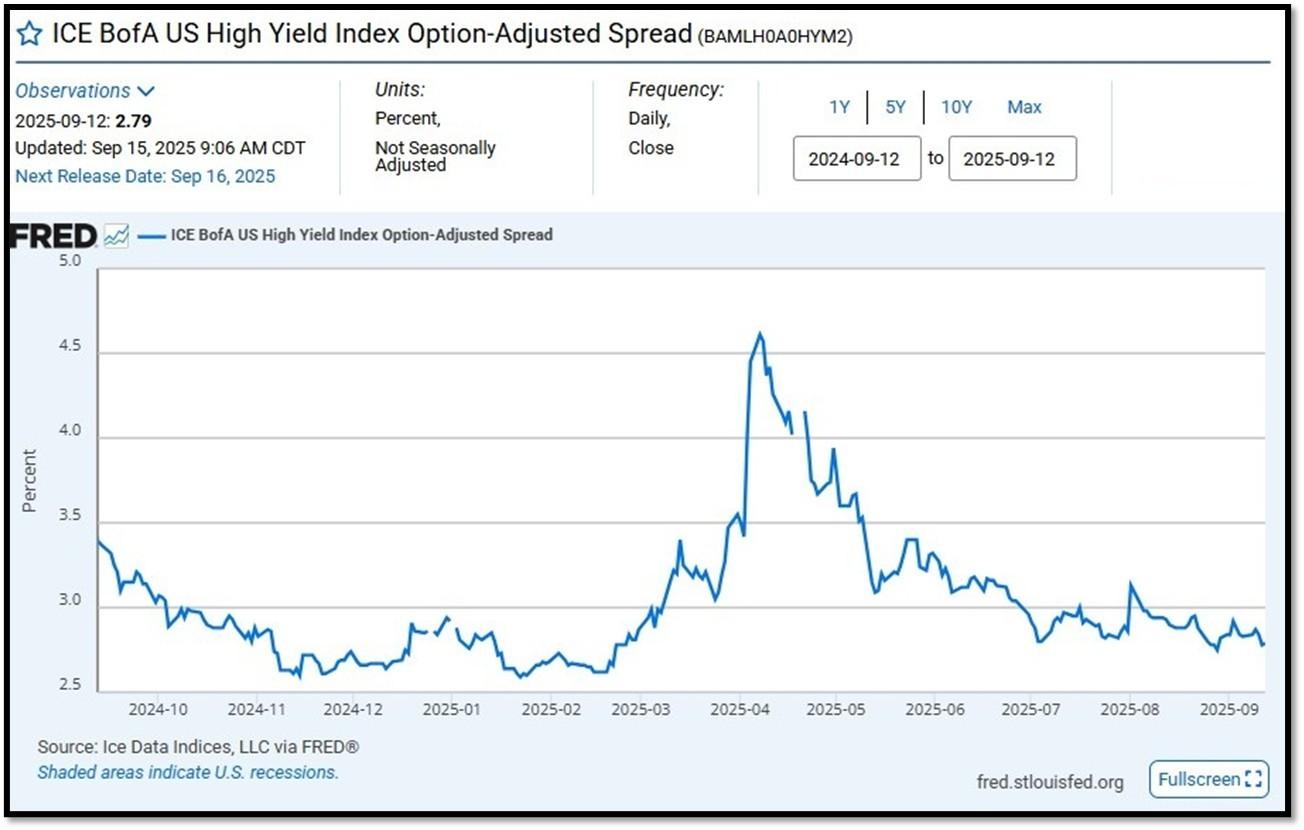
ICE BofA US High Yield Index Option-Adjusted Spread (BAMLH0A0HYM2) currently at 2.79 as of September 15, 2025. This is a key indicator of market sentiment, particularly regarding risk and economic health. At its core, the spread reflects the extra return investors demand to hold riskier corporate debt over safer government securities. High-yield bonds are issued by companies with lower credit ratings (below investment grade, like BB or lower), meaning they carry a higher chance of default. The spread compensates for this risk. When the spread is narrow—say, around 2.5% to 3%, as seen recently—it suggests investors are confident, willing to accept less extra yield because they perceive lower default risk or a strong economy. Narrow spreads often align with bullish markets, where cash is flowing, growth is steady, and fear is low. REF: FRED-BAMLH0A0HYM2
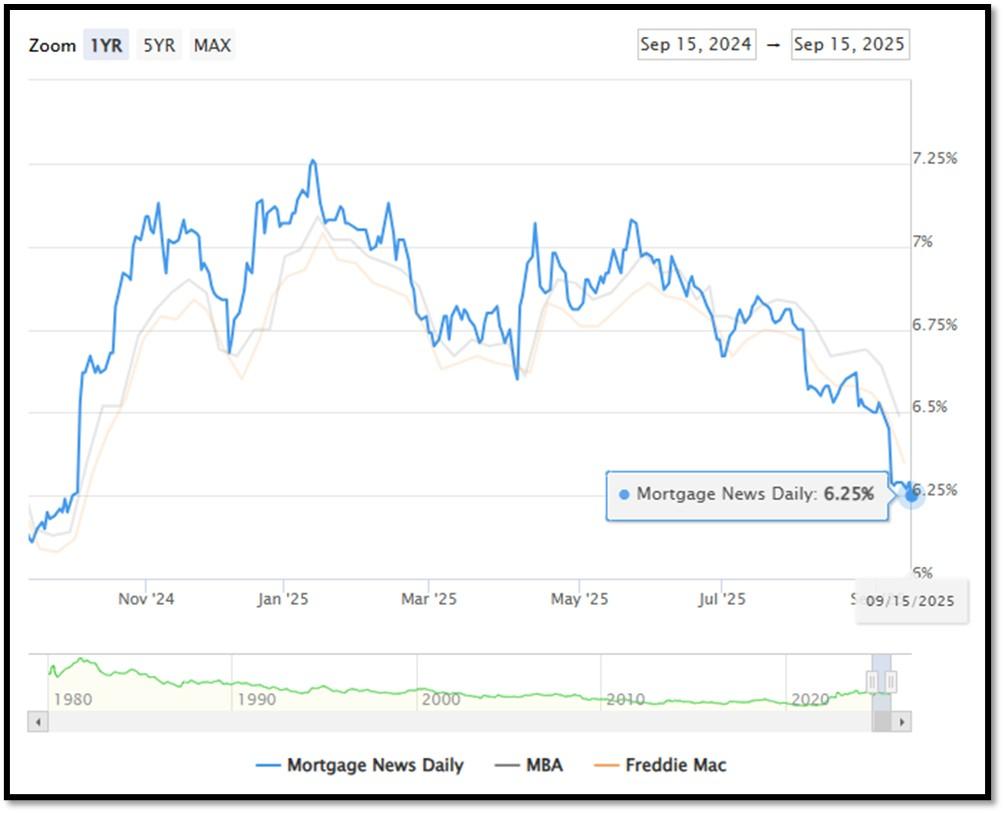
5I. (9/15/2025) Today’s National Average 30-Year Fixed Mortgage Rate is 6.25% (All Time High was 8.03% on 10/19/23). Last week’s data was 6.27%. This rate is the average 30-year fixed mortgage rates from several different surveys including Mortgage News Daily (daily index), Freddie Mac (weekly survey), Mortgage Bankers Association (weekly survey) and FHFA (monthly survey). REF: MortgageNewsDaily, Today’s Average Rate
The recent spike in the 30-year fixed-rate jumbo mortgage to 6.25%, compared to Freddie Mac’s rate at 6.35% and the Mortgage Bankers Association (MBA) rate at 6.49%, highlights key differences in the mortgage market. Jumbo mortgages, which exceed the conforming loan limits set by government agencies like Freddie Mac, typically carry higher interest rates because they are riskier for lenders. These loans are not backed by government entities, which increases the risk for lenders and, consequently, leads to higher rates. In contrast, Freddie Mac and MBA provide averages for conforming loans, which meet federal guidelines and have lower risk due to government backing, keeping their rates lower.
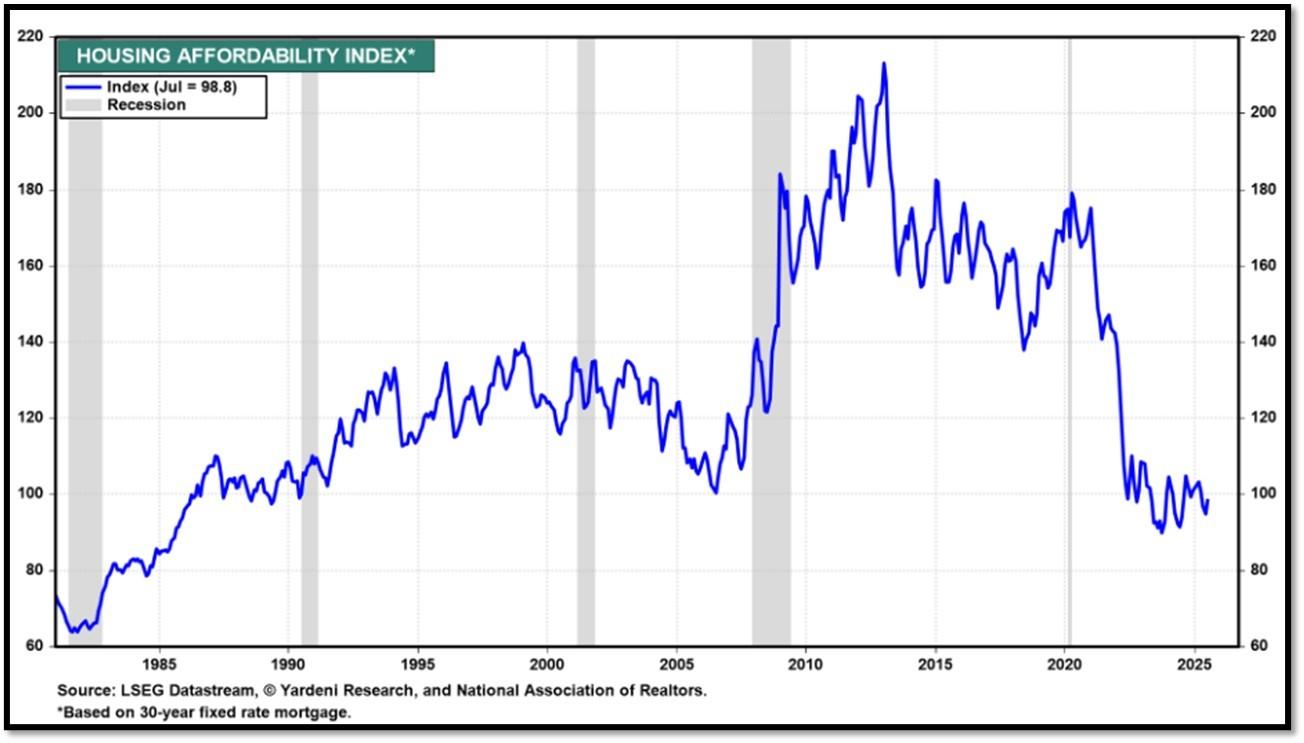
Housing Affordability Index for July = 98.8 // Jun = 94.4 // May = 97.2 // Apr = 101.0 // Mar = 103.2 // Feb = 102.2 // Jan = 100.7. Data provided by Yardeni Research. REF: Yardeni
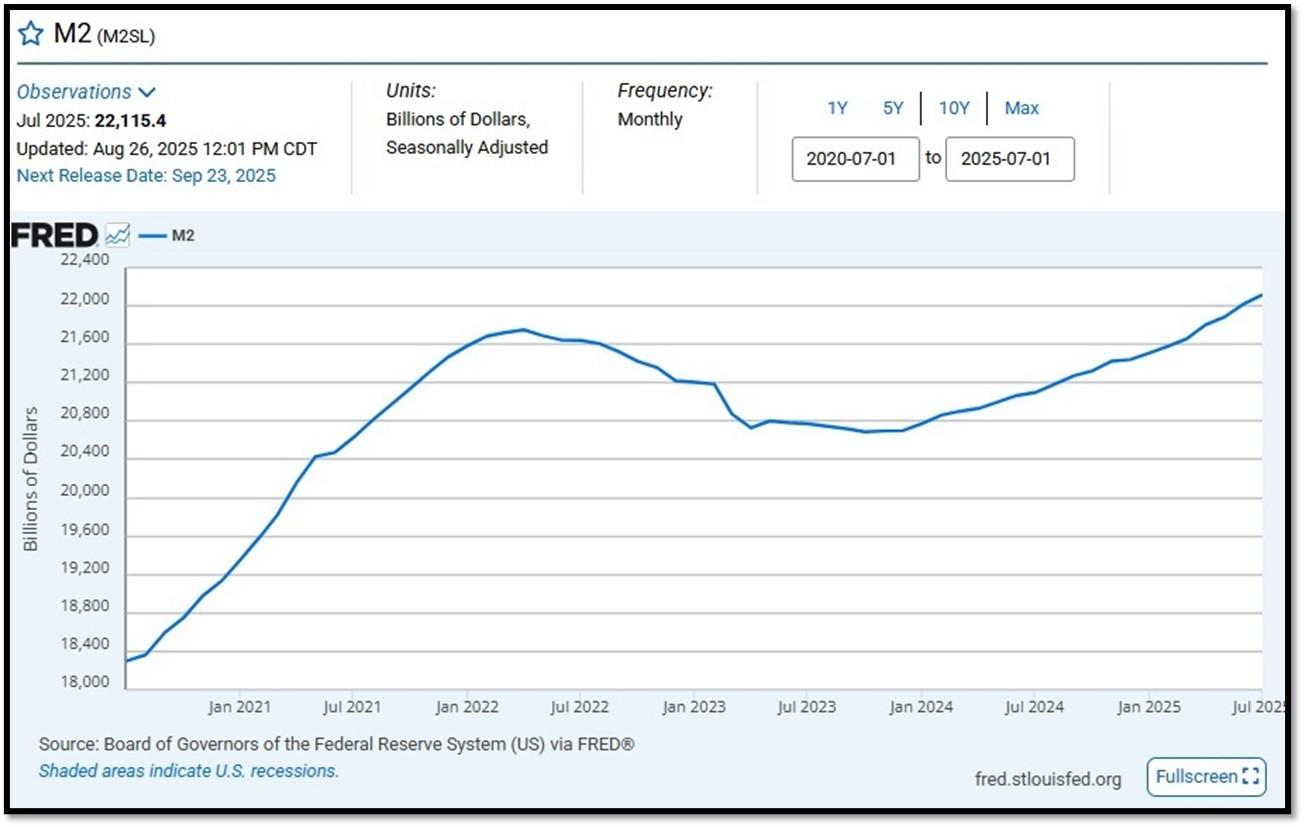
5J. Velocity of M2 Money Stock (M2V) with current read at 1.386 as of (Q2-2025 updated August 28, 2025). Previous quarter’s data was 1.386. The velocity of money is the frequency at which one unit of currency is used to purchase domestically- produced goods and services within a given time period. In other words, it is the number of times one dollar is spent to buy goods and services per unit of time. If the velocity of money is increasing, then more transactions are occurring between individuals in an economy. Current Money Stock (M2) report can be viewed in the reference link. REF: St.LouisFed-M2V
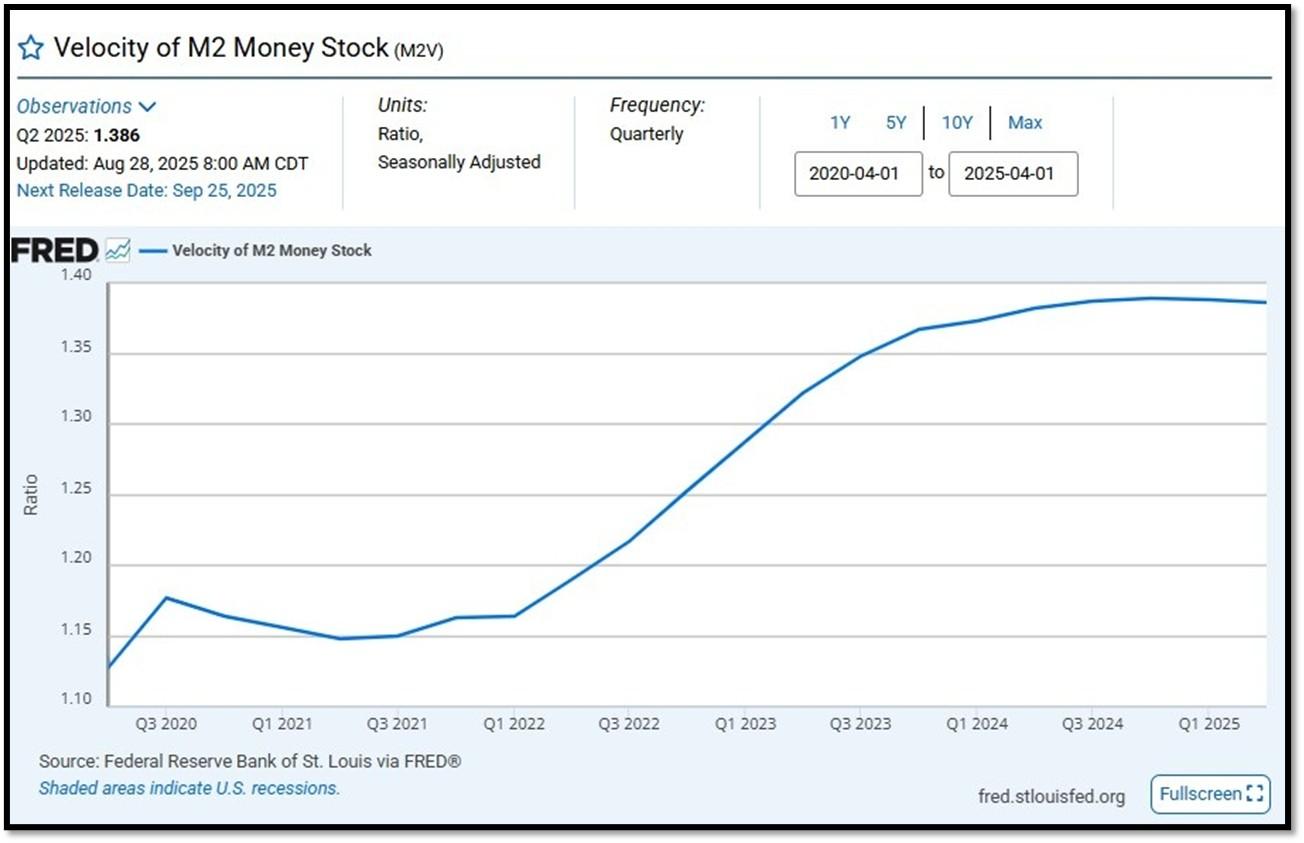
M2 consists of M1 plus (1) small-denomination time deposits (time deposits in amounts of less than $100,000) less IRA and Keogh balances at depository institutions; and (2) balances in retail MMFs less IRA and Keogh balances at MMFs. Seasonally adjusted M2 is constructed by summing savings deposits (before May 2020), small-denomination time deposits, and retail MMFs, each seasonally adjusted separately, and adding this result to seasonally adjusted M1. Board of Governors of the Federal Reserve System (US), M2 [M2SL], retrieved from FRED, Federal Reserve Bank of St. Louis; Updated on July 22, 2025. REF: St.LouisFed-M2
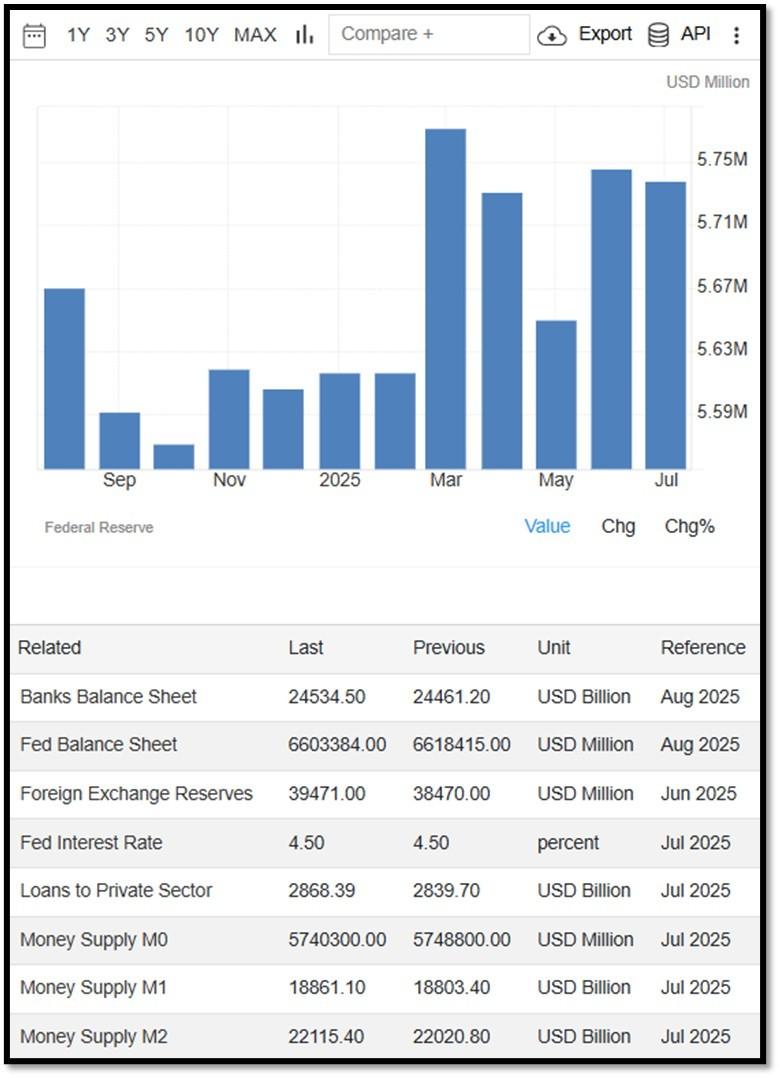
Money Supply M0 in the United States decreased to 5,740,300 USD Million in July from 5,748,800 USD Million in June of 2025. Money Supply M0 in the United States averaged 1,205,962.08 USD Million from 1959 until 2025, reaching an all-time high of 6,413,100.00 USD Million in December of 2021 and a record low of 48,400.00 USD Million in February of 1961. REF: TradingEconomics, M0
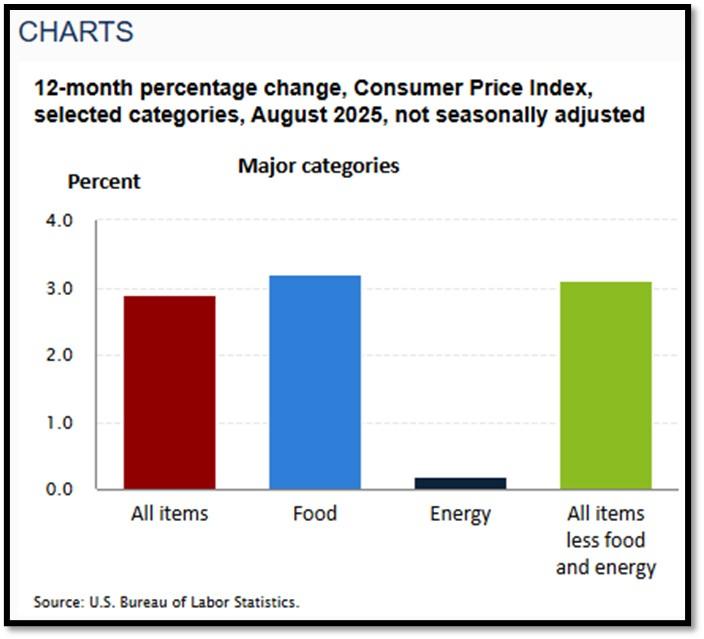
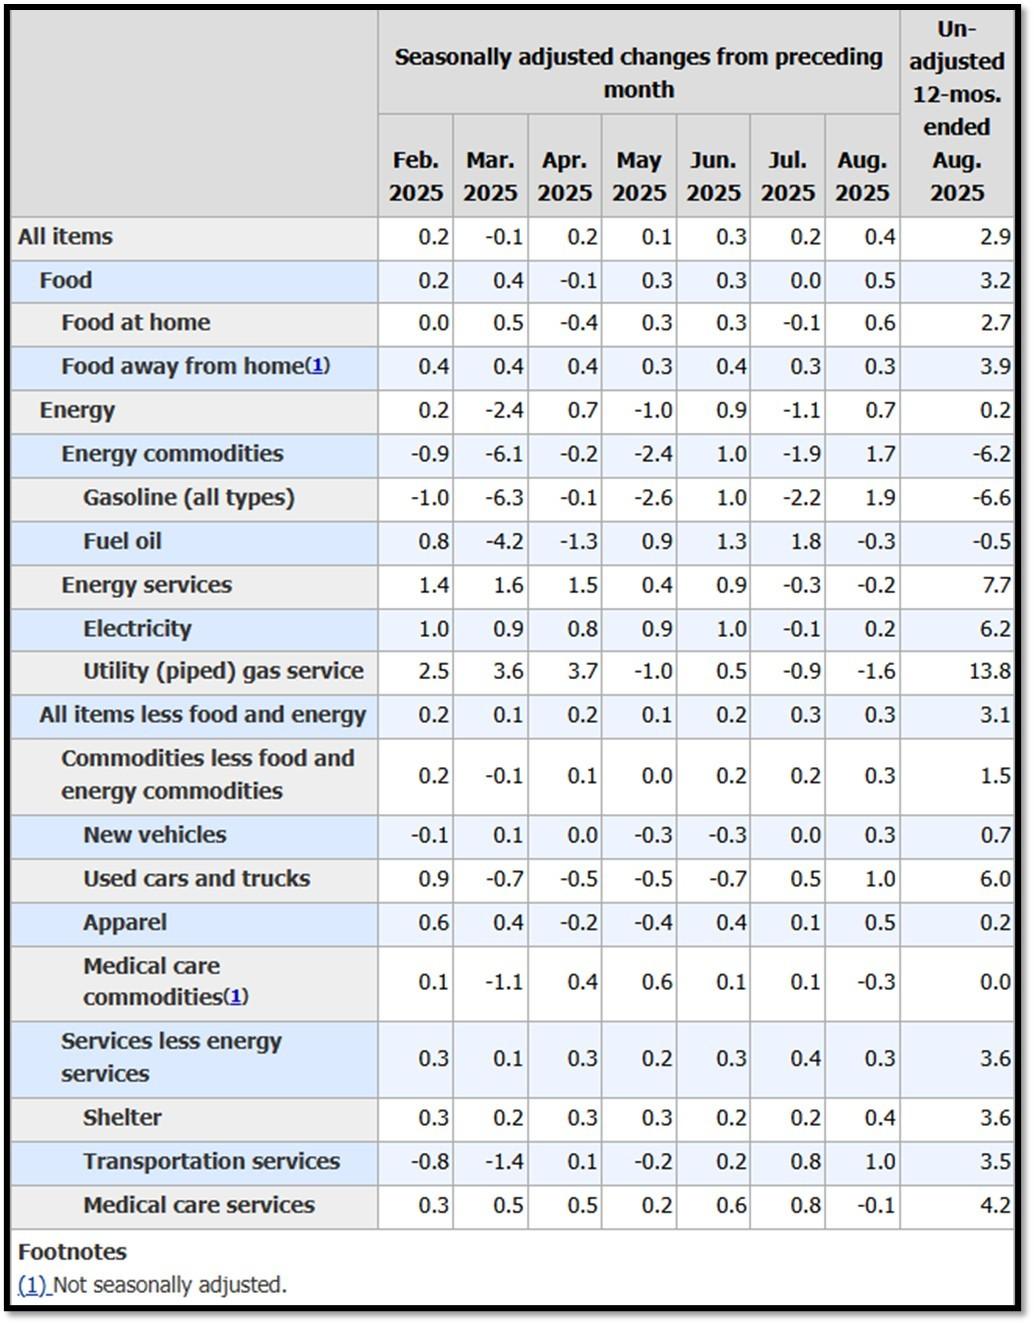
5K. In August, the Consumer Price Index for All Urban Consumers rose 0.4 percent, seasonally adjusted, and rose 2.9 percent over the last 12 months, not seasonally adjusted. The index for all items less food and energy increased 0.3 percent in August (SA); up 3.1 percent over the year (NSA). September 2025 CPI data are scheduled to be released on October 15, 2025, at 8:30AM-ET. REF: BLS, BLS.GOV
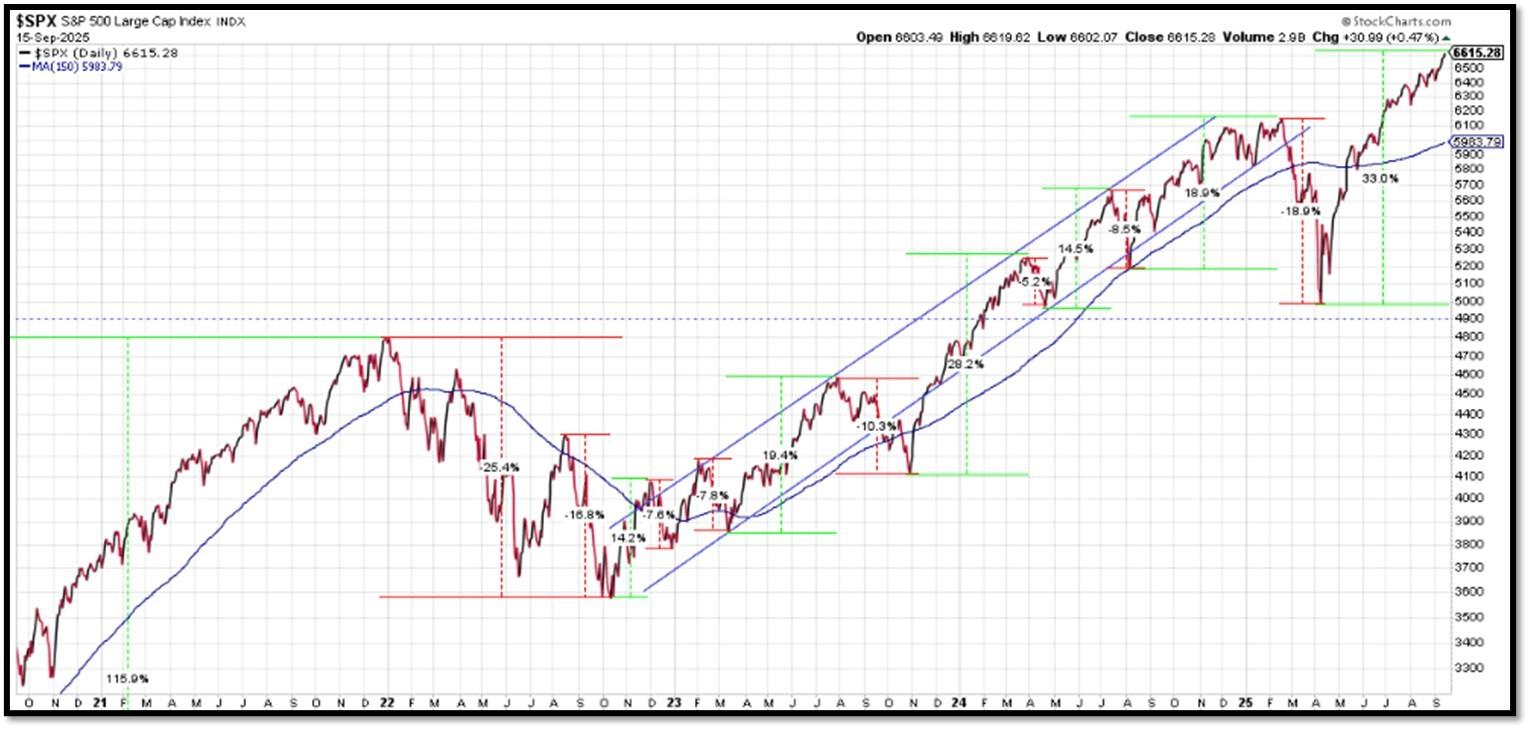
5L. Technical Analysis of the S&P500 Index. Click onto reference links below for images.
- Short-term Chart: Trend Bullish on 9/15/2025 – REF: Short-term S&P500 Chart by Marc Slavin (Click Here to Access Chart)
- Medium-term Chart: Trend Bearish to Bullish on 9/15/2025 – REF: Medium-term S&P500 Chart by Marc Slavin (Click Here to Access Chart)
- Market Timing Indicators – S&P500 Index as of 9/15/2025 – REF: S&P500 Charts (7 of them) by Joanne Klein’s Top 7 (Click Here to Access Updated Charts)
- The S&P500 is hitting all-time-high, rebounding from a V-shaped recovery. REF: Stockcharts
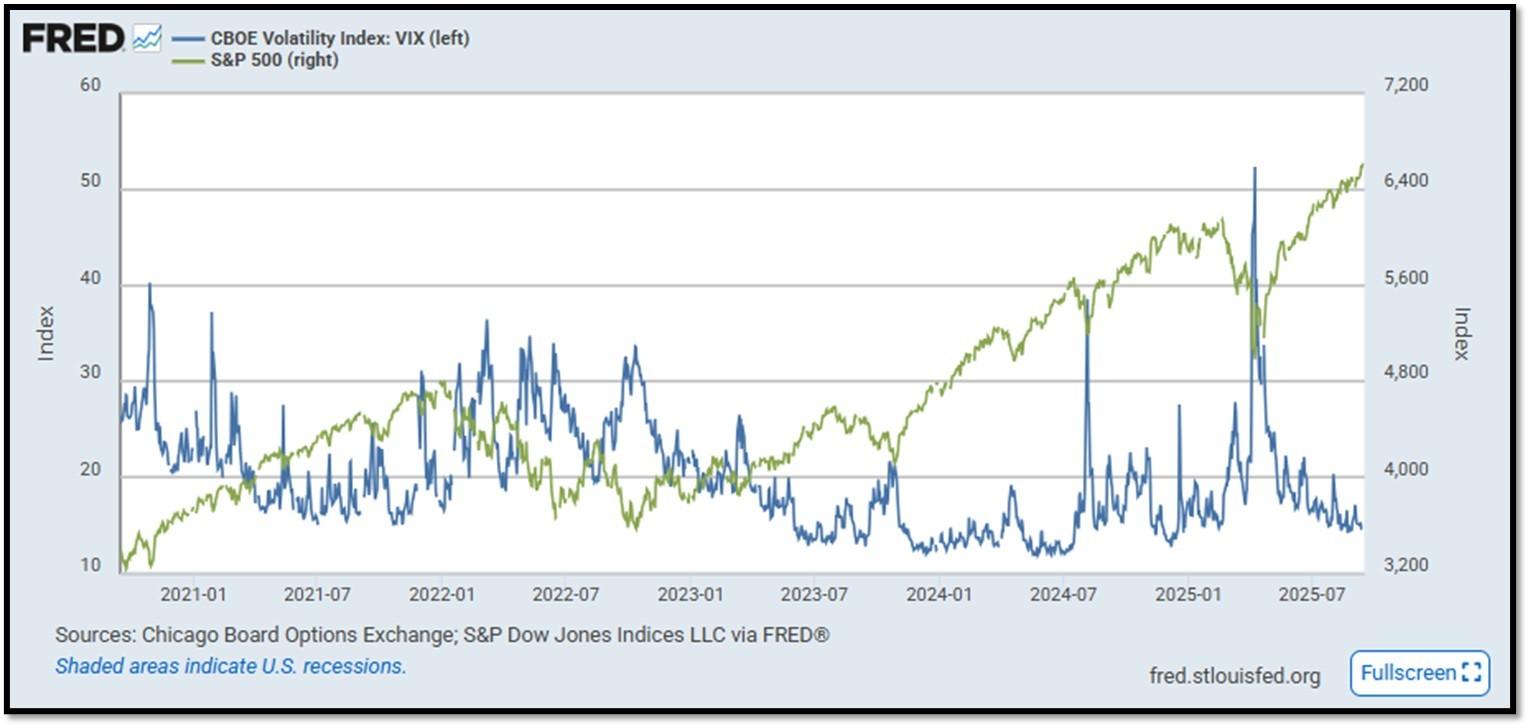
- S&P500 and CBOE Volatility Index (VIX) as of 9/15/2025. REF: FRED, Today’s Print
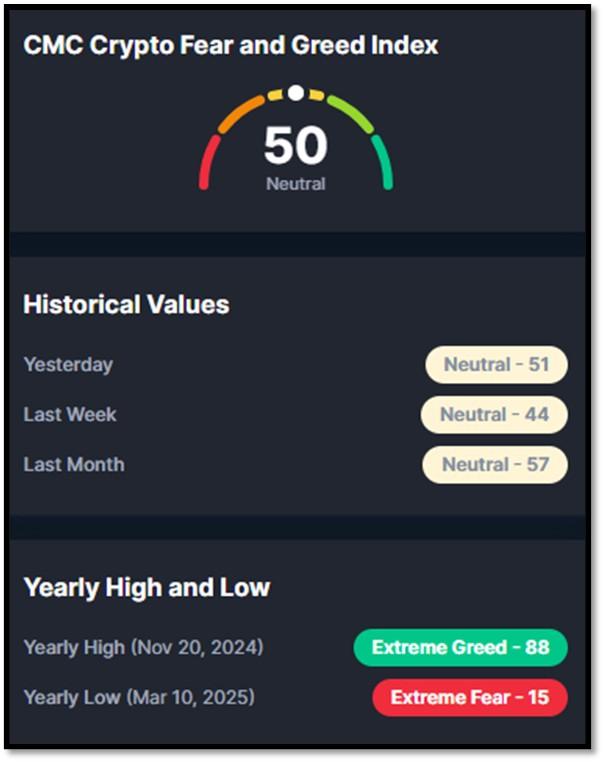
5M. Most recent read on the Crypto Fear & Greed Index with data as of 9/15/2025 is 50 (Neutral). Last week’s data was 44 (Neutral) (1-100). Fear & Greed Index – A Contrarian Data. The crypto market behavior is very emotional. People tend to get greedy when the market is rising which results in FOMO (Fear of missing out). Also, people often sell their coins in irrational reaction of seeing red numbers. With the Crypto Fear and Greed Index, the data try to help save investors from their own emotional overreactions. There are two simple assumptions:
- Extreme fear can be a sign that investors are too worried. That could be a buying opportunity.
- When Investors are getting too greedy, that means the market is due for a correction.
Therefore, the program for this index analyzes the current sentiment of the Bitcoin market and crunch the numbers into a simple meter from 0 to 100. Zero means “Extreme Fear”, while 100 means “Extreme Greed”. REF: Coinmarketcap.com, Today’sReading
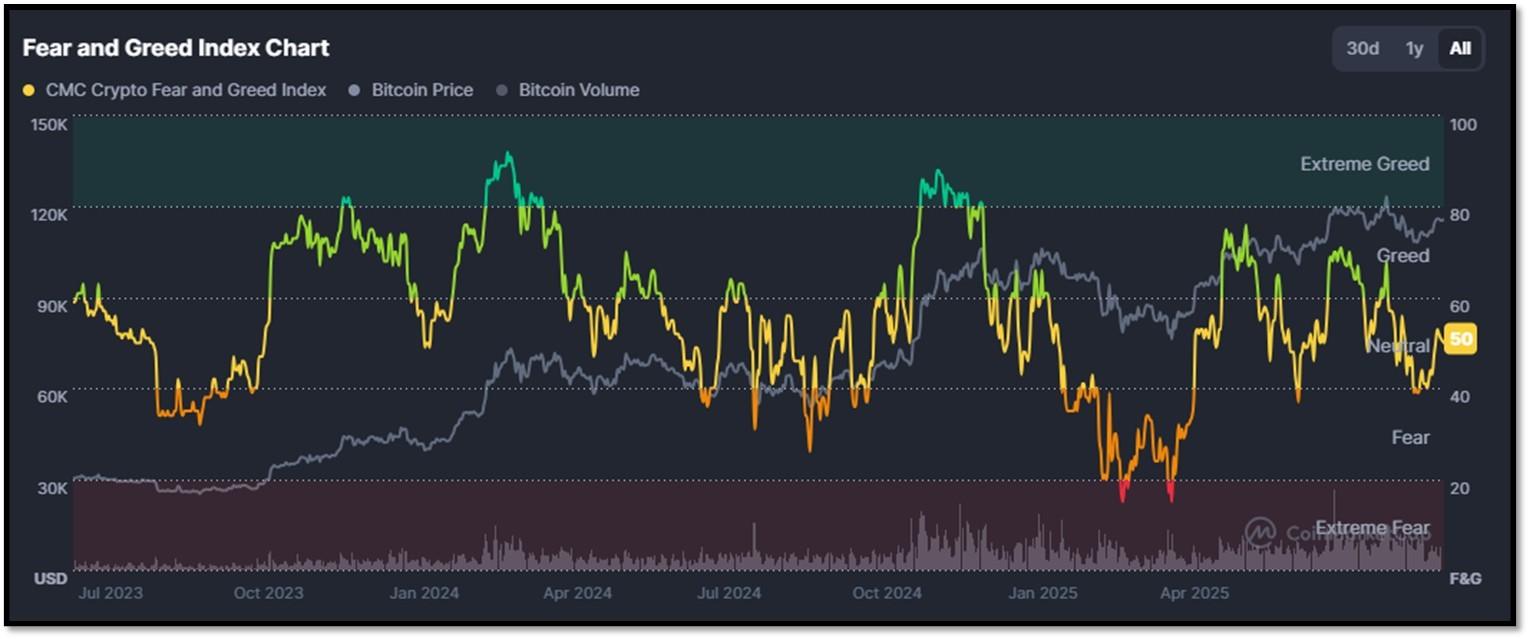
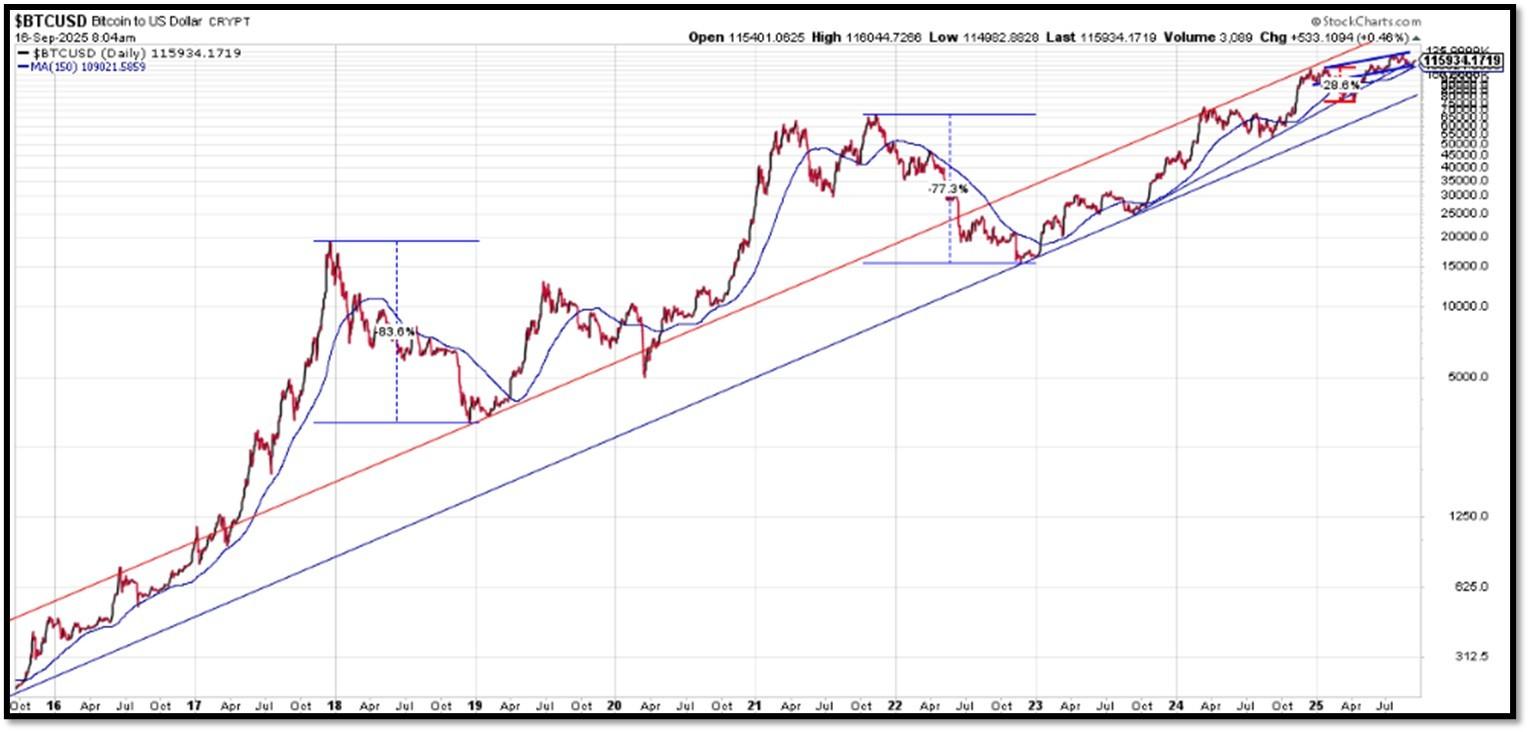
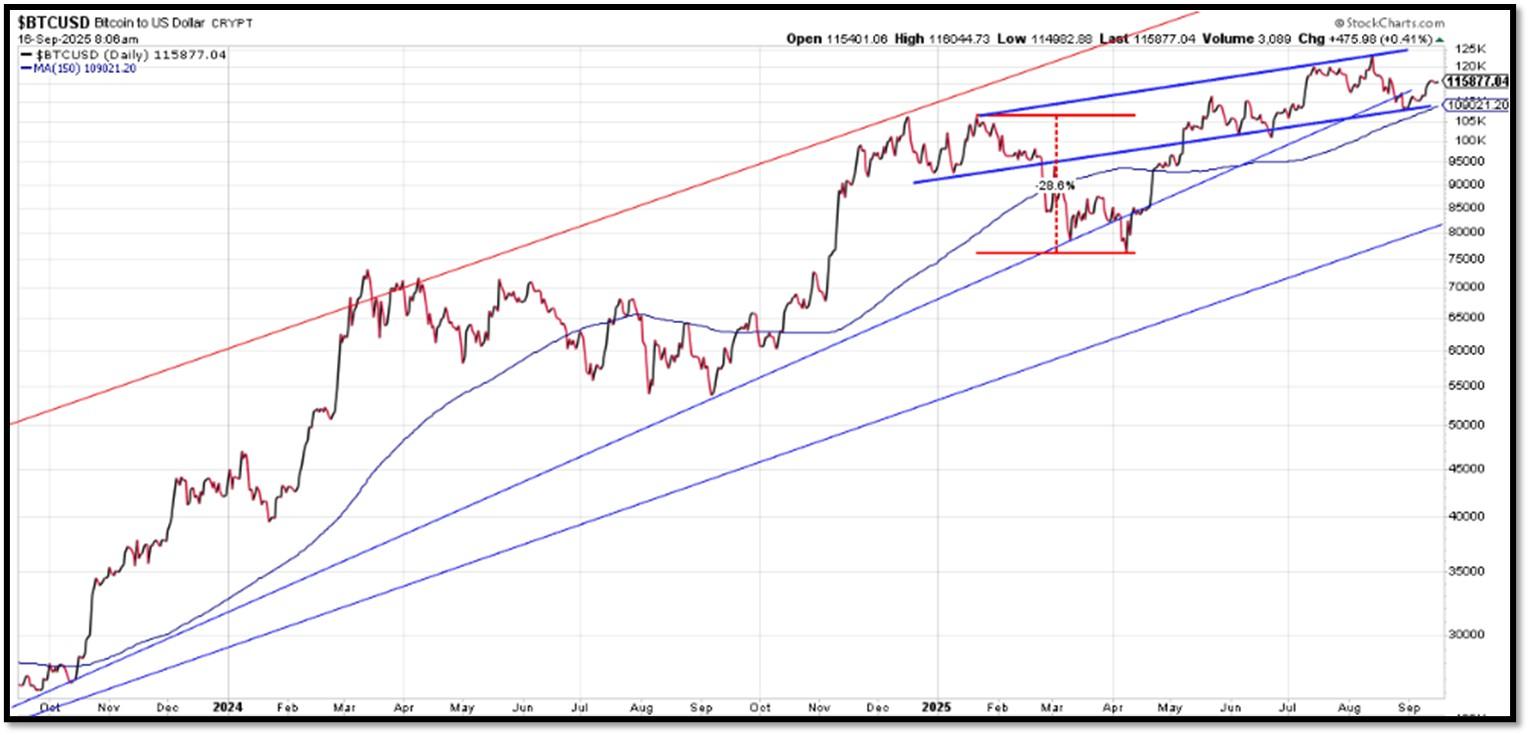
Bitcoin – 10-Year & 2-Year Charts. REF: Stockcharts10Y, Stockcharts2Y
From the desk of our Chief Investment Officer
As an investment professional with over twenty-six years of experience in the financial services industry, Andrew helps clients to protect, grow and transfer wealth during their lifetime with objective, unbiased, customized and efficient strategies.
Education, Professional Licenses Acquired & Affiliations
- Passed the Series 7, 63, 65 and 24 license examinations
- Currently holding Series 65 License
- BA in Economics – Boston University (Boston, MA) 1993
- Certificate in Commodities Trading – New York University (New York, NY) 1991
- Certificate in Financial Planning – New York University (New York, NY) April 2011
With extensive experience in the Financial Services Industry, Andrew Tang and Turner Financial Group provides disciplined wealth management with an intelligent caring approach to each and every client that compliments the Dedicated Financial offering.


Len writes much of his own content, and also shares helpful content from other trusted providers like Turner Financial Group (TFG).
The material contained herein is intended as a general market commentary, solely for informational purposes and is not intended to make an offer or solicitation for the sale or purchase of any securities. Such views are subject to change at any time without notice due to changes in market or economic conditions and may not necessarily come to pass. This information is not intended as a specific offer of investment services by Dedicated Financial and Turner Financial Group, Inc.
Dedicated Financial and Turner Financial Group, Inc., do not provide tax, legal or accounting advice. You should consult your own tax, legal and accounting advisors before engaging in any transaction.
Any hyperlinks in this document that connect to Web Sites maintained by third parties are provided for convenience only. Turner Financial Group, Inc. has not verified the accuracy of any information contained within the links and the provision of such links does not constitute a recommendation or endorsement of the company or the content by Dedicated Financial or Turner Financial Group, Inc. The prices/quotes/statistics referenced herein have been obtained from sources verified to be reliable for their accuracy or completeness and may be subject to change.
Past performance is no guarantee of future returns. Investing involves risk and possible loss of principal capital. The views and strategies described herein may not be suitable for all investors. To the extent referenced herein, real estate, hedge funds, and other private investments can present significant risks, including loss of the original amount invested. All indexes are unmanaged, and an individual cannot invest directly in an index. Index returns do not include fees or expenses.
Turner Financial Group, Inc. is an Investment Adviser registered with the United States Securities and Exchange Commission however, such registration does not imply a certain level of skill or training and no inference to the contrary should be made. Additional information about Turner Financial Group, Inc. is also available at www.adviserinfo.sec.gov. Advisory services are only offered to clients or prospective clients where Turner Financial Group, Inc. and its representatives are properly licensed or exempt from licensure. No advice may be rendered by Turner Financial Group, Inc. unless a client service agreement is in place.


