

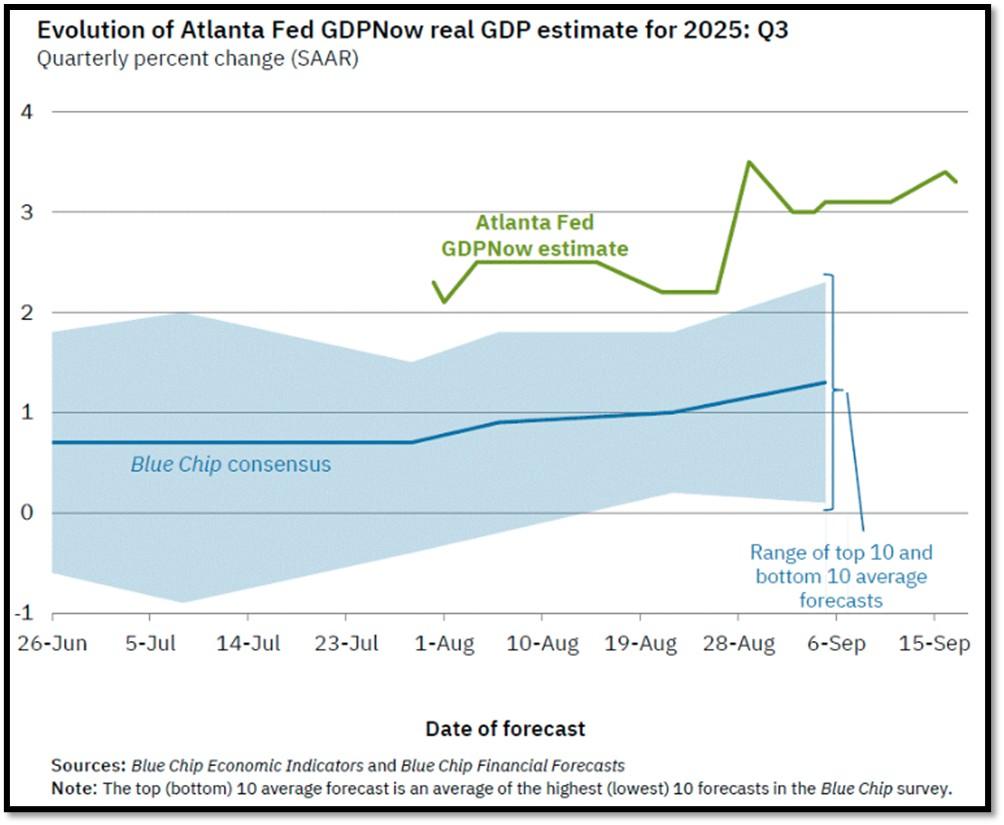
- 1. The Atlanta Fed’s upbeat projection that U.S. real GDP will grow by around 3.4 percent in the third quarter signals stronger momentum than many observers expect, especially in light of mounting headwinds from tariffs and their ripple effects through the economy.
- 2. Main story this week is Meta’s Transformation Beyond social media: Highlights from Connect 2025 – Meta Connect 2025, held on September 17-18, showcased Meta’s bold evolution from a social media titan to a leader in AI-driven wearable technology, positioning it as a formidable rival to Google and Apple.
- 3. The U.S. is leading the charge in robo-trucking as autonomous trucking startups ramp up commercialization efforts, and evidence of this trend is clear in how Kodiak is positioning itself in the market.
- 4. World Watch
- 4A. Shining the spotlight to the US again here… Nvidia and OpenAI announced a transformative strategic partnership via a letter of intent, with Nvidia committing up to $100 billion to deploy at least 10 gigawatts (GW) of AI data centers powered by its GPUs, that’s enough to energize millions of homes with an estimated 4-5 million units.
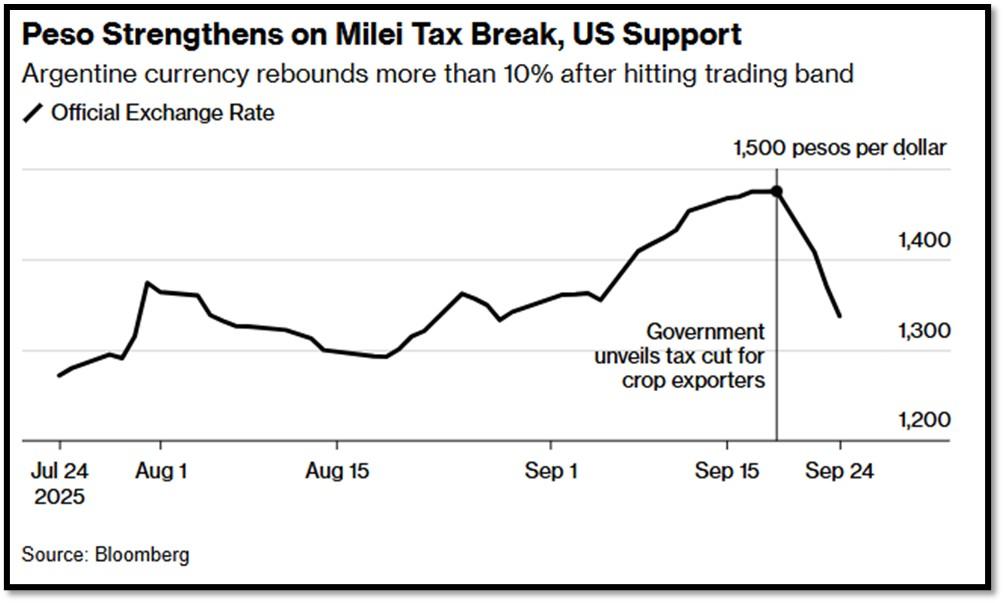
- 4B. Argentina’s decision to suspend export taxes on crops has drawn international attention because of the immediate results it produced. President Javier Milei moved quickly to eliminate levies on major agricultural exports in an effort to stabilize the peso and attract badly needed foreign currency.
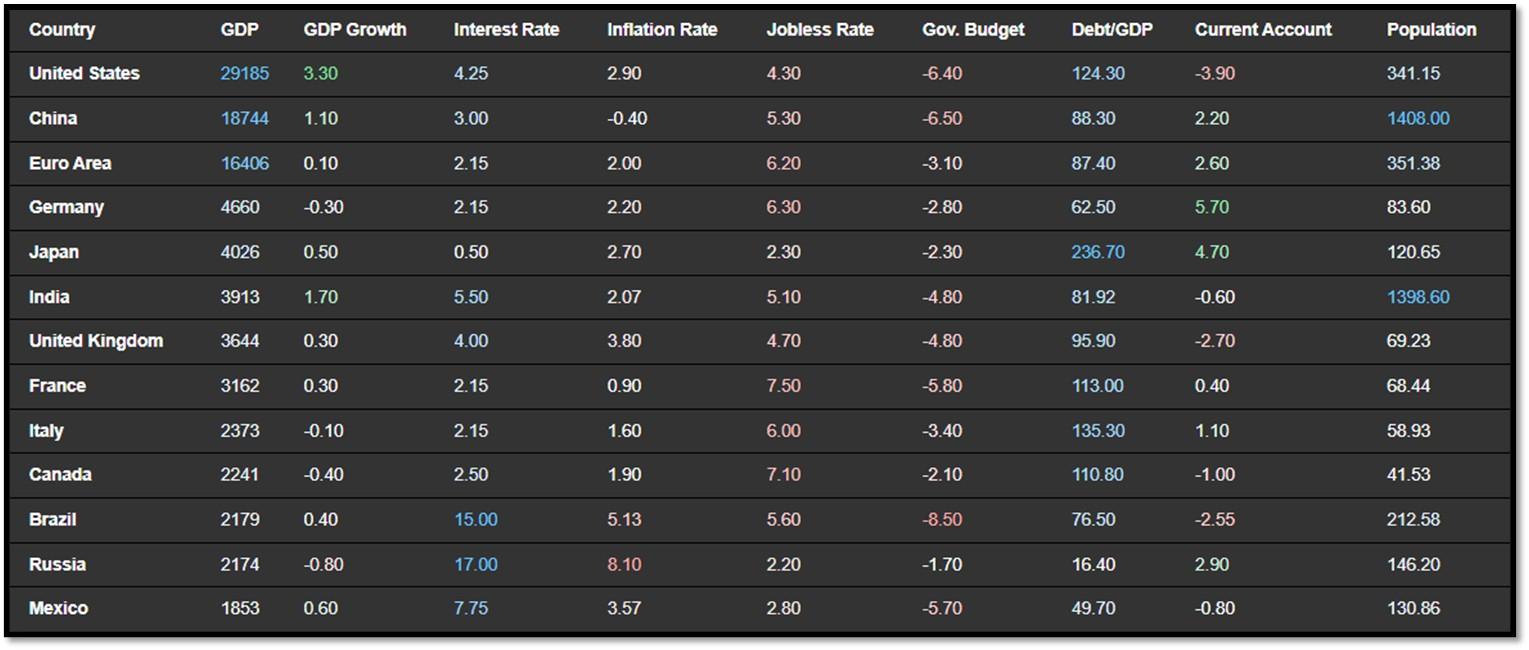
- 4C. An updated snapshot of the current global state of economy.
- 5. Quant & Technical Corner – A selection of quantitative & technical data we monitor on a regular basis to help gauge the overall financial market conditions and the investment environment.
1. The Atlanta Fed’s upbeat projection that U.S. real GDP will grow by around 3.4 percent in the third quarter signals stronger momentum than many observers expect, especially in light of mounting headwinds from tariffs and their ripple effects through the economy.
Such a forecast suggests that consumer spending, inventory accumulation, and investment may still possess enough inertia to propel growth ambitiously, delaying the full brunt of trade policy drag. Yet this optimism must be weighed against signs that tariffs are already pressuring firms’ costs and inflation expectations. According to Atlanta Fed research, companies exposed to import duties are increasingly projecting higher year ahead price growth, and the spill over into broader sectors raises the risk that what looks like a one-time price shock could turn into a more pervasive inflationary impulse.
The tension between the strong short run growth forecast and the looming tariff risks illustrates the delicate balance the economy is trying to strike. If tariffs continue to feed higher input costs or begin to suppress demand, for example by raising consumer prices or squeezing profit margins, that could unravel much of the projected growth in later quarters. Meanwhile, firms that do not import heavily might temporarily benefit from geographic or supply chain insulation, but even they may not be shielded if competitors pass through costs. Ultimately, the 3.4 percent forecast may prove optimistic if the tariff pressures intensify or become more entrenched. REF: Atlanta Fed, GDPnowWebsite
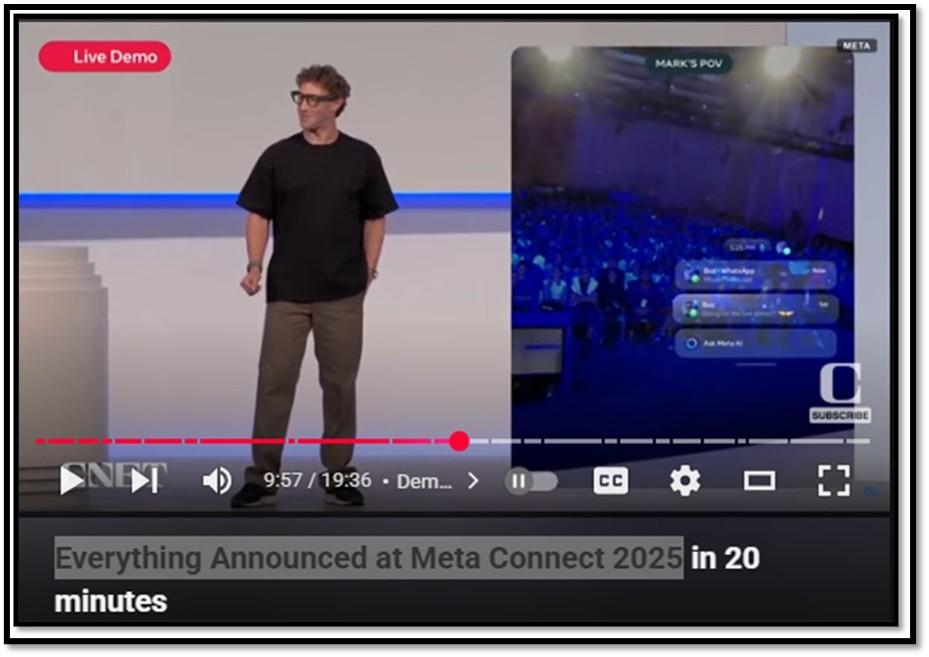
2. Main story this week is Meta’s Transformation Beyond social media: Highlights from Connect 2025 – Meta Connect 2025, held on September 17-18, showcased Meta’s bold evolution from a social media titan to a leader in AI-driven wearable technology, positioning it as a formidable rival to Google and Apple.
The event’s live demo, despite some flops where Mark Zuckerberg struggled to get units working, was refreshingly authentic compared to Apple’s polished, pre-recorded presentations, highlighting Meta’s commitment to transparency. The spotlight shone on three advanced smart glasses—Ray-Ban Meta Gen 2, Oakley Meta Vanguard, and Ray-Ban Meta Display—paired with the innovative Meta Neural Band, a wristband enabling gesture-based air-typing and neural controls. These devices offer practical functionality: Gen 2 boasts 3K video, extended battery life, and multimodal AI for real-time translation and object recognition, while Vanguard targets athletes with IP67 durability and Strava integration. The Display model introduces a 5,000-nit in-lens projection for notifications, redefining eyewear as a computing interface. Updates to Horizon OS added a TV hub for streaming services and developer tools like a smart glasses SDK, signaling Meta’s push toward a metaverse-centric future where wearables could eclipse smartphones by 2030, as envisioned by Zuckerberg.
These advancements demonstrate Meta’s ability to deliver usable, stylish technology that competes with industry giants. The smart glasses, weighing around 50 grams, rival Google’s Gemini-powered devices with features like live captioning for accessibility, while the Neural Band echoes Apple’s hand-tracking innovations by enabling intuitive inputs. Unlike Apple’s closed Vision Pro ecosystem, Meta emphasizes affordability and openness, with tools like Horizon Studio and integrations with apps like Disney+ and Hulu, fostering a creator-friendly platform. By merging its social networking heritage with cutting-edge hardware, Meta Connect 2025 reveals a company crafting an immersive, AI-enhanced future, where technology seamlessly integrates into daily life, moving far beyond traditional social media. Click onto pictures below to access videos. REF: Meta Connect, TheVerge, SMT, CNET

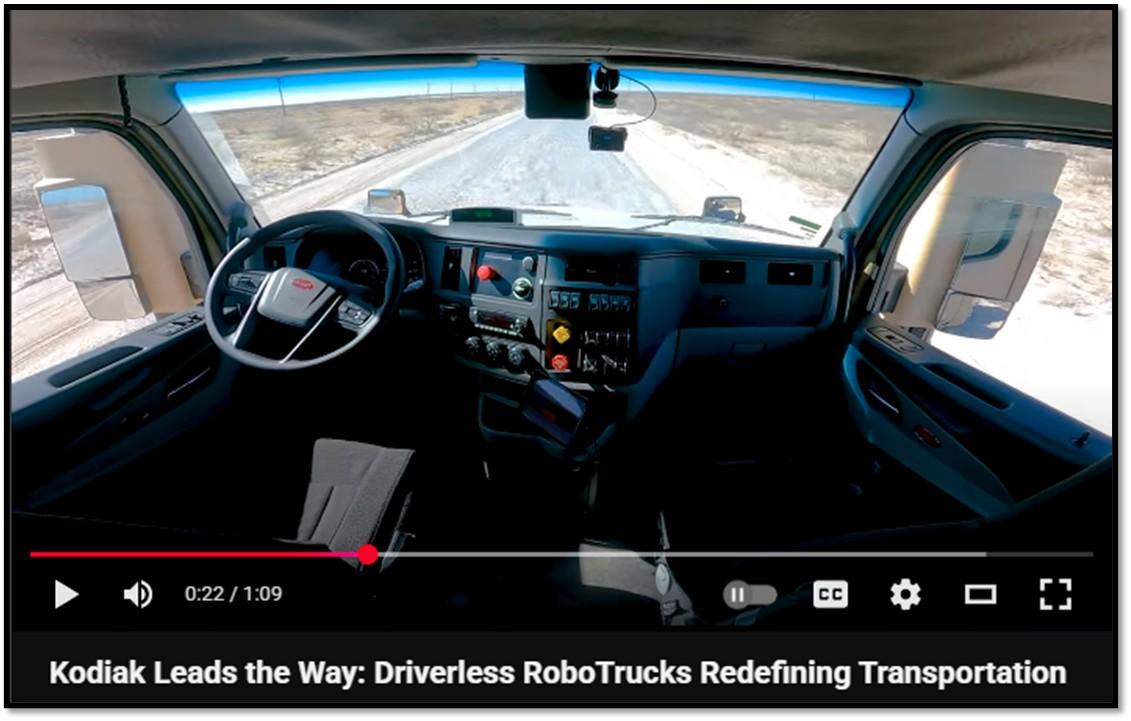
3. The U.S. is leading the charge in robo-trucking as autonomous trucking startups ramp up commercialization efforts, and evidence of this trend is clear in how Kodiak is positioning itself in the market.
In a major move, Kodiak (renamed Kodiak AI) is going public via a merger with Ares Acquisition Corp. II, valuing the company at approximately $2.5 billion. Based in Mountain View, California, Kodiak has already deployed driverless semi-trucks in commercial operations (most notably with Atlas Energy Solutions in Texas’ Permian Basin) and has logged over 2.6 million autonomous miles. Its “Driver-as-a-Service” model means fleets pay per mile or per truck to use Kodiak’s autonomy stack, aiming to scale widely through recurring revenue.
While the road ahead is complex (including regulatory control, weather limitations, and integrating autonomy into logistics operations) Kodiak is betting that public markets will fuel growth. In its public offering, Kodiak is raising capital to expand its driverless fleet, refine its AI and hardware systems, and broaden its customer base. By taking this step in a moment when several competitors have scaled back or shut down U.S. operations, Kodiak is making a statement: it believes the U.S. can be the epicenter of autonomous trucking innovation if the execution and market conditions align. Below is a summarized table of the major players in robo-trucking. Click onto picture further below to access video. REF: WSJ
|
Company (Click to Access Website) |
Public/Private |
HQ State |
Sensors |
Mapping Approach |
Key Differentiators |
Operational Notes |
Estimated Valuation / Market Cap |
|
Transitioning to Public (SPAC merger) |
California (Mountain View) |
LiDAR + Radar + Cameras; modular SensorPods |
Sparse (lightweight) maps, updated OTA from trucks |
Field-swappable SensorPods; Sparse Mapping |
Driverless freight in TX/NM; uptime focus |
≈ $2.5 billion |
|
|
Public (NASDAQ: AUR) |
Pennsylvania (Pittsburgh) |
LiDAR (FirstLight long-range) + Radar + Cameras |
HD maps (Atlas) with semantic layers |
Proprietary FirstLight LiDAR; HD Atlas maps |
Expanding in TX; HD Atlas core to scaling |
≈ $10.7 billion |
|
|
Private / Alphabet Subsidiary |
California (Mountain View) |
LiDAR + Radar + Cameras (Waymo Driver) |
HD maps, multi-layered perception |
Pioneer in AVs; trucking unit paused; strong HD mapping |
Trucking paused, focus on robotaxis |
Implied / speculative: $45 billion+ (or much more) |
|
|
Transitioning to Public (merger with Churchill Capital IX) |
California (Santa Clara) |
LiDAR + Radar + Cameras |
Traditional mapping + sensor fusion (not sparse-map focused) |
Commercial deployments with supervised automation |
Active commercial deployments, supervised |
NA |
|
|
Private |
California (Mountain View) |
LiDAR + Radar + Cameras |
Camera/LiDAR/Radar-grounded world models, route-specific |
Middle-mile focus; simulation-heavy; constrained ODD |
Enterprise partnerships; NVIDIA-based stack |
NA |
|
|
Public (NASDAQ: TSLA) |
Texas (Austin) |
Cameras + Ultrasonics + Radar (Tesla Vision, no LiDAR) |
Vision-based system; high reliance on neural nets and fleet data (no HD maps like rivals) |
Electric powertrain; FSD-based autonomy; no LiDAR, focus on vision + AI |
Limited production, PepsiCo and others as early customers; autonomy features evolving |
~$800+ billion (for all of Tesla |
NOTE: Not investment advice or recommendations. Investors should carefully consider the investment objectives, risks, charges, and expenses before investing. For additional information about the securities mentioned above or in the video, please visit the respective companies’ investor relations pages or the websites of the companies discussed. Please read all materials carefully before investing.
With the current macro-economic backdrop, below are areas we currently favor:
- Fixed Income – (Corporates & Muni) High Yield as Opportunistic Allocation (Low-Beta)
- Fixed Income – Short-term Corporates & Muni (Low-Beta)
- Businesses that contribute to and benefit from AI & Automation (Market-Risk)
- India (Market-Risk)
- Fintech & Financials (Market-Risk)
- Digital Asset – Bitcoin (Market-Risk/Hedge)
- Cloud Computing (Market-Risk)
- Cyber-Security & Software (Market-Risk)
4. World Watch
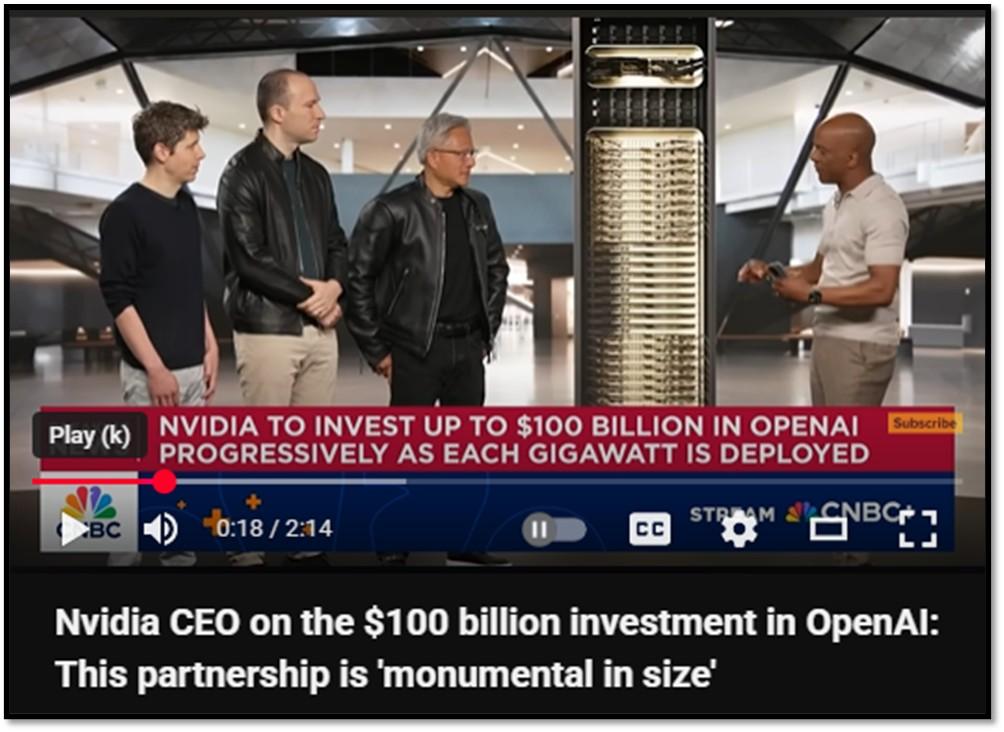
4A. Shining the spotlight to the US again here… Nvidia and OpenAI announced a transformative strategic partnership via a letter of intent, with Nvidia committing up to $100 billion to deploy at least 10 gigawatts (GW) of AI data centers powered by its GPUs, that’s enough to energize millions of homes with an estimated 4-5 million units.
This phased investment starts with a $10 billion infusion upon finalizing the first gigawatt agreement, expected online in late 2026 using Nvidia’s Vera Rubin platform, following a $6.6 billion stake in OpenAI’s 2024 round. Structured as a “circular” deal, much of Nvidia’s funds return through OpenAI’s $35 billion per GW hardware purchases, a move OpenAI CEO Sam Altman called vital for tackling the “unprecedented infrastructure challenge” toward superintelligence, while Nvidia CEO Jensen Huang dubbed it the “biggest AI infrastructure project in history.” The announcement spurred a market surge, with Nvidia’s stock rising 4.4% to a record high, adding $170-200 billion to its $4.5 trillion market cap, and triggering a chip rally that lifted Taiwan Semiconductor (TSM) by 3.5%, Oracle (ORCL) by 6%, and AI ETFs by 2-3%.
For investors, this deal offers a high-stakes opportunity in the AI boom, solidifying Nvidia’s hardware leadership and boosting tech sector optimism, though it heightens risks of over-dependence on key players and bubble concerns. The bullish outlook forecasts 20-30% annual returns for AI portfolios, driven by OpenAI’s 700 million weekly users and enterprise growth, with diversification into TSMC and Oracle as a hedge. Yet, risks include potential antitrust scrutiny, earnings inflation from the circular model, and a possible 20-40% sector dip if AI adoption falters or energy issues arise. Ahead, a finalized deal by year-end could push Nvidia toward $150/share, with the first gigawatt live by 2026-2027, scaling to 10 GW by 2028; long-term success depends on AGI breakthroughs unlocking trillions in value or a bubble burst reshaping tech and global chip dynamics. Click onto picture below to access video. REF: BARRON’S, CNBC
“It’s a big deal!”
4B. Argentina’s decision to suspend export taxes on crops has drawn international attention because of the immediate results it produced. President Javier Milei moved quickly to eliminate levies on major agricultural exports in an effort to stabilize the peso and attract badly needed foreign currency.
The measure prompted an inflow of roughly seven billion dollars in a matter of days, underscoring how powerful agriculture is in Argentina’s economy. For a country struggling with high inflation, fiscal strain, and weak reserves, the short-term success of this policy demonstrated how quickly the farming sector can be mobilized to address balance of payment challenges. At the same time, the suspension raises questions about whether the government can afford to lose such an important source of revenue, and whether the benefits will prove lasting.
The international reaction centers on whether other countries will imitate Argentina’s experiment. In theory, nations with large agricultural export bases such as Brazil or Ukraine could see similar policies as a way to strengthen their currencies or encourage production during times of crisis. Yet many governments depend heavily on export taxes for their budgets and removing them could strain public finances. For diversified economies, the benefits of such a move may be smaller while the risks of market oversupply or retaliation from trade partners remain significant. The likelihood of other nations following Argentina’s path therefore depends on their economic structure, their tolerance for reduced fiscal revenues, and their political willingness to take short term gains in exchange for long term uncertainty. REF: Bloomberg
“Argentina certainly is in crisis-mode, when comparing its economy to the G20 countries…”

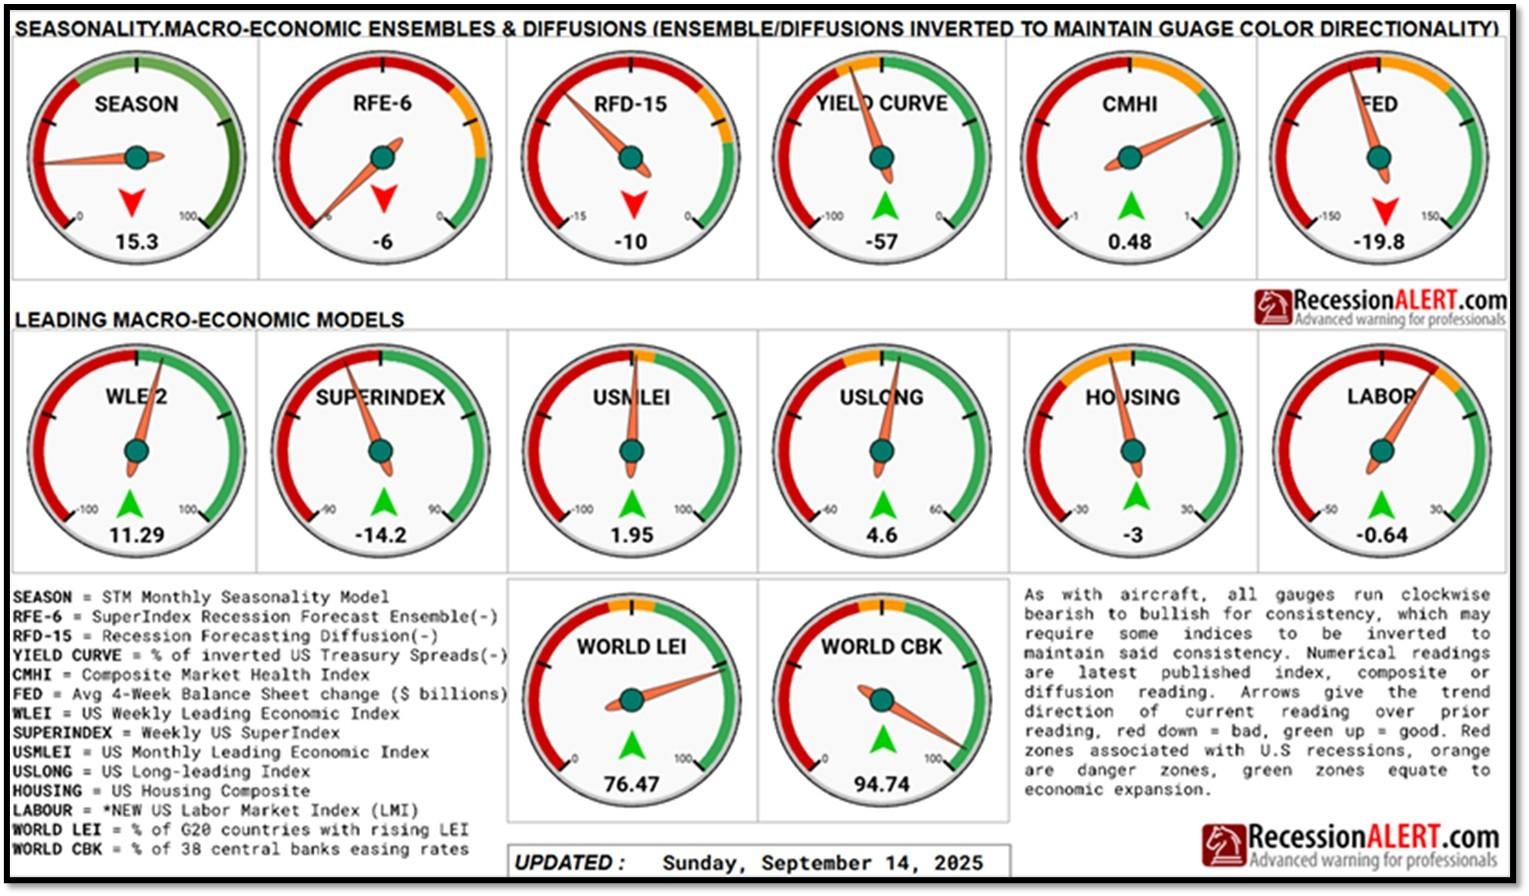
4C. An updated snapshot of the current global state of economy.
According to TradingEconomics as of 9/22/2025 (REF: TradingEconomics):
- The Federal Reserve cut the federal funds rate by 25bps in September 2025, bringing it to the 4.00%–4.25% range, in line with expectations.
- Japan’s annual inflation rate eased to 2.7% in August 2025 from 3.1% in the previous month, marking the lowest reading since October 2024.
- The Bank of Canada cut its benchmark interest rate by 25bps to 2.5% in its September 2025 decision, as largely expected by markets, to resume its cutting cycle following three consecutive holds.
- The annual inflation rate in Canada rose to 1.9% in August 2025, from 1.7% in July, but below the expected 2% and staying below the BoC’s 2% midpoint for the fifth straight month.
5. Quant & Technical Corner – A selection of quantitative & technical data we monitor on a regular basis to help gauge the overall financial market conditions and the investment environment.
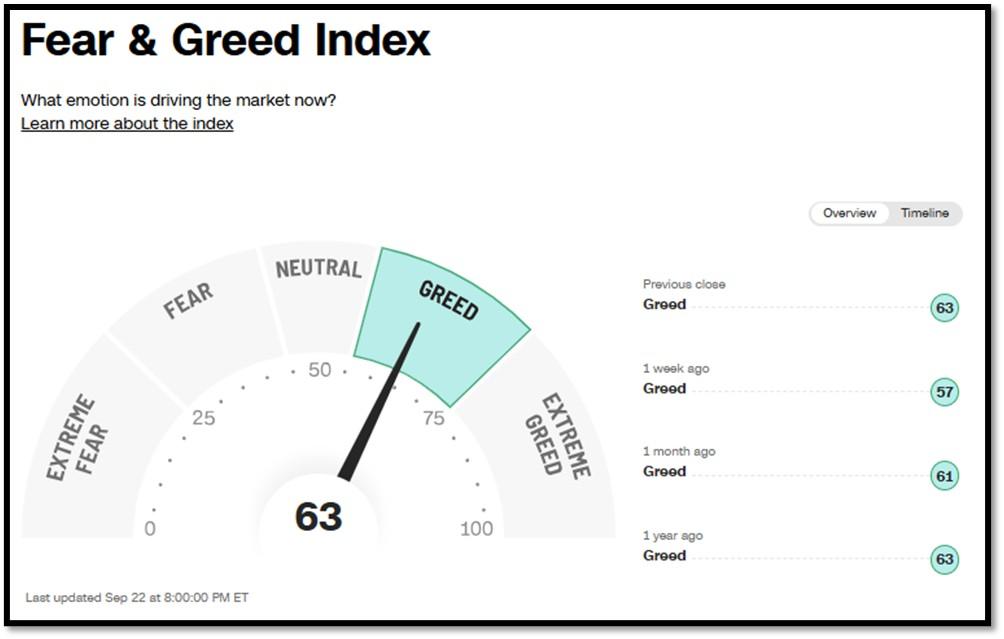
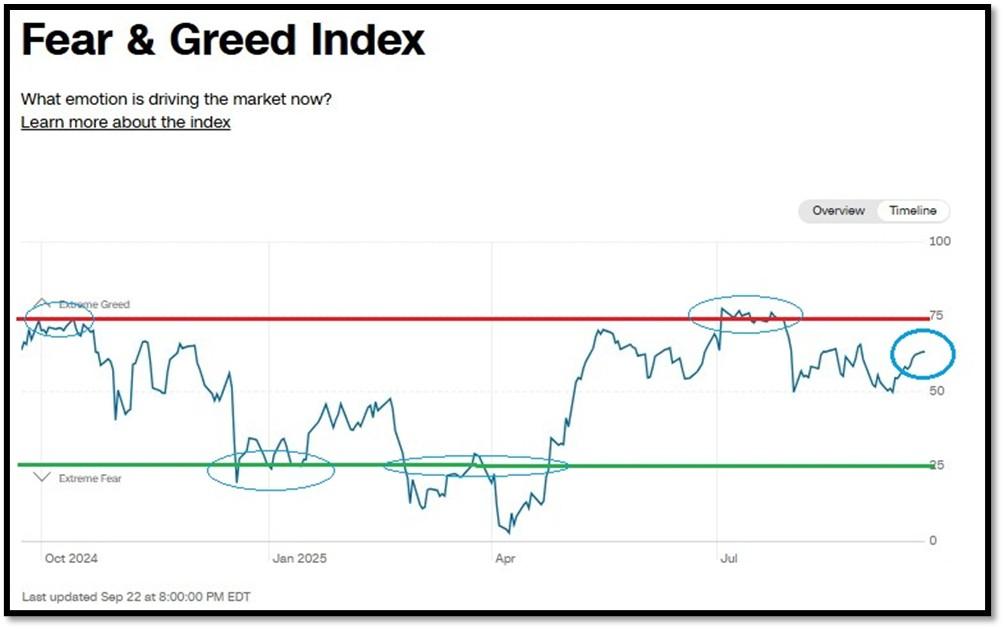
5A. Most recent read on the Fear & Greed Index with data as of 9/22/2025 – 8:00 PM-ET is 63 (Greed). Last week’s data was 57 (Greed) (1-100). CNNMoney’s Fear & Greed index looks at 7 indicators (Stock Price Momentum, Stock Price Strength, Stock Price Breadth, Put and Call Options, Junk Bond Demand, Market Volatility, and Safe Haven Demand). Keep in mind this is a contrarian indicator! REF: Fear&Greed via CNNMoney
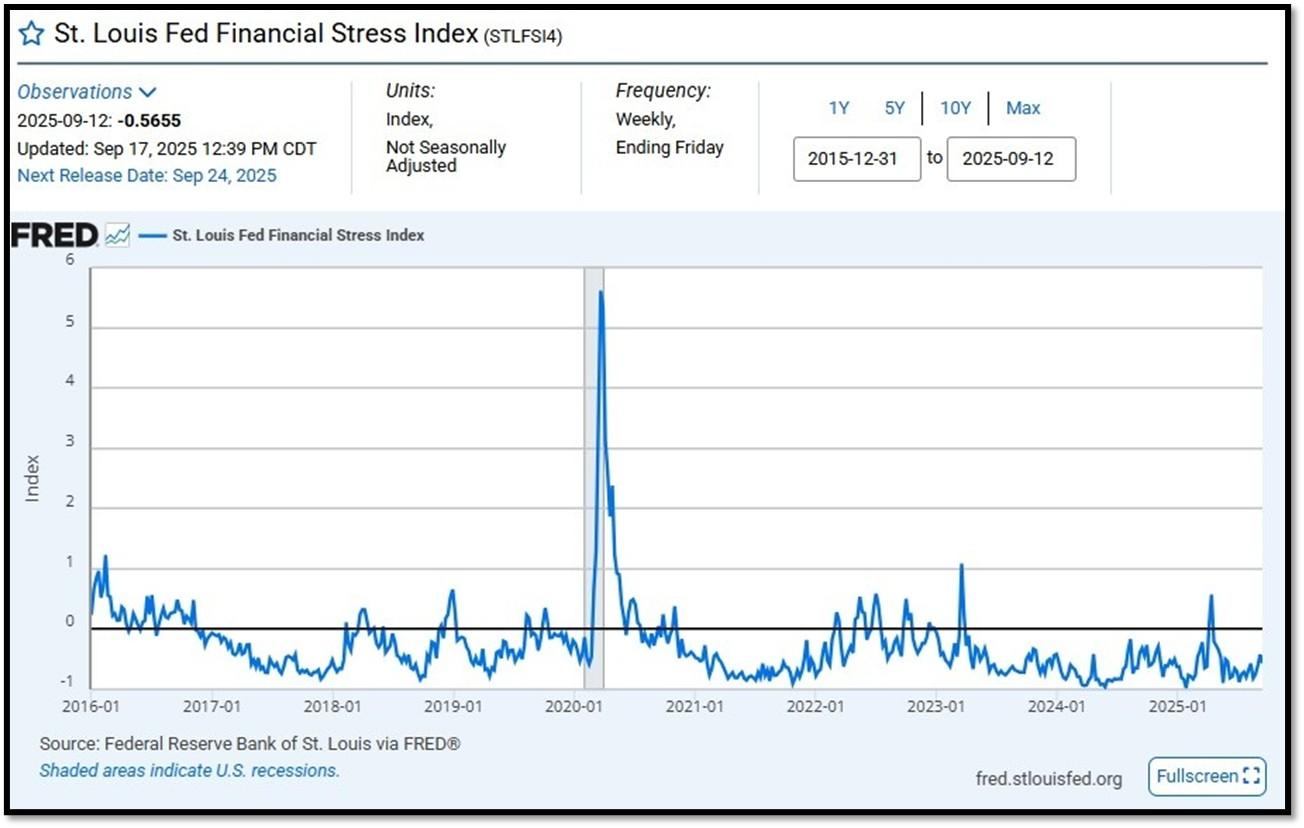
5B. St. Louis Fed Financial Stress Index’s (STLFSI4) most recent read is at –0.5655 as of September 17, 2025. Previous week’s data was -0.4211. A big spike up from previous readings reflecting the turmoil in the banking sector back in 2023. This weekly index is not seasonally adjusted. The STLFSI4 measures the degree of financial stress in the markets and is constructed from 18 weekly data series: seven interest rate series, six yield spreads and five other indicators. Each of these variables captures some aspect of financial stress. Accordingly, as the level of financial stress in the economy changes, the data series are likely to move together. REF: St. Louis Fed
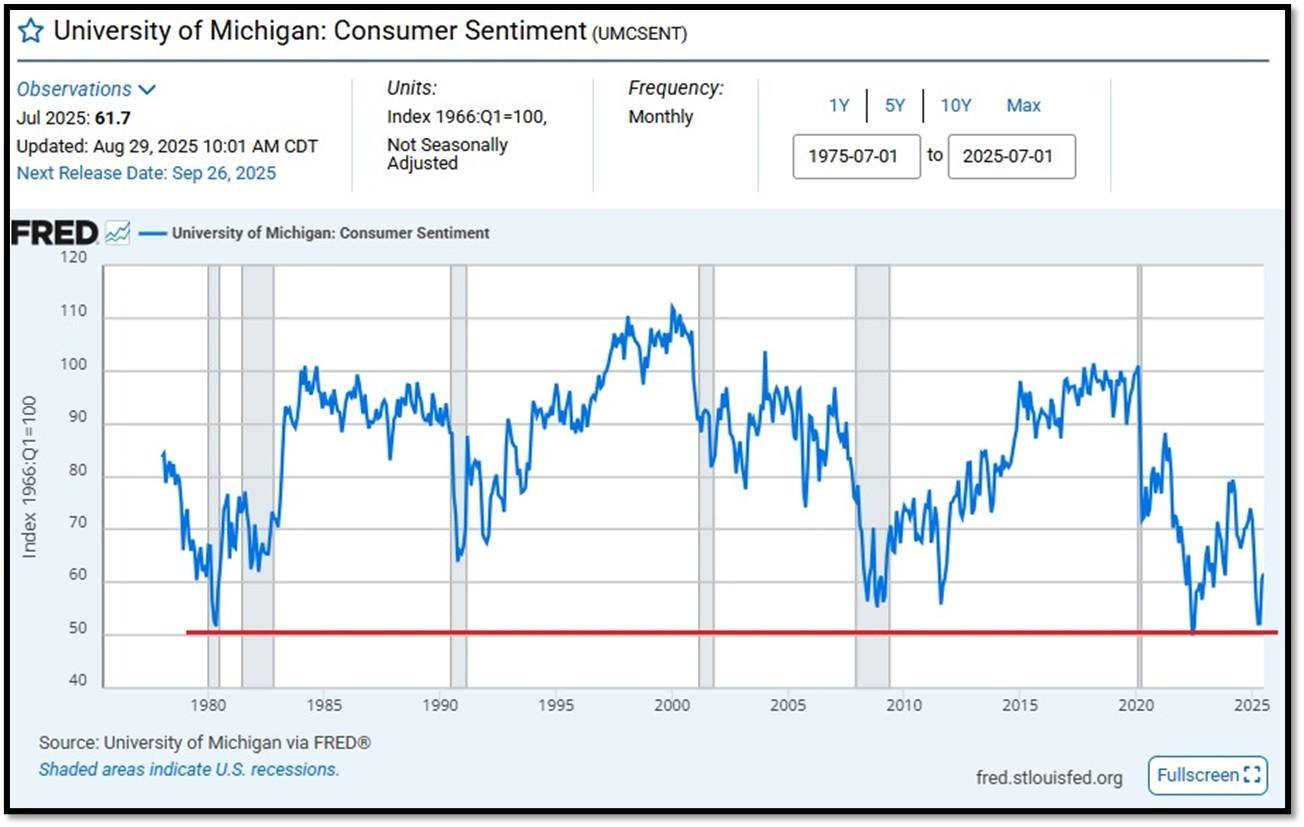
5C. University of Michigan, University of Michigan: Consumer Sentiment [UMCSEMT] for July at 61.7, retrieved from FRED, Federal Reserve Bank of St. Louis, August 29, 2025. Back in June 2022, Consumer Sentiment hit a low point going back to April 1980. REF: UofM
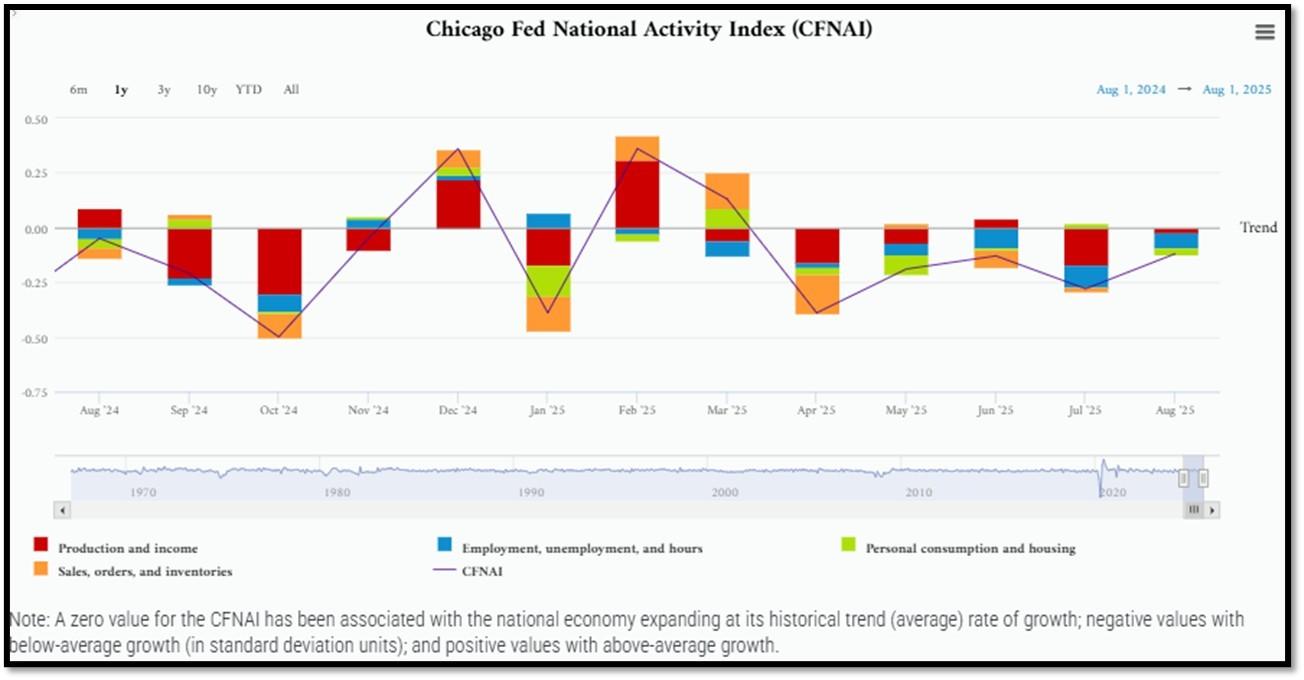
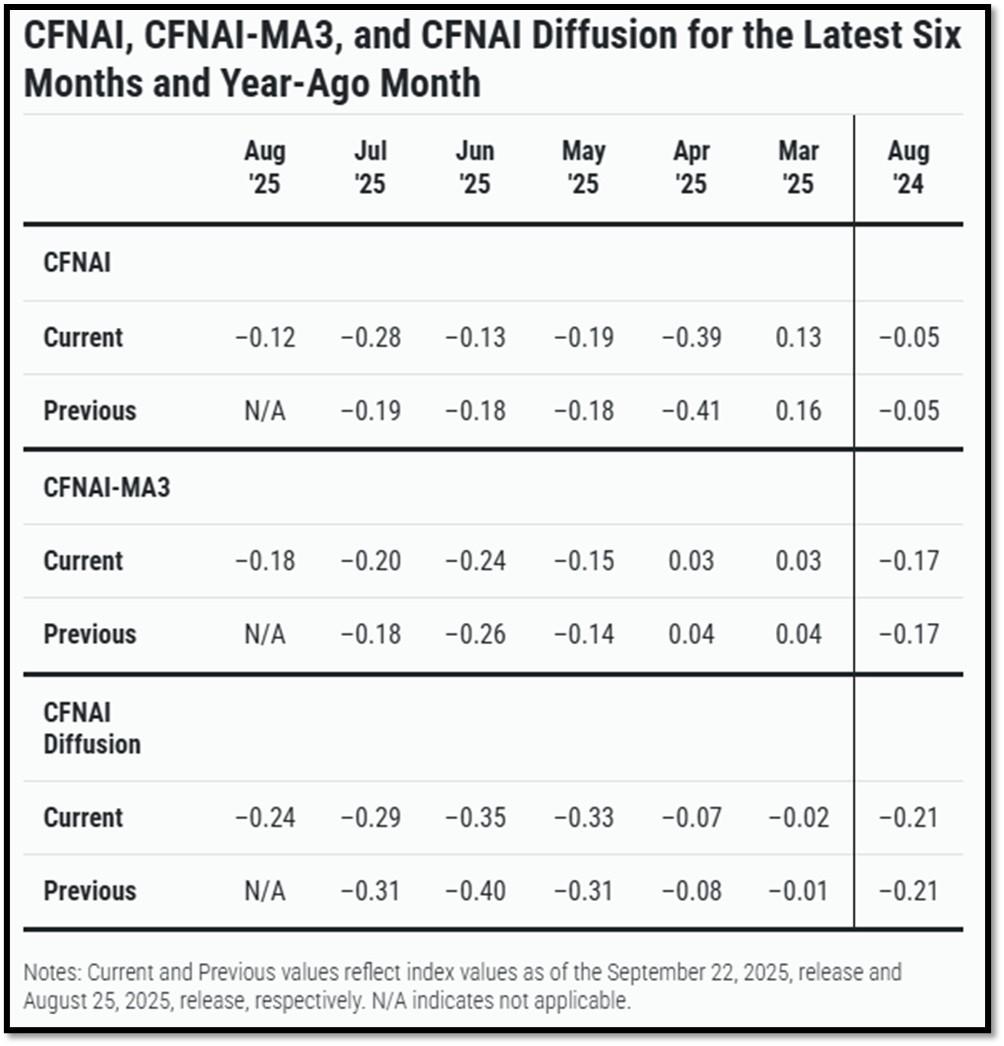
5D. The Chicago Fed National Activity Index (CFNAI) increased to –0.12 in August from –0.28 in July. Three of the four broad categories of indicators used to construct the index increased from July, but three categories made negative contributions in August. The index’s three-month moving average, CFNAI-MA3, increased to –0.18 in August from –0.20 in July. REF: ChicagoFed, August’s Report
5E. (9/18/2025) The Conference Board Leading Economic Index (LEI) for the US declined by 0.5% in August 2025 to 98.4 (2016=100), after a small 0.1% increase in July (upwardly revised from an originally reported 0.1% decline). The LEI fell by 2.8% over the six months between February and August 2025, a faster rate of decline than its 0.9% contraction over the previous six-month period (August 2024 to February 2025). The composite economic indexes are the key elements in an analytic system designed to signal peaks and troughs in the business cycle. The indexes are constructed to summarize and reveal common turning points in the economy in a clearer and more convincing manner than any individual component. The CEI is highly correlated with real GDP. The LEI is a predictive variable that anticipates (or “leads”) turning points in the business cycle by around 7 months. Shaded areas denote recession periods or economic contractions. The dates above the shaded areas show the chronology of peaks and troughs in the business cycle. The ten components of The Conference Board Leading Economic Index® for the U.S. include: Average weekly hours in manufacturing; Average weekly initial claims for unemployment insurance; Manufacturers’ new orders for consumer goods and materials; ISM® Index of New Orders; Manufacturers’ new orders for nondefense capital goods excluding aircraft orders; Building permits for new private housing units; S&P 500® Index of Stock Prices; Leading Credit Index™; Interest rate spread (10-year Treasury bonds less federal funds rate); Average consumer expectations for business conditions. REF: ConferenceBoard, LEI Report for July (ReceesionAlert) (Released on 9/1/2025)
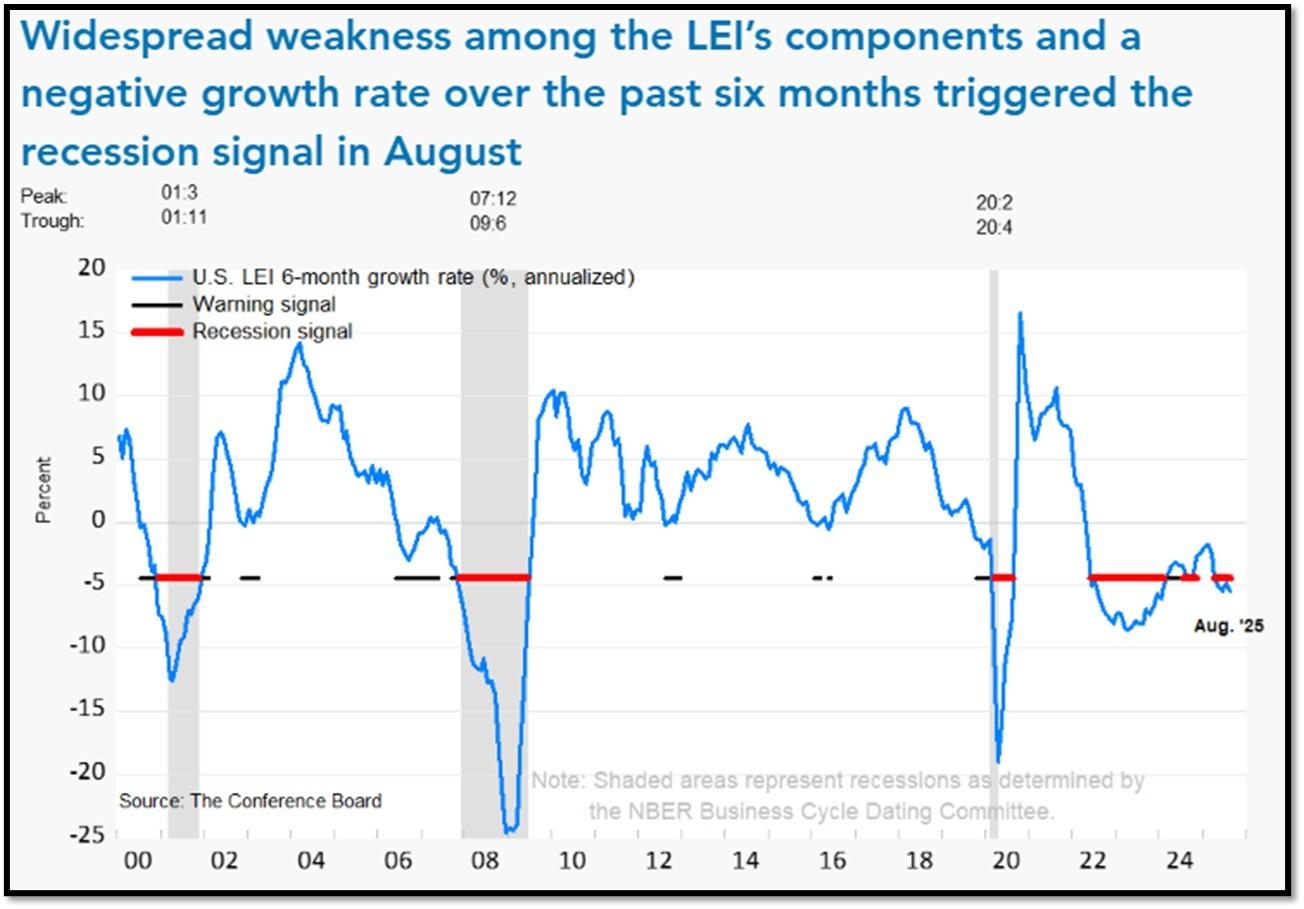
We have experienced a “rolling recession” since June 2022 and are only now emerging from it. However, authorities are not labeling it a recession due to high employment data.
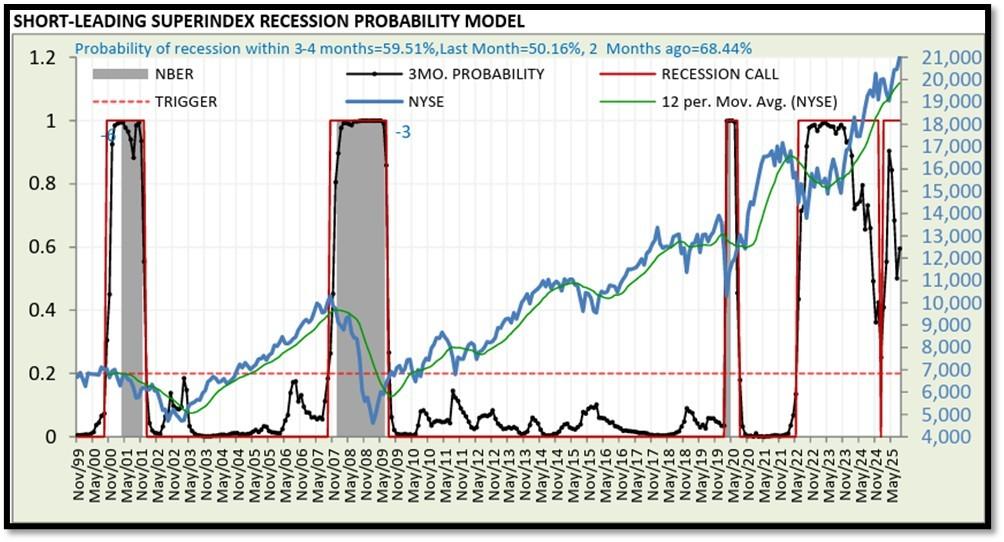
5F. Probability of U.S. falling into Recession within 3 to 4 months is currently at 59.51% (with data as of 09/14/2025 – Next Report 09/29/2025) according to RecessionAlert Research. Last release’s data was at 58.54%. This report is updated every two weeks. REF: RecessionAlertResearch
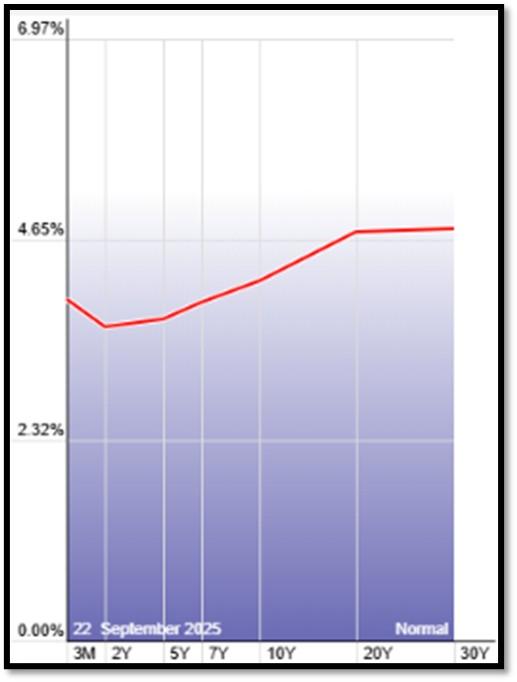
5G. Yield Curve as of 9/22/2025 is showing Normal. Spread on the 10-yr Treasury Yield (4.13%) minus yield on the 2-yr Treasury Yield (3.59%) is currently at 54bps. REF: Stockcharts The yield curve—specifically, the spread between the interest rates on the ten-year Treasury note and the three-month Treasury bill—is a valuable forecasting tool. It is simple to use and significantly outperforms other financial and macroeconomic indicators in predicting recessions two to six quarters ahead. REF: NYFED
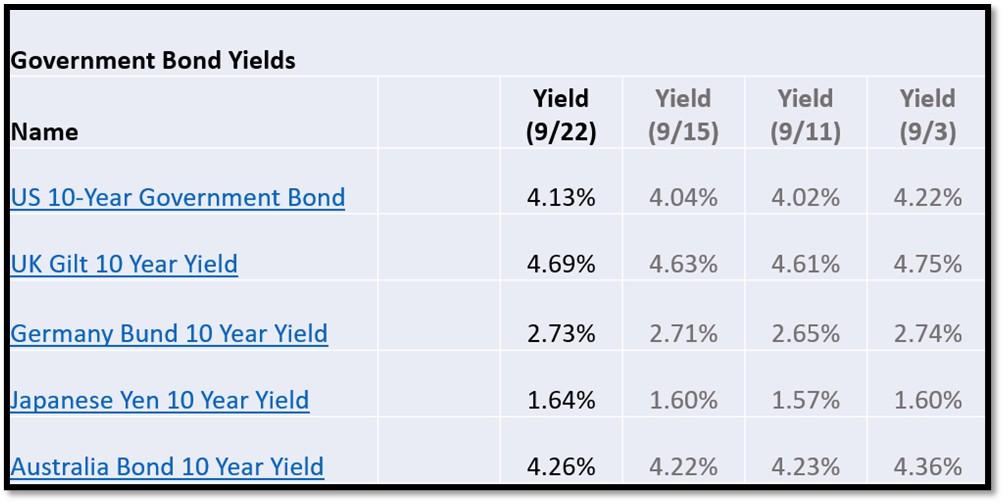
5H. Recent Yields in 10-Year Government Bonds. REF: Source is from Bloomberg.com, dated 9/22/2025, rates shown below are as of 9/22/2025, subject to change.
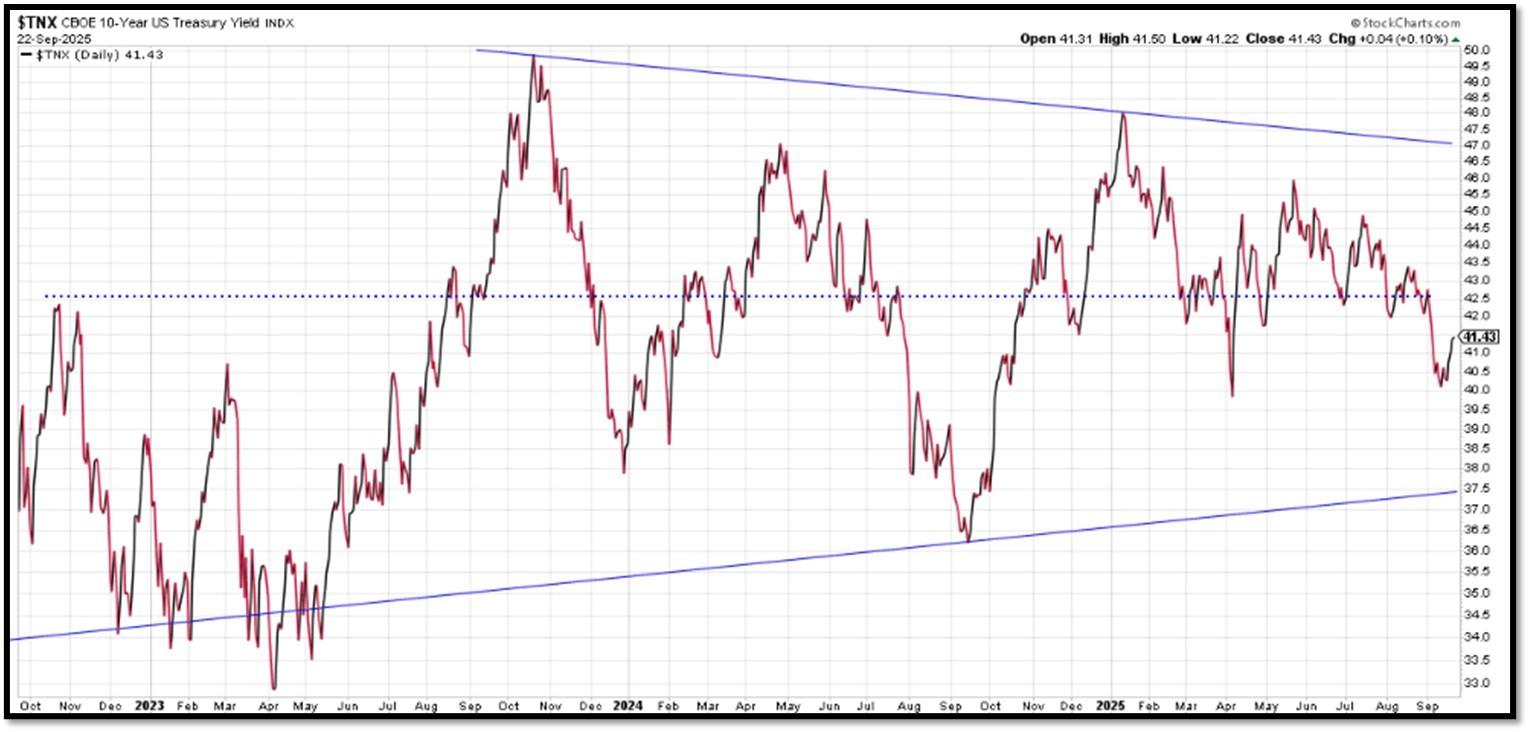
The 10-Year US Treasury Yield… The 10-Year Yield is indirectly related to inflation. I expect the 10-Year Yield to drop further as dis-inflation kicks in. REF: StockCharts1
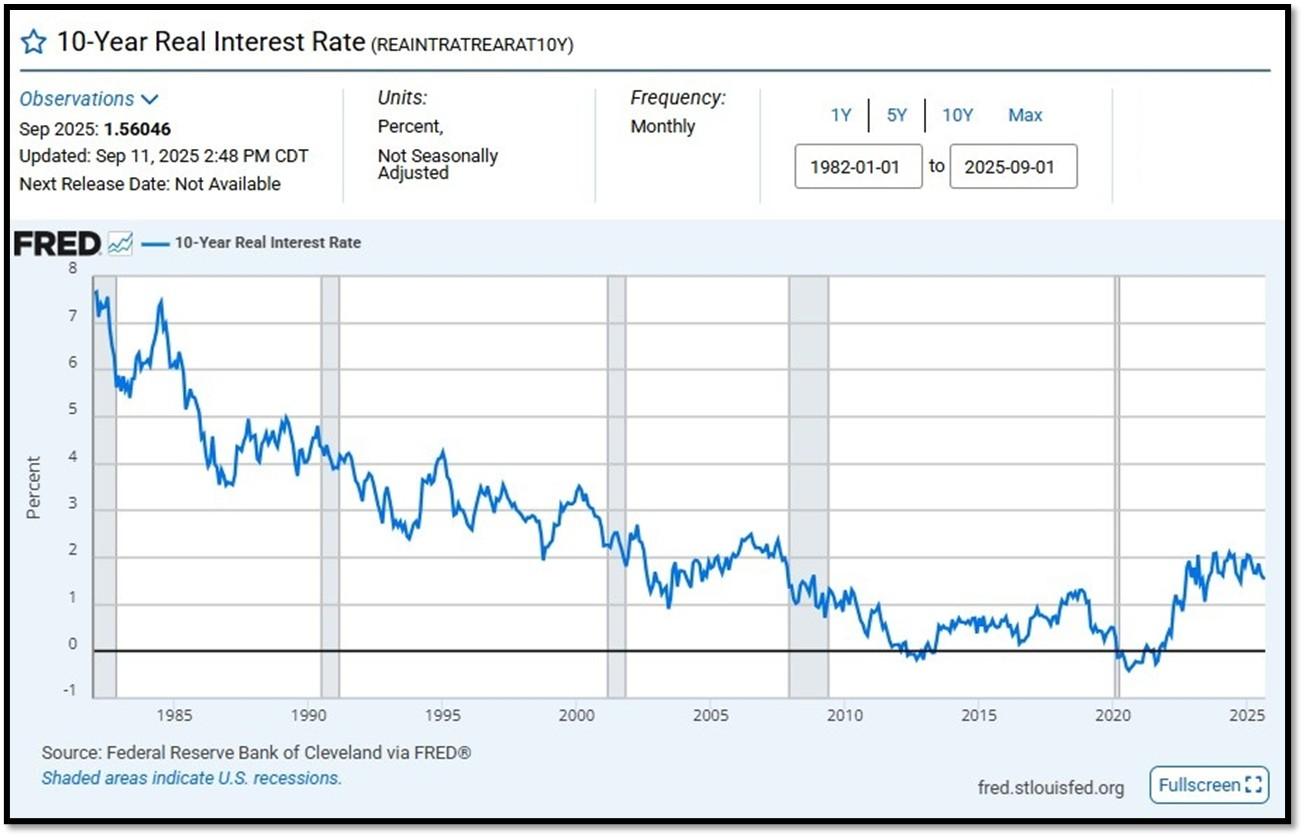
10-Year Real Interest Rate at 1.56046% as of 9/11/25. Last month’s data was 1.56633%. REF: REAINTRATREARAT10Y
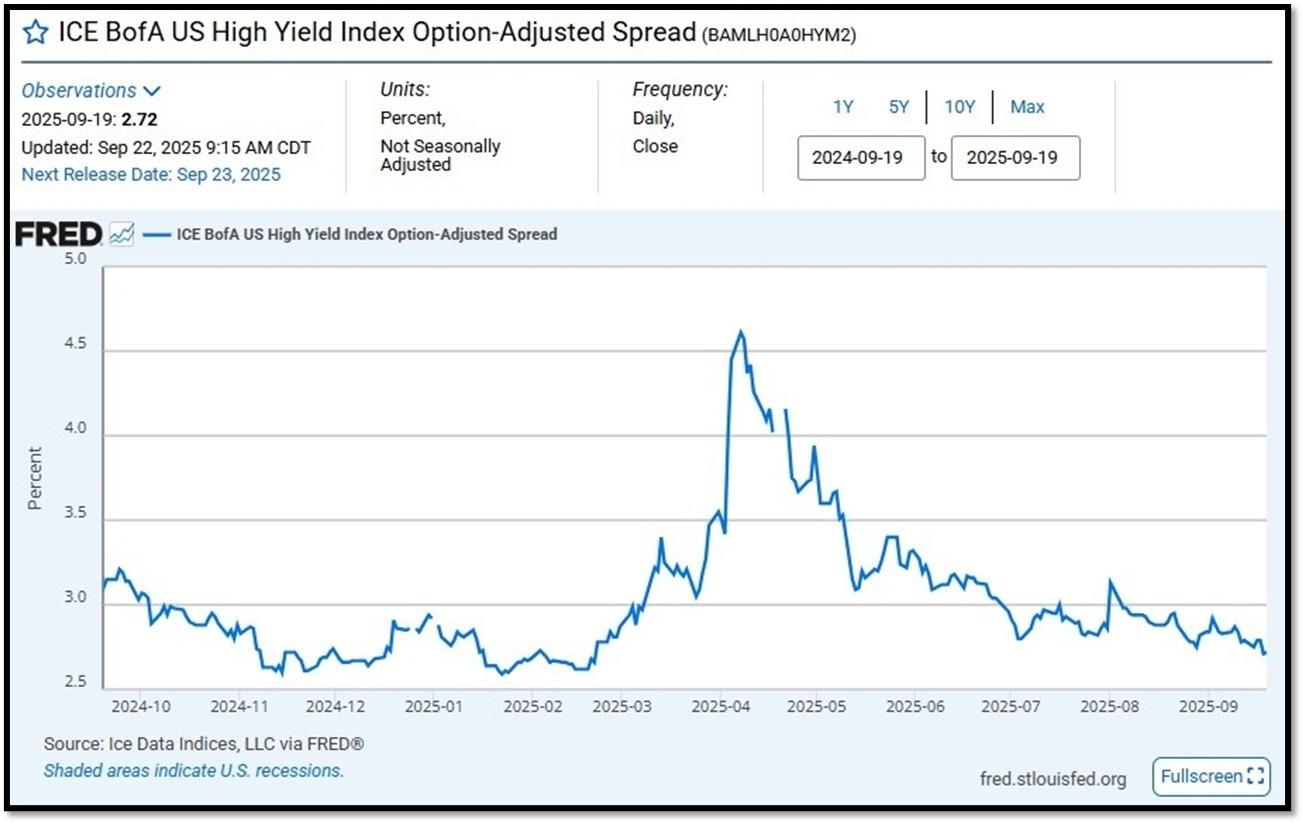
ICE BofA US High Yield Index Option-Adjusted Spread (BAMLH0A0HYM2) currently at 2.72 as of September 22, 2025. This is a key indicator of market sentiment, particularly regarding risk and economic health. At its core, the spread reflects the extra return investors demand to hold riskier corporate debt over safer government securities. High-yield bonds are issued by companies with lower credit ratings (below investment grade, like BB or lower), meaning they carry a higher chance of default. The spread compensates for this risk. When the spread is narrow—say, around 2.5% to 3%, as seen recently—it suggests investors are confident, willing to accept less extra yield because they perceive lower default risk or a strong economy. Narrow spreads often align with bullish markets, where cash is flowing, growth is steady, and fear is low. REF: FRED-BAMLH0A0HYM2
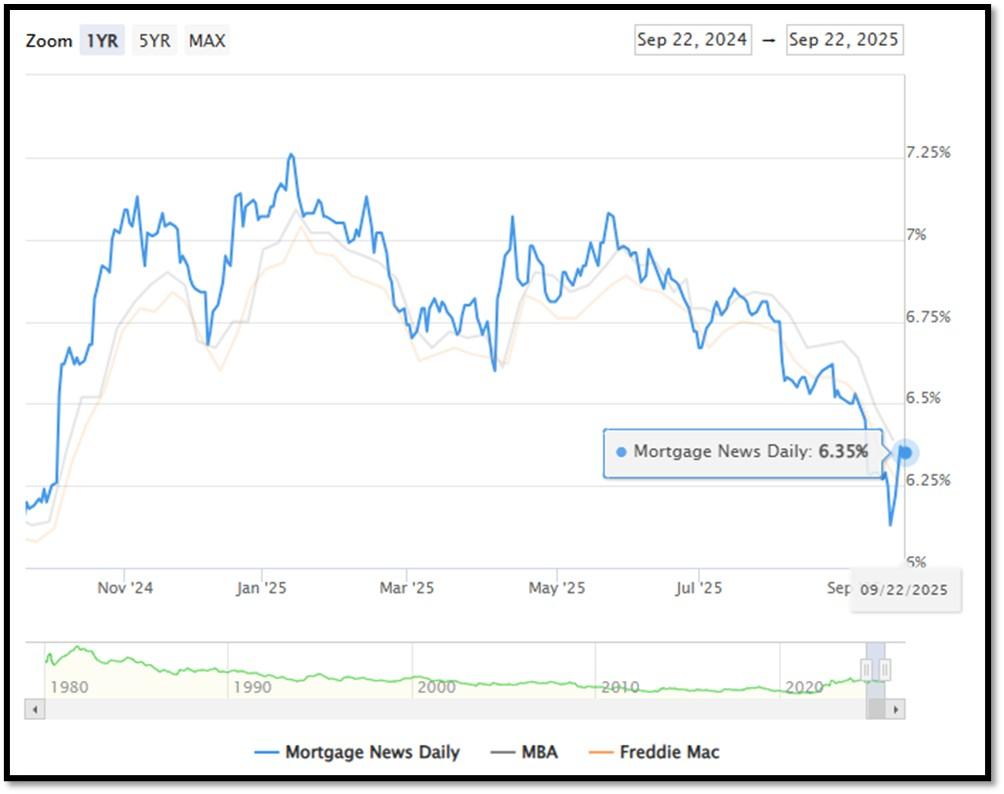
5I. (9//2025) Today’s National Average 30-Year Fixed Mortgage Rate is 6.35% (All Time High was 8.03% on 10/19/23). Last week’s data was 6.25%. This rate is the average 30-year fixed mortgage rates from several different surveys including Mortgage News Daily (daily index), Freddie Mac (weekly survey), Mortgage Bankers Association (weekly survey) and FHFA (monthly survey). REF: MortgageNewsDaily, Today’s Average Rate
The recent spike in the 30-year fixed-rate jumbo mortgage to 6.35%, compared to Freddie Mac’s rate at 6.26% and the Mortgage Bankers Association (MBA) rate at 6.39%, highlights key differences in the mortgage market. Jumbo mortgages, which exceed the conforming loan limits set by government agencies like Freddie Mac, typically carry higher interest rates because they are riskier for lenders. These loans are not backed by government entities, which increases the risk for lenders and, consequently, leads to higher rates. In contrast, Freddie Mac and MBA provide averages for conforming loans, which meet federal guidelines and have lower risk due to government backing, keeping their rates lower.
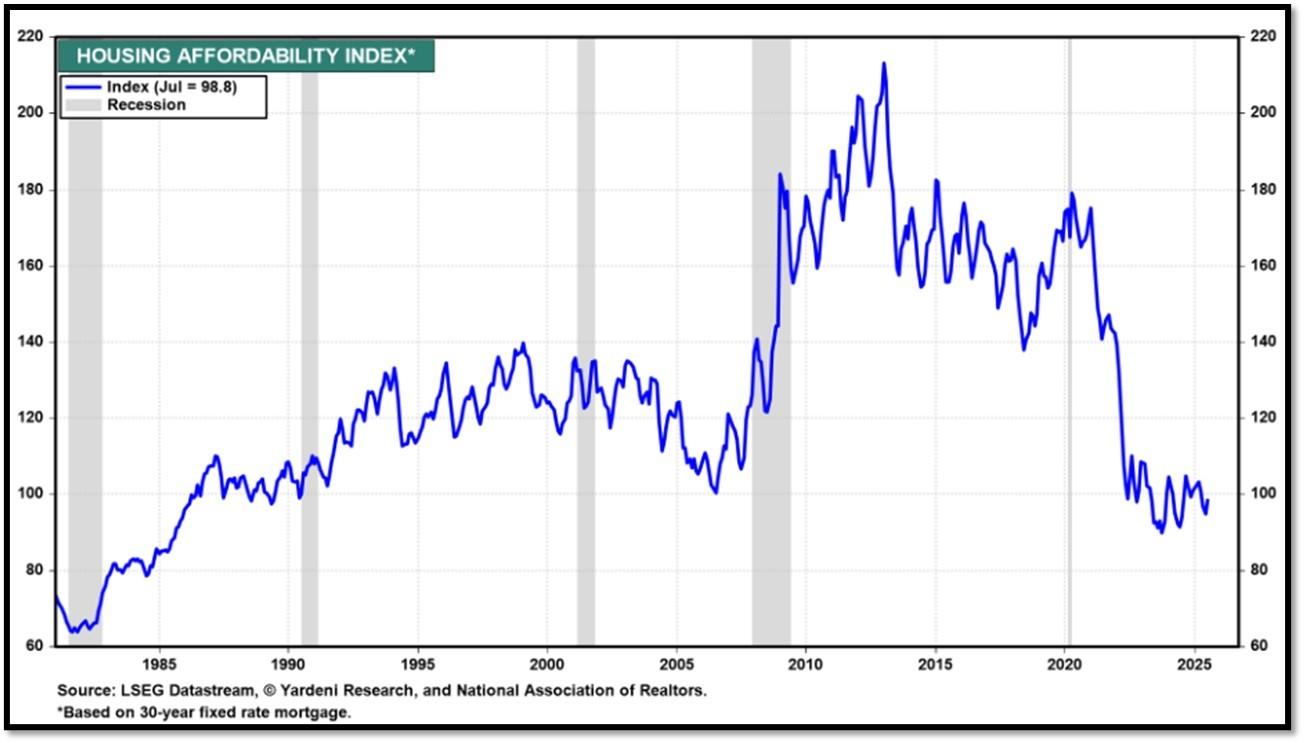
Housing Affordability Index for July = 98.8 // Jun = 94.4 // May = 97.2 // Apr = 101.0 // Mar = 103.2 // Feb = 102.2 // Jan = 100.7. Data provided by Yardeni Research. REF: Yardeni
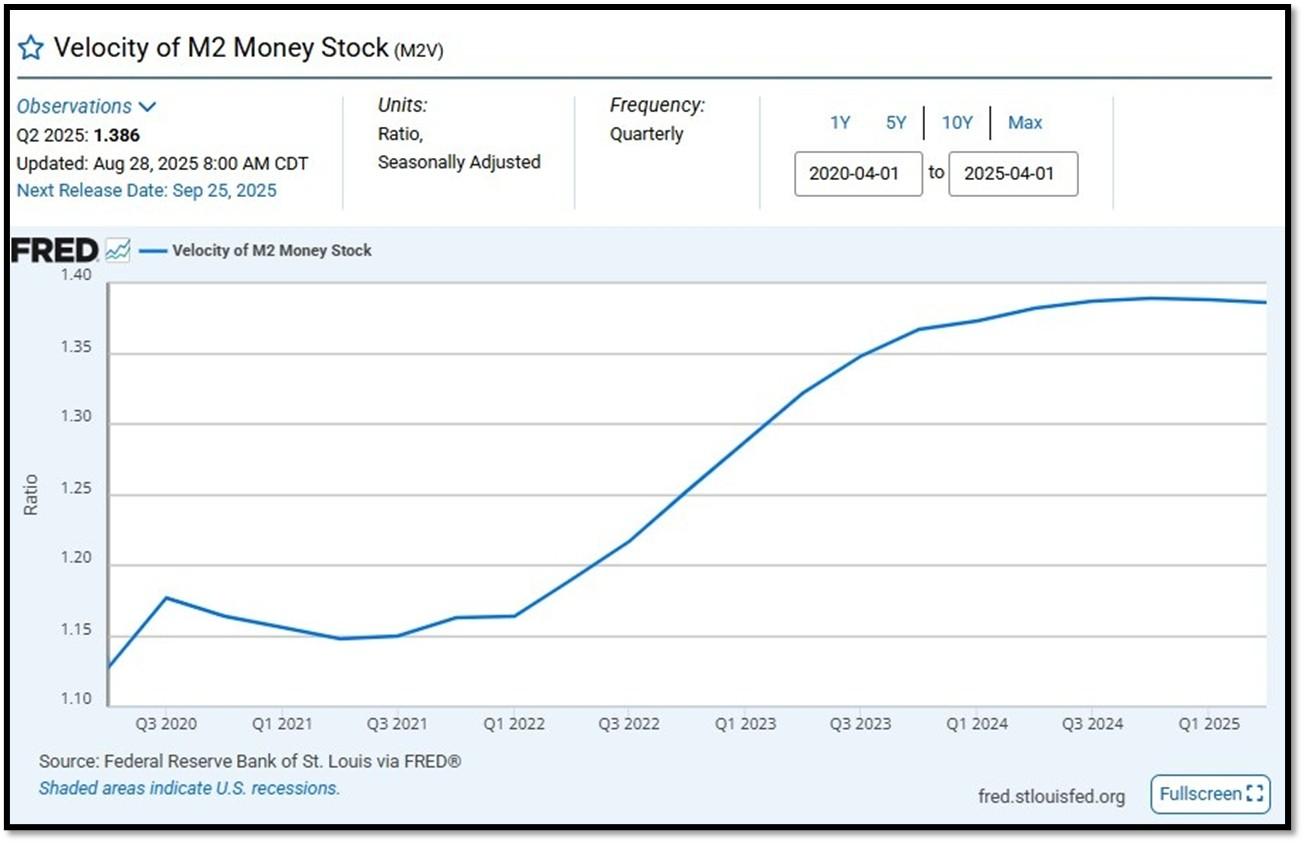
5J. Velocity of M2 Money Stock (M2V) with current read at 1.386 as of (Q2-2025 updated August 28, 2025). Previous quarter’s data was 1.386. The velocity of money is the frequency at which one unit of currency is used to purchase domestically- produced goods and services within a given time period. In other words, it is the number of times one dollar is spent to buy goods and services per unit of time. If the velocity of money is increasing, then more transactions are occurring between individuals in an economy. Current Money Stock (M2) report can be viewed in the reference link. REF: St.LouisFed-M2V
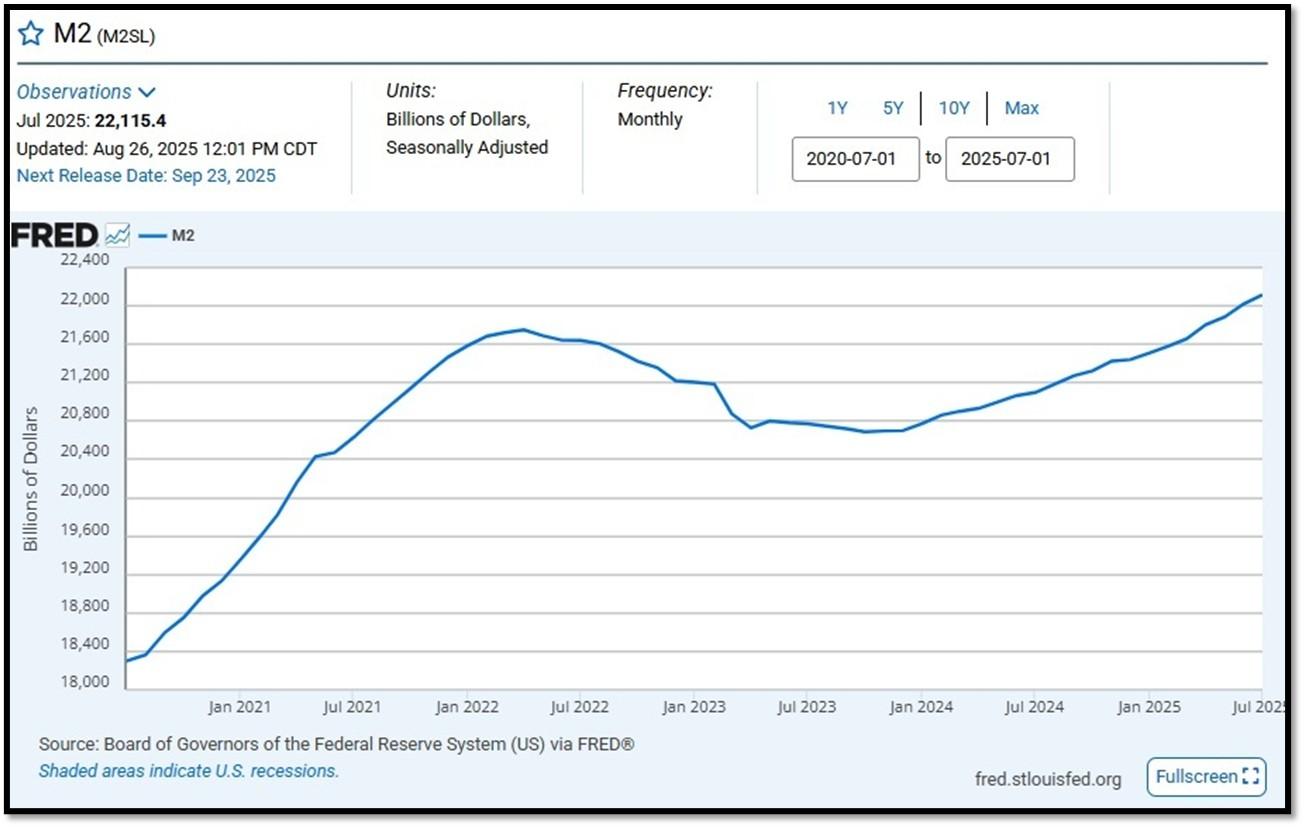
M2 consists of M1 plus (1) small-denomination time deposits (time deposits in amounts of less than $100,000) less IRA and Keogh balances at depository institutions; and (2) balances in retail MMFs less IRA and Keogh balances at MMFs. Seasonally adjusted M2 is constructed by summing savings deposits (before May 2020), small-denomination time deposits, and retail MMFs, each seasonally adjusted separately, and adding this result to seasonally adjusted M1. Board of Governors of the Federal Reserve System (US), M2 [M2SL], retrieved from FRED, Federal Reserve Bank of St. Louis; Updated on July 22, 2025. REF: St.LouisFed-M2
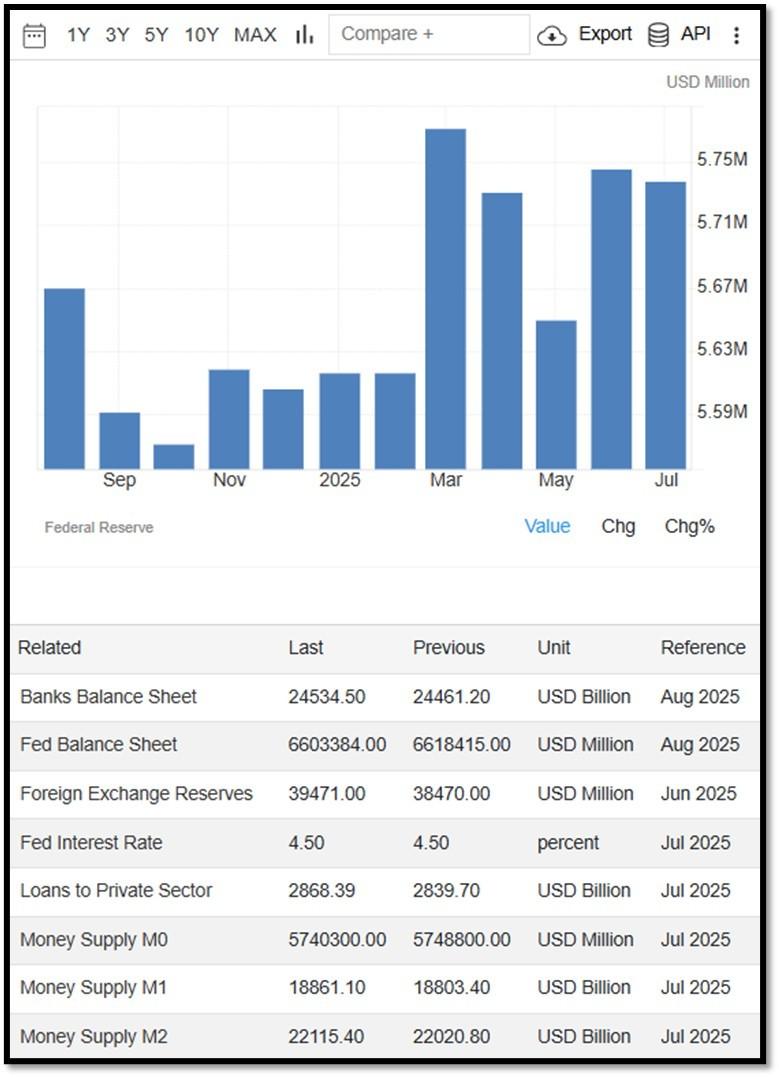
Money Supply M0 in the United States decreased to 5,740,300 USD Million in July from 5,748,800 USD Million in June of 2025. Money Supply M0 in the United States averaged 1,205,962.08 USD Million from 1959 until 2025, reaching an all-time high of 6,413,100.00 USD Million in December of 2021 and a record low of 48,400.00 USD Million in February of 1961. REF: TradingEconomics, M0
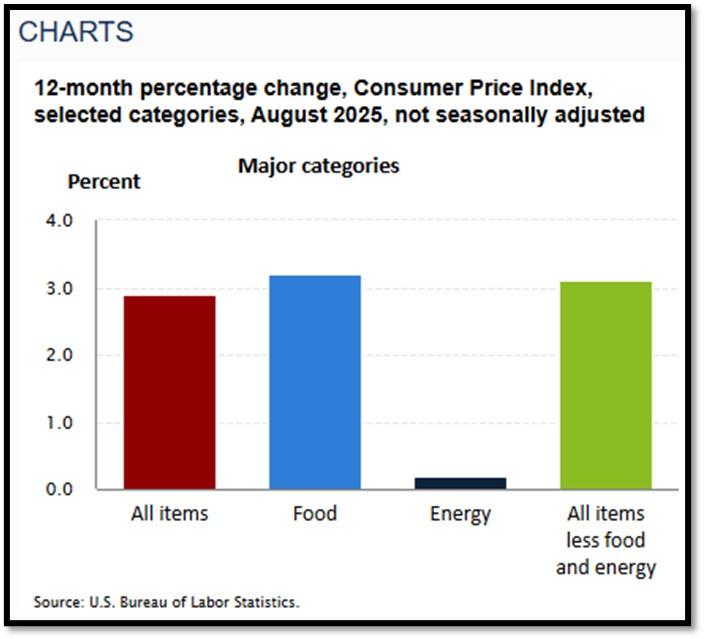
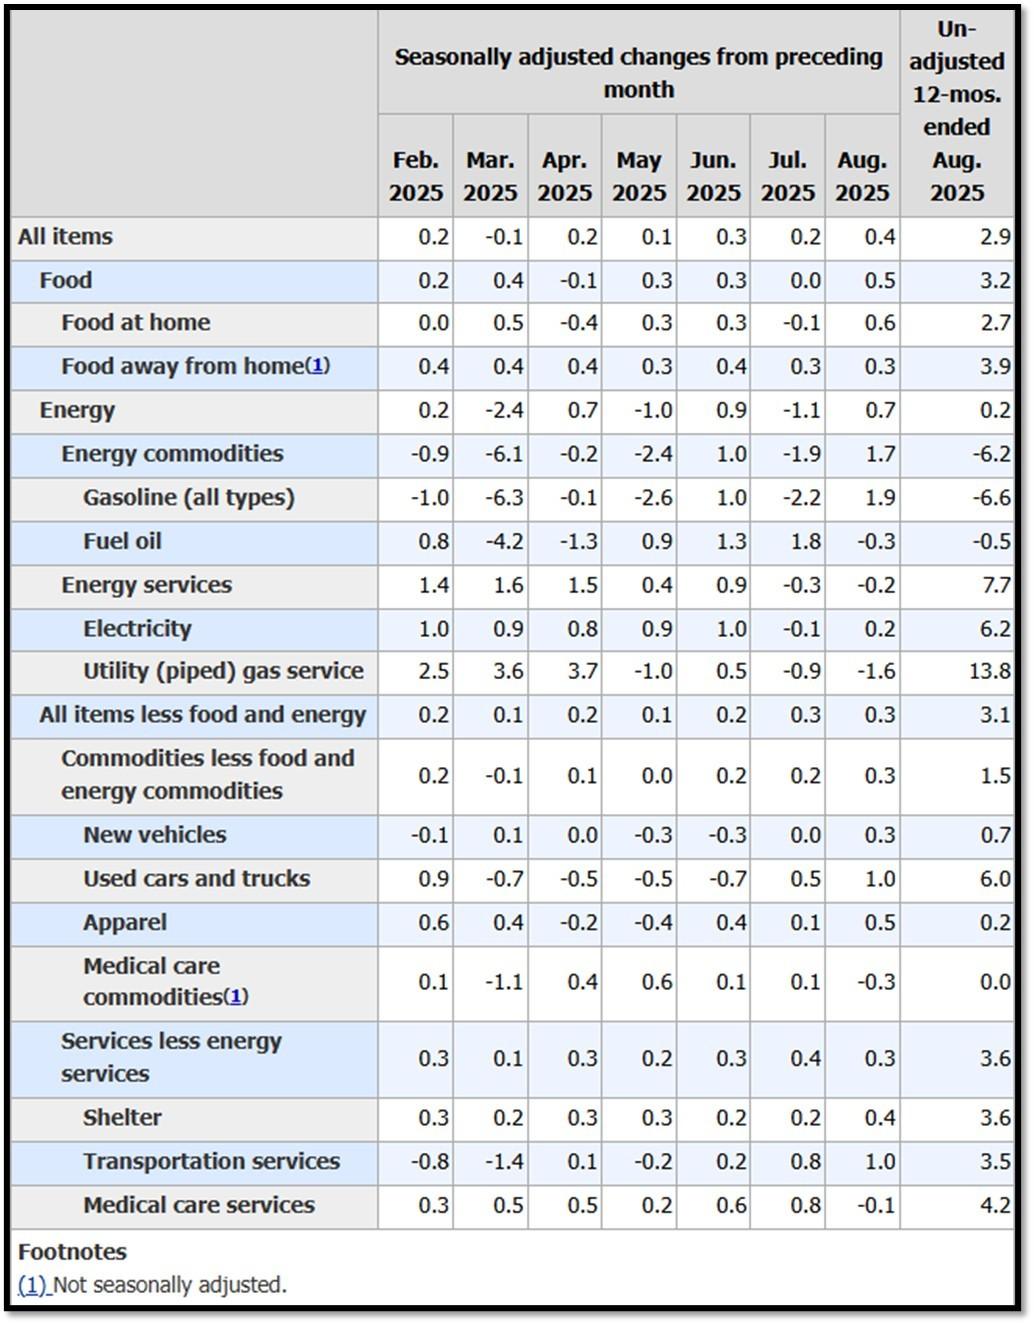
5K. In August, the Consumer Price Index for All Urban Consumers rose 0.4 percent, seasonally adjusted, and rose 2.9 percent over the last 12 months, not seasonally adjusted. The index for all items less food and energy increased 0.3 percent in August (SA); up 3.1 percent over the year (NSA). September 2025 CPI data are scheduled to be released on October 15, 2025, at 8:30AM-ET. REF: BLS, BLS.GOV
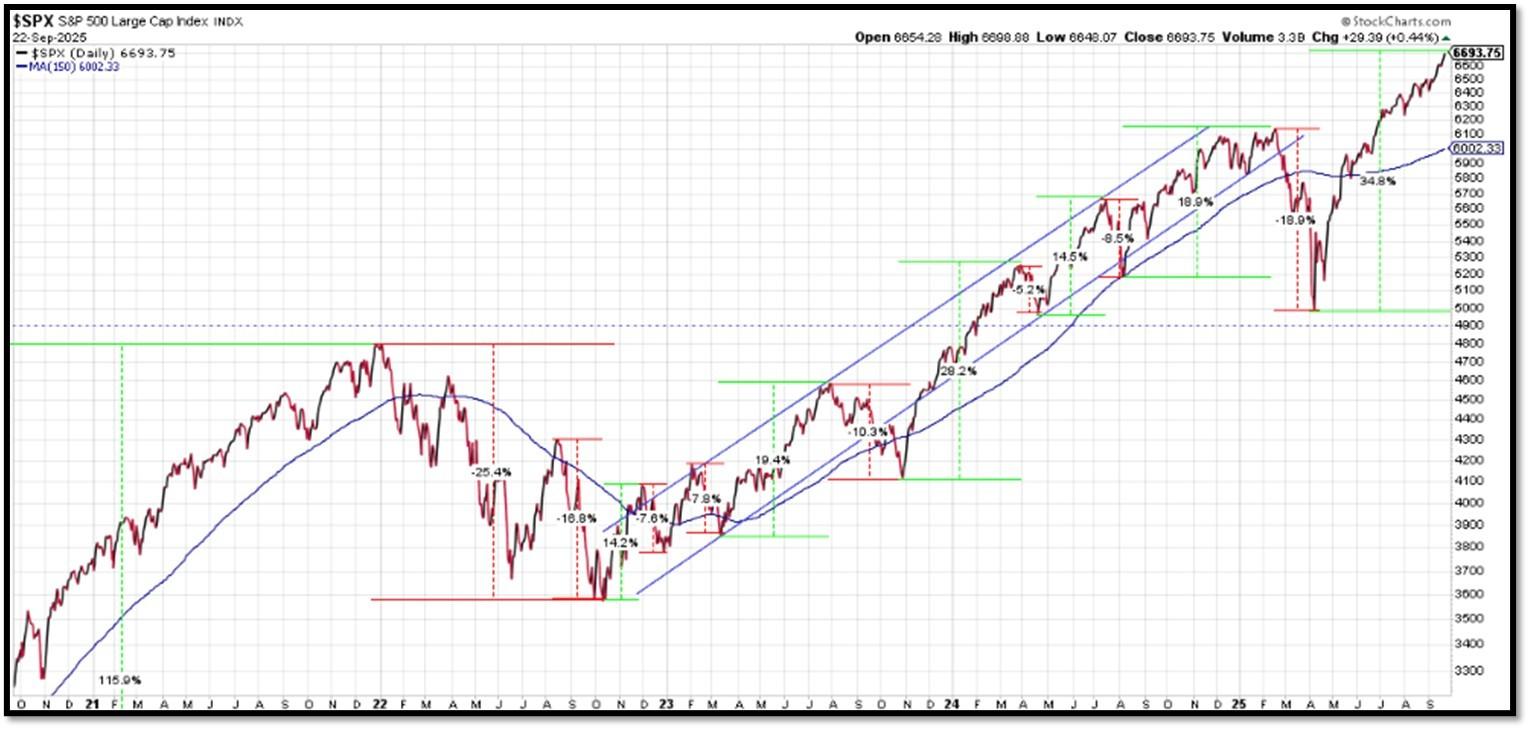
5L. Technical Analysis of the S&P500 Index. Click onto reference links below for images.
- Short-term Chart: Trend Bullish on 9/22/2025 – REF: Short-term S&P500 Chart by Marc Slavin (Click Here to Access Chart)
- Medium-term Chart: Trend Bearish to Bullish on 9/22/2025 – REF: Medium-term S&P500 Chart by Marc Slavin (Click Here to Access Chart)
- Market Timing Indicators – S&P500 Index as of 9/22/2025 – REF: S&P500 Charts (7 of them) by Joanne Klein’s Top 7 (Click Here to Access Updated Charts)
- The S&P500 is hitting all-time-high, rebounding from a V-shaped recovery to all-time high. REF: Stockcharts
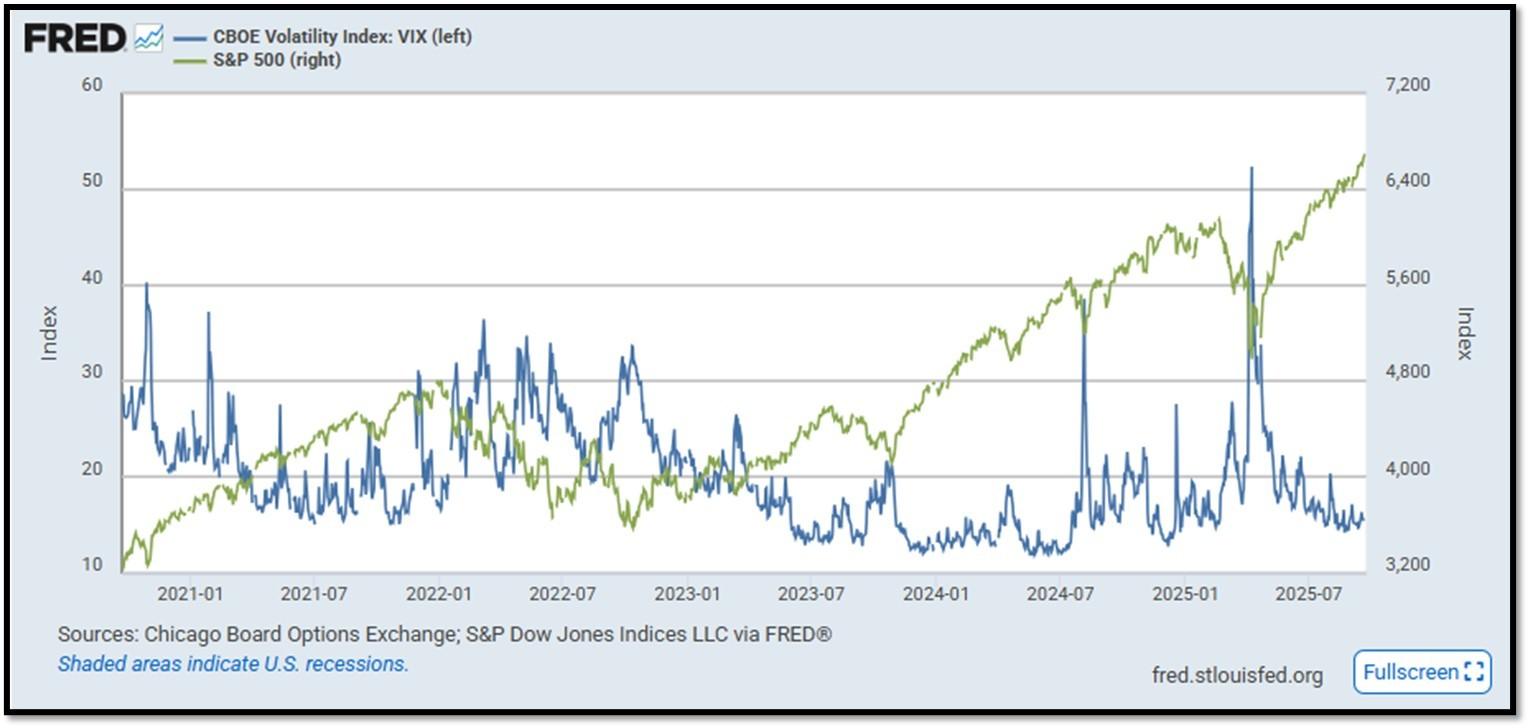
- S&P500 and CBOE Volatility Index (VIX) as of 9/22/2025. REF: FRED, Today’s Print
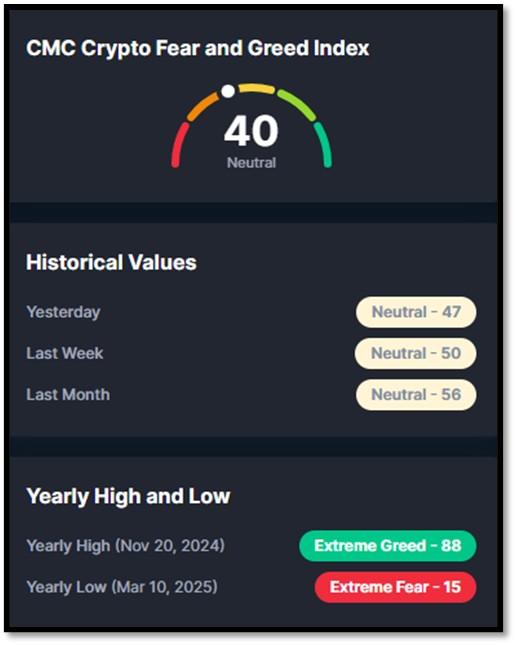
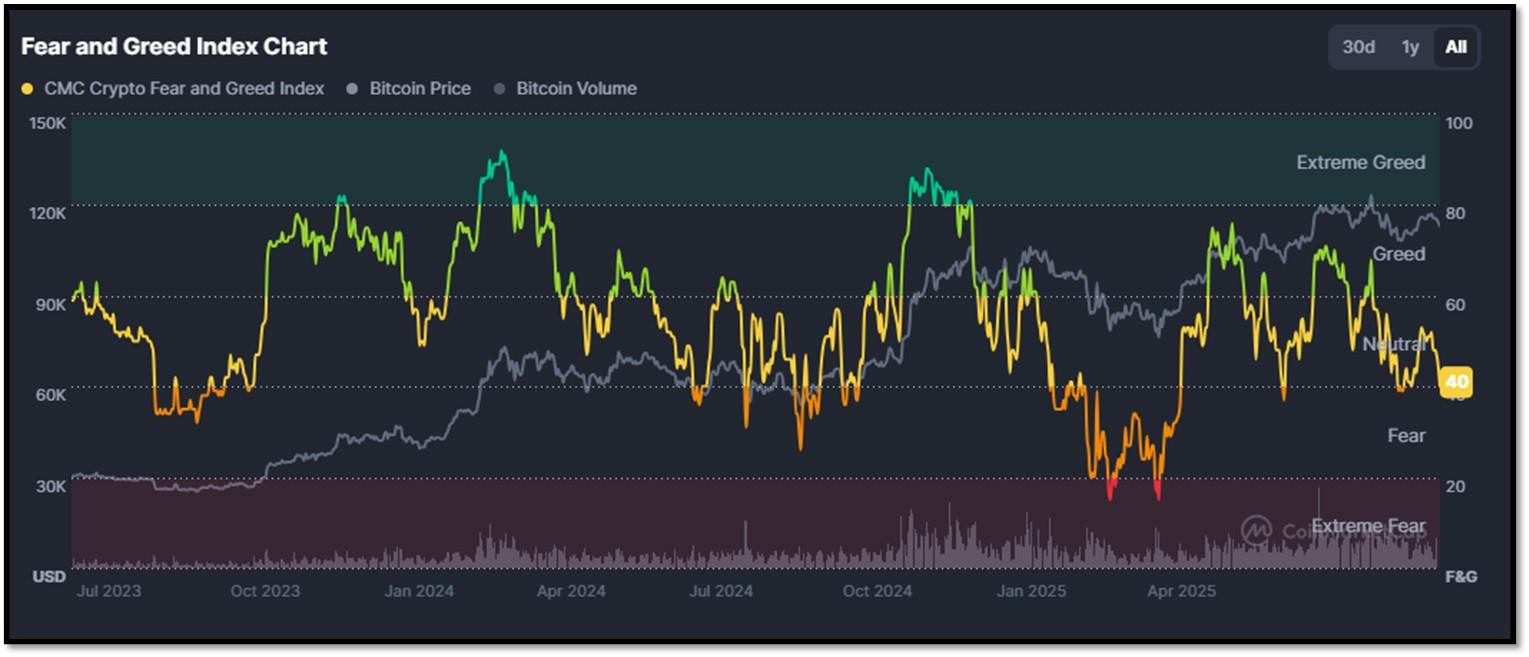
5M. Most recent read on the Crypto Fear & Greed Index with data as of 9/22/2025 is 40 (Neutral). Last week’s data was 50 (Neutral) (1-100). Fear & Greed Index – A Contrarian Data. The crypto market behavior is very emotional. People tend to get greedy when the market is rising which results in FOMO (Fear of missing out). Also, people often sell their coins in irrational reaction of seeing red numbers. With the Crypto Fear and Greed Index, the data try to help save investors from their own emotional overreactions. There are two simple assumptions:
- Extreme fear can be a sign that investors are too worried. That could be a buying opportunity.
- When Investors are getting too greedy, that means the market is due for a correction.
Therefore, the program for this index analyzes the current sentiment of the Bitcoin market and crunch the numbers into a simple meter from 0 to 100. Zero means “Extreme Fear”, while 100 means “Extreme Greed”. REF: Coinmarketcap.com, Today’sReading
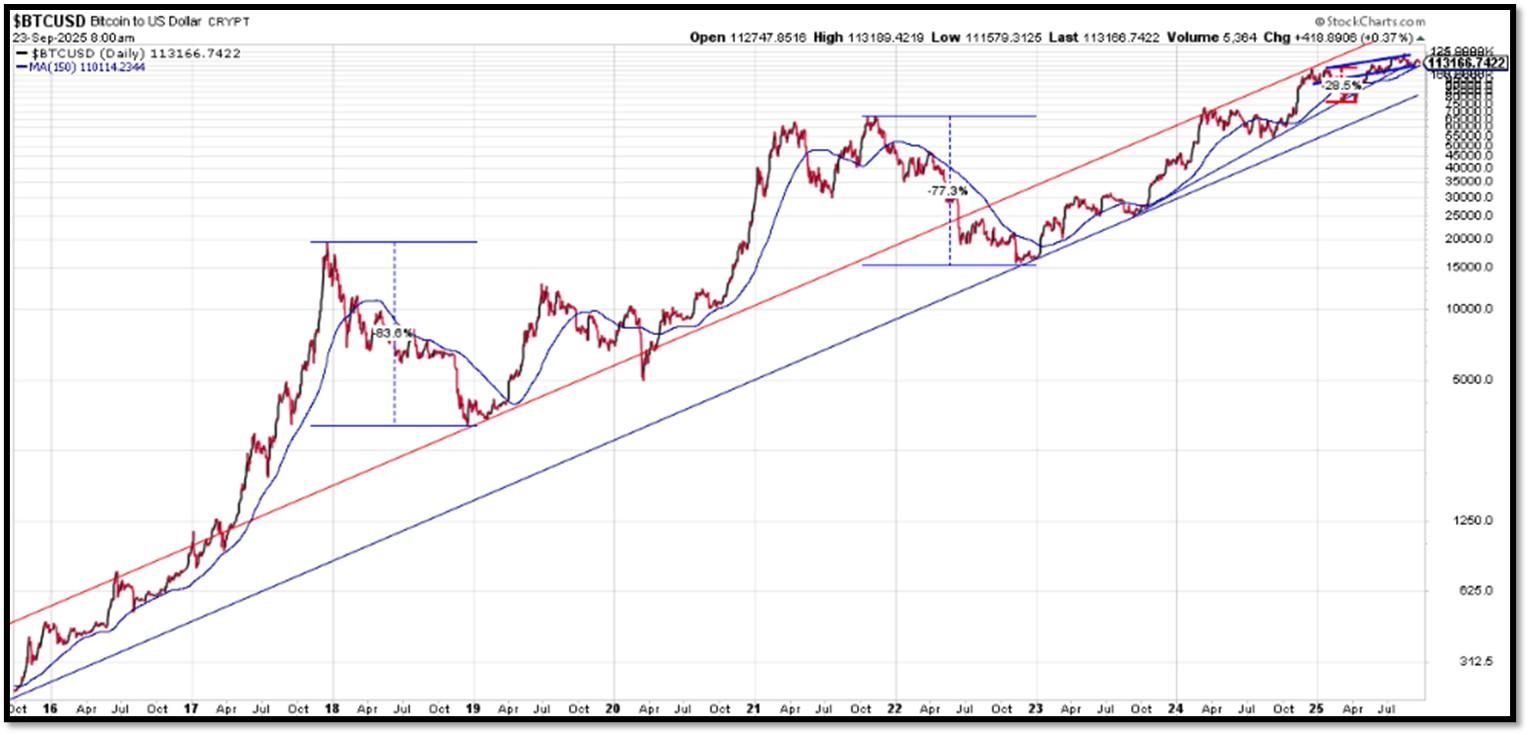
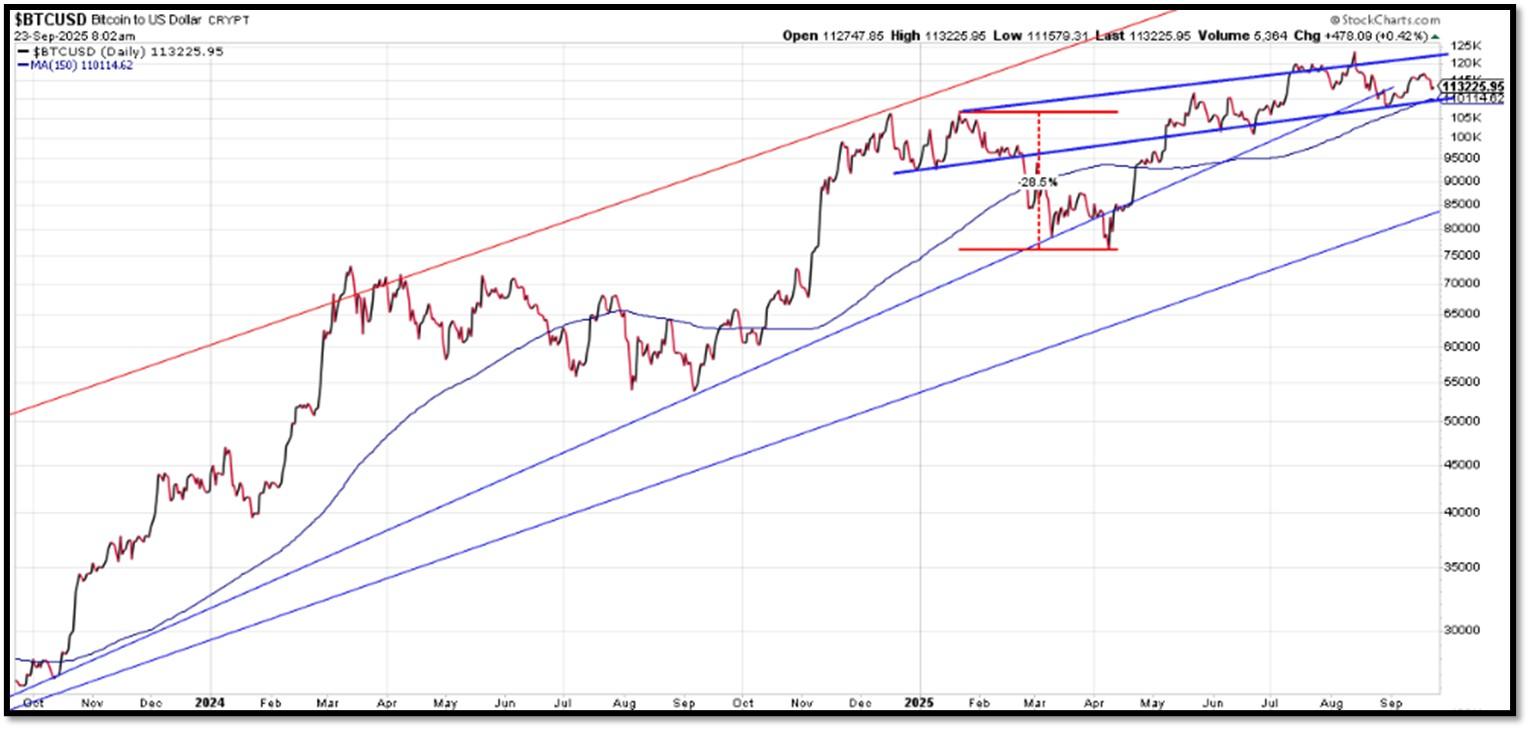
Bitcoin – 10-Year & 2-Year Charts. REF: Stockcharts10Y, Stockcharts2Y
From the desk of our Chief Investment Officer
As an investment professional with over twenty-six years of experience in the financial services industry, Andrew helps clients to protect, grow and transfer wealth during their lifetime with objective, unbiased, customized and efficient strategies.
Education, Professional Licenses Acquired & Affiliations
- Passed the Series 7, 63, 65 and 24 license examinations
- Currently holding Series 65 License
- BA in Economics – Boston University (Boston, MA) 1993
- Certificate in Commodities Trading – New York University (New York, NY) 1991
- Certificate in Financial Planning – New York University (New York, NY) April 2011
With extensive experience in the Financial Services Industry, Andrew Tang and Turner Financial Group provides disciplined wealth management with an intelligent caring approach to each and every client that compliments the Dedicated Financial offering.


Len writes much of his own content, and also shares helpful content from other trusted providers like Turner Financial Group (TFG).
The material contained herein is intended as a general market commentary, solely for informational purposes and is not intended to make an offer or solicitation for the sale or purchase of any securities. Such views are subject to change at any time without notice due to changes in market or economic conditions and may not necessarily come to pass. This information is not intended as a specific offer of investment services by Dedicated Financial and Turner Financial Group, Inc.
Dedicated Financial and Turner Financial Group, Inc., do not provide tax, legal or accounting advice. You should consult your own tax, legal and accounting advisors before engaging in any transaction.
Any hyperlinks in this document that connect to Web Sites maintained by third parties are provided for convenience only. Turner Financial Group, Inc. has not verified the accuracy of any information contained within the links and the provision of such links does not constitute a recommendation or endorsement of the company or the content by Dedicated Financial or Turner Financial Group, Inc. The prices/quotes/statistics referenced herein have been obtained from sources verified to be reliable for their accuracy or completeness and may be subject to change.
Past performance is no guarantee of future returns. Investing involves risk and possible loss of principal capital. The views and strategies described herein may not be suitable for all investors. To the extent referenced herein, real estate, hedge funds, and other private investments can present significant risks, including loss of the original amount invested. All indexes are unmanaged, and an individual cannot invest directly in an index. Index returns do not include fees or expenses.
Turner Financial Group, Inc. is an Investment Adviser registered with the United States Securities and Exchange Commission however, such registration does not imply a certain level of skill or training and no inference to the contrary should be made. Additional information about Turner Financial Group, Inc. is also available at www.adviserinfo.sec.gov. Advisory services are only offered to clients or prospective clients where Turner Financial Group, Inc. and its representatives are properly licensed or exempt from licensure. No advice may be rendered by Turner Financial Group, Inc. unless a client service agreement is in place.


