

- 1. The Federal Reserve’s decision to cut interest rates by 50 basis points (bps), as anticipated, reflects Chairman Jay Powell’s proactive strategy to support the overall health of the U.S. economy.
- 2. SpaceX’s Starlink has secured contracts to provide internet service to 2,500 airplanes following a major deal with United Airlines.
- 3. OpenAI’s o1 large language model (LLM) has emerged as a top performer in tasks requiring advanced reasoning and problem-solving.
- 4. World Watch
- 5. Quant & Technical Corner
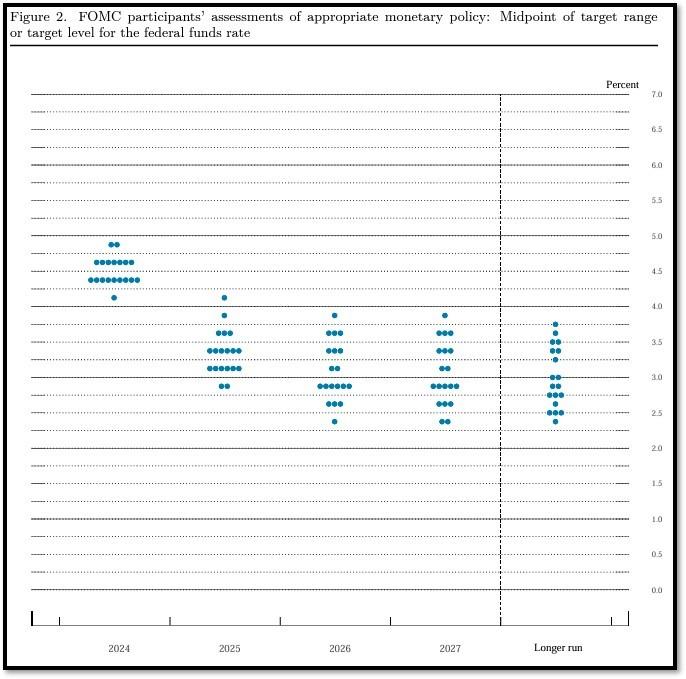
1. The Federal Reserve’s decision to cut interest rates by 50 basis points (bps), as anticipated, reflects Chairman Jay Powell’s proactive strategy to support the overall health of the U.S. economy.
This preemptive measure is aimed at maintaining economic stability without resorting to drastic interventions. By lowering rates, Powell is ensuring that the economy remains resilient, particularly as inflation shows signs of slowing. The decision can also be seen as a form of catch-up, given that the Fed did not lower rates in July, despite clear signs that inflationary pressures were easing. This move acknowledges that, while inflation has moderated, there remains uncertainty in the economic outlook, and a rate cut helps provide a buffer against potential weakness without signaling panic or drastic action. Powell’s approach is one of cautious optimism, allowing the economy to benefit from lower borrowing costs while addressing inflationary concerns in a measured way. This rate cut serves to balance the need for growth with the goal of controlling inflation, and it reflects Powell’s intent to stay ahead of potential economic disruptions rather than reacting after the fact. Powell went on to say that the Fed will remain data-dependent for future actions on interest rates, and today’s rate cut should not be construed as the beginning of outsized rate cuts ahead. There are two more FOMC meetings for 2024: November 6-7 and December 17-18. I applaud Chairman Powell’s decision and look forward to the next two meetings for the rest of the year. REF: FOMC
2. SpaceX’s Starlink has secured contracts to provide internet service to 2,500 airplanes following a major deal with United Airlines.
Starlink, which offers satellite-based broadband, is expanding its services to the aviation industry, providing high-speed, reliable internet for in-flight connectivity. The United Airlines megadeal represents a significant portion of these contracts, marking a major step in Starlink’s move into commercial aviation. By offering faster and more stable internet than traditional providers, Starlink aims to enhance the passenger experience, making seamless internet access available on flights. This growth in aviation contracts underscores Starlink’s increasing presence in the in-flight connectivity market, which has been a key focus for expansion. Click onto pictures below to access videos. REF: CNBC


We are currently using the following investments to get exposure to SpaceX in client allocations. Click onto referenced links for additional information.
- Baron Focused Growth Fund (BFGFX, BFGIX) REF: Fund’s Website
- The Private Shares Fund (PRIVX, PIIVX) – This is an interval fund – subject to limited liquidity on redemptions. REF: Fund’s Website
With the current macro-economic backdrop, below are areas we currently favor:
- Fixed Income – Short-term (Low-Beta)
- Fixed Income – Adding Duration, preferred stocks & High Yield as Opportunistic Allocation (Low-Beta)
- Businesses that contribute to and benefit from AI & Automation (Market-Risk)
- Mid Cap Stocks, Small Cap Stocks & European Stocks (Market-Risk)
- Industrials (Market-Risk)
- Clean Energy / Solar / Utilities (Market-Risk)
- Healthcare & Biotechnology (Market-Risk)
- Gold (Market-Risk)
3. OpenAI’s o1 large language model (LLM) has emerged as a top performer in tasks requiring advanced reasoning and problem-solving.
Its standout feature is the Chain-of-Thought (CoT) prompting, which allows it to break down complex tasks into simpler steps, leading to more accurate and refined results. This capability has enabled o1 to outperform previous models like GPT-4o, particularly in areas such as coding, mathematics, and scientific reasoning. According to Frank Downing of ARK Invest, Open AI’s o1 outperforms other LLMs by “Stopping to Think.”
In internal evaluations, o1 achieved top scores in math competitions and outperformed experts with PhDs in science-related challenges. This makes it particularly strong for tasks that demand deep contextual understanding. Additionally, the CoT mechanism not only improves reasoning but also enhances the model’s safety by reducing errors through self-correction during its reasoning process. These advancements make o1 a leader among large language models, surpassing many of its competitors. Click onto pictures below to access videos. REF: ARK-Invest, OpenAI
4. World Watch
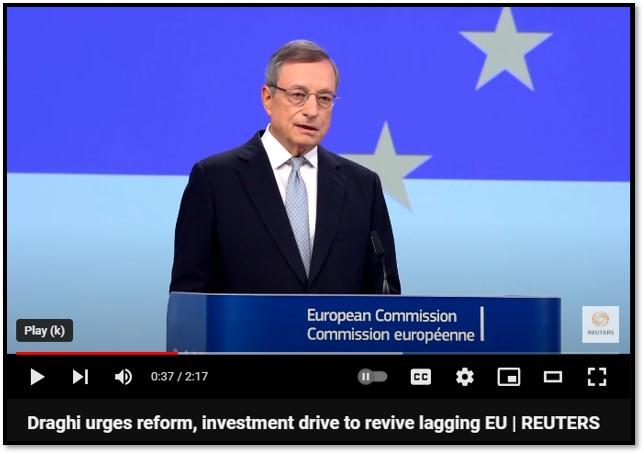
4A. The European Union needs to make significant changes if it wants to keep pace with the US and China, said former European Central Bank head Mario Draghi. The former ECB chief argues that the EU requires far more coordinated industrial policies, faster decision-making, and substantial investment. Draghi stated that the European bloc needs additional investments of up to 884 billion euros per year, or up to 5% of GDP. He criticized the EU’s decision-making process as complex and sluggish, and emphasized the need for the bloc to boost innovation, lower energy prices, and continue its efforts to decarbonize. Click onto picture below to access video. REF: WSJ, REUTERS
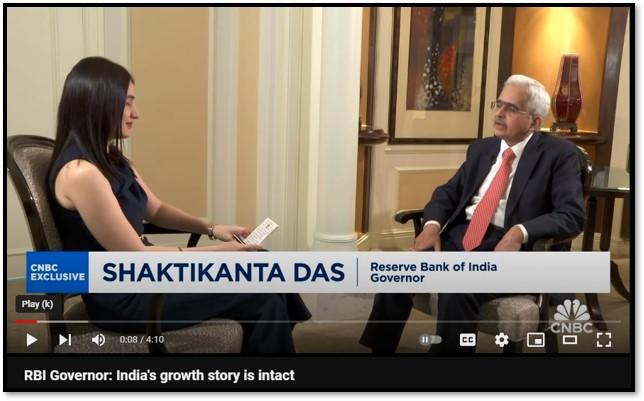
4B. Shaktikanta Das, governor of the Reserve Bank of India, joined CNBC’s Tanvir Gill in an interview to discuss India’s inflation outlook and the RBI’s interest rate considerations. Das dismissed fears of a deposit crunch, reassuring that the banking system remains stable with sufficient liquidity and strong deposit growth. While acknowledging potential challenges for some banks, he emphasized that the overall system is resilient and well-regulated, with the RBI ensuring adequate funds for lending and deposit needs. He also affirmed that India’s growth story is intact, expressing confidence in the economy’s resilience despite global challenges, and highlighted strong domestic demand, structural reforms, and government initiatives as key drivers of growth. Click onto picture below to access video. REF: CNBC
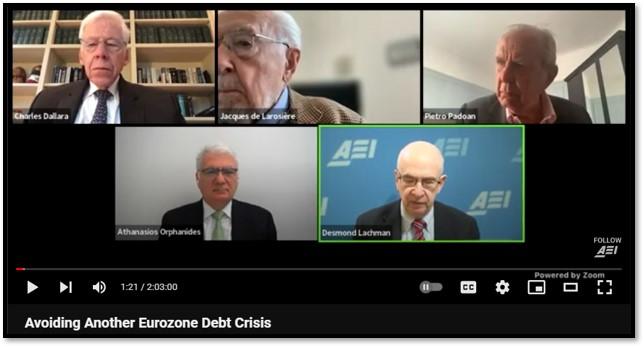
4C. Desmond Lachman, a senior fellow at the American Enterprise Institute and former IMF official, criticizes countries with excessive debt for risking economic instability. He warns that high debt levels, combined with loose monetary policies, can lead to asset bubbles, weaken currencies, and strain government budgets. Lachman argues that excessive borrowing limits a country’s ability to respond to economic crises, increasing the risk of defaults and financial instability, especially in emerging markets. Click onto picture below to access video. REF: BARRON’S
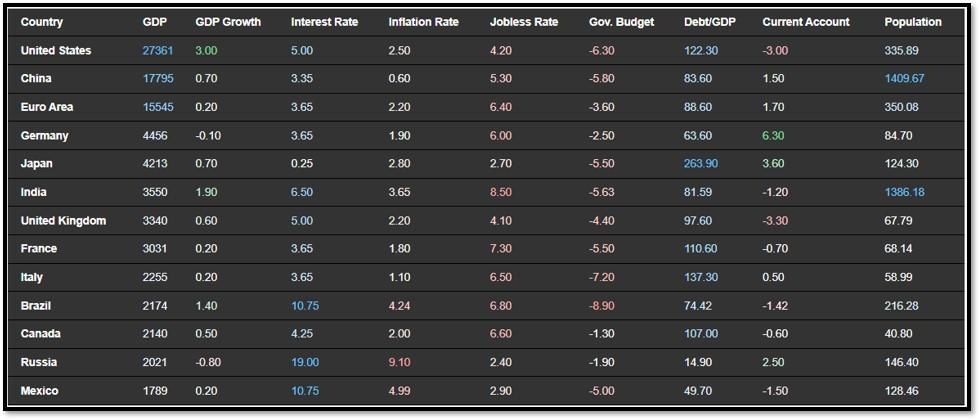
4D. Below is an updated snapshot of the current global state of economy according to TradingEconomics as of 9/18/2024. REF: TradingEconomics
- The Federal Reserve cut the target range for the fed funds rate by a jumbo 50bps to 4.75%-5% in September 2024, the first reduction in borrowing costs since March 2020.
- The annual inflation rate in the US slowed for a fifth consecutive month to 2.5% in August 2024, the lowest since February 2021, from 2.9% in July, and below forecasts of 2.6%.
- China’s annual inflation rate edged up to 0.6% in August 2024 from 0.5% in July, falling short of market forecasts of 0.7%. Still, it was the highest print since February, marking the 7th straight month of consumer inflation amid supply issues due to flaming heat and pouring rains.
- China’s surveyed unemployment rate was at 5.3% in August 2024, compared with market expectations and July’s reading of 5.2%.
5. Quant & Technical Corner
Below is a selection of quantitative & technical data we monitor on a regular basis to help gauge the overall financial market conditions and the investment environment.
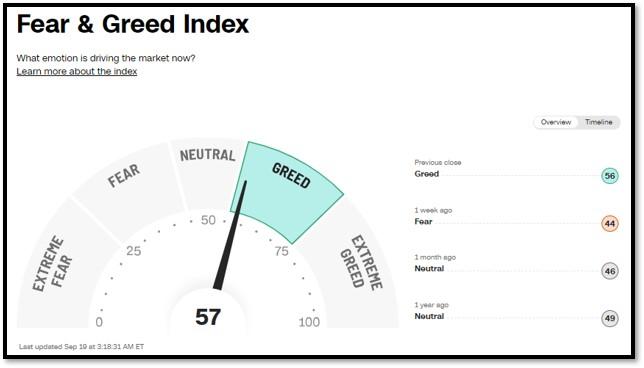
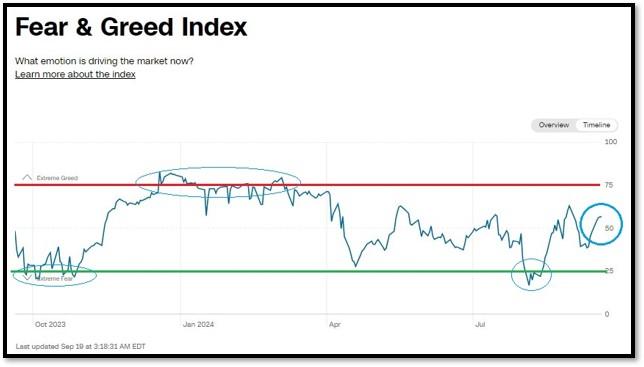
5A. Most recent read on the Fear & Greed Index with data as of 9/19/2024 – 3:18AM-ET is 57 (Greed). Last week’s data was 44 (Fear) (1-100). CNNMoney’s Fear & Greed index looks at 7 indicators (Stock Price Momentum, Stock Price Strength, Stock Price Breadth, Put and Call Options, Junk Bond Demand, Market Volatility, and Safe Haven Demand). Keep in mind this is a contrarian indicator! REF: Fear&Greed via CNNMoney
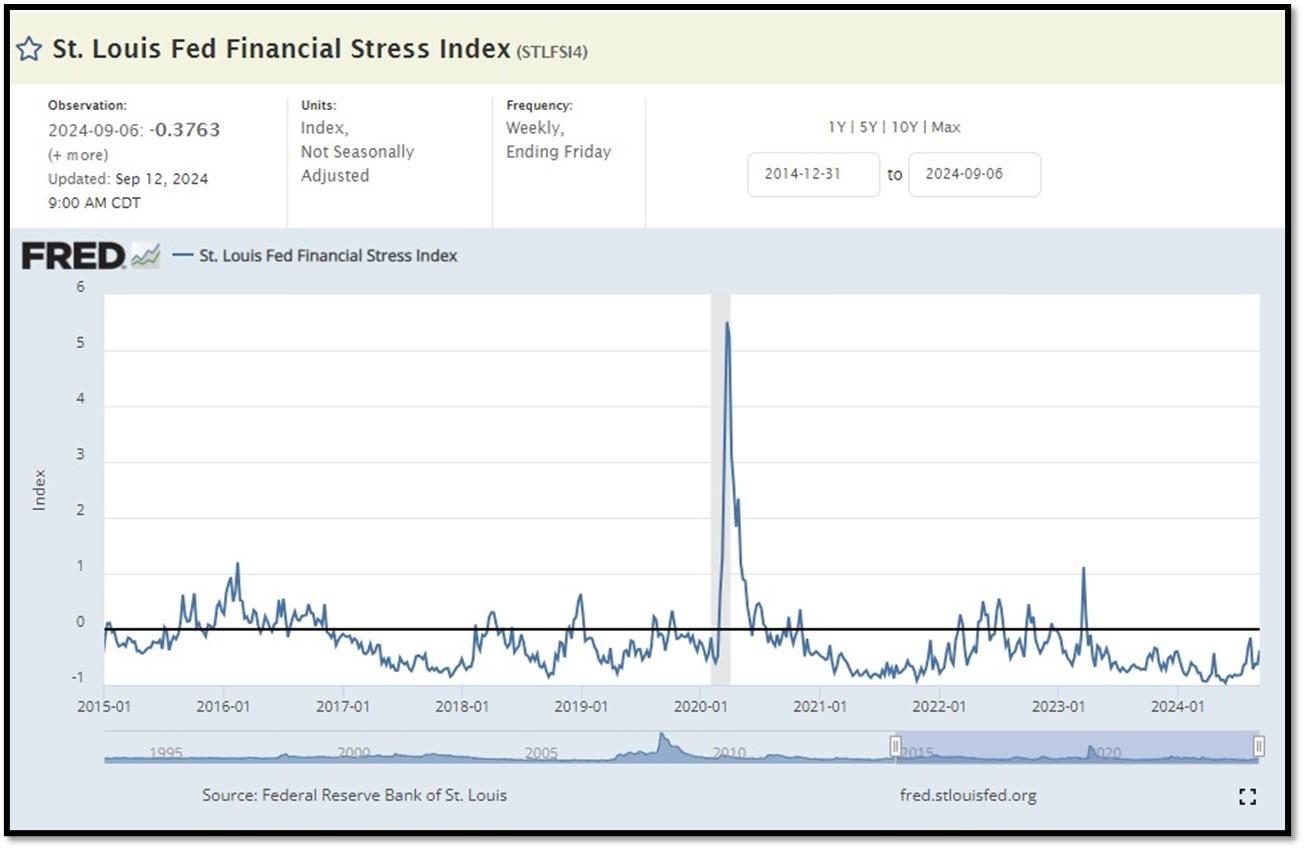
5B. St. Louis Fed Financial Stress Index’s (STLFSI4) most recent read is at –0.3763 as of September 12, 2024. A big spike up from previous readings reflecting the recent turmoil in the banking sector. Previous week’s data was -0.6258. This weekly index is not seasonally adjusted. The STLFSI4 measures the degree of financial stress in the markets and is constructed from 18 weekly data series: seven interest rate series, six yield spreads and five other indicators. Each of these variables captures some aspect of financial stress. Accordingly, as the level of financial stress in the economy changes, the data series are likely to move together. REF: St. Louis Fed
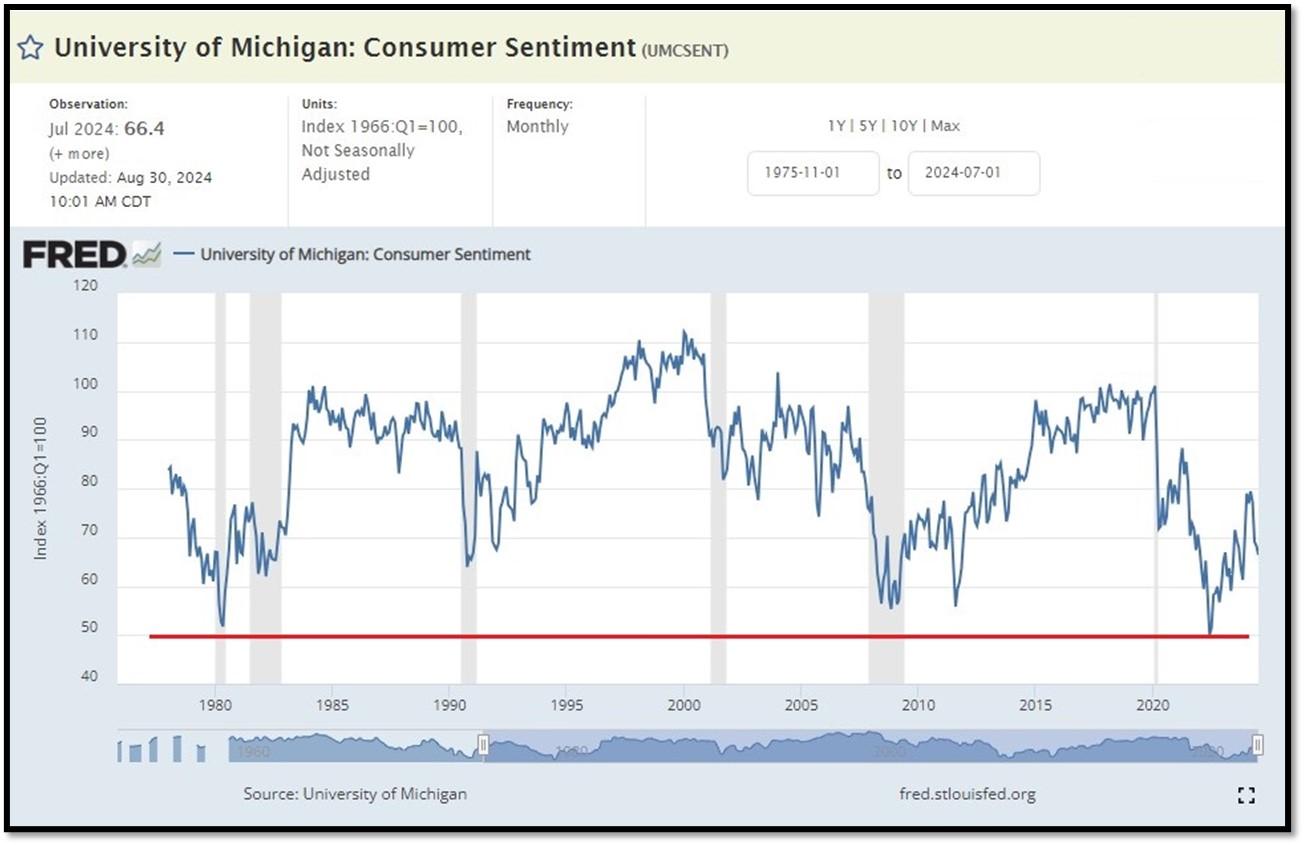
5C. University of Michigan, University of Michigan: Consumer Sentiment for June [UMCSENT] at 66.4 (last month’s data at 68.2), retrieved from FRED, Federal Reserve Bank of St. Louis, August 30, 2024. Back in June 2022, Consumer Sentiment hit a low point going back to April 1980. REF: UofM
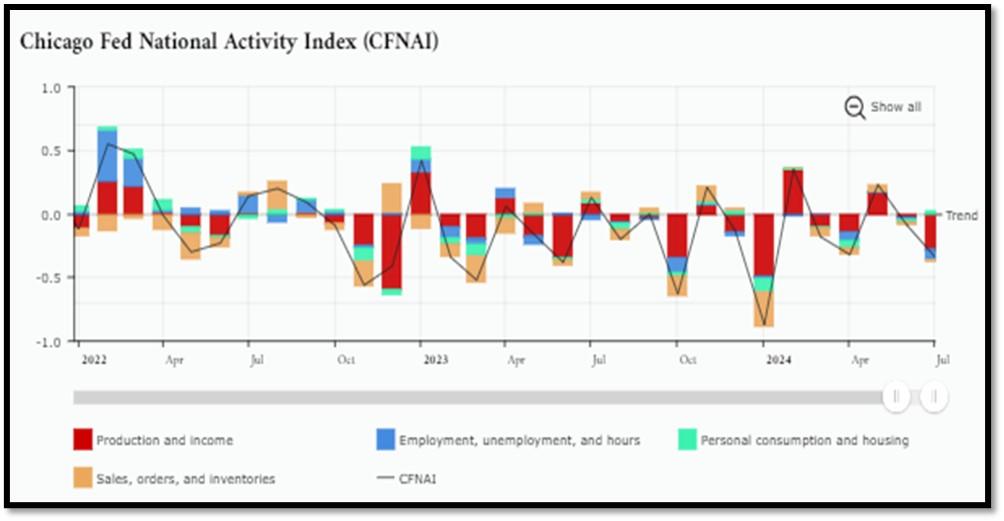
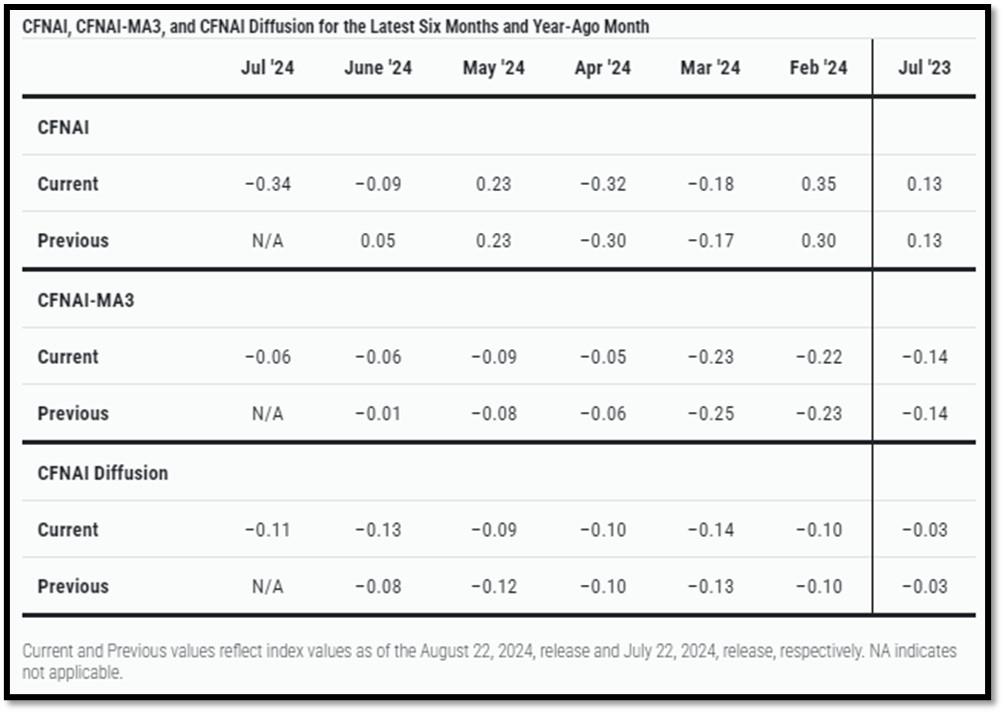
5D. The Chicago Fed National Activity Index (CFNAI) decreased to –0.34 in July from –0.09 in June. Two of the four broad categories of indicators used to construct the index decreased from June, and three categories made negative contributions in July. The index’s three-month moving average, CFNAI-MA3, was unchanged at –0.06 in July. REF: ChicagoFed, July’s Report
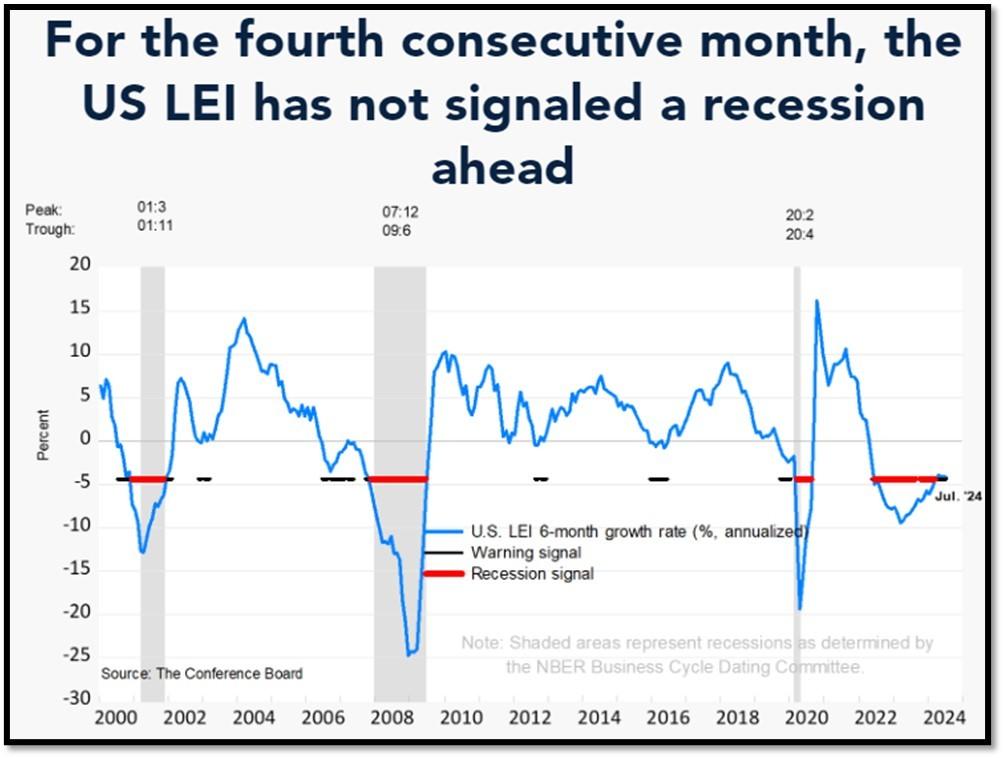
5E. (08/19/2024) The Conference Board Leading Economic Index (LEI) for the U.S. fell by 0.6 percent in July 2024 to 100.4 (2016=100), following a decline of 0.2 percent in June. Over the six-month period ending in July 2024, the LEI fell by 2.1 percent, a smaller rate of decline than its −3.1 percent over the six-month period between July 2023 and January 2024. The composite economic indexes are the key elements in an analytic system designed to signal peaks and troughs in the business cycle. The indexes are constructed to summarize and reveal common turning points in the economy in a clearer and more convincing manner than any individual component. The CEI is highly correlated with real GDP. The LEI is a predictive variable that anticipates (or “leads”) turning points in the business cycle by around 7 months. Shaded areas denote recession periods or economic contractions. The dates above the shaded areas show the chronology of peaks and troughs in the business cycle. The ten components of The Conference Board Leading Economic Index® for the U.S. include: Average weekly hours in manufacturing; Average weekly initial claims for unemployment insurance; Manufacturers’ new orders for consumer goods and materials; ISM® Index of New Orders; Manufacturers’ new orders for nondefense capital goods excluding aircraft orders; Building permits for new private housing units; S&P 500® Index of Stock Prices; Leading Credit Index™; Interest rate spread (10-year Treasury bonds less federal funds rate); Average consumer expectations for business conditions. REF: ConferenceBoard, LEI Report for July (Released on 8/30/2024)
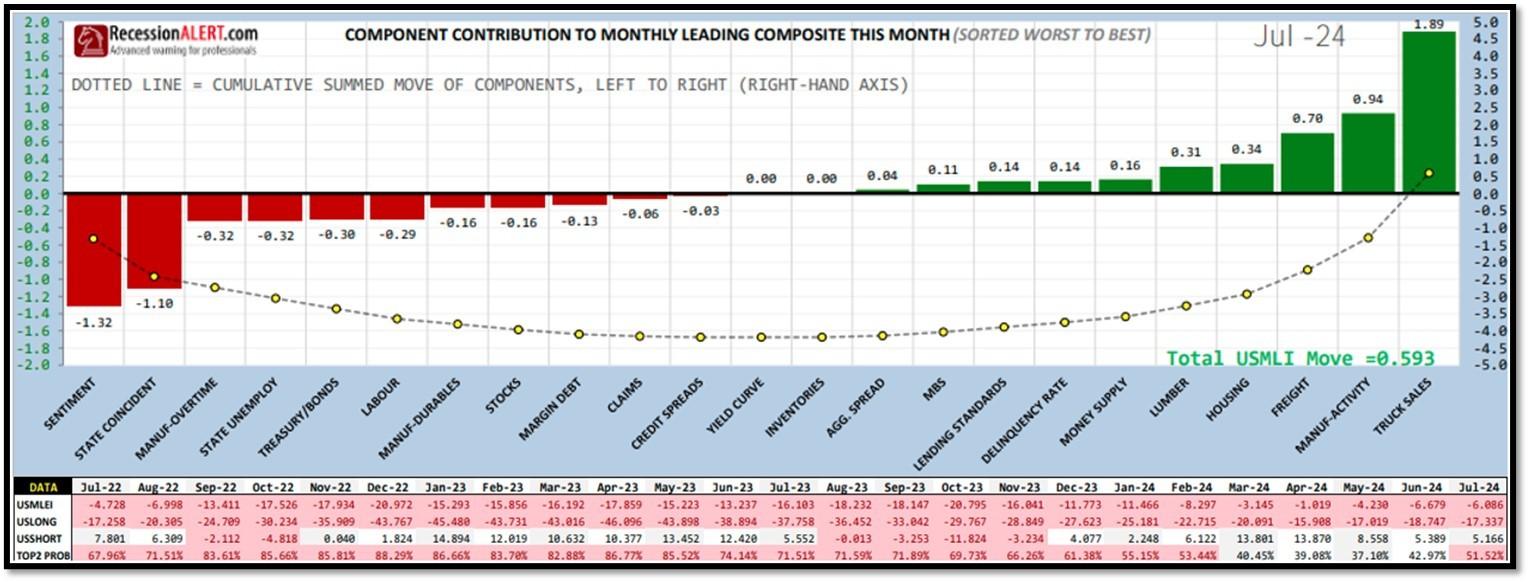
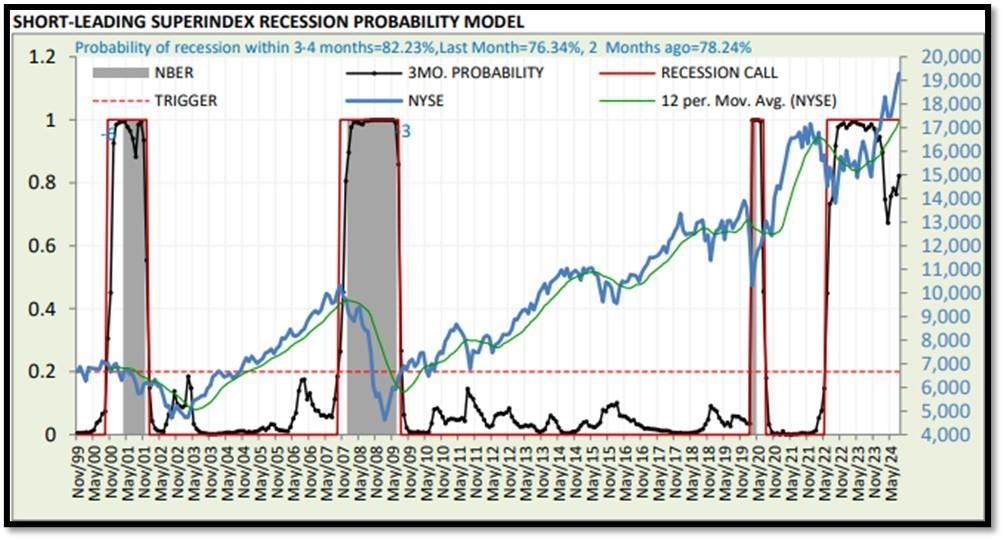
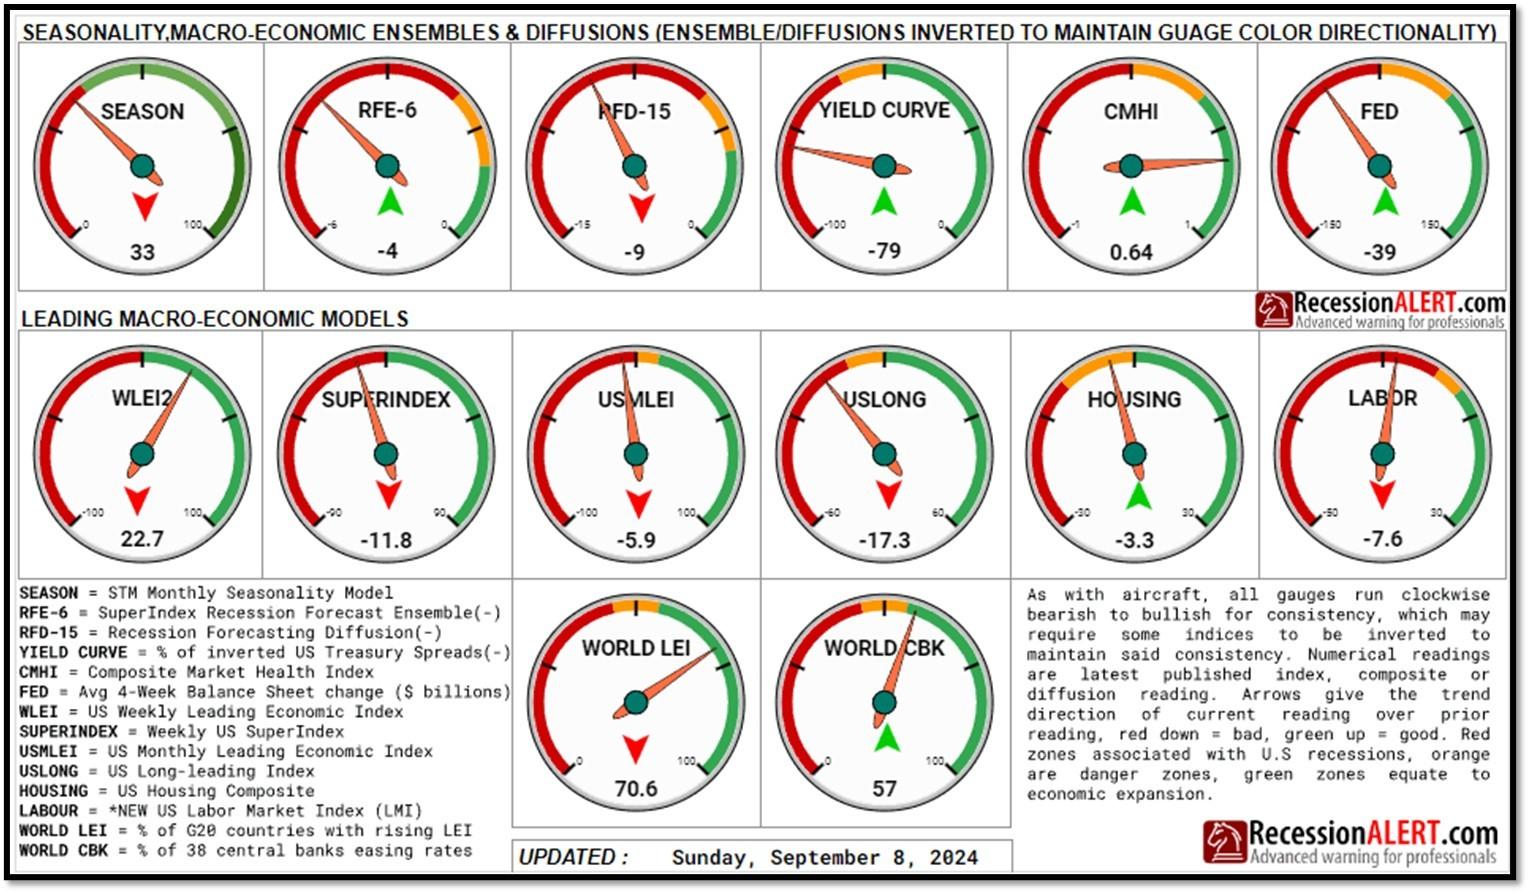
5F. Probability of U.S. falling into Recession within 3 to 4 months is currently at 82.23% (with data as of 09/09/2024 – Next Report 09/23/2024) according to RecessionAlert Research. Last release’s data was at 81.23%. This report is updated every two weeks. REF: RecessionAlertResearch, Guages
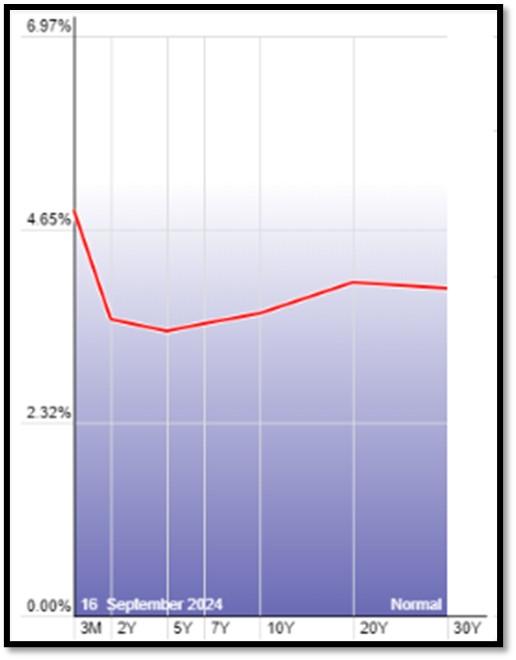
5G. Yield Curve as of 9/16/2024 is showing Inversion to Flattening. Spread on the 10-yr Treasury Yield (3.62%) minus yield on the 2-yr Treasury Yield (3.55%) is currently at 7 bps. REF: Stockcharts The yield curve—specifically, the spread between the interest rates on the ten-year Treasury note and the three-month Treasury bill—is a valuable forecasting tool. It is simple to use and significantly outperforms other financial and macroeconomic indicators in predicting recessions two to six quarters ahead. REF: NYFED
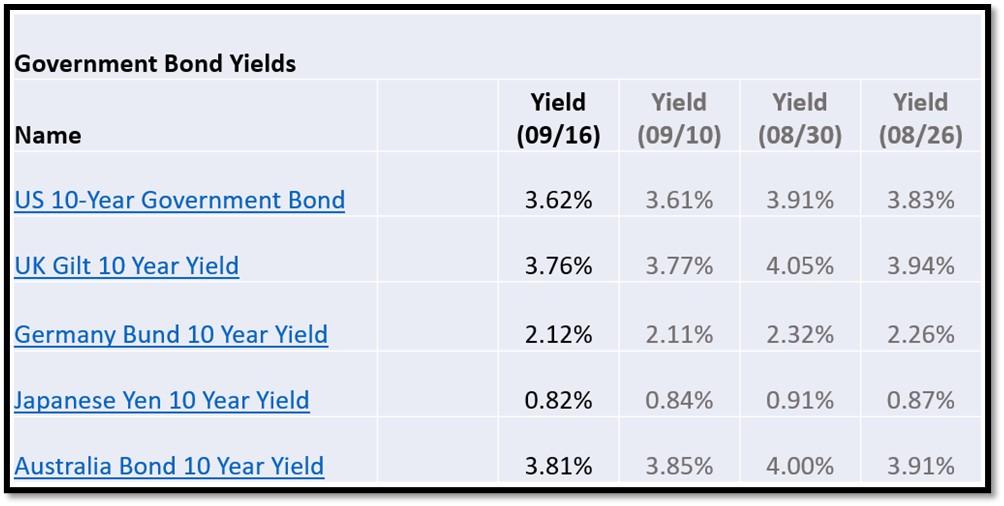
5H. Recent Yields in 10-Year Government Bonds. REF: Source is from Bloomberg.com, dated 9/16/2024, rates shown below are as of 9/16/2024, subject to change.
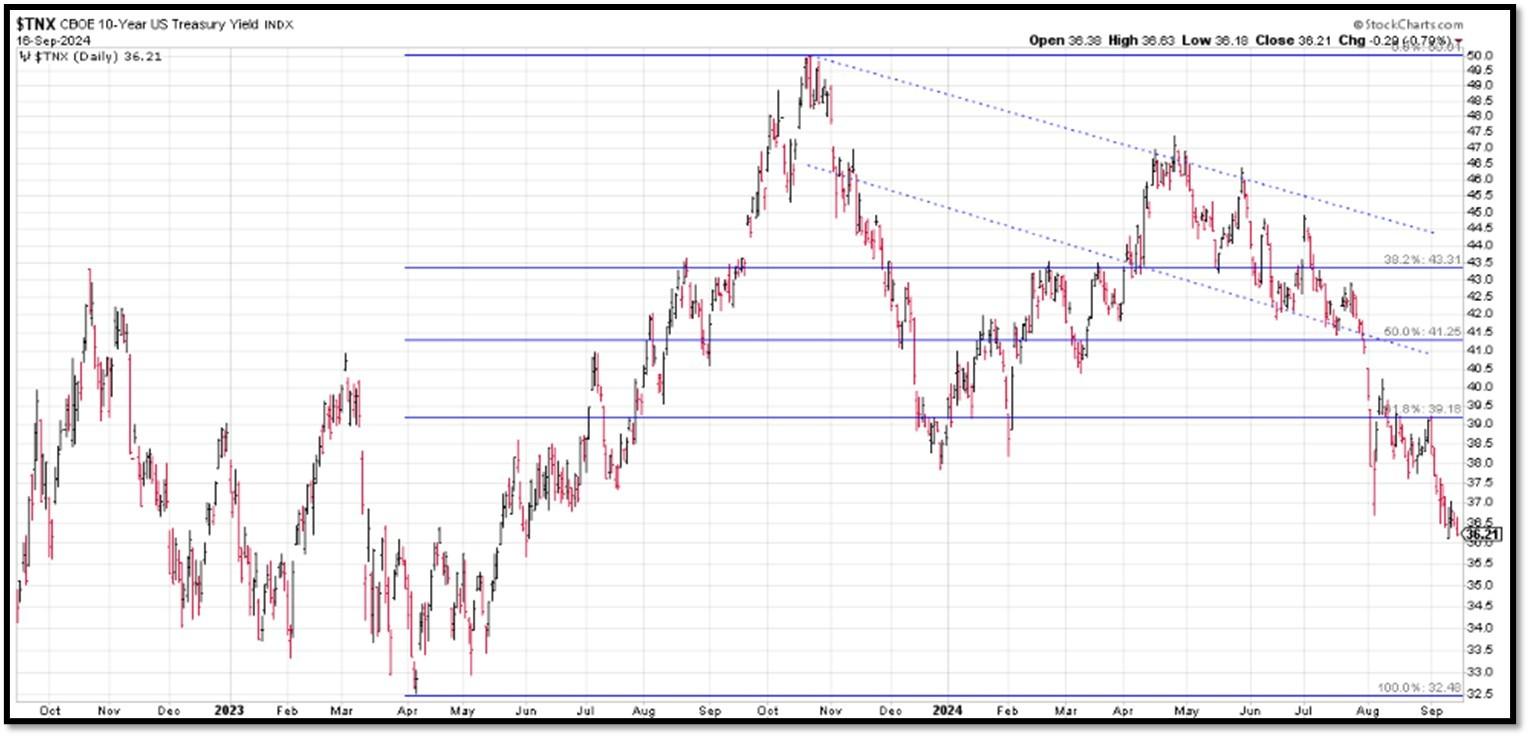
The 10-Year US Treasury Yield… REF: StockCharts1, StockCharts2
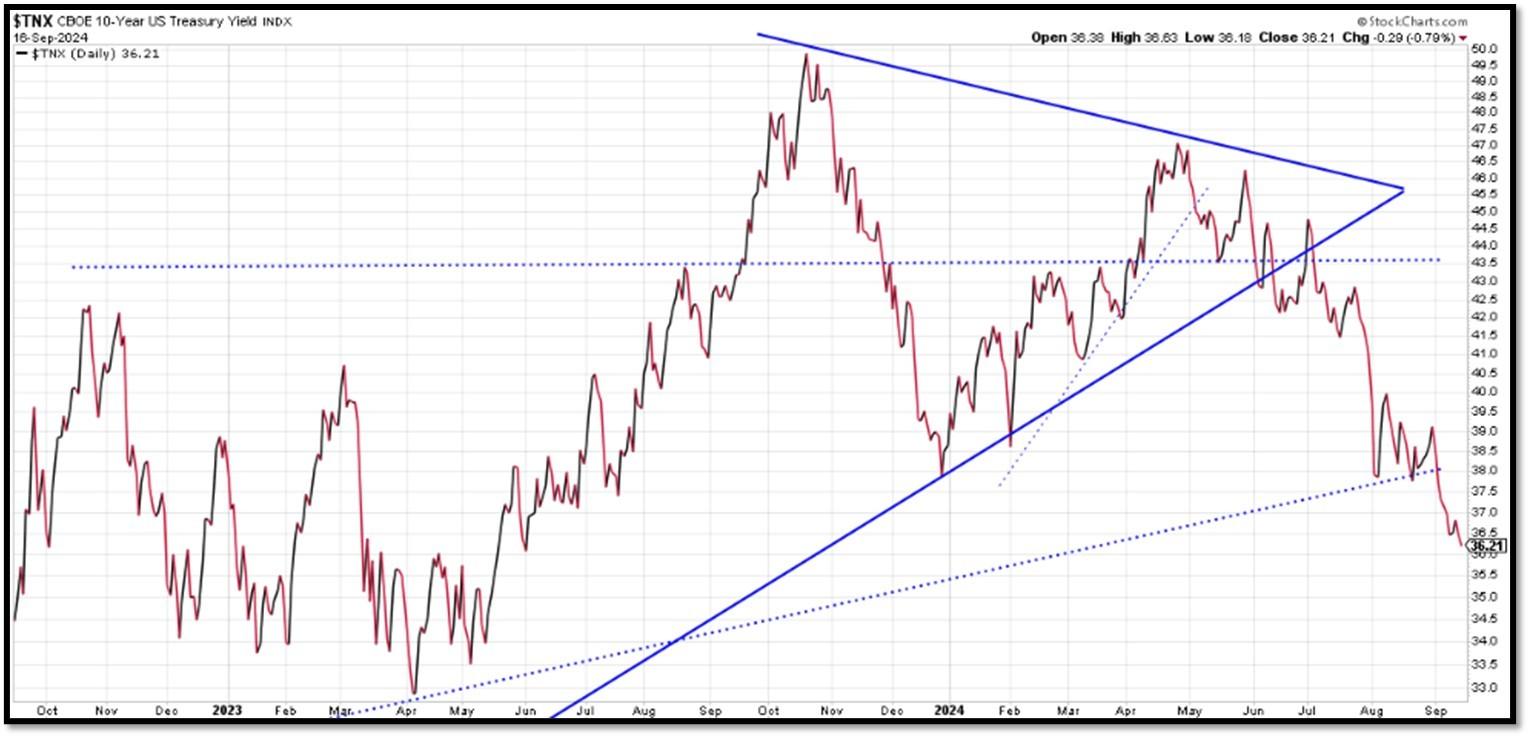
The 10-year yield – Headed lower…
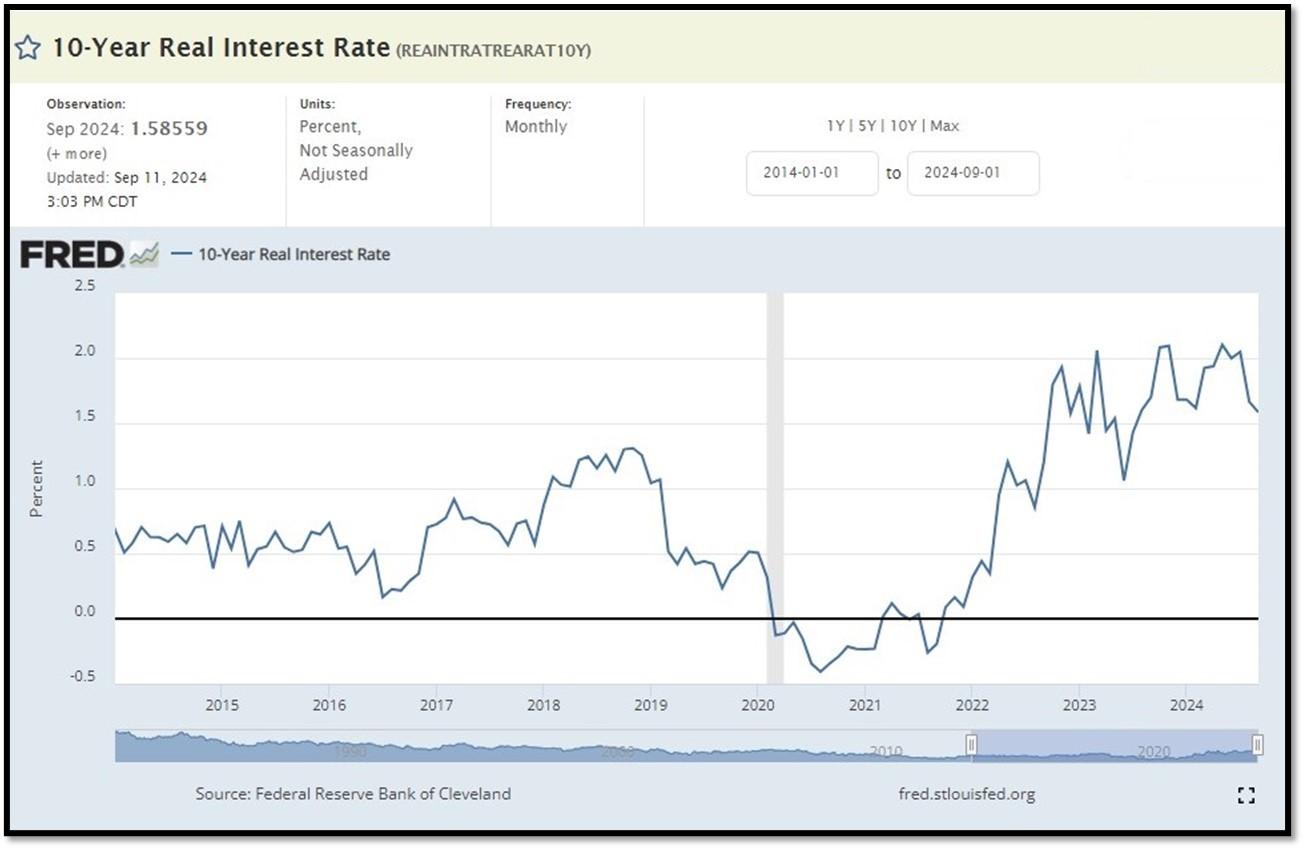
10-Year Real Interest Rate at 1.85% as of 9/11/24. It continues to climb even when Fed stopped raising interest rates. REF: REAINTRATREARAT10Y
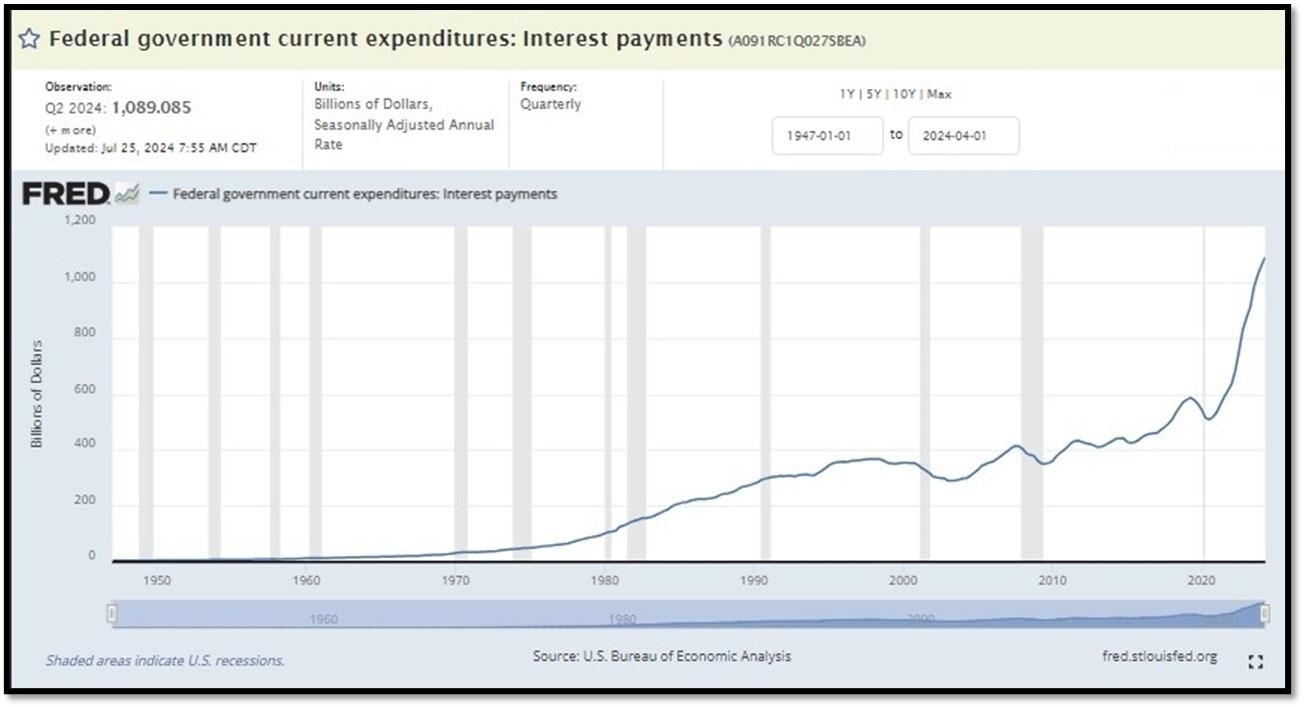
Federal government Interest Payments increased $30B to $1.089 T as of Q2-2024. REF: FRED-A091RC1Q027SBEA
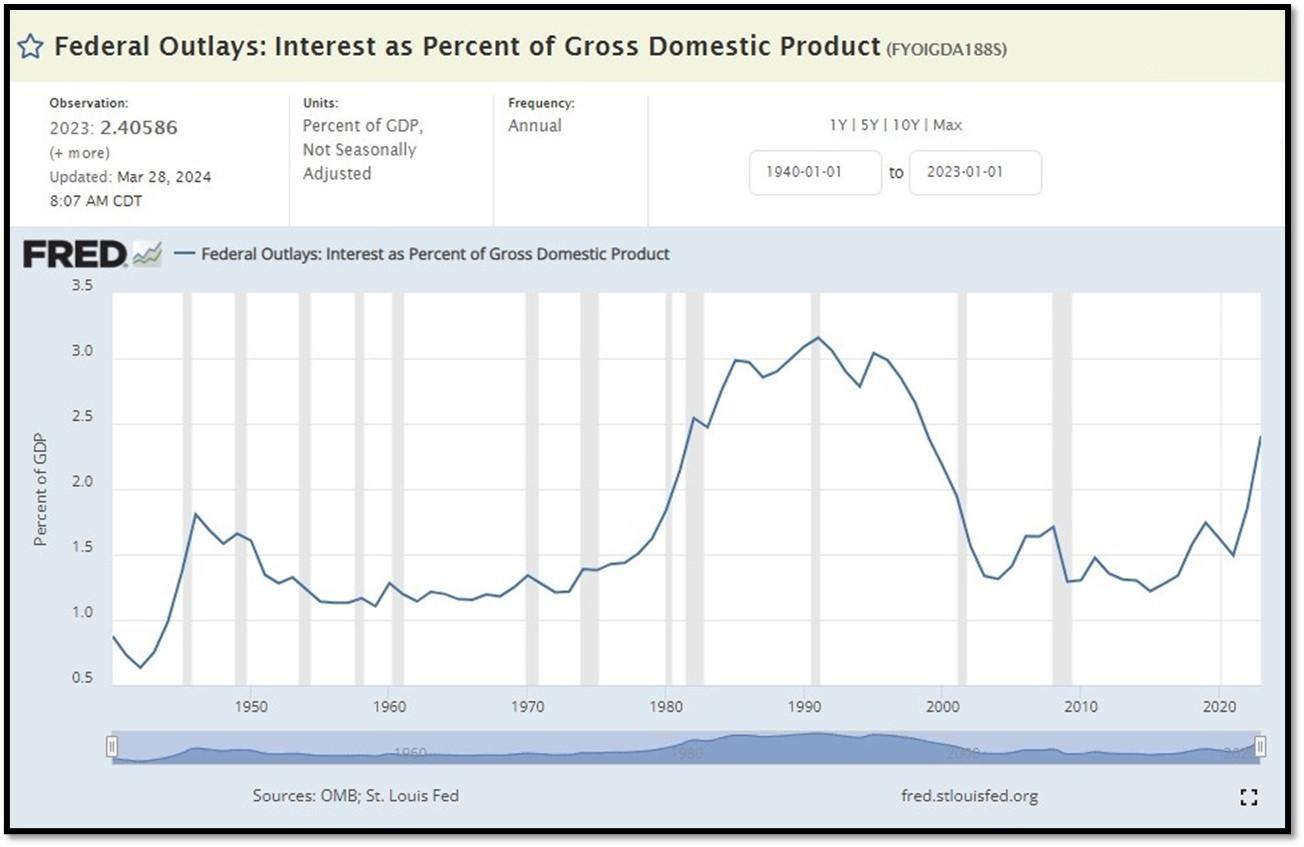
Interest payments as a percentage of GDP increased from 1.84853 in 2022 to 2.40586 as of 3/28/24. REF: FRED-FYOIGDA188S
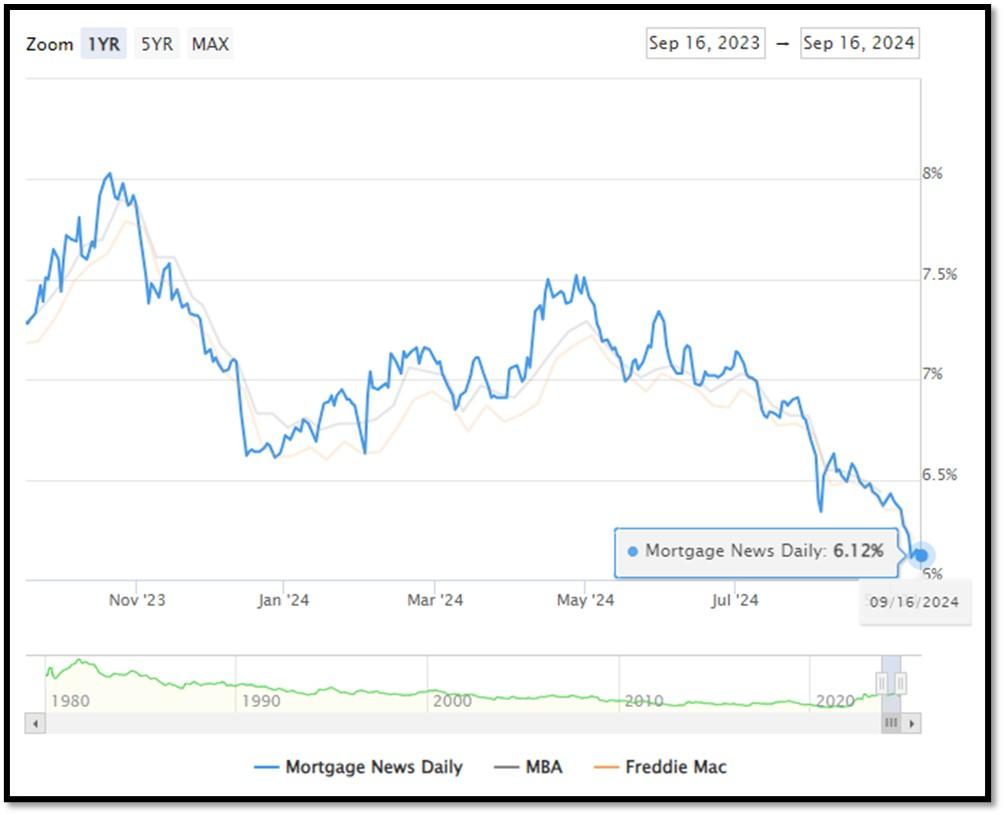
5I. (09/16/2024) Today’s National Average 30-Year Fixed Mortgage Rate is 6.12% (All Time High was 8.03% on 10/19/23). Last week’s data was 6.25%. This rate is the average 30-year fixed mortgage rates from several different surveys including Mortgage News Daily (daily index), Freddie Mac (weekly survey), Mortgage Bankers Association (weekly survey) and FHFA (monthly survey). REF: MortgageNewsDaily, Today’s Average Rate
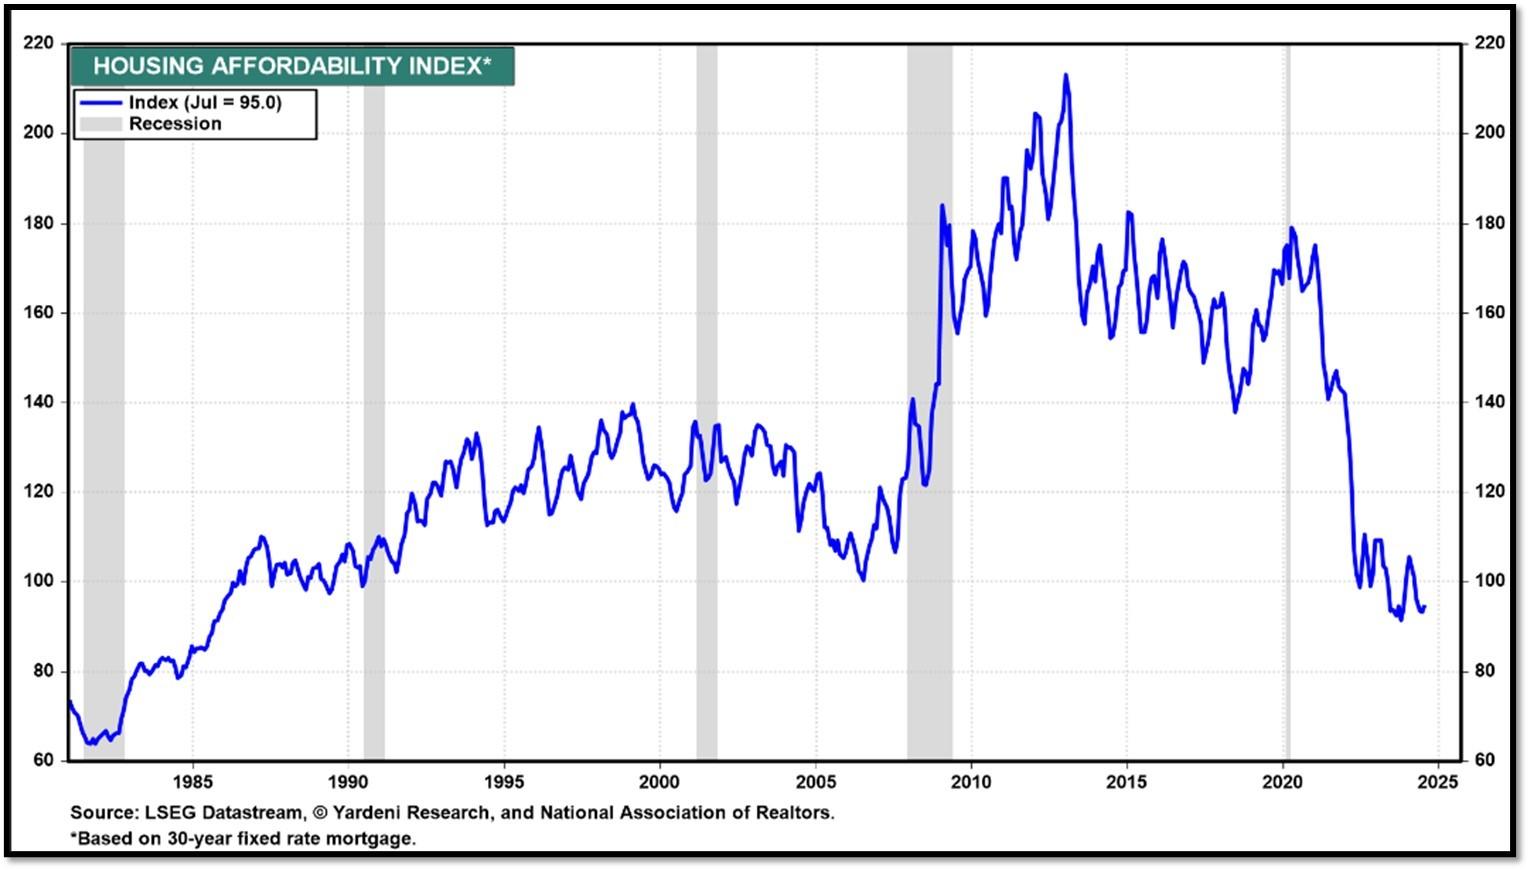
(09/16/24) Housing Affordability Index for July = 95 // June = 93.3 // May = 93.1 // April = 95.9 // March = 101.1 // February = 103.0. Data provided by Yardeni Research. REF: Yardeni
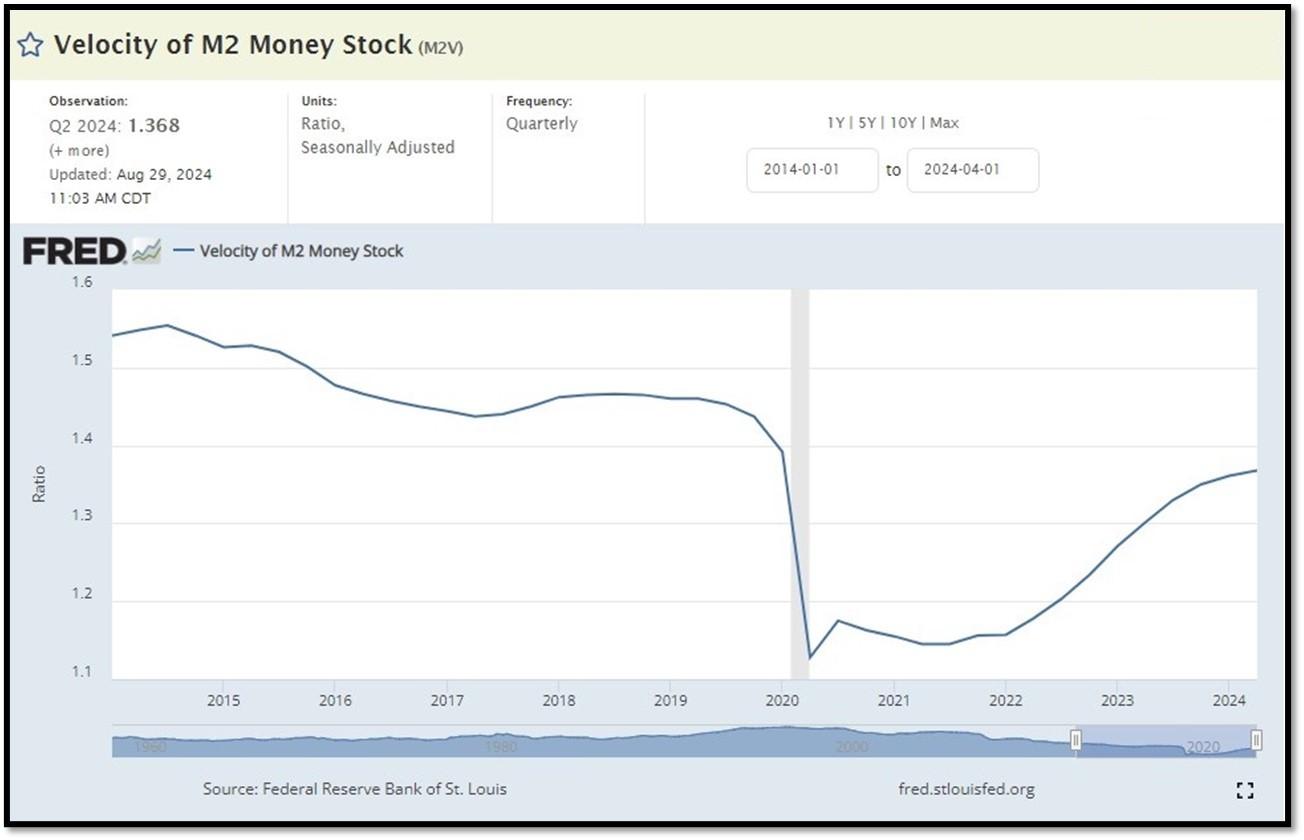
5J. Velocity of M2 Money Stock (M2V) with current read at 1.368 as of (Q2-2024 updated 8/29/2024). Previous quarter’s data was 1.367. The velocity of money is the frequency at which one unit of currency is used to purchase domestically- produced goods and services within a given time period. In other words, it is the number of times one dollar is spent to buy goods and services per unit of time. If the velocity of money is increasing, then more transactions are occurring between individuals in an economy. Current Money Stock (M2) report can be viewed in the reference link. REF: St.LouisFed-M2V
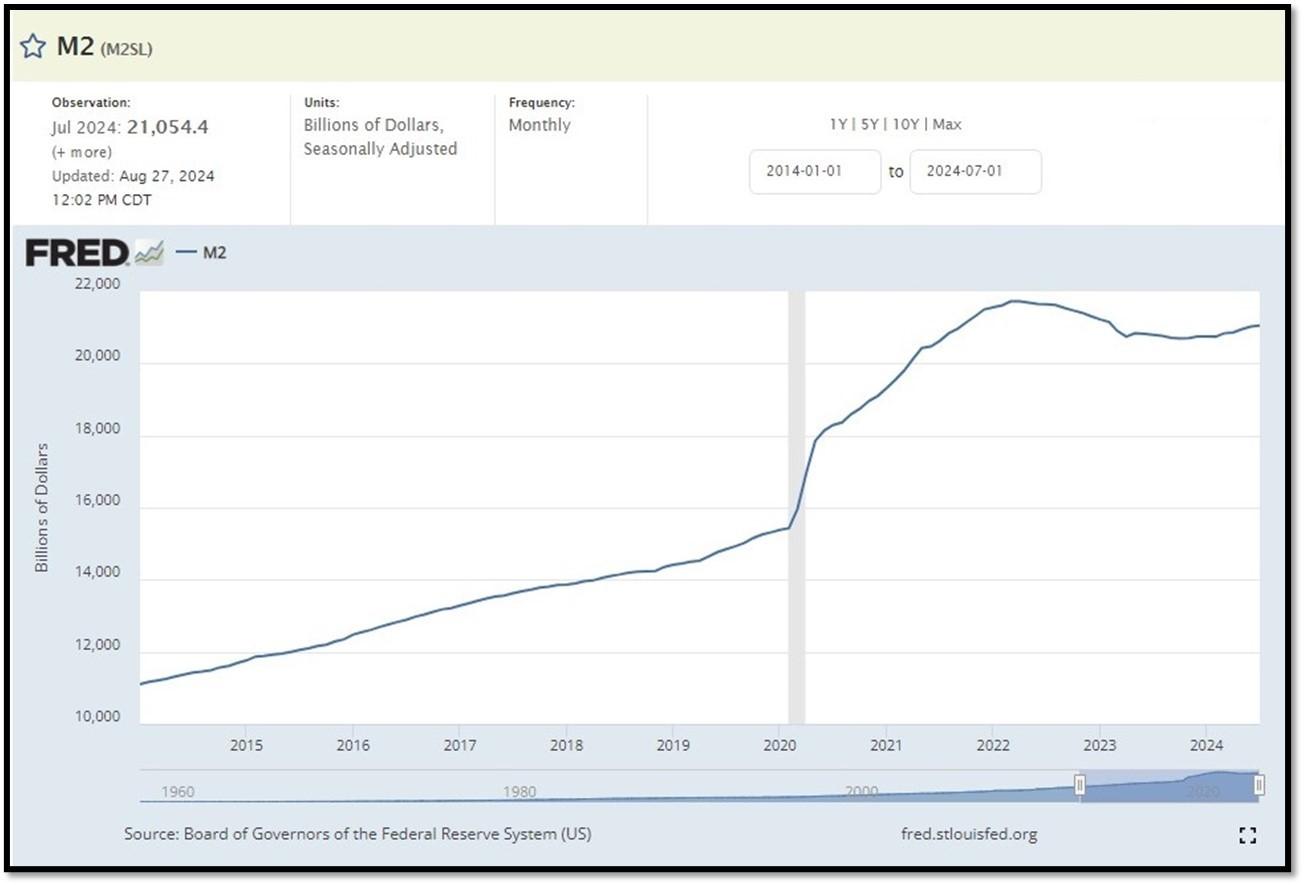
M2 consists of M1 plus (1) small-denomination time deposits (time deposits in amounts of less than $100,000) less IRA and Keogh balances at depository institutions; and (2) balances in retail MMFs less IRA and Keogh balances at MMFs. Seasonally adjusted M2 is constructed by summing savings deposits (before May 2020), small-denomination time deposits, and retail MMFs, each seasonally adjusted separately, and adding this result to seasonally adjusted M1. Board of Governors of the Federal Reserve System (US), M2 [M2SL], retrieved from FRED, Federal Reserve Bank of St. Louis; Updated on August 27, 2024. REF: St.LouisFed-M2
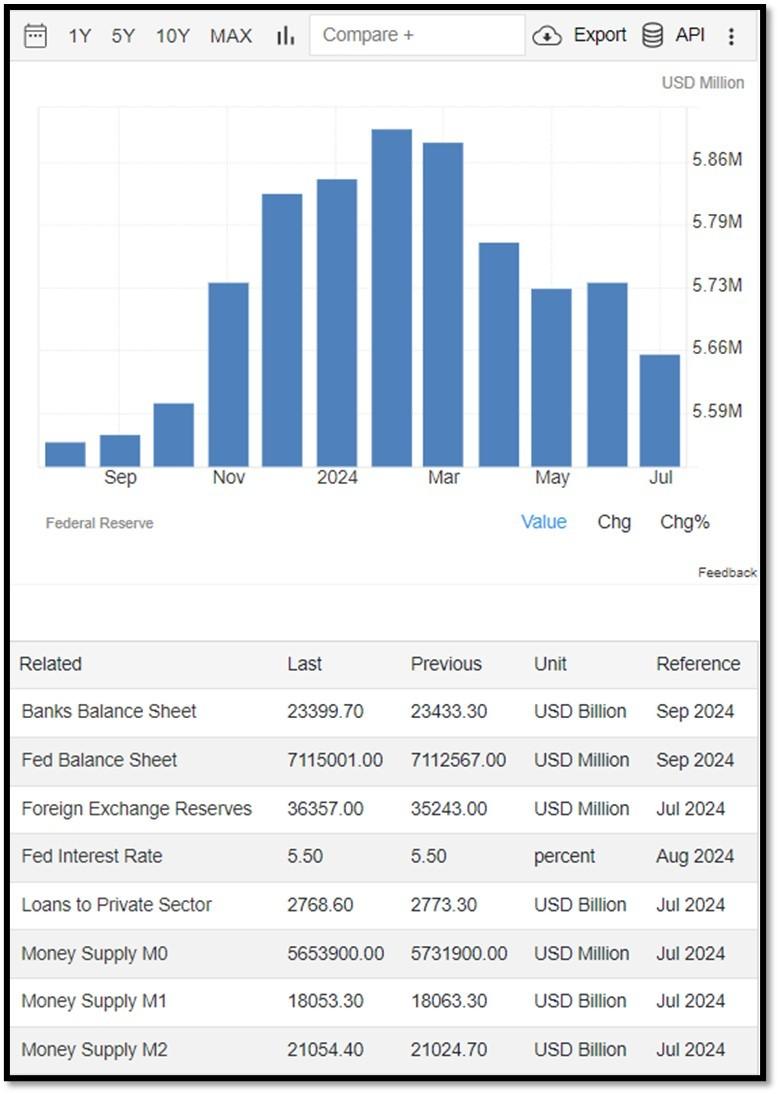
Money Supply M0 in the United States decreased to 5,653,900 USD Million in July from 5,731,900 USD Million in June of 2024. Money Supply M0 in the United States averaged 1138055.78 USD Million from 1959 until 2024, reaching an all-time high of 6,413,100.00 USD Million in December of 2021 and a record low of 48,400.00 USD Million in February of 1961. REF: TradingEconomics, M0
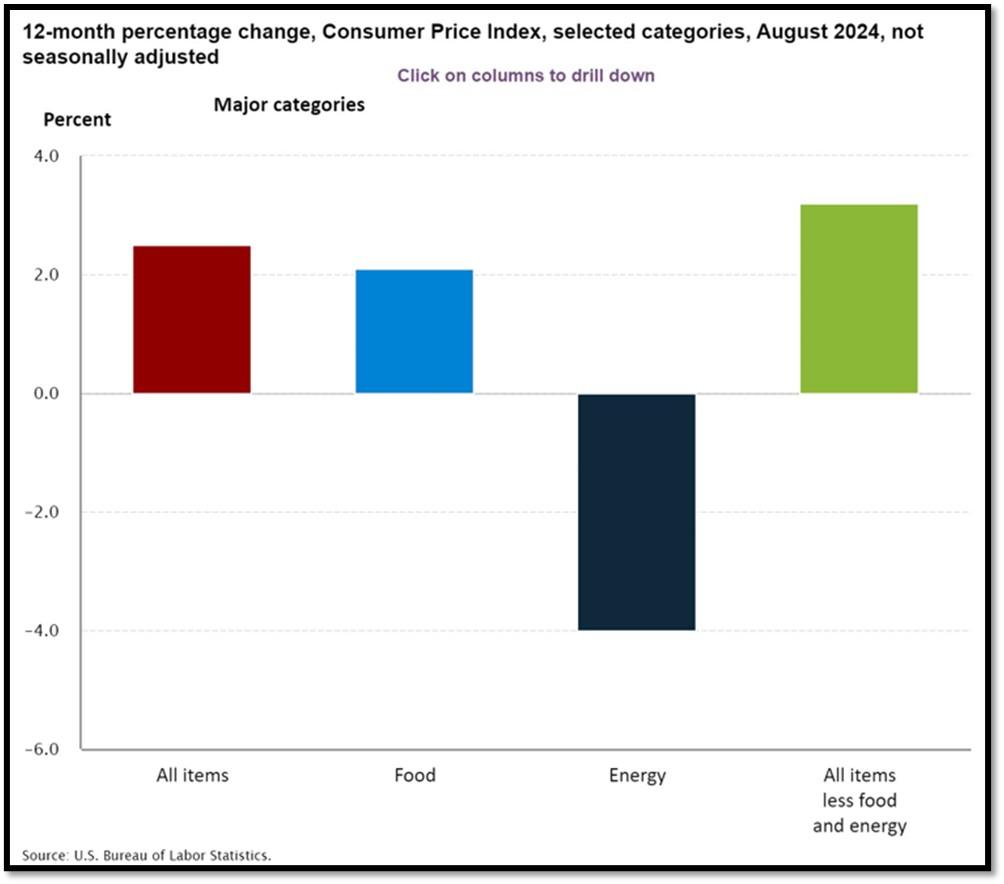
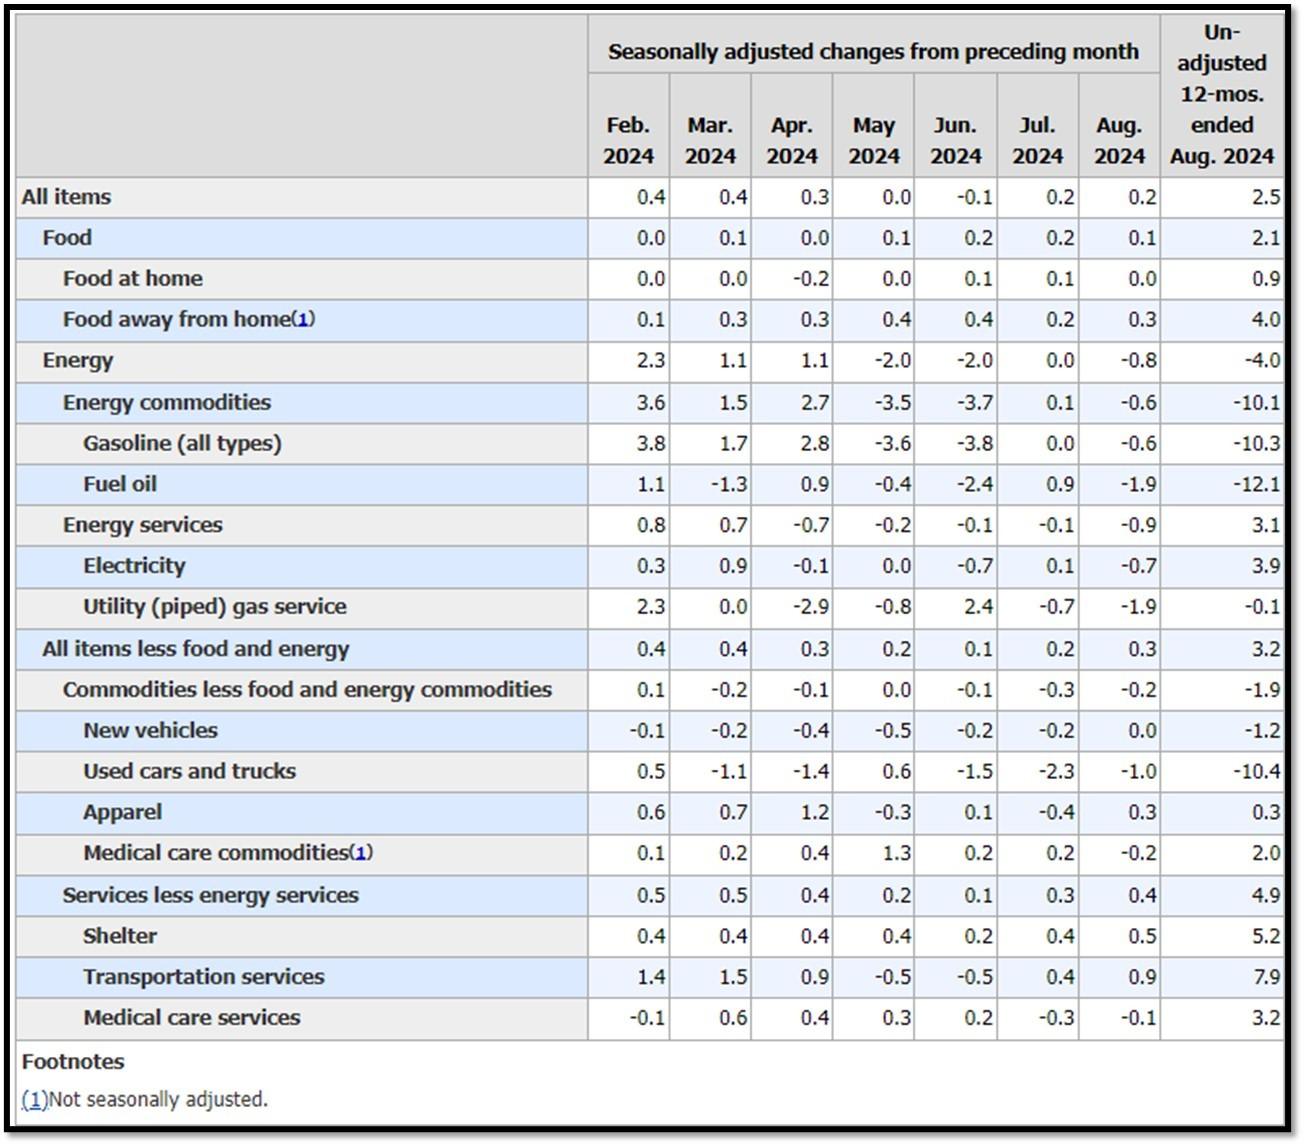
5K. In August, the Consumer Price Index for All Urban Consumers rose 0.2 percent, seasonally adjusted, and rose 2.5 percent over the last 12 months, not seasonally adjusted. The index for all items less food and energy increased 0.3 percent in August (SA); up 3.2 percent over the year (NSA). September 2024 CPI data are scheduled to be released on October 10, 2024, at 8:30AM-ET. REF: BLS, BLS.GOV
5L. Technical Analysis of the S&P500 Index. Click onto reference links below for images.
- Short-term Chart: Bottoming on 9/16/2024 – REF: Short-term S&P500 Chart by Marc Slavin (Click Here to Access Chart)
- Medium-term Chart: Bullish on 9/16/2024 – REF: Medium-term S&P500 Chart by Marc Slavin (Click Here to Access Chart)
- Market Timing Indicators – S&P500 Index as of 9/16/2024 – REF: S&P500 Charts (7 of them) by Joanne Klein’s Top 7 (Click Here to Access Updated Charts)
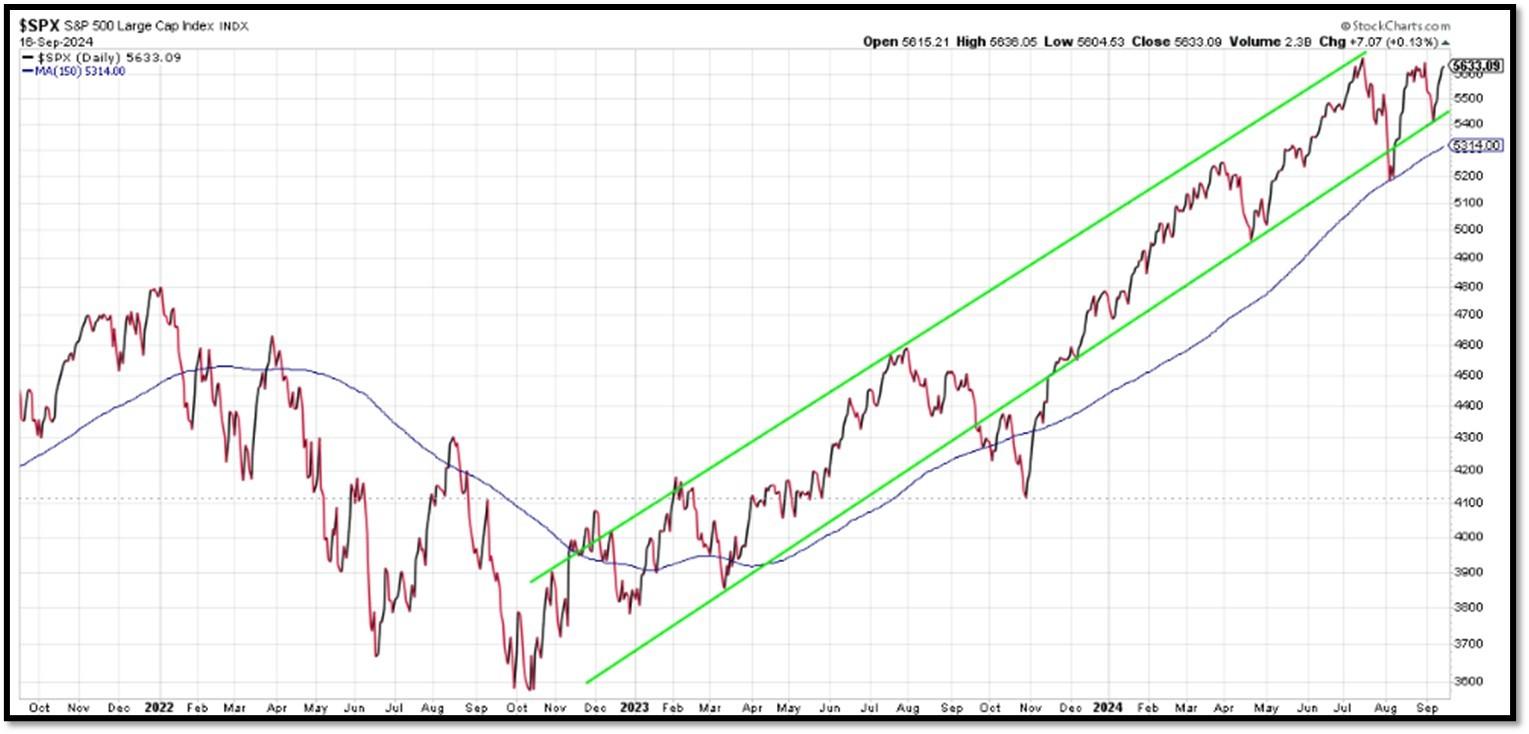
- A well-defined uptrend channel shown in green with S&P500 getting back on trend. REF: Stockcharts
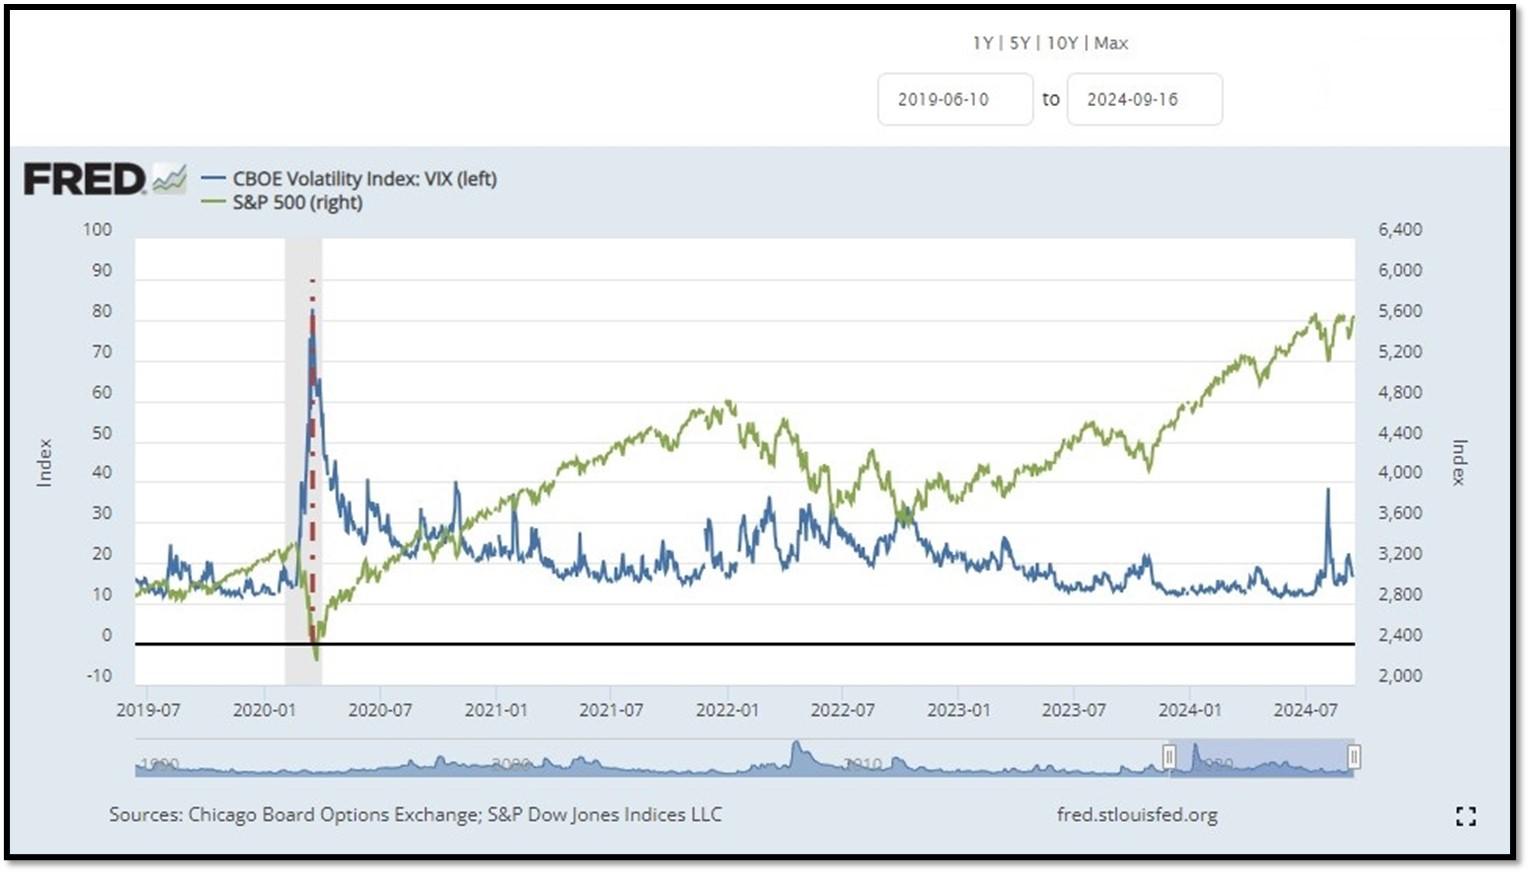
- S&P500 and CBOE Volatility Index (VIX) as of 9/16/2024. REF: FRED, Today’s Print
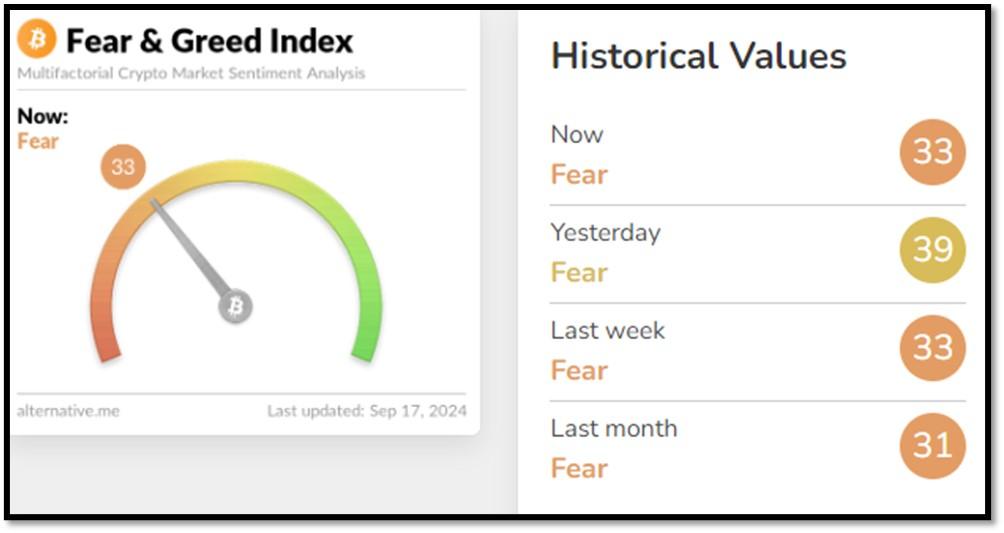
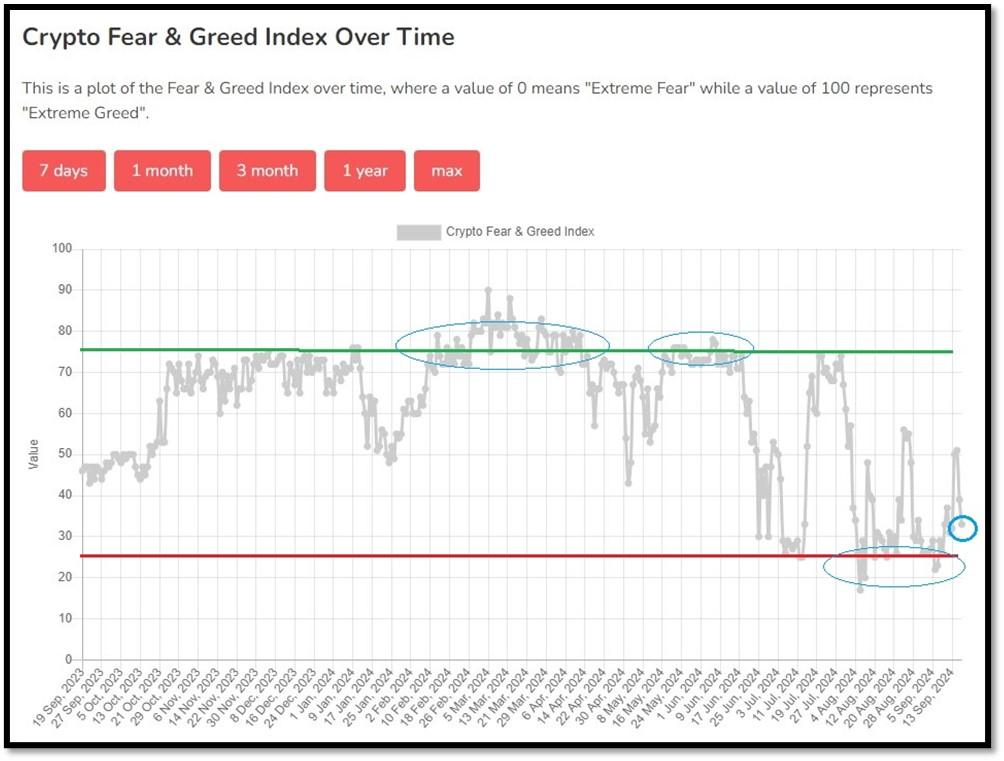
5M. Most recent read on the Crypto Fear & Greed Index with data as of 9/17/2024au is 33 (Fear). Last week’s data was 33 (Fear) (1-100). Fear & Greed Index – A Contrarian Data. The crypto market behavior is very emotional. People tend to get greedy when the market is rising which results in FOMO (Fear of missing out). Also, people often sell their coins in irrational reaction of seeing red numbers. With the Crypto Fear and Greed Index, the data try to help save investors from their own emotional overreactions. There are two simple assumptions:
- Extreme fear can be a sign that investors are too worried. That could be a buying opportunity.
- When Investors are getting too greedy, that means the market is due for a correction.
Therefore, the program for this index analyzes the current sentiment of the Bitcoin market and crunch the numbers into a simple meter from 0 to 100. Zero means “Extreme Fear”, while 100 means “Extreme Greed”. REF: Alternative.me, Today’sReading
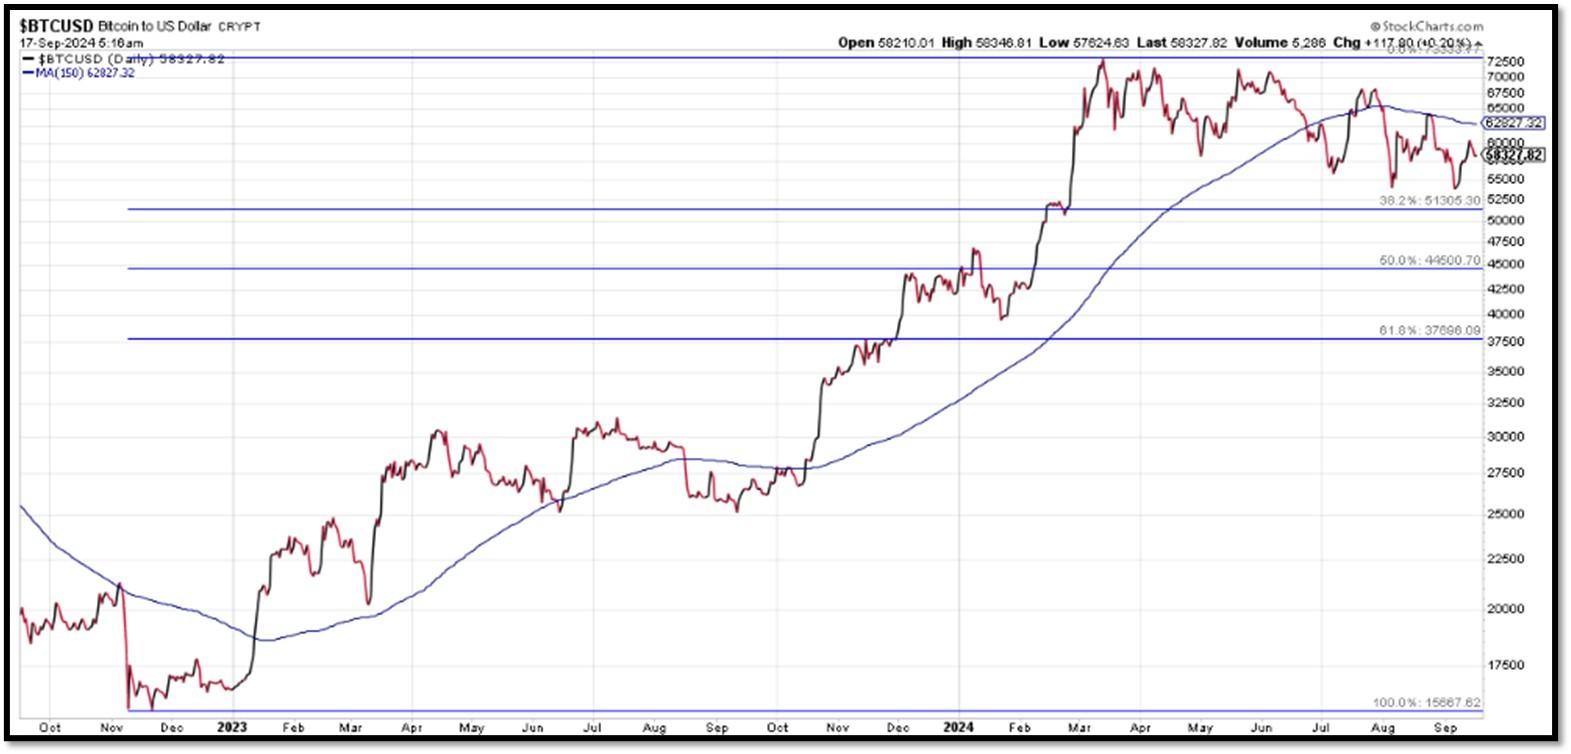
Bitcoin currently below the 150-day moving average. REF: Stockcharts
From the desk of our Chief Investment Officer
As an investment professional with over twenty-six years of experience in the financial services industry, Andrew helps clients to protect, grow and transfer wealth during their lifetime with objective, unbiased, customized and efficient strategies.
Education, Professional Licenses Acquired & Affiliations
- Series 7, 63, 65 and 24 Licensed.
- Currently holding Series 65 License registered with SEC
- BA in Economics – Boston University (Boston, MA) 1993
- Certificate in Commodities Trading – New York University (New York, NY) 1991
- Certificate in Financial Planning – New York University (New York, NY) April 2011
With extensive experience in the Financial Services Industry, Andrew Tang and Turner Financial Group provides disciplined wealth management with an intelligent caring approach to each and every client that compliments the Dedicated Financial offering.


Len writes much of his own content, and also shares helpful content from other trusted providers like Turner Financial Group (TFG).
The material contained herein is intended as a general market commentary, solely for informational purposes and is not intended to make an offer or solicitation for the sale or purchase of any securities. Such views are subject to change at any time without notice due to changes in market or economic conditions and may not necessarily come to pass. This information is not intended as a specific offer of investment services by Dedicated Financial and Turner Financial Group, Inc.
Dedicated Financial and Turner Financial Group, Inc., do not provide tax, legal or accounting advice. You should consult your own tax, legal and accounting advisors before engaging in any transaction.
Any hyperlinks in this document that connect to Web Sites maintained by third parties are provided for convenience only. Turner Financial Group, Inc. has not verified the accuracy of any information contained within the links and the provision of such links does not constitute a recommendation or endorsement of the company or the content by Dedicated Financial or Turner Financial Group, Inc. The prices/quotes/statistics referenced herein have been obtained from sources verified to be reliable for their accuracy or completeness and may be subject to change.
Past performance is no guarantee of future returns. Investing involves risk and possible loss of principal capital. The views and strategies described herein may not be suitable for all investors. To the extent referenced herein, real estate, hedge funds, and other private investments can present significant risks, including loss of the original amount invested. All indexes are unmanaged, and an individual cannot invest directly in an index. Index returns do not include fees or expenses.
Turner Financial Group, Inc. is an Investment Adviser registered with the United States Securities and Exchange Commission however, such registration does not imply a certain level of skill or training and no inference to the contrary should be made. Additional information about Turner Financial Group, Inc. is also available at www.adviserinfo.sec.gov. Advisory services are only offered to clients or prospective clients where Turner Financial Group, Inc. and its representatives are properly licensed or exempt from licensure. No advice may be rendered by Turner Financial Group, Inc. unless a client service agreement is in place.


