
- 1. The ISM Manufacturing Index for March 2025 dipped to 49%, down from 49.8% in February and below January’s 50.3%, indicating a contraction in manufacturing after two months of slight growth.
- 2. AI apps are software that harness artificial intelligence — like machine learning or natural language processing — to handle tasks needing requiring human-like smarts intelligence.
- 3. Trump’s announcement of a 25% tariff on all autos not made in the U.S. shook things up, and the stock drops for GM, Ford, and Stellantis reflect that.
- 4. World Watch
- 4A. The First Generation of Genuine Intelligence, IntuiCell, a Swedish AI startup emerging from Lund University in 2020, represents a pioneering effort to redefine how machines learn by introducing what it calls the first software enabling devices to emulate human and animal learning processes.
- 4B. Russia’s economy has shown surprising resilience despite enduring extensive Western sanctions following its 2014 annexation of Crimea and the 2022 full-scale invasion of Ukraine.
- 4C. Below is an updated snapshot of the current global state of economy according to TradingEconomics as of 3/31/2025. REF: TradingEconomics
- 5. Quant & Technical Corner
1. The ISM Manufacturing Index for March 2025 dipped to 49%, down from 49.8% in February and below January’s 50.3%, indicating a contraction in manufacturing after two months of slight growth.
The employment sub-index fell sharply to 44.7 from 47.6, pointing to increased layoffs amid rising uncertainty. Anxiety is high as ongoing tariff debates intensify, with the Trump administration’s “Liberation Day” on Wednesday, April 2, set to launch new tariffs. Markets are bracing for China’s reaction, which could involve countermeasures heightening trade friction. Investors are closely watching upcoming jobless claims, payroll numbers, and ISM Services data to gauge whether this slowdown will worsen or stabilize, as concerns mount over tariff-driven cost increases and softening demand challenging economic momentum.
According to Dean Smith of FolioBeyond, the economic buzzword “stagflation”—a mix of stagnation and inflation—is resurfacing, echoing the 1970s when persistent inflation coincided with economic slowdown, a scenario once thought impossible. Inflation, fueled by Covid-era federal spending and monetary policy errors, remains sticky above the Fed’s 2% target, while labor markets and spending weaken, dimming hopes for a soft landing. The University of Michigan’s 5-year inflation expectation recently hit 3.9%, the highest since 1993, signaling growing stagflation concerns. FolioBeyond warns that this could lead to a prolonged, if milder, stagflationary period, urging investors to cut volatility exposure and shorten fixed income duration rather than betting on risky market moves. REF: DeanSmith, DailyShot
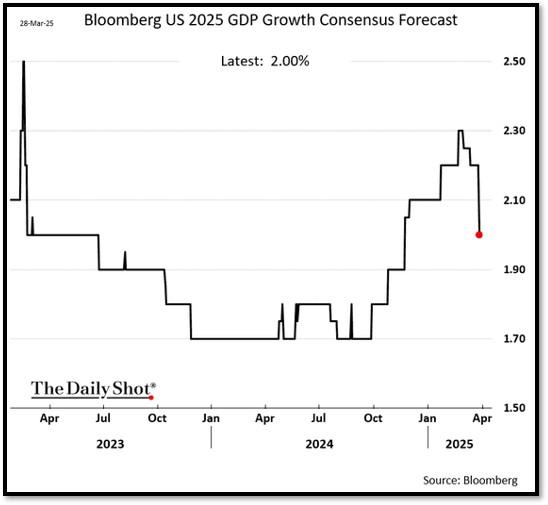
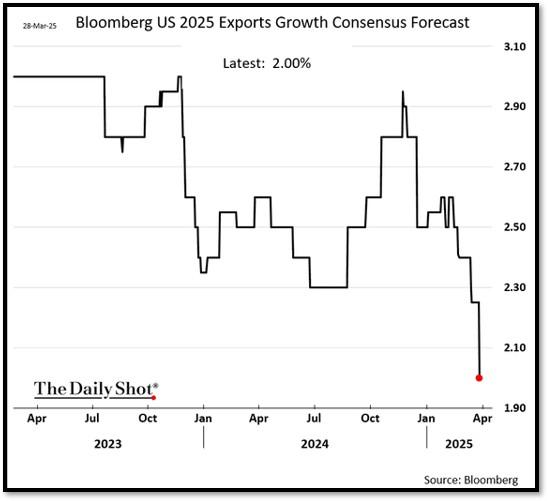
Economists have lowered their 2025 US growth forecast and cutting estimates for export growth.
2. AI apps are software that harness artificial intelligence — like machine learning or natural language processing — to handle tasks needing requiring human-like smarts intelligence.
Examples include ChatGPT for text generation, Grammarly for writing help assistance, or Google Photos for image sorting. They’re built into phones, wearables, or assistants, boosting productivity, fun entertainment, or analytics by quickly processing data and adapting to users, often via cloud models or on-device tech for speed and privacy. Early in the AI race, apps like Perplexity, Cursor, Sesame**,** and Abridge were known pejoratively as “wrappers,” describing the way their either app or business was wrapped around a term reflecting how they built their apps or businesses atop existing AI models.
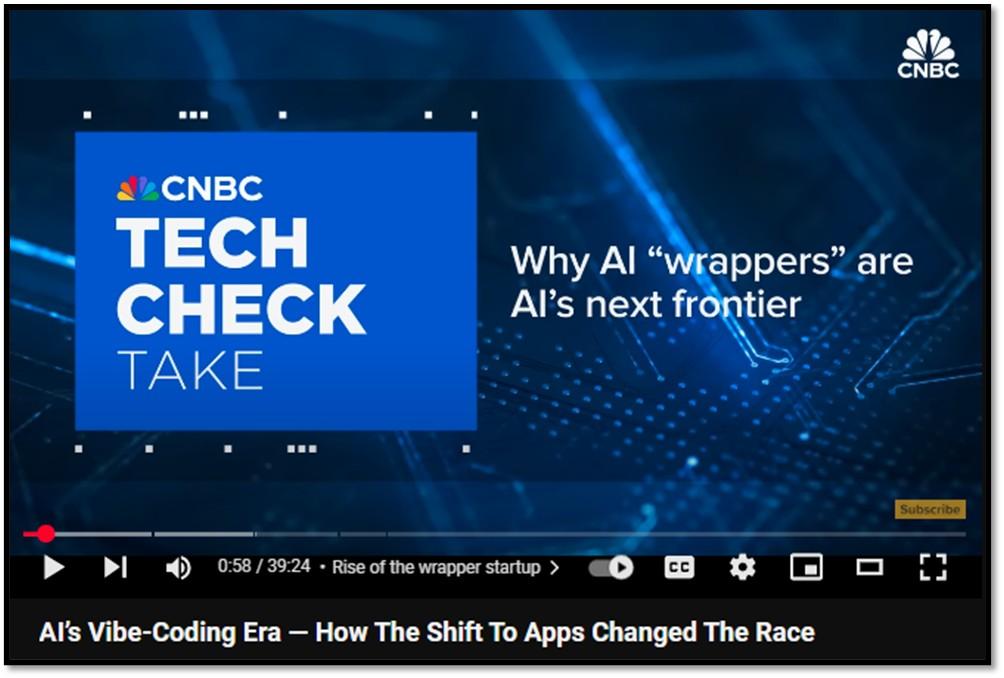
An “AI wrapper” is a software layer that packages an existing AI model, making it easier to use or adding features without altering the core. It’s like Slack wrapping GPT into its chatbot or a fitness app embedding a sleep-analysis AI. Wrappers don’t build new AI; they refine it for better interfaces or integration, driving startups that customize rather than train—like xAI’s Grok versus Tesla’s homegrown driving AI. Together, they highlight AI’s split path: raw creation and user-friendly adaptation. Click onto picture below to access video by CNBC. REF: CNBC
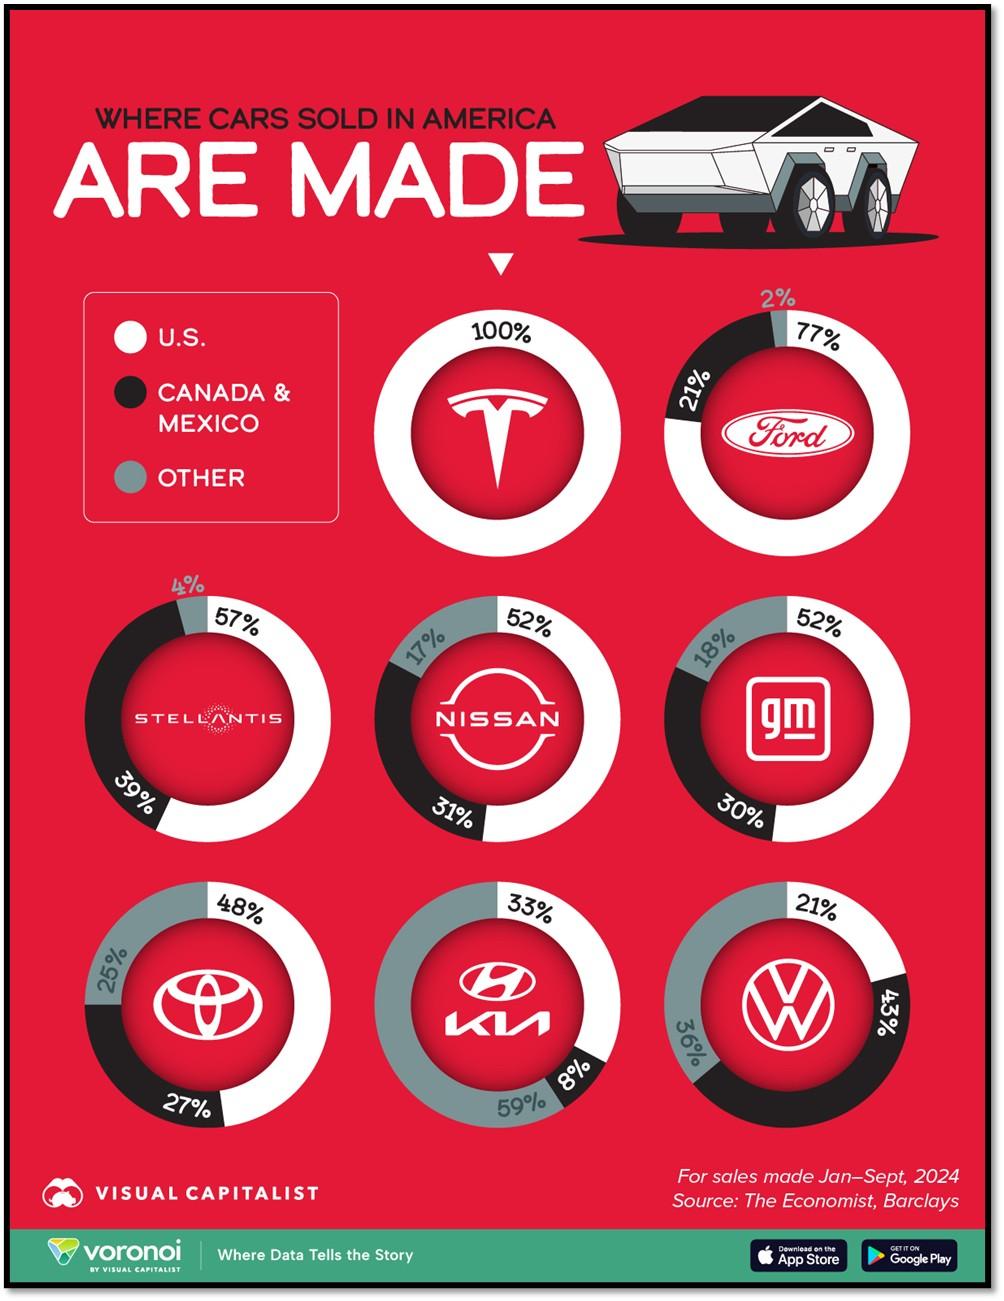
3. Trump’s announcement of a 25% tariff on all autos not made in the U.S. shook things up, and the stock drops for GM, Ford, and Stellantis reflect that.
The Barron’s coverage nailed how the market reacted—GM took the biggest hit, down over 7%, while Ford and Stellantis saw drops of more than 3% and around 1%, respectively. Tesla, though, barely flinched, which makes sense given Voronoi’s data showing it’s the only major player with 100% of its U.S.-sold vehicles assembled domestically. Ford’s at 77%, Stellantis at 57%, and GM at 52%—those gaps mean they’re importing a chunk from places like Mexico and Canada, so the tariff stings harder. People were caught off guard because the “American-made” label gets tossed around loosely, but these numbers show how much the Big Three lean on North American supply chains outside the U.S. Tesla’s all-in U.S. production gives it a shield here, though even Elon admitted on X that imported parts will bump costs a bit. Still, it’s wild to see how this policy could flip the competitive edge overnight. REF: BARRON’S, VisualCapitalist-Voronoi
With the current macro-economic backdrop, below are areas we currently favor:
- Fixed Income – Short-term Corporates (Low-Beta)
- Fixed Income – Corporates High Yield as Opportunistic Allocation (Low-Beta)
- Businesses that contribute to and benefit from AI & Automation (Market-Risk)
- Financials (Market-Risk)
- Communications (Market-Risk)
- Cyber-Security (Market-Risk)
- Biotechnology (Market-Risk)
- Gold & Digital Asset – Bitcoin (Market-Risk/Hedge)
- Small Cap & Mid Cap Stocks (Market-Risk)
4. World Watch
4A. The First Generation of Genuine Intelligence, IntuiCell, a Swedish AI startup emerging from Lund University in 2020, represents a pioneering effort to redefine how machines learn by introducing what it calls the first software enabling devices to emulate human and animal learning processes.
Inspired by three decades of neuroscience research, IntuiCell’s “digital nervous system” allows machines to adapt and learn in real-time through direct environmental interaction, rather than depending on extensive pre-training with large datasets. A striking example is their robot dog, Luna, which learned to balance and stand autonomously through trial and error, akin to a newborn animal, without pre-programmed instructions or simulations. This approach aims to create a versatile, biology-mimicking framework that could enable machines to tackle unpredictable scenarios—like space exploration or emergency response—potentially scaling toward human-level intelligence by embedding adaptability at its core.
In contrast, Tesla’s neural network, integral to its Full Self-Driving (FSD) system, is a specialized deep learning powerhouse honed for autonomous driving, relying on vast pre-training with data from millions of vehicles. Built on architectures like HydraNet and end-to-end neural networks, Tesla’s system processes inputs from eight cameras using convolutional and transformer models, trained on billions of miles of driving data via its Dojo supercomputer—a process taking 70,000 GPU hours per build. While IntuiCell prioritizes unsupervised, on-the-fly learning with minimal data dependency, Tesla’s approach is supervised and data-intensive, optimizing for real-time inference within a specific domain. IntuiCell’s general-purpose, biologically inspired adaptability starkly differs from Tesla’s engineered, task-focused precision, highlighting a trade-off between flexibility and proven, scalable performance in a high-stakes application like driving. Click onto picture below to access video. REF: IntuiCell, A Foundational Theory for Decentralized Sensory Learning
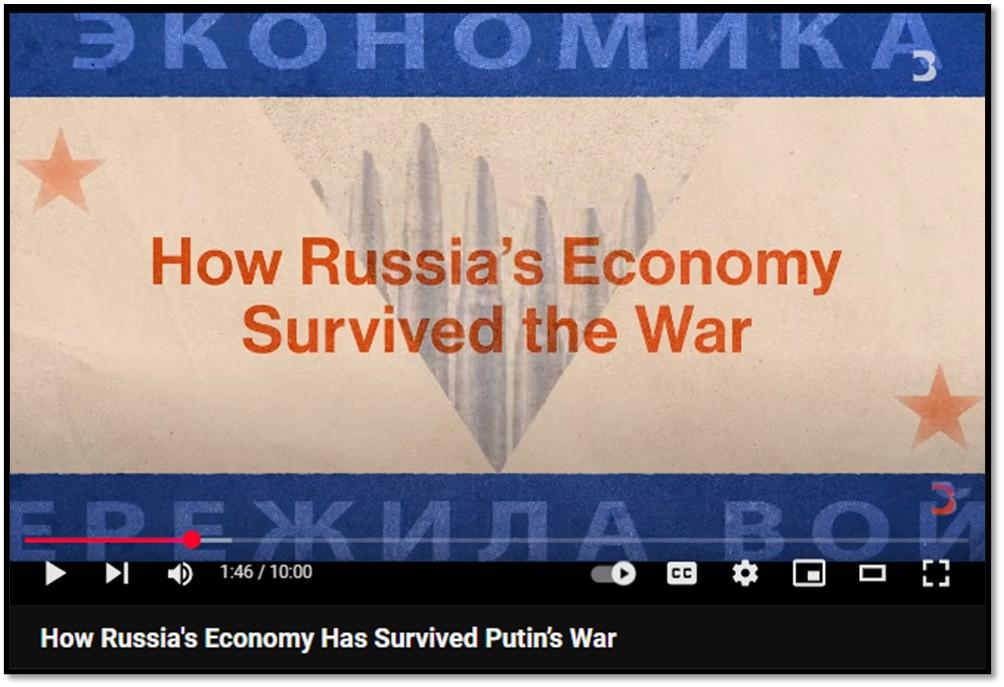
4B. Russia’s economy has shown surprising resilience despite enduring extensive Western sanctions following its 2014 annexation of Crimea and the 2022 full-scale invasion of Ukraine.
These sanctions, numbering over 20,000 from the U.S. and its allies, targeted key sectors like energy, banking, and trade, aiming to cripple Moscow’s financial and military capabilities. Yet, Russia adapted by pivoting to alternative markets, notably China and India, which ramped up purchases of its oil and gas, bypassing the G7’s $60-per-barrel price cap. High military spending—6.3% of GDP in 2025, a post-Soviet peak—fueled industrial output, while domestic workarounds, like shadow fleets for oil transport, dulled the sanctions’ edge. Bloomberg highlights this endurance, noting that after a 2022 contraction, Russia’s $2.2 trillion economy outpaced growth in the EU and U.S. in 2023 and 2024, though forecasts for 2025 dip below 1.5%. This adaptability has kept Putin’s war machine humming, defying expectations of economic collapse.
Enter Donald Trump’s return to power in 2025, and the global landscape shifts, leaving Europe at a crossroads. Trump’s “America First” stance and his push for a Russia-Ukraine peace deal—potentially easing sanctions—threaten to unravel the unified Western front. His administration’s signals, like considering banking sanctions or tariff hikes unless Moscow negotiates, contrast with earlier moves to pause U.S. military aid to Ukraine, rattling European allies. Bloomberg underscores Europe’s bind: decades of reliance on U.S. security and Russian energy (pre-2022, 40% of EU gas came from Moscow) leave it vulnerable as Trump reorients alliances. With Russia’s economy holding firm and Trump dangling economic relief for Putin, Europe faces a stark choice—bolster its own defenses and support for Ukraine or risk a fractured transatlantic order as the U.S. pivots away from its traditional role. The sanctions’ failure to break Russia, paired with Trump’s unpredictable diplomacy, has flipped the script, putting Europe’s strategic future on the line. Click onto picture below to access video. REF: Bloomberg
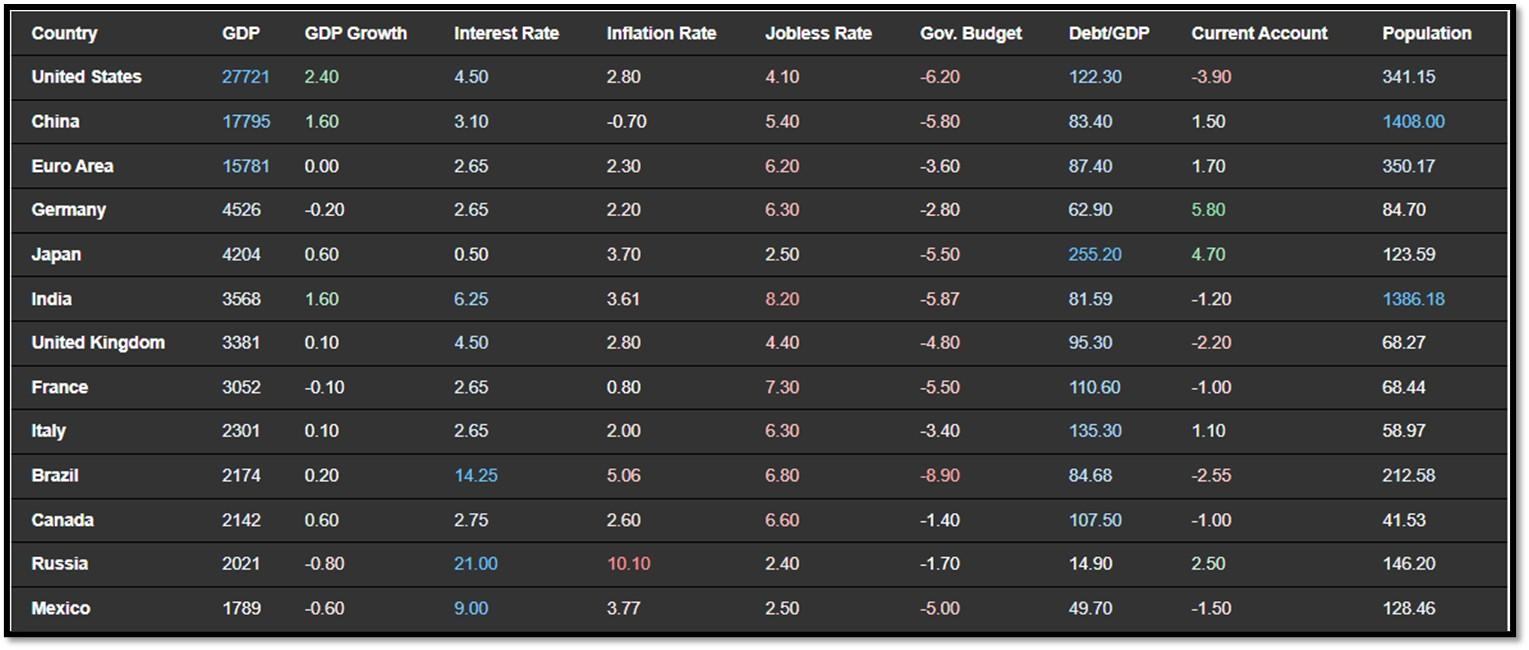
4C. Below is an updated snapshot of the current global state of economy according to TradingEconomics as of 3/31/2025. REF: TradingEconomics
- The US economy expanded an annualized 2.4% in Q4 2024, slightly higher than 2.3% in the previous estimates, primarily reflecting a downward revision to imports. Exports fell slightly less (-0.2% vs -0.5%) and imports declined more than initially anticipated (-1.9% vs -1.2%), leaving the contribution from net trade positive at 0.26 pp (vs 0.12 pp).
- Germany’s consumer price inflation slowed to 2.2% in March 2025, marking the lowest rate since November 2024 and aligning with market expectations, a preliminary estimate showed.
- Germany’s seasonally adjusted unemployment rate edged up to 6.3% in March 2025, the highest level since September 2020, compared to 6.2% in February, and forecasts of 6.2%.
- The annual inflation rate in the UK fell to 2.8% in February 2025 from 3% in January, below market expectations of 2.9%, though in line with the Bank of England’s forecast.
5. Quant & Technical Corner
Below is a selection of quantitative & technical data we monitor on a regular basis to help gauge the overall financial market conditions and the investment environment.
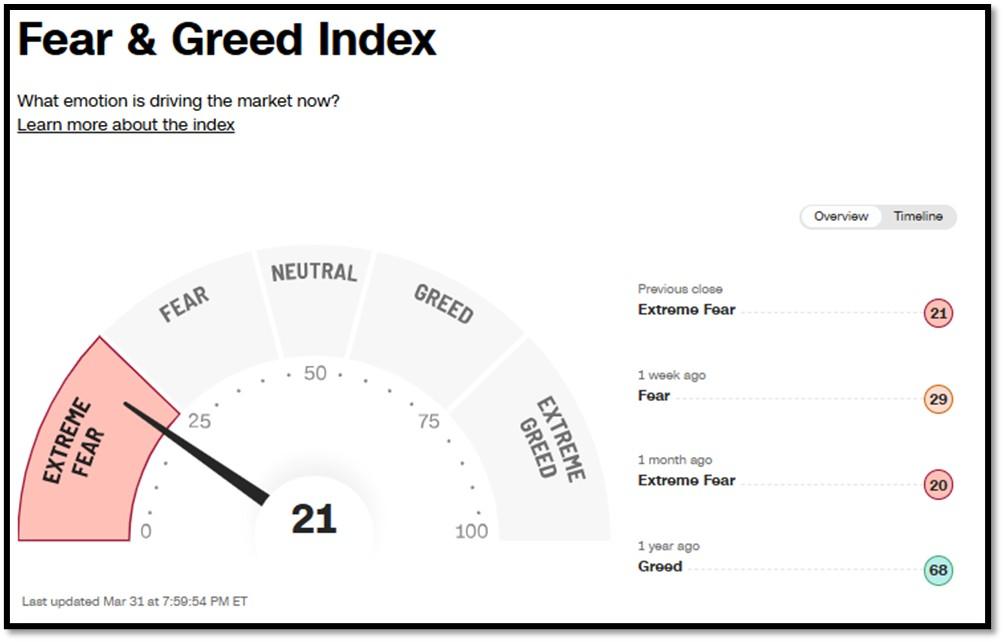
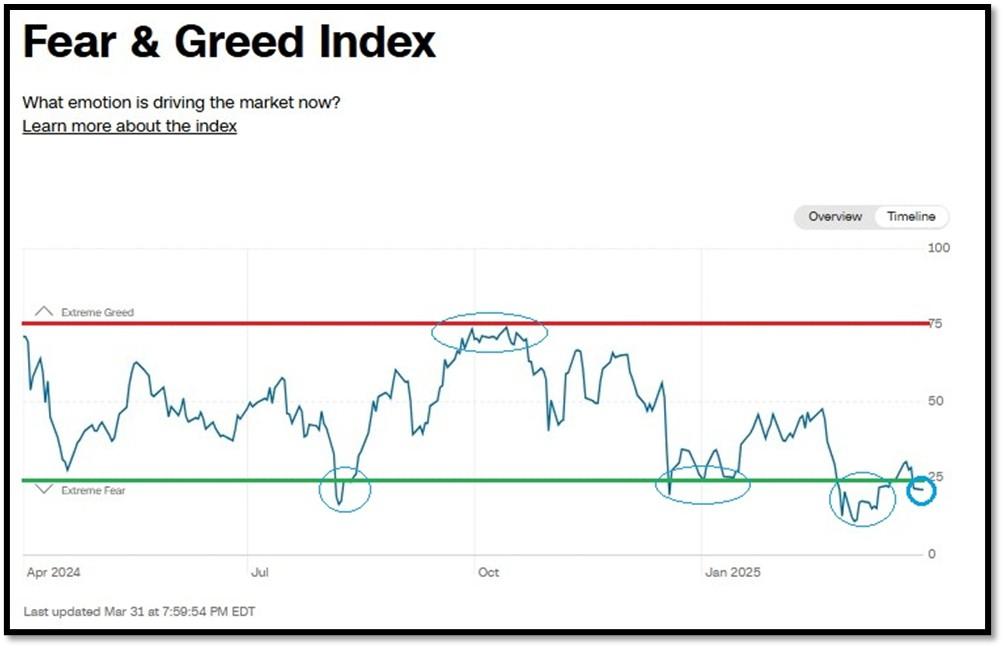
5A. Most recent read on the Fear & Greed Index with data as of 3/31/2025 – 7:59PM-ET is 21 (Extreme Fear). Last week’s data was 29 (Fear) (1-100). CNNMoney’s Fear & Greed index looks at 7 indicators (Stock Price Momentum, Stock Price Strength, Stock Price Breadth, Put and Call Options, Junk Bond Demand, Market Volatility, and Safe Haven Demand). Keep in mind this is a contrarian indicator! REF: Fear&Greed via CNNMoney
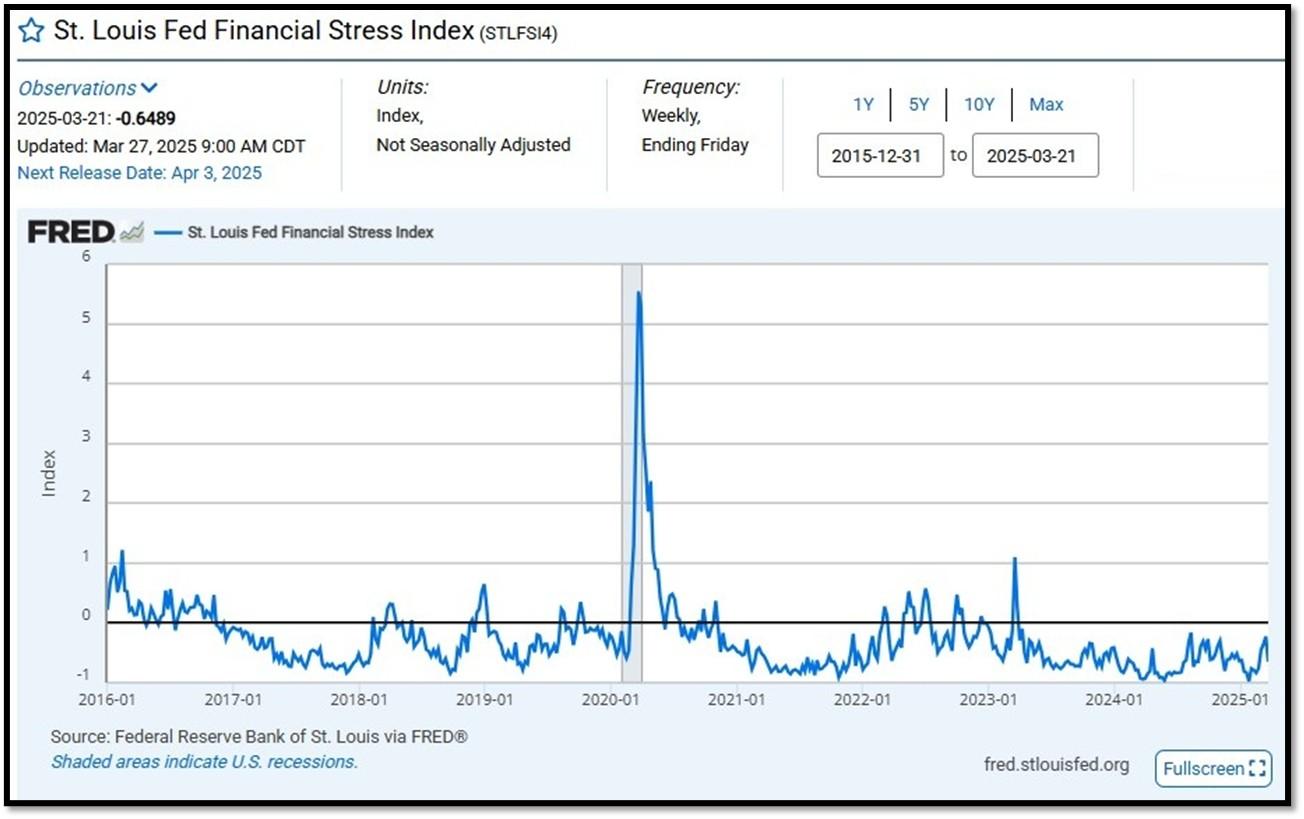
5B. St. Louis Fed Financial Stress Index’s (STLFSI4) most recent read is at –0.6489 as of March 27, 2025. Previous week’s data was -0.2264. A big spike up from previous readings reflecting the turmoil in the banking sector back in 2023. This weekly index is not seasonally adjusted. The STLFSI4 measures the degree of financial stress in the markets and is constructed from 18 weekly data series: seven interest rate series, six yield spreads and five other indicators. Each of these variables captures some aspect of financial stress. Accordingly, as the level of financial stress in the economy changes, the data series are likely to move together. REF: St. Louis Fed
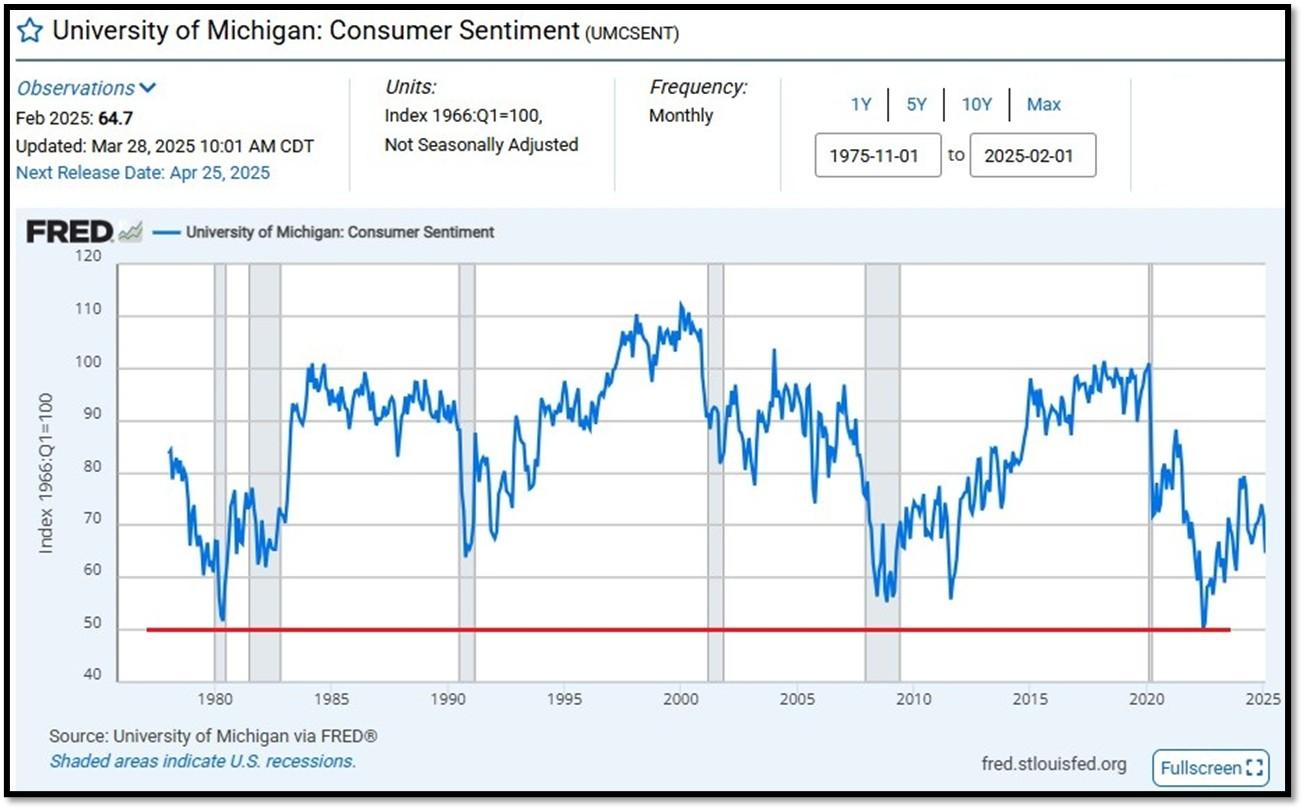
5C. University of Michigan, University of Michigan: Consumer Sentiment for February [UMCSENT] at 64.7, retrieved from FRED, Federal Reserve Bank of St. Louis, March 28, 2025. Back in June 2022, Consumer Sentiment hit a low point going back to April 1980. REF: UofM
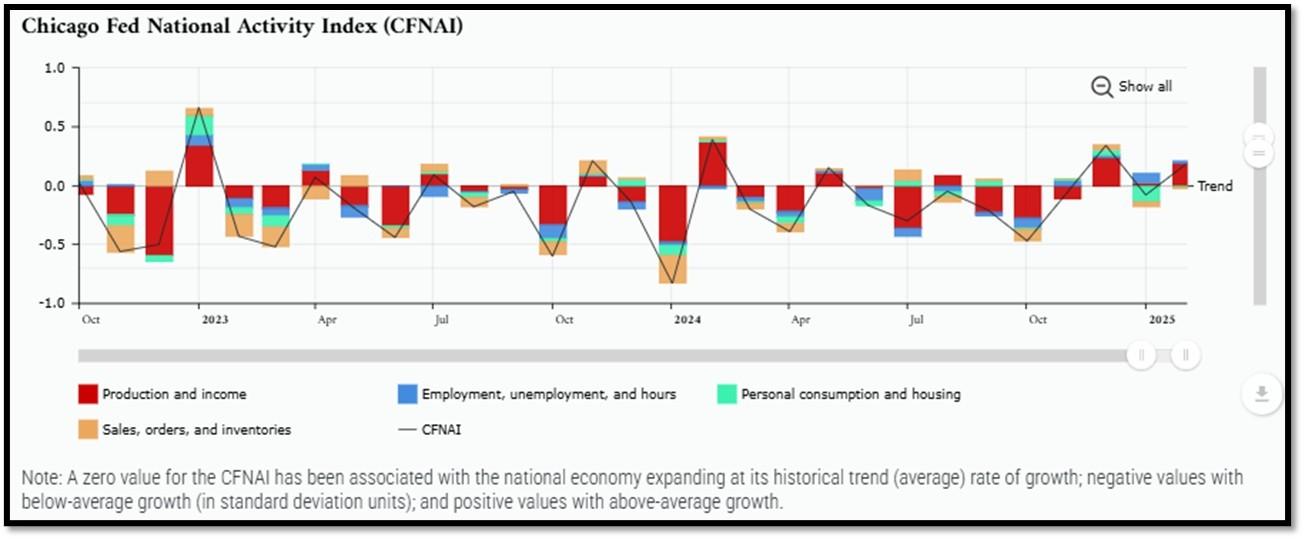
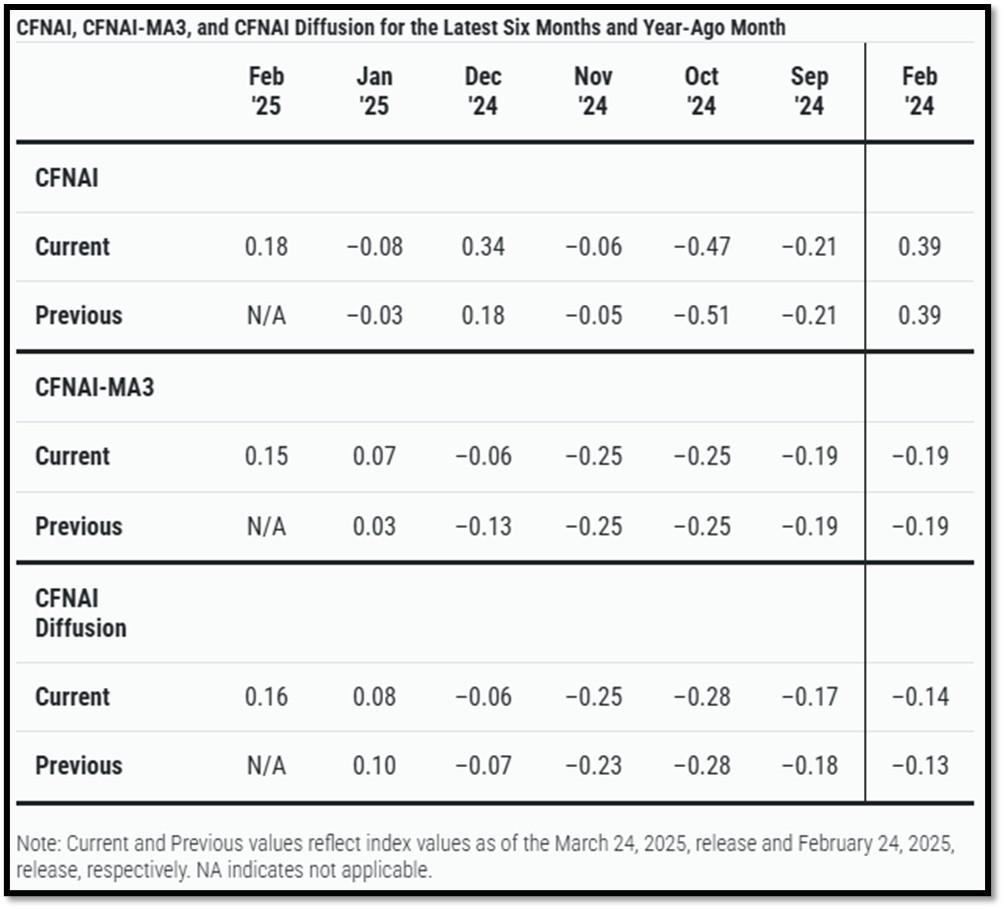
5D. The Chicago Fed National Activity Index (CFNAI) increased to +0.18 in February from –0.08 in January. Three of the four broad categories of indicators used to construct the index increased from January, and two categories made positive contributions in February. The index’s three-month moving average, CFNAI-MA3, increased to +0.15 in February from +0.07 in January. REF: ChicagoFed, February’s Report
5E. (3/20/2025) The Conference Board Leading Economic Index (LEI) for the US declined by 0.3% in February 2025 to 101.1 (2016=100), after a 0.2% decline (revised from –0.3%) in January. Overall, the LEI fell by 1.0% in the six-month period ending February 2025, less than half of its rate of decline of –2.1% over the previous six months (February–August 2024). The composite economic indexes are the key elements in an analytic system designed to signal peaks and troughs in the business cycle. The indexes are constructed to summarize and reveal common turning points in the economy in a clearer and more convincing manner than any individual component. The CEI is highly correlated with real GDP. The LEI is a predictive variable that anticipates (or “leads”) turning points in the business cycle by around 7 months. Shaded areas denote recession periods or economic contractions. The dates above the shaded areas show the chronology of peaks and troughs in the business cycle. The ten components of The Conference Board Leading Economic Index® for the U.S. include: Average weekly hours in manufacturing; Average weekly initial claims for unemployment insurance; Manufacturers’ new orders for consumer goods and materials; ISM® Index of New Orders; Manufacturers’ new orders for nondefense capital goods excluding aircraft orders; Building permits for new private housing units; S&P 500® Index of Stock Prices; Leading Credit Index™; Interest rate spread (10-year Treasury bonds less federal funds rate); Average consumer expectations for business conditions. REF: ConferenceBoard, LEI Report for February (Released on 3/29/2025)
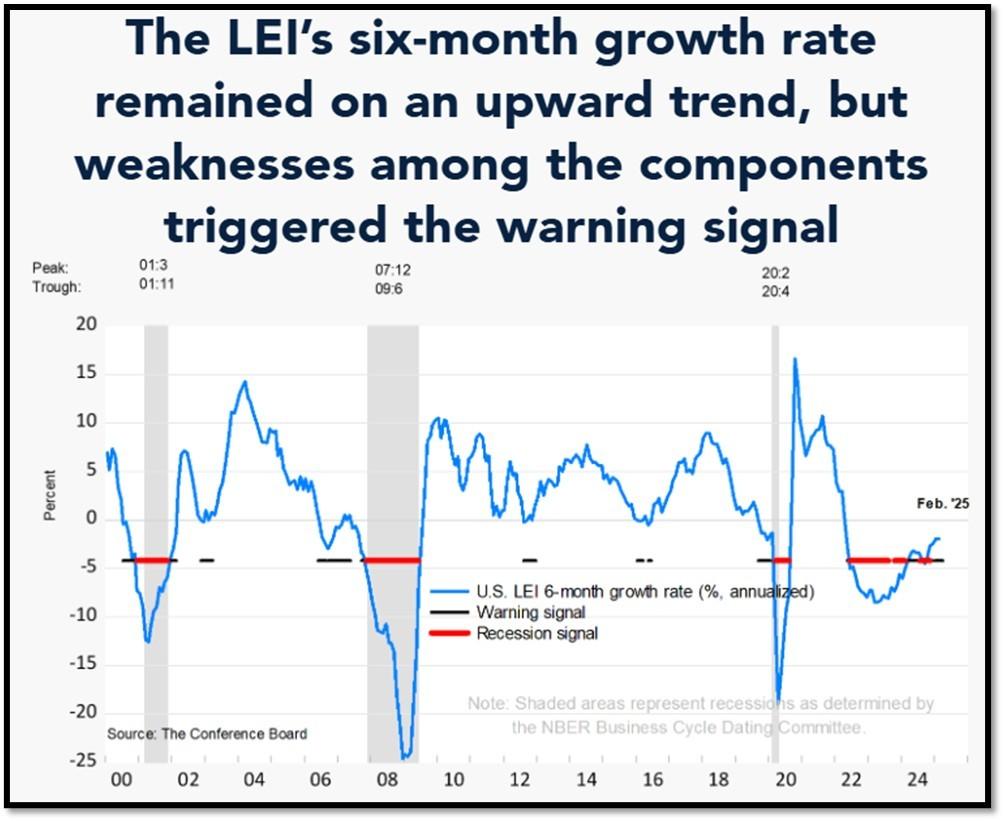
We have experienced a “rolling recession” since June 2022 and are only now emerging from it. However, authorities are not labeling it a recession due to high employment data. 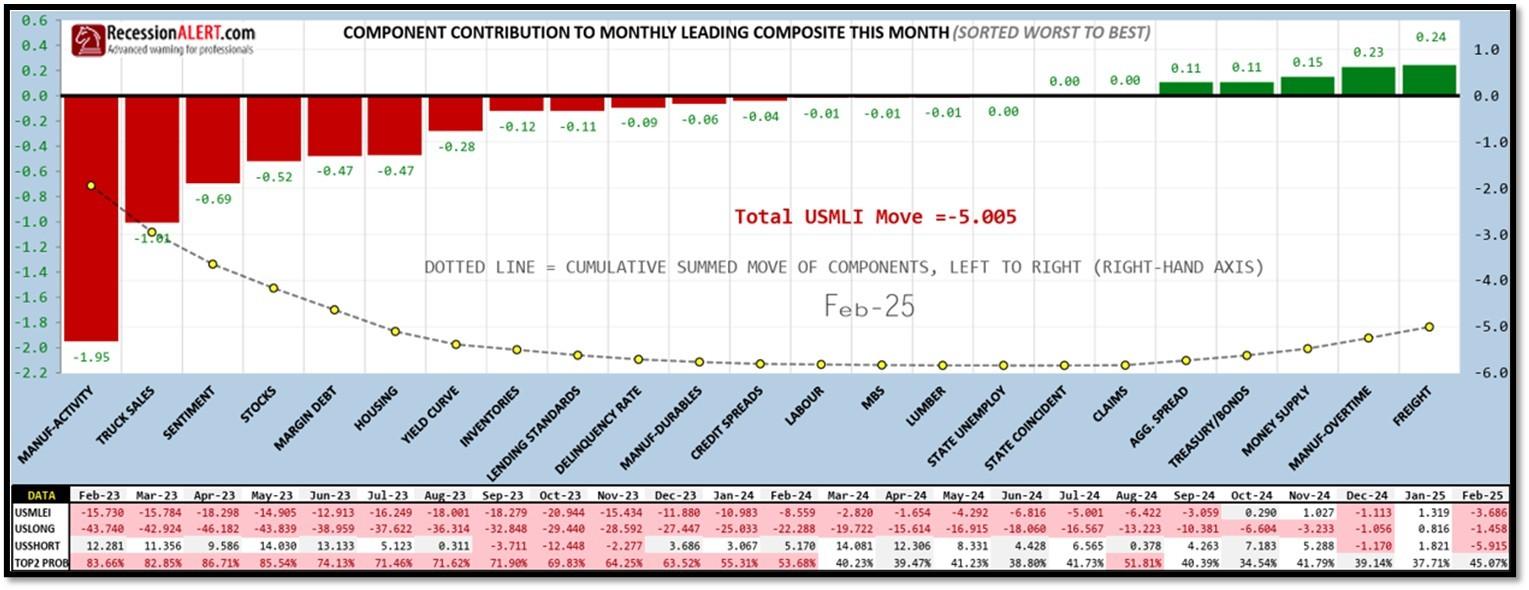
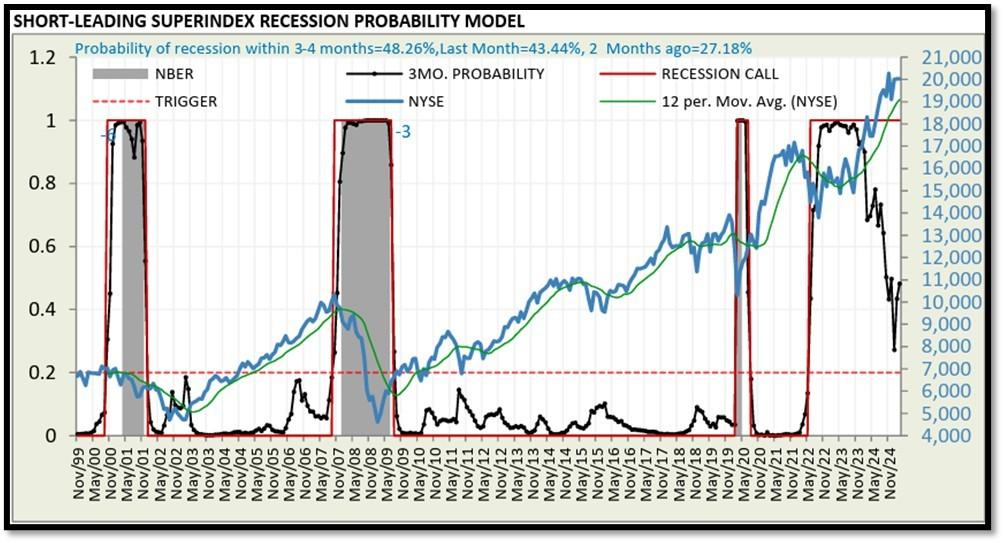
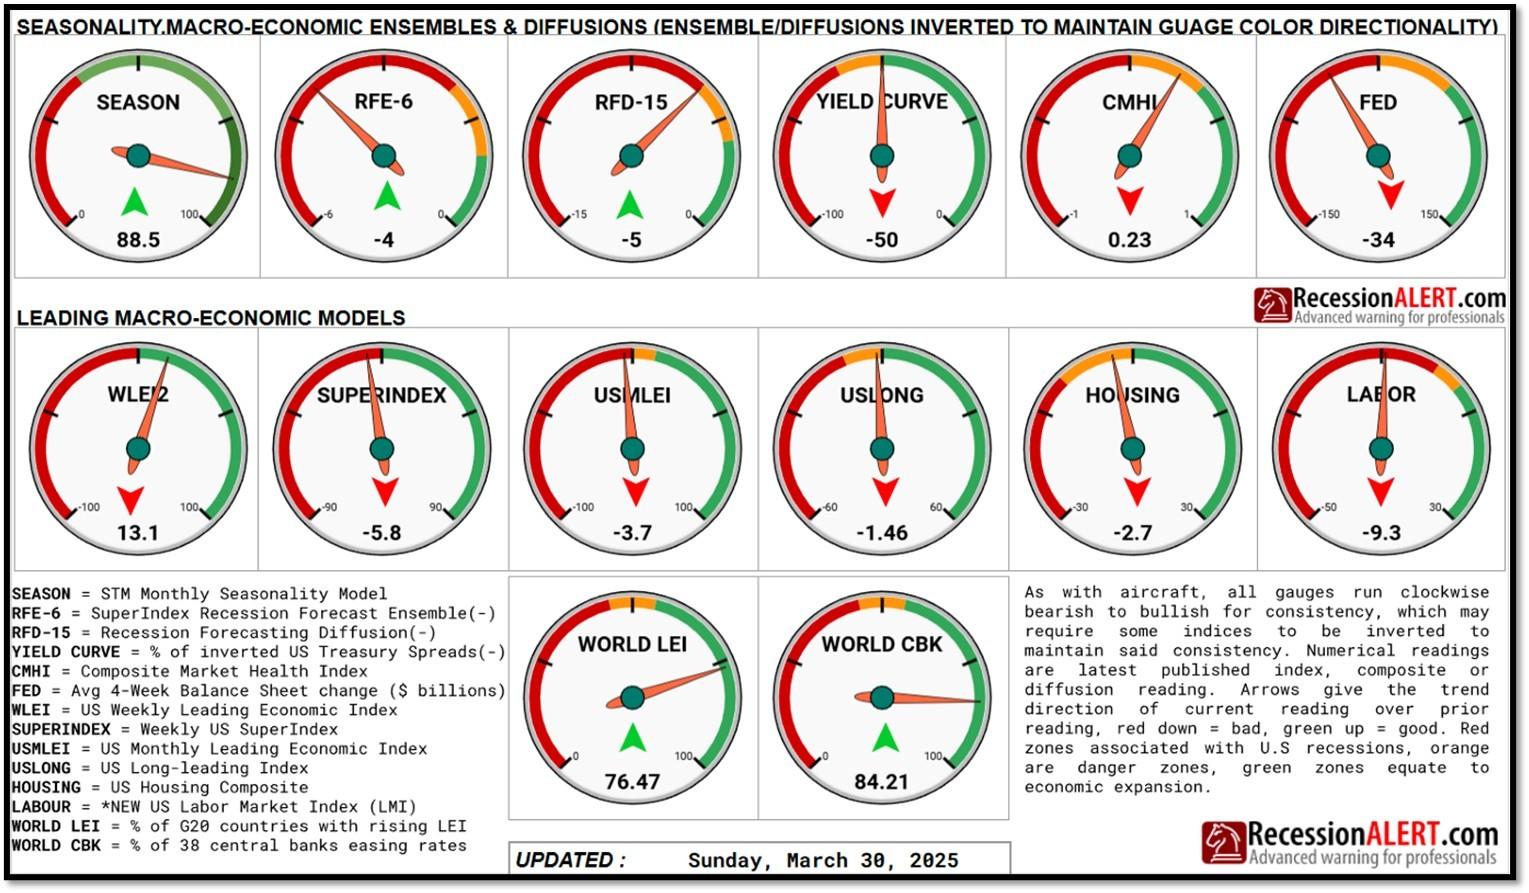
5F. Probability of U.S. falling into Recession within 3 to 4 months is currently at 48.26% (with data as of 03/30/2025 – Next Report 04/14/2025) according to RecessionAlert Research. Last release’s data was at 32.85%. This report is updated every two weeks. REF: RecessionAlertResearch
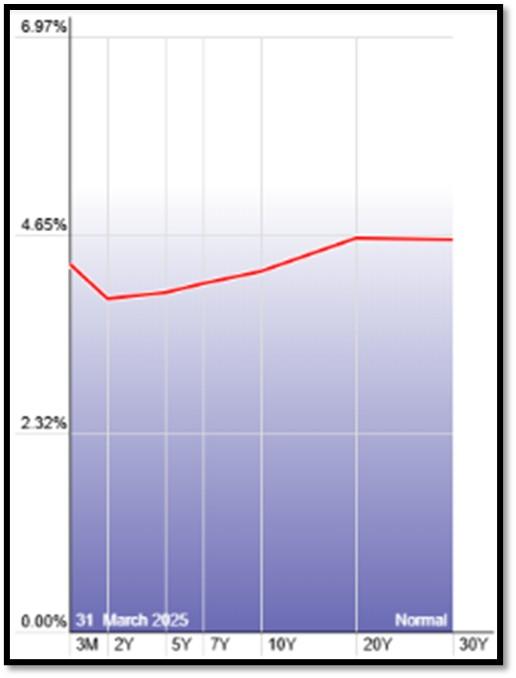
5G. Yield Curve as of 3/31/2025 is showing Normal. Spread on the 10-yr Treasury Yield (4.19%) minus yield on the 2-yr Treasury Yield (3.88%) is currently at 31bps. REF: Stockcharts The yield curve—specifically, the spread between the interest rates on the ten-year Treasury note and the three-month Treasury bill—is a valuable forecasting tool. It is simple to use and significantly outperforms other financial and macroeconomic indicators in predicting recessions two to six quarters ahead. REF: NYFED
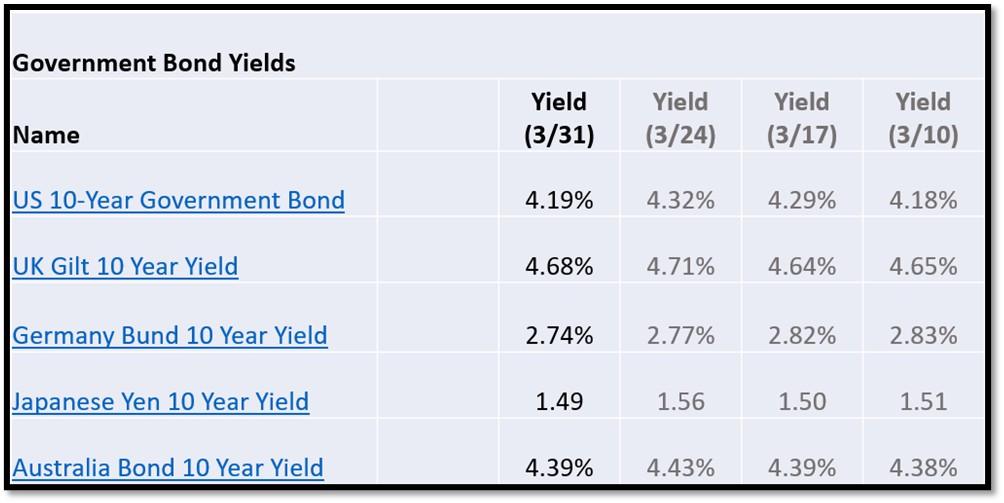
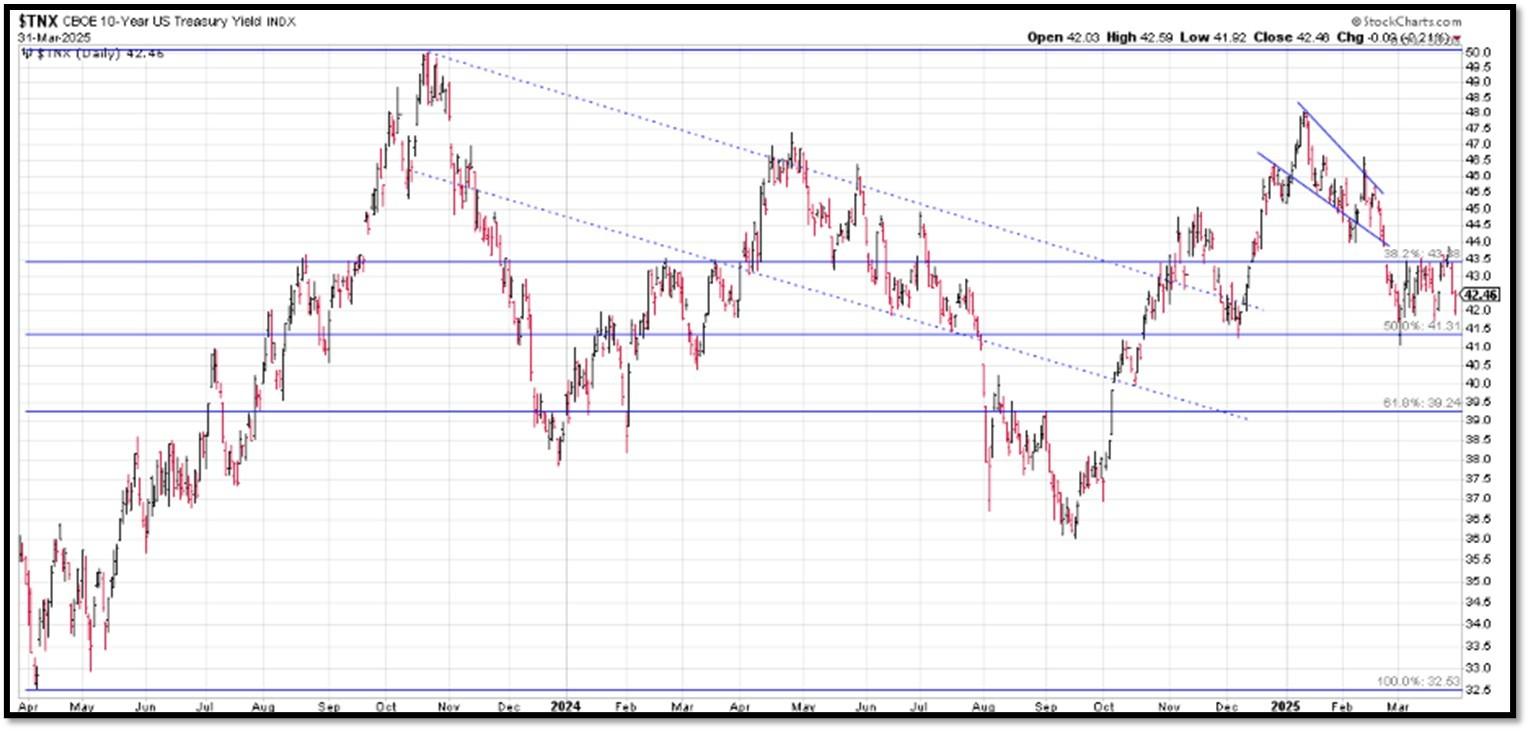
5H. Recent Yields in 10-Year Government Bonds. REF: Source is from Bloomberg.com, dated 3/31/2025, rates shown below are as of 3/31/2025, subject to change.
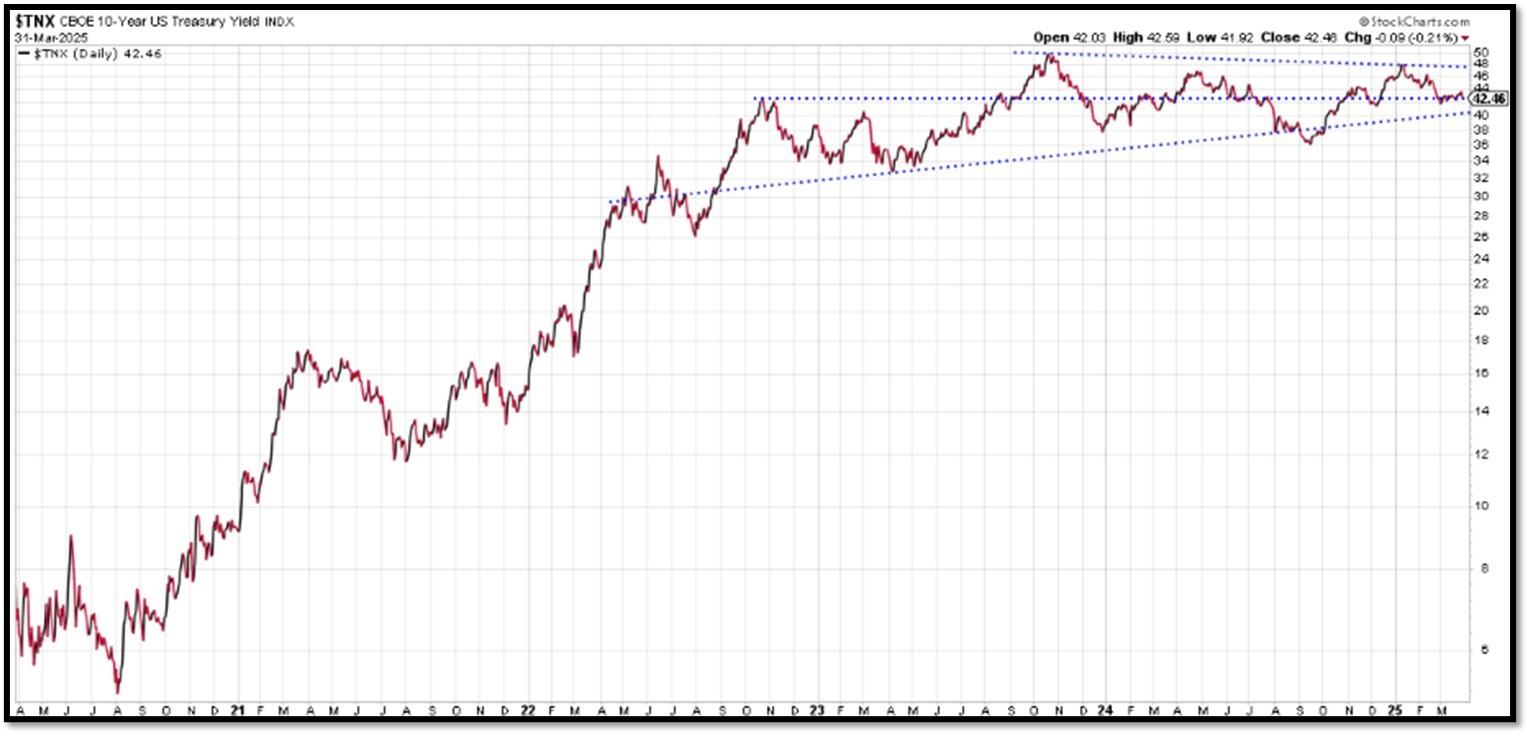
The 10-Year US Treasury Yield… The 10-Year Yield is indirectly related to inflation. I expect the 10-Year Yield to drop further as dis-inflation kicks in. REF: StockCharts1, StockCharts2
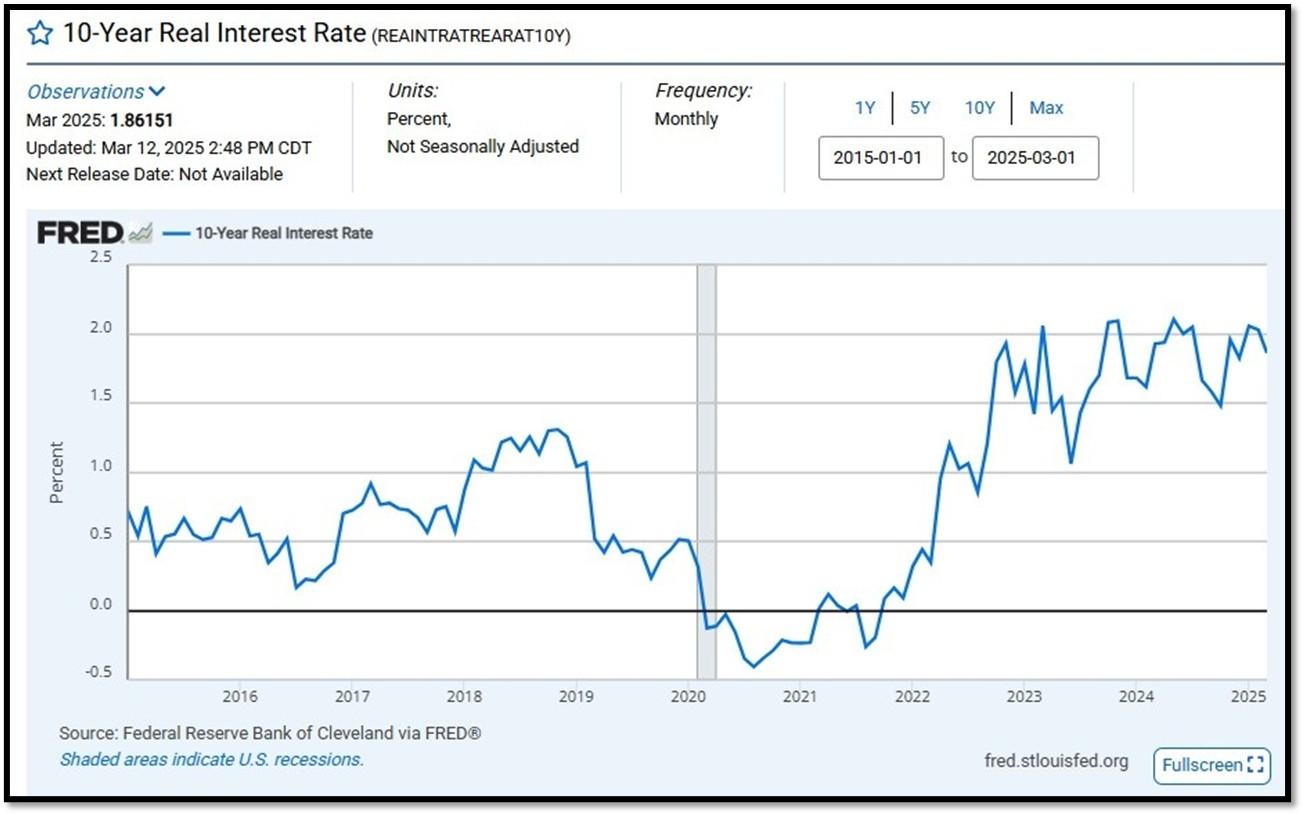
10-Year Real Interest Rate at 1.86151% as of 3/12/25. Last month’s data was 2.03128%. REF: REAINTRATREARAT10Y
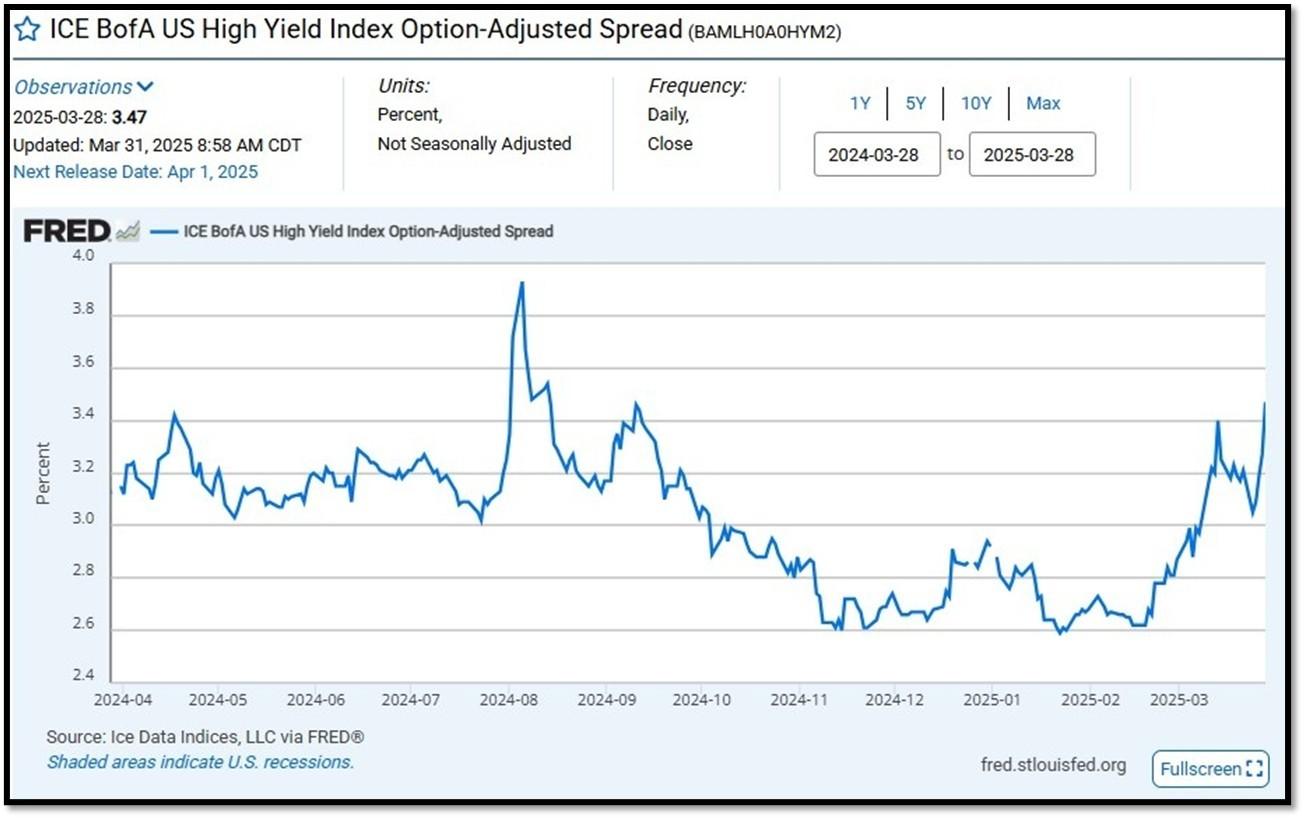
ICE BofA US High Yield Index Option-Adjusted Spread (BAMLH0A0HYM2) currently at 3.47 as of March 31, 2025. This is a key indicator of market sentiment, particularly regarding risk and economic health. At its core, the spread reflects the extra return investors demand to hold riskier corporate debt over safer government securities. High-yield bonds are issued by companies with lower credit ratings (below investment grade, like BB or lower), meaning they carry a higher chance of default. The spread compensates for this risk. When the spread is narrow—say, around 2.5% to 3%, as seen recently—it suggests investors are confident, willing to accept less extra yield because they perceive lower default risk or a strong economy. Narrow spreads often align with bullish markets, where cash is flowing, growth is steady, and fear is low. REF: FRED-BAMLH0A0HYM2
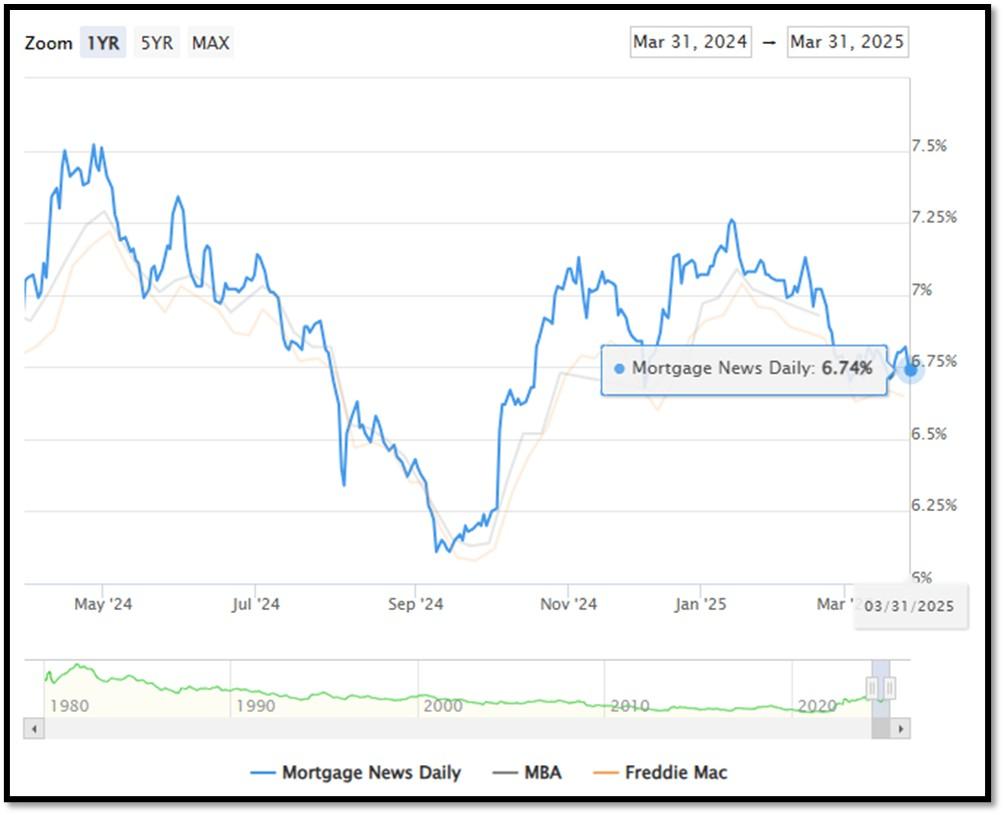
5I. (3/31/2025) Today’s National Average 30-Year Fixed Mortgage Rate is 6.74% (All Time High was 8.03% on 10/19/23). Last week’s data was 6.77%. This rate is the average 30-year fixed mortgage rates from several different surveys including Mortgage News Daily (daily index), Freddie Mac (weekly survey), Mortgage Bankers Association (weekly survey) and FHFA (monthly survey). REF: MortgageNewsDaily, Today’s Average Rate
The recent spike in the 30-year fixed-rate jumbo mortgage to 6.74%, compared to Freddie Mac’s rate at 6.65% and the Mortgage Bankers Association (MBA) rate at 6.93%, highlights key differences in the mortgage market. Jumbo mortgages, which exceed the conforming loan limits set by government agencies like Freddie Mac, typically carry higher interest rates because they are riskier for lenders. These loans are not backed by government entities, which increases the risk for lenders and, consequently, leads to higher rates. In contrast, Freddie Mac and MBA provide averages for conforming loans, which meet federal guidelines and have lower risk due to government backing, keeping their rates lower.
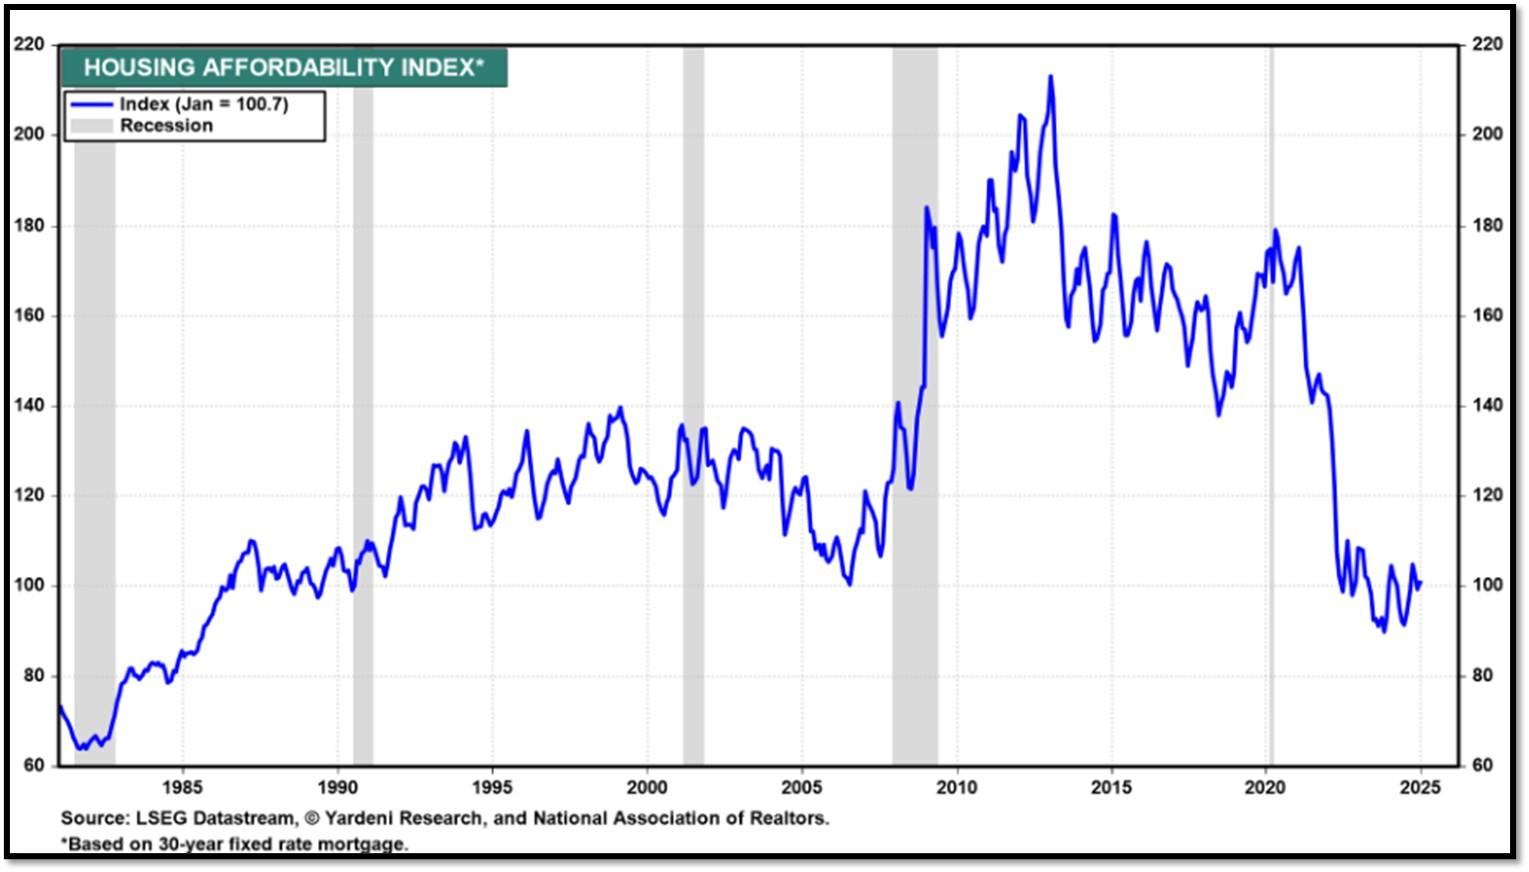
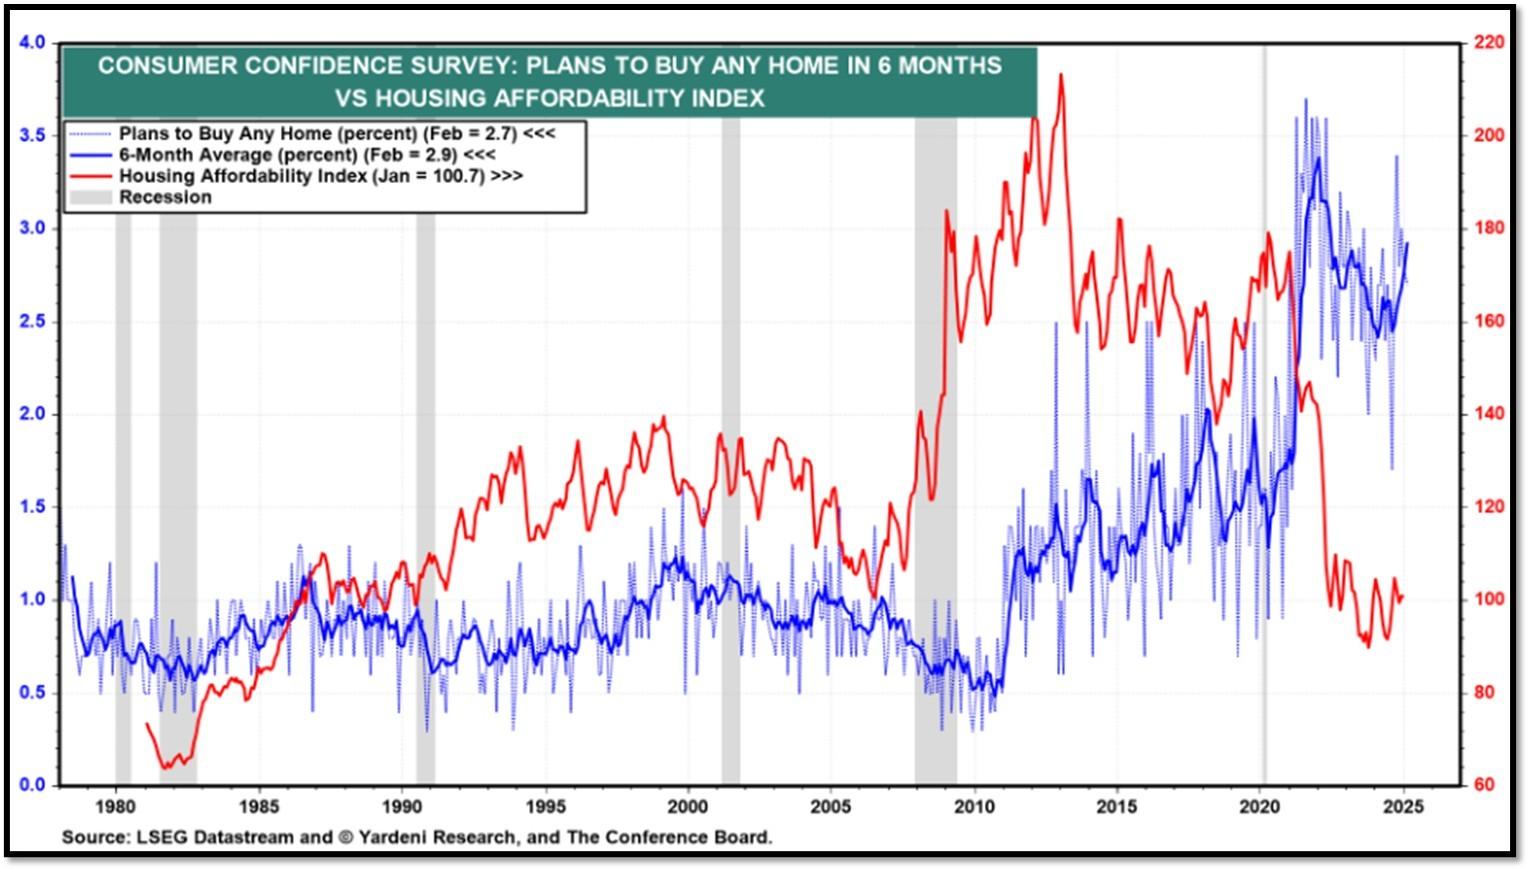
(3/17/25) Housing Affordability Index for Jan = 100.7 // Dec = 100.7 // Nov = 99 // Oct = 102.3 // Sep = 105.5 // Aug = 98.6. Data provided by Yardeni Research. REF: Yardeni
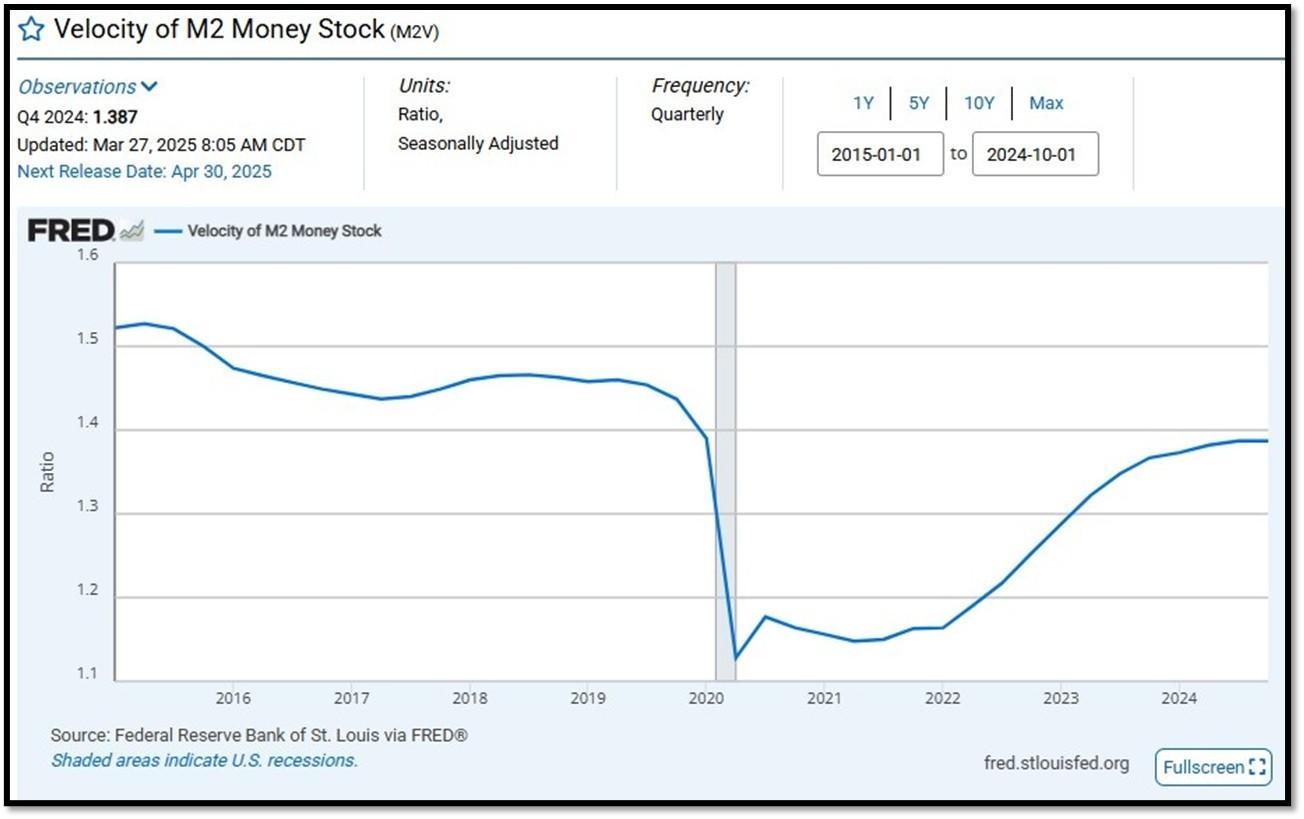
5J. Velocity of M2 Money Stock (M2V) with current read at 1.387 as of (Q4-2024 updated 3/27/2025). Previous quarter’s data was 1.390. The velocity of money is the frequency at which one unit of currency is used to purchase domestically- produced goods and services within a given time period. In other words, it is the number of times one dollar is spent to buy goods and services per unit of time. If the velocity of money is increasing, then more transactions are occurring between individuals in an economy. Current Money Stock (M2) report can be viewed in the reference link. REF: St.LouisFed-M2V
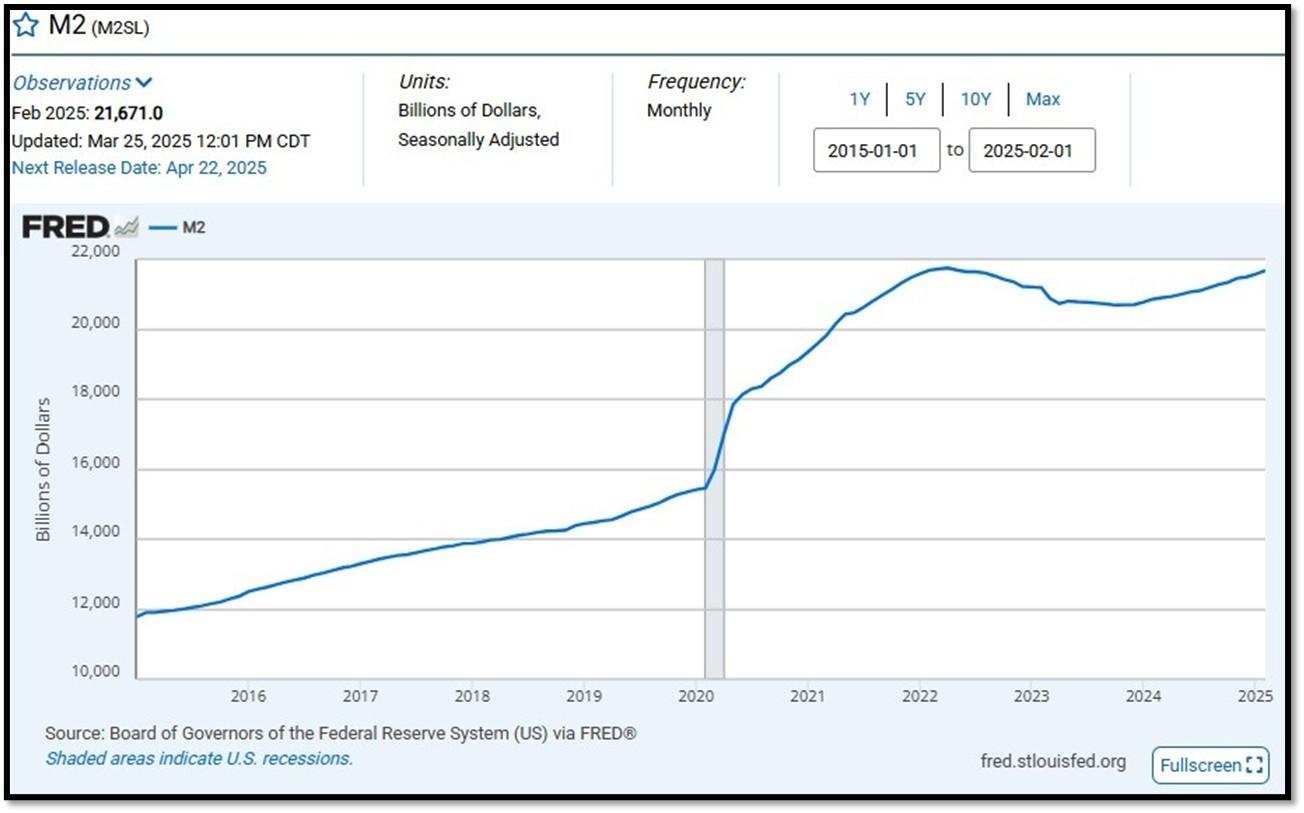
M2 consists of M1 plus (1) small-denomination time deposits (time deposits in amounts of less than $100,000) less IRA and Keogh balances at depository institutions; and (2) balances in retail MMFs less IRA and Keogh balances at MMFs. Seasonally adjusted M2 is constructed by summing savings deposits (before May 2020), small-denomination time deposits, and retail MMFs, each seasonally adjusted separately, and adding this result to seasonally adjusted M1. Board of Governors of the Federal Reserve System (US), M2 [M2SL], retrieved from FRED, Federal Reserve Bank of St. Louis; Updated on March 25, 2025. REF: St.LouisFed-M2
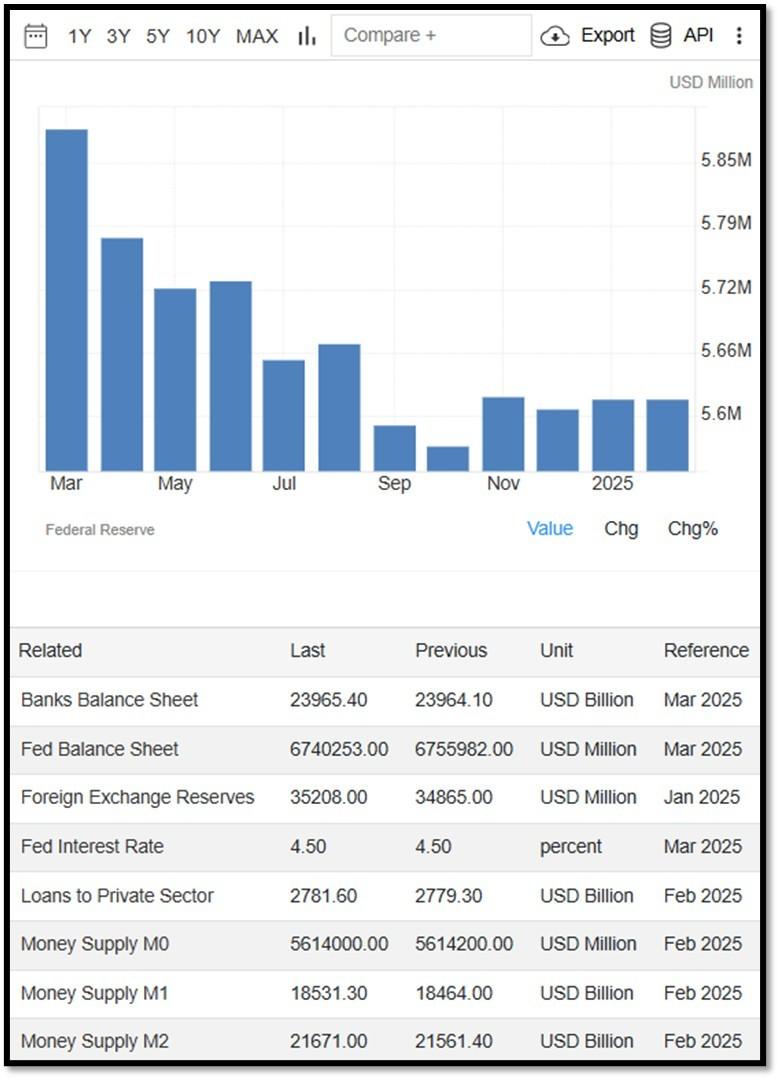
Money Supply M0 in the United States decreased to 5,614,000 USD Million in February from 5,614,200 USD Million in January of 2025. Money Supply M0 in the United States averaged 1,177,483.25 USD Million from 1959 until 2025, reaching an all-time high of 6,413,100.00 USD Million in December of 2021 and a record low of 48,400.00 USD Million in February of 1961.. REF: TradingEconomics, M0
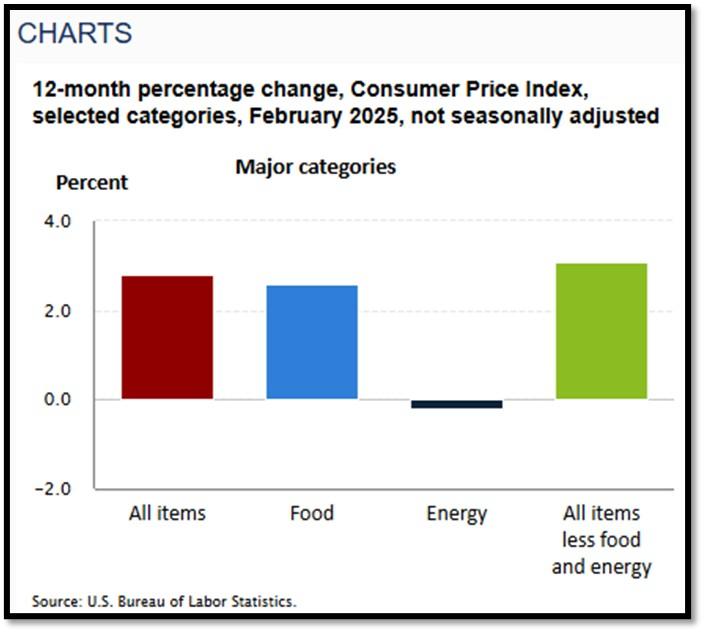
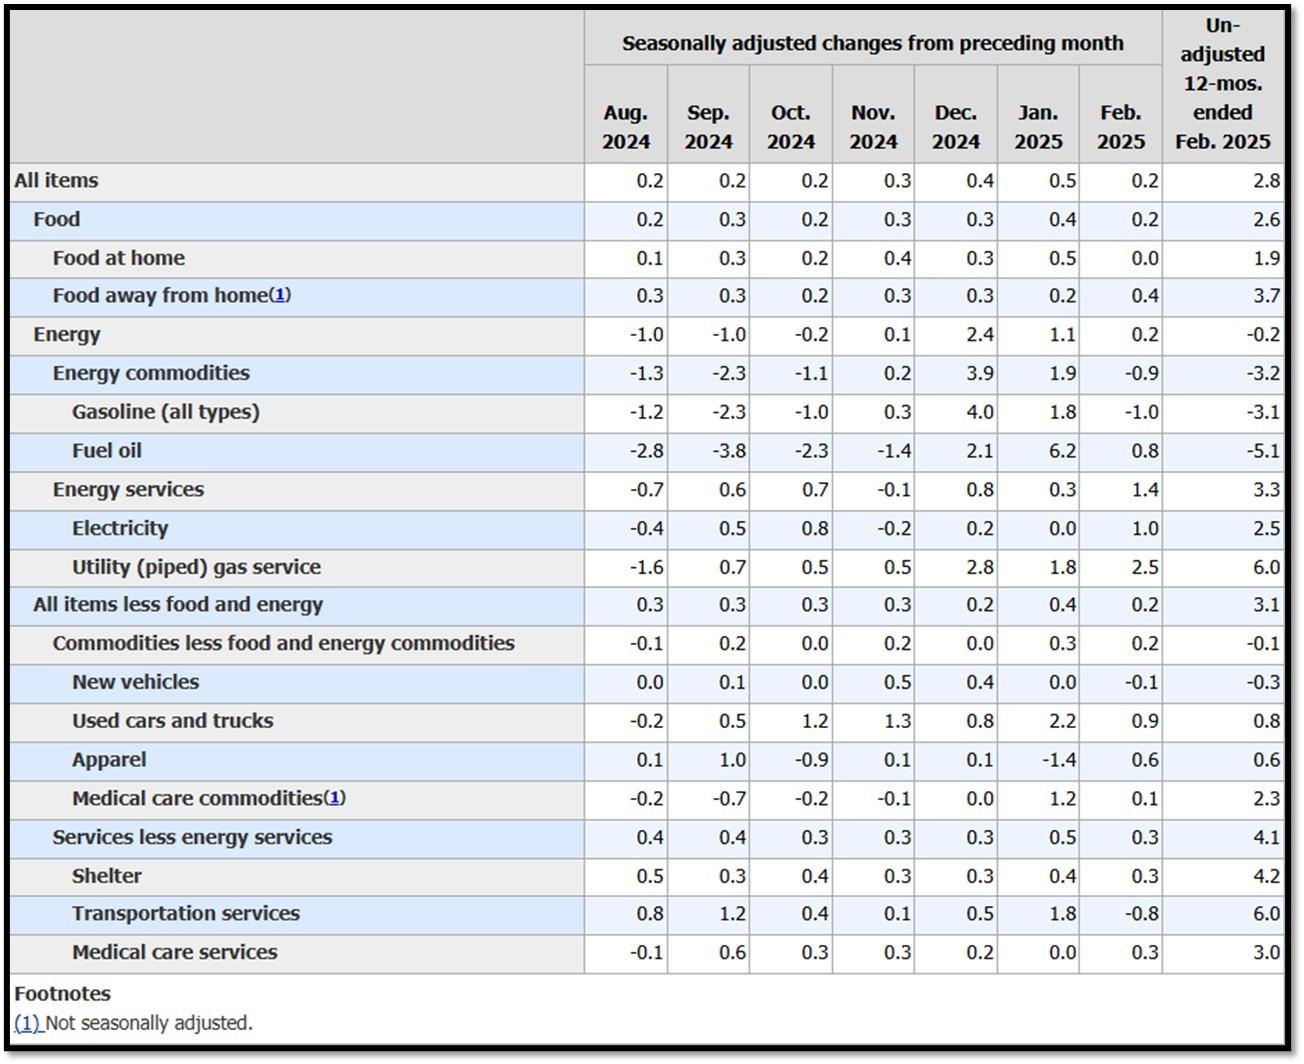
5K. In February, the Consumer Price Index for All Urban Consumers rose 0.2 percent, seasonally adjusted, and rose 2.8 percent over the last 12 months, not seasonally adjusted. The index for all items less food and energy increased 0.2 percent in February (SA); up 3.1 percent over the year (NSA). March 2025 CPI data are scheduled to be released on April 10, 2025, at 8:30AM-ET. REF: BLS, BLS.GOV
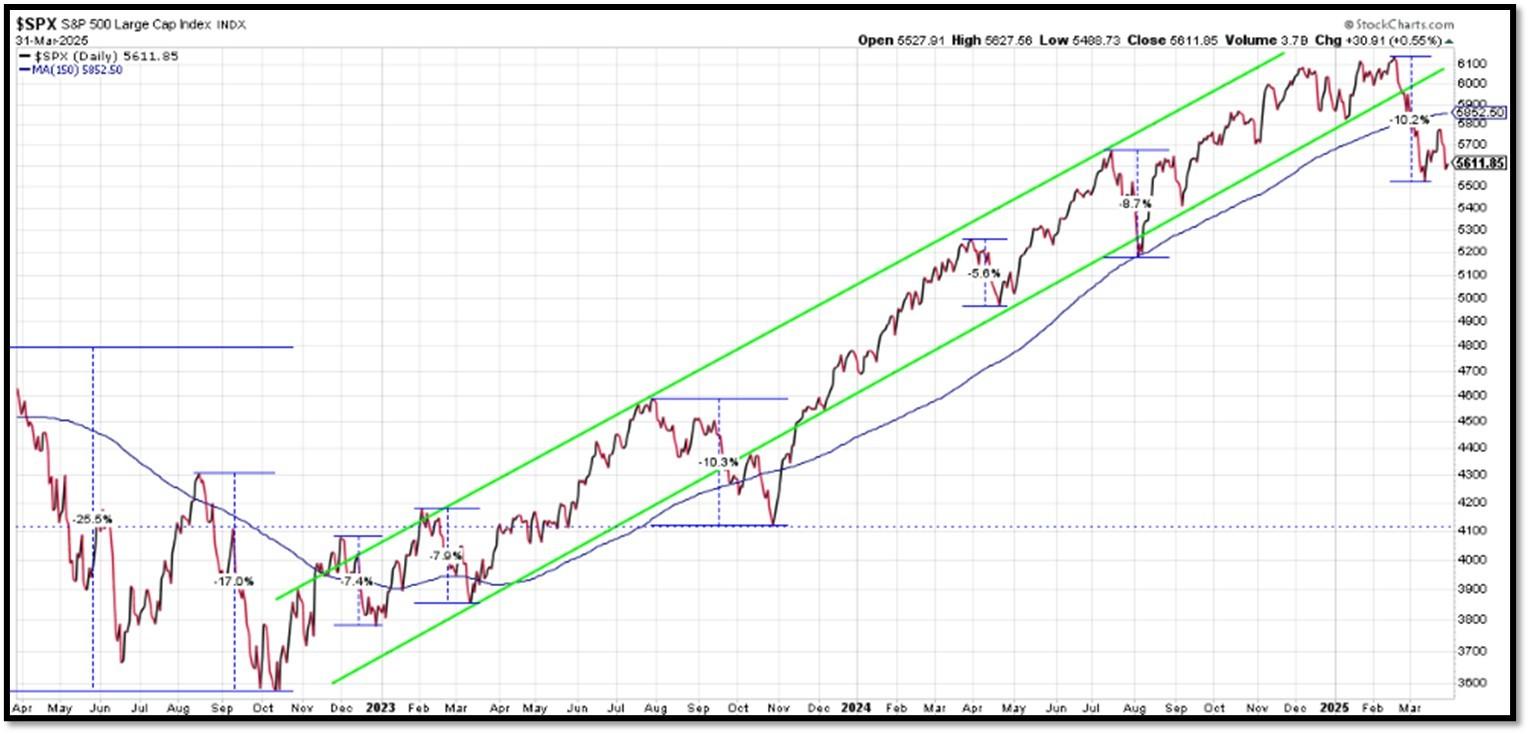
5L. Technical Analysis of the S&P500 Index. Click onto reference links below for images.
- Short-term Chart: Trend Bearish on 3/31/2025 – REF: Short-term S&P500 Chart by Marc Slavin (Click Here to Access Chart)
- Medium-term Chart: Trend Bullish to Falling on 3/31/2025 – REF: Medium-term S&P500 Chart by Marc Slavin (Click Here to Access Chart)
- Market Timing Indicators – S&P500 Index as of 3/31/2025 – REF: S&P500 Charts (7 of them) by Joanne Klein’s Top 7 (Click Here to Access Updated Charts)
- A well-defined uptrend channel shown in green with S&P500 broke away from the uptrend. REF: Stockcharts
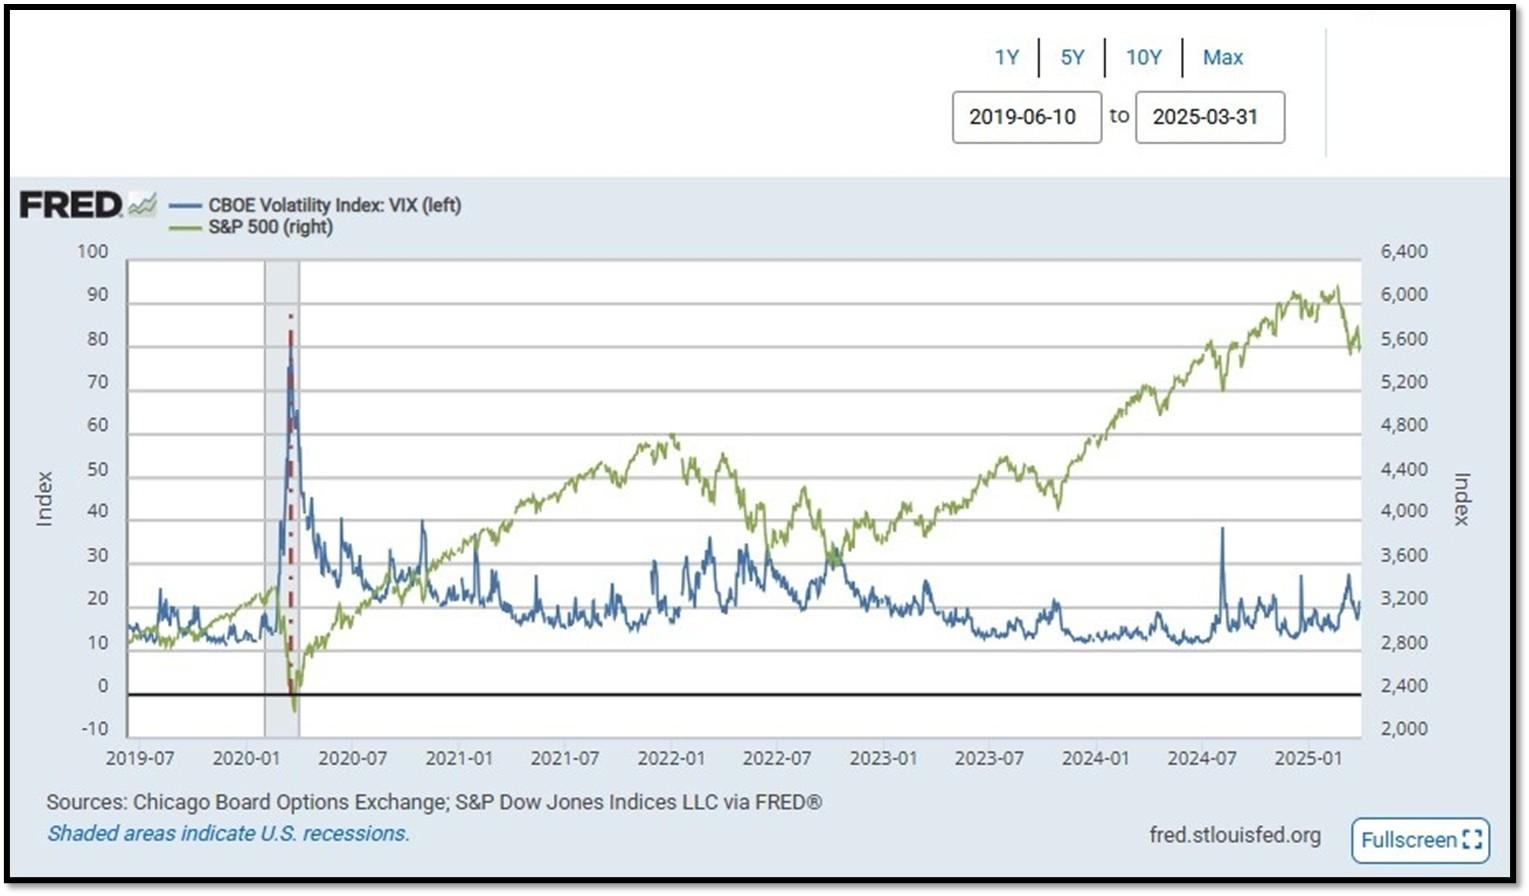
- S&P500 and CBOE Volatility Index (VIX) as of 3/31/2025. REF: FRED, Today’s Print
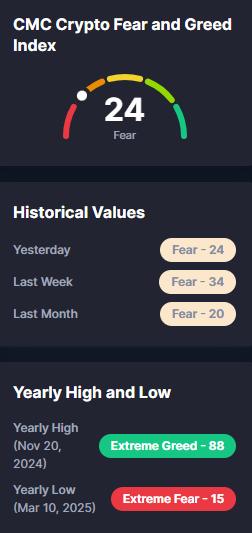
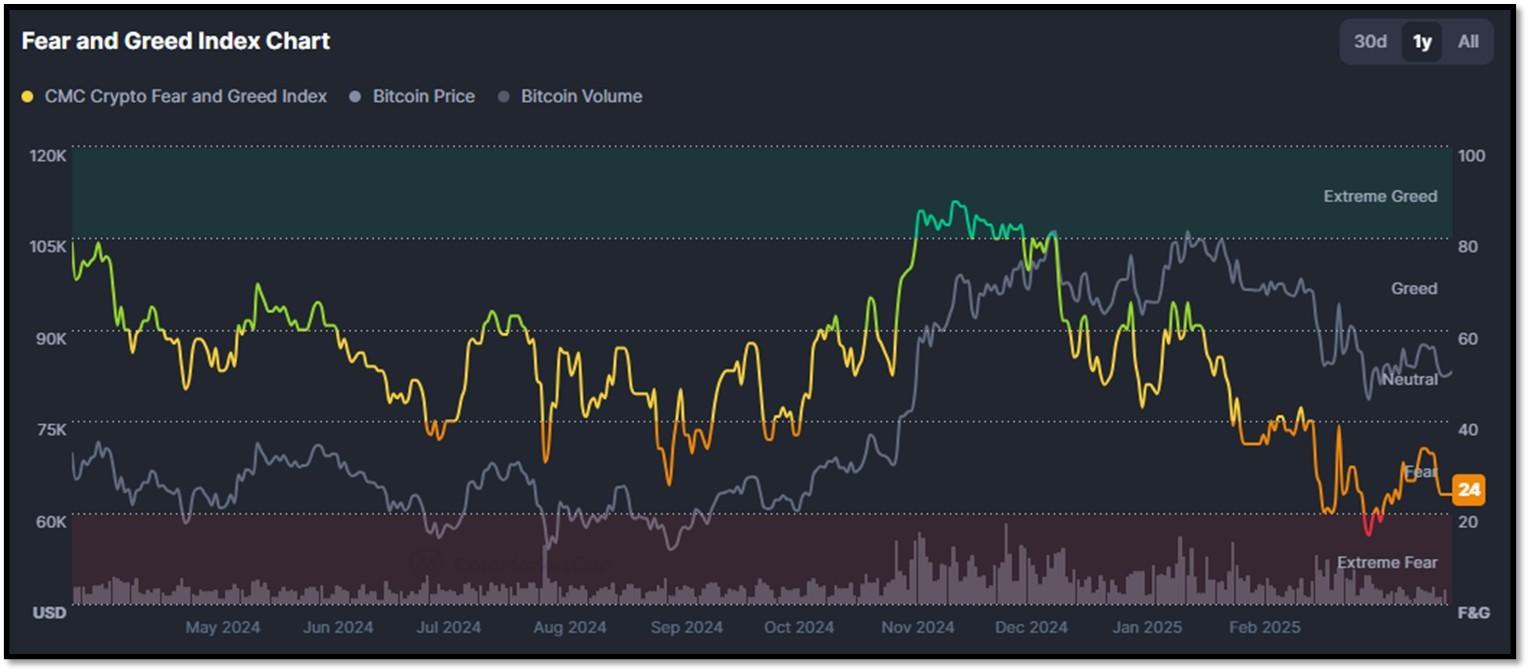
5M. Most recent read on the Crypto Fear & Greed Index with data as of 3/31/2025 is 24 (Fear). Last week’s data was 34 (Fear) (1-100). Fear & Greed Index – A Contrarian Data. The crypto market behavior is very emotional. People tend to get greedy when the market is rising which results in FOMO (Fear of missing out). Also, people often sell their coins in irrational reaction of seeing red numbers. With the Crypto Fear and Greed Index, the data try to help save investors from their own emotional overreactions. There are two simple assumptions:
- Extreme fear can be a sign that investors are too worried. That could be a buying opportunity.
- When Investors are getting too greedy, that means the market is due for a correction.
Therefore, the program for this index analyzes the current sentiment of the Bitcoin market and crunch the numbers into a simple meter from 0 to 100. Zero means “Extreme Fear”, while 100 means “Extreme Greed”. REF: Coinmarketcap.com, Today’sReading
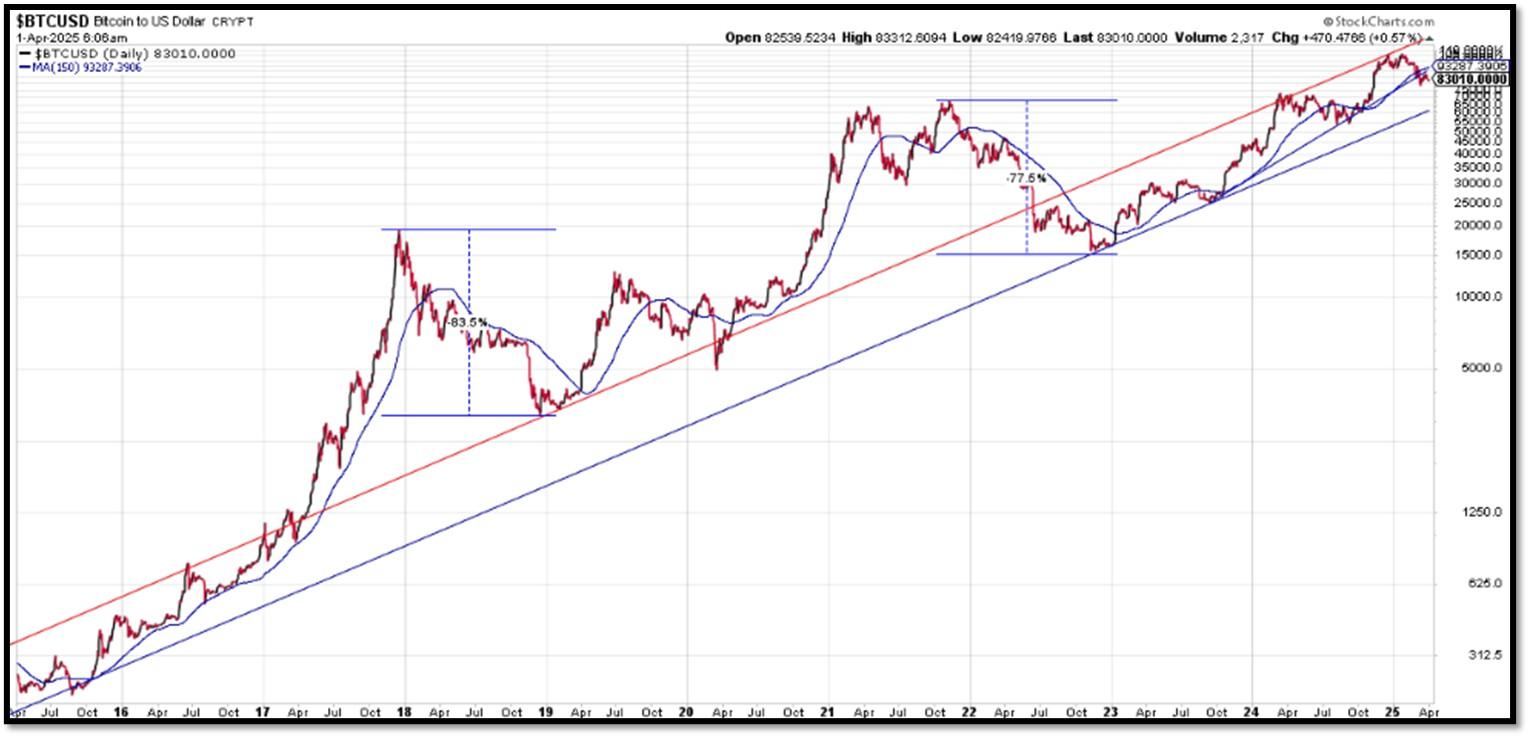
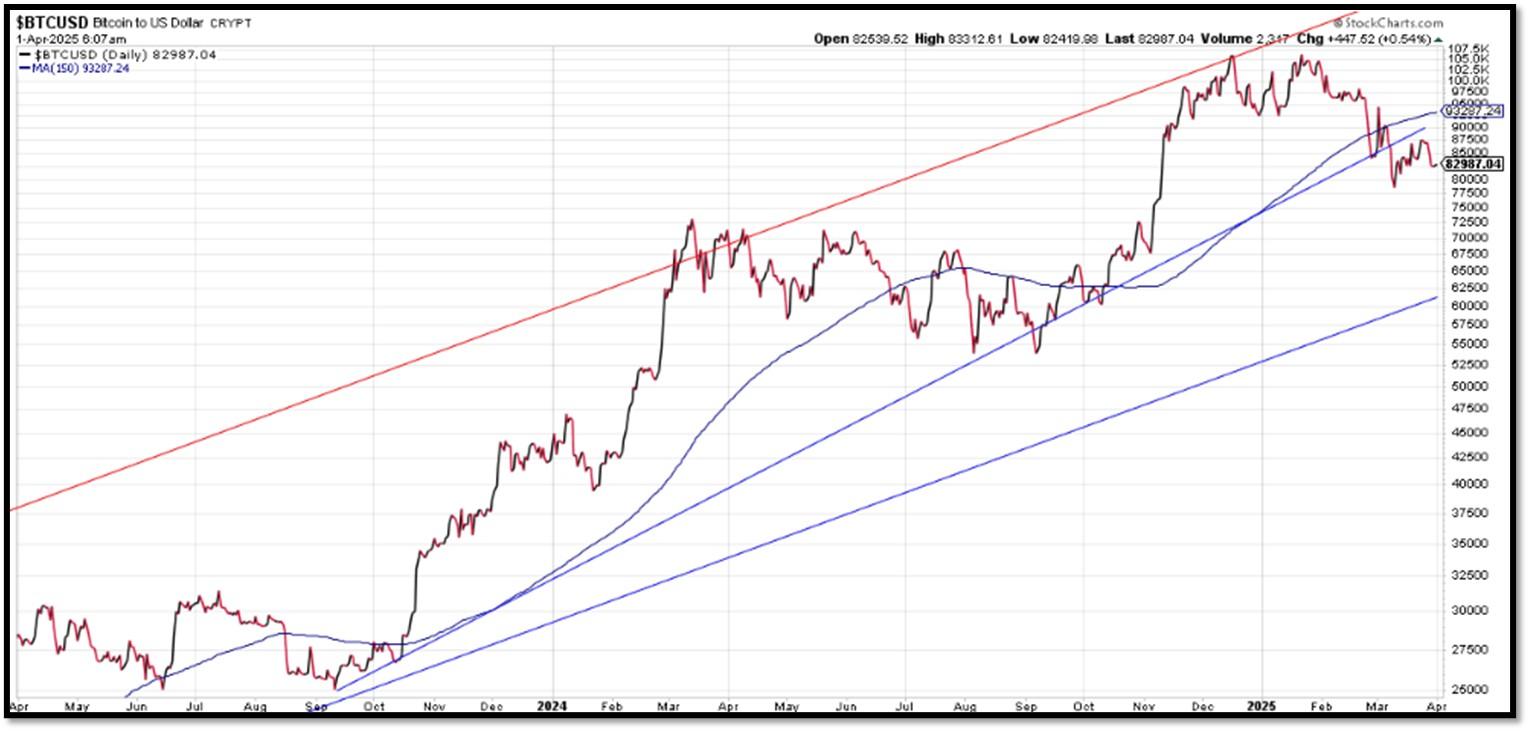
Bitcoin – 10-Year & 2-Year Charts. REF: Stockcharts10Y, Stockcharts2Y

Len writes much of his own content, and also shares helpful content from other trusted providers like Turner Financial Group (TFG).
The material contained herein is intended as a general market commentary, solely for informational purposes and is not intended to make an offer or solicitation for the sale or purchase of any securities. Such views are subject to change at any time without notice due to changes in market or economic conditions and may not necessarily come to pass. This information is not intended as a specific offer of investment services by Dedicated Financial and Turner Financial Group, Inc.
Dedicated Financial and Turner Financial Group, Inc., do not provide tax, legal or accounting advice. You should consult your own tax, legal and accounting advisors before engaging in any transaction.
Any hyperlinks in this document that connect to Web Sites maintained by third parties are provided for convenience only. Turner Financial Group, Inc. has not verified the accuracy of any information contained within the links and the provision of such links does not constitute a recommendation or endorsement of the company or the content by Dedicated Financial or Turner Financial Group, Inc. The prices/quotes/statistics referenced herein have been obtained from sources verified to be reliable for their accuracy or completeness and may be subject to change.
Past performance is no guarantee of future returns. Investing involves risk and possible loss of principal capital. The views and strategies described herein may not be suitable for all investors. To the extent referenced herein, real estate, hedge funds, and other private investments can present significant risks, including loss of the original amount invested. All indexes are unmanaged, and an individual cannot invest directly in an index. Index returns do not include fees or expenses.
Turner Financial Group, Inc. is an Investment Adviser registered with the United States Securities and Exchange Commission however, such registration does not imply a certain level of skill or training and no inference to the contrary should be made. Additional information about Turner Financial Group, Inc. is also available at www.adviserinfo.sec.gov. Advisory services are only offered to clients or prospective clients where Turner Financial Group, Inc. and its representatives are properly licensed or exempt from licensure. No advice may be rendered by Turner Financial Group, Inc. unless a client service agreement is in place.


