

- 1. Recent U.S. economic data for November 2025 shows cooling inflation alongside labor market softening and manufacturing weakness.
- 2. Main story this week focuses on The New Cold War. The “New Cold War” refers to the intensifying US-China technological rivalry in artificial intelligence (AI), focused on dominance in innovation, supply chains, talent, and standards-setting, without direct military conflict.
- 3. TikTok’s parent company, ByteDance, has signed a deal to form a new US joint venture to avoid a ban, with the agreement receiving approval from both US President Trump and Chinese President Xi Jinping.
- 4. World Watch
- 4A. EY Parthenon surveyed 1,200 CEOs showed despite volatility, 52% of CEOs are investing in transformation.
- 4B. India is grappling with severe air pollution in December 2025, particularly in Delhi and northern regions, where AQI levels have hit the “severe” category, disrupting businesses, travel, and daily life.
- 4C. An updated snapshot of the current global state of economy.
- 5. Quant & Technical Corner – A selection of quantitative & technical data we monitor on a regular basis to help gauge the overall financial market conditions and the investment environment.
1. Recent U.S. economic data for November 2025 shows cooling inflation alongside labor market softening and manufacturing weakness.
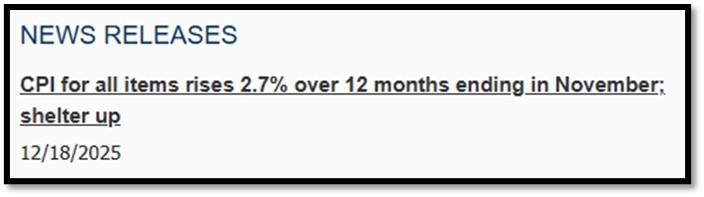
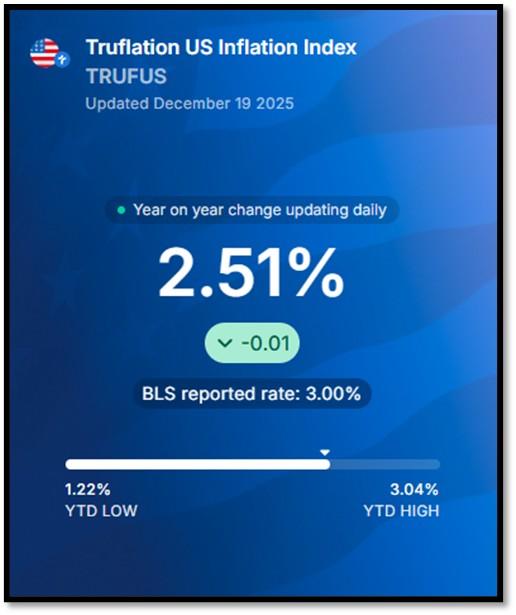
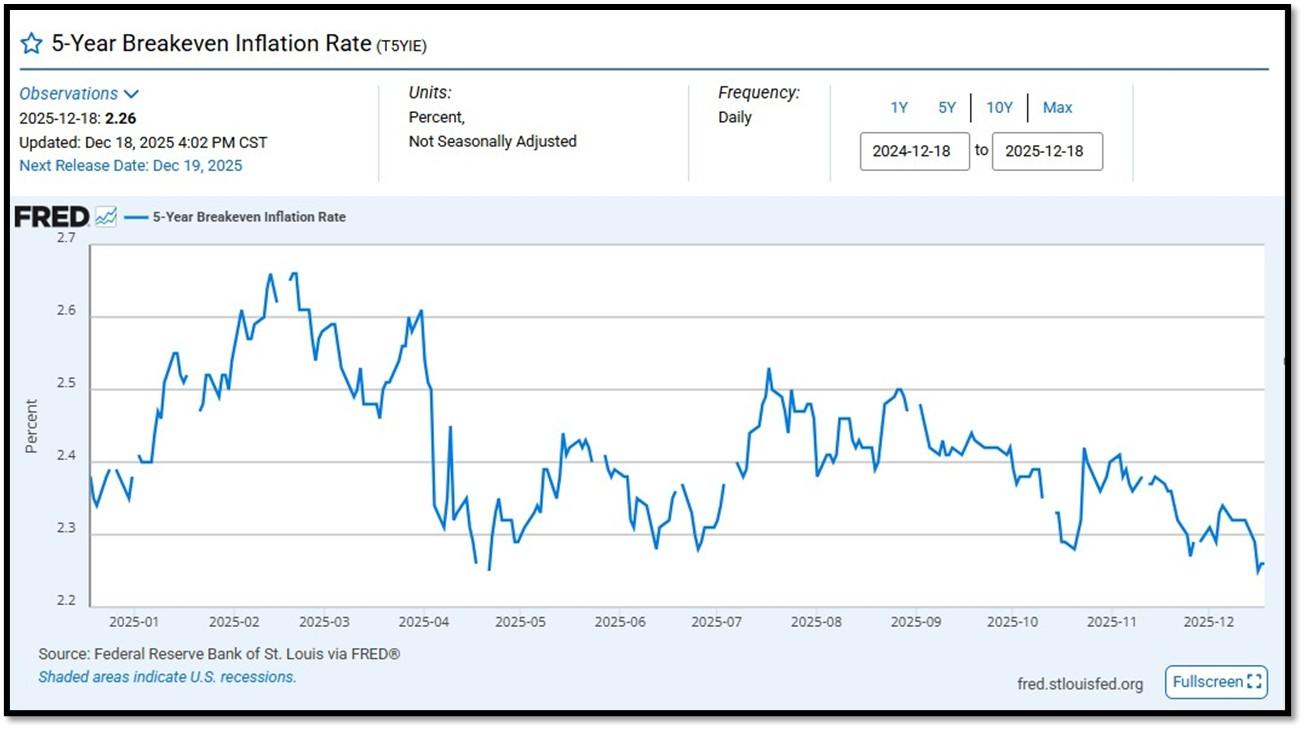
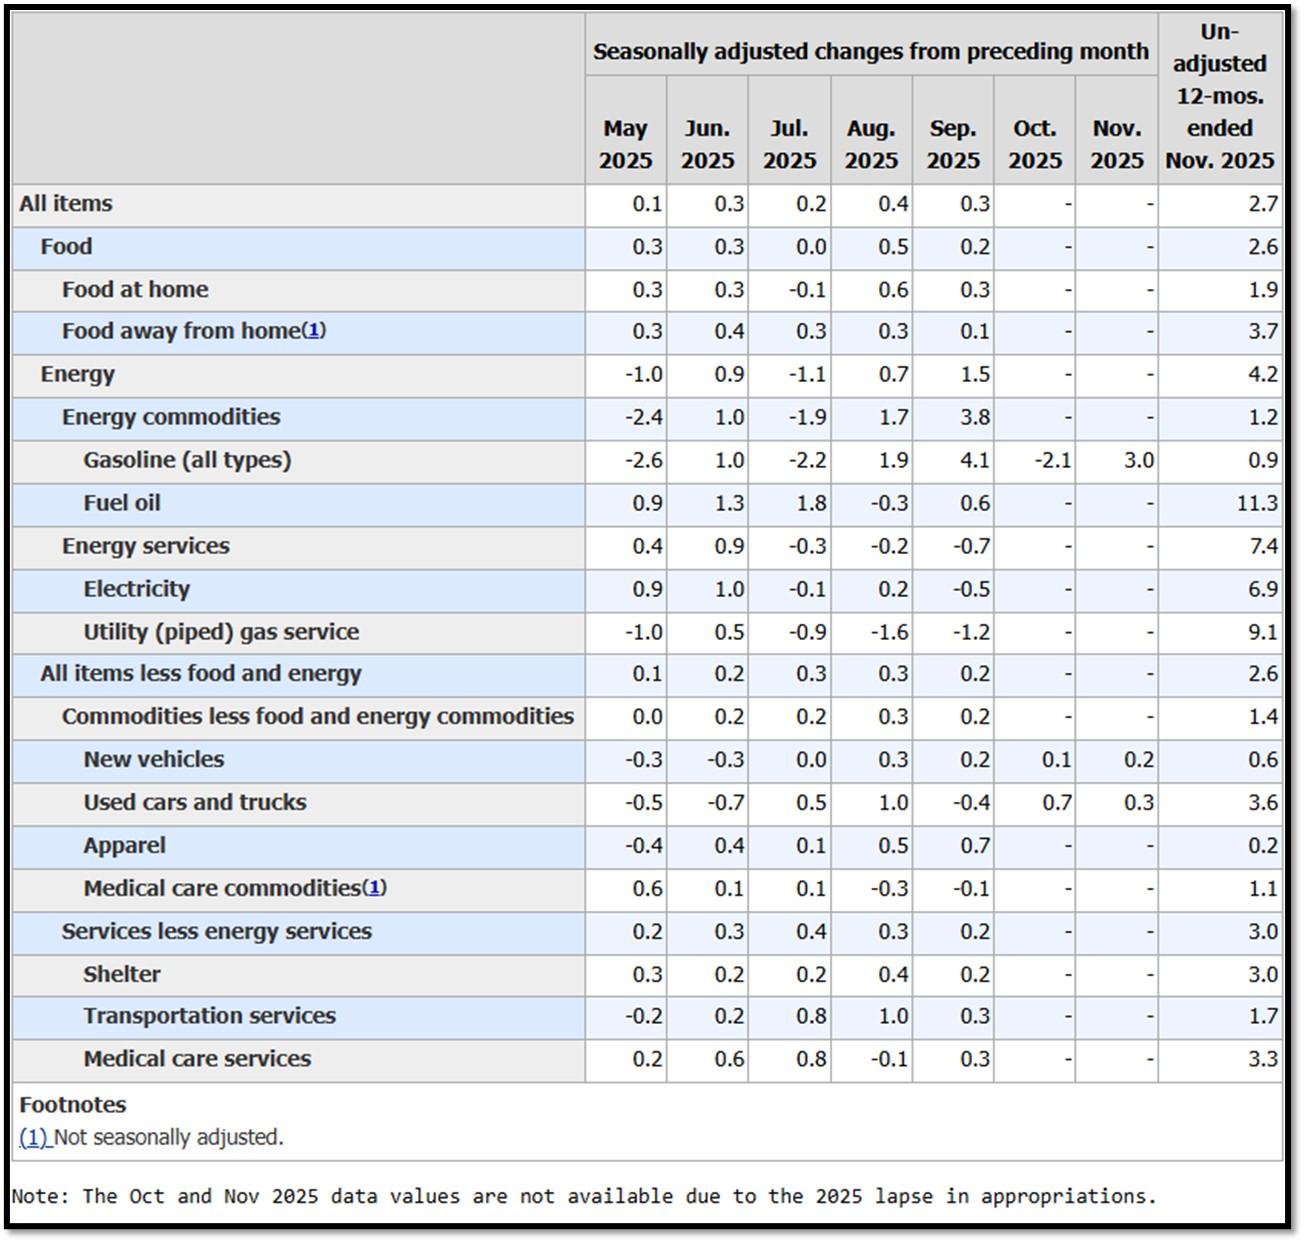
The CPI rose 2.7% year-over-year, below forecasts of 3.1%, with a modest 0.2% rise over October to November due to government shutdown delays. Alternative indicators like Truflation’s 2.51% and the St. Louis Fed’s 5-year breakeven rate near a 12-month low of 2.26% confirm subdued pressures. Economists criticize the CPI as distorted (citing zero housing inflation assumptions and shutdown effects) arguing it masks tariff-driven rises, but deflationary forces like falling goods and energy prices are strongly offsetting these. For once, these three data points measuring inflation are somewhat aligned. My take is further deflation will appear as a result of productivity gains from AI. See item 5K further below for additional information.
The unemployment rate hit 4.6%, above the 4.5% consensus and a four-year high, with only 64,000 payroll gains focused on healthcare and construction. The December Philadelphia Fed Manufacturing Index fell to -10.2, missing +2.3 expectations and marking a third straight contraction amid weak orders and shipments. These signals point to economic softening, potentially prompting Fed rate cuts, though distorted inflation complicates policy. While price pressures remain contained, rising unemployment and manufacturing woes signal slowdown risks, mitigated by deflationary offsets that blunt tariff impacts. REF: FRED, Truflation, BLS
2. Main story this week focuses on The New Cold War. The “New Cold War” refers to the intensifying US-China technological rivalry in artificial intelligence (AI), focused on dominance in innovation, supply chains, talent, and standards-setting, without direct military conflict.
The term AI Cold War first appeared in 2018 in an article in Wired magazine by Nicholas Thompson and Ian Bremmer. The two authors trace the emergence of the AI Cold War narrative to 2017, when China published its AI Development Plan, which included a strategy aimed at becoming the global leader in AI by 2030. Paralleling the US-Soviet era, it centers on economic and tech spheres, with AI key for dual-use in economies and defense. Escalating from China’s “Made in China 2025” (2015) targeting AI leadership by 2030, it met US countermeasures like chip export controls (since 2018), investment curbs, and the CHIPS Act (2022) for domestic production. The US relies on private-sector ecosystems, while China uses heavy subsidies and vast data from its population and regulations.

Highlights include US bans on advanced semiconductors (e.g., Nvidia chips to China), spurring China’s self-reliance that narrowed an 80% AI model gap by 2024; talent competition (China holds 18% of top researchers); military applications like China’s AI “supersoldiers” and US secure alliances; quantum progress, including China’s March 2025 satellite launches; and the newest development in early December 2025, where President Trump approved Nvidia exporting its H200 AI chips to approved Chinese customers, with a 25% fee to the US government. As of December 2025, decoupling intensifies, with US controls and $500 billion Stargate data centers versus China’s $138 billion AI funds and efficient models (e.g., DeepSeek‘s R1, January 2025).
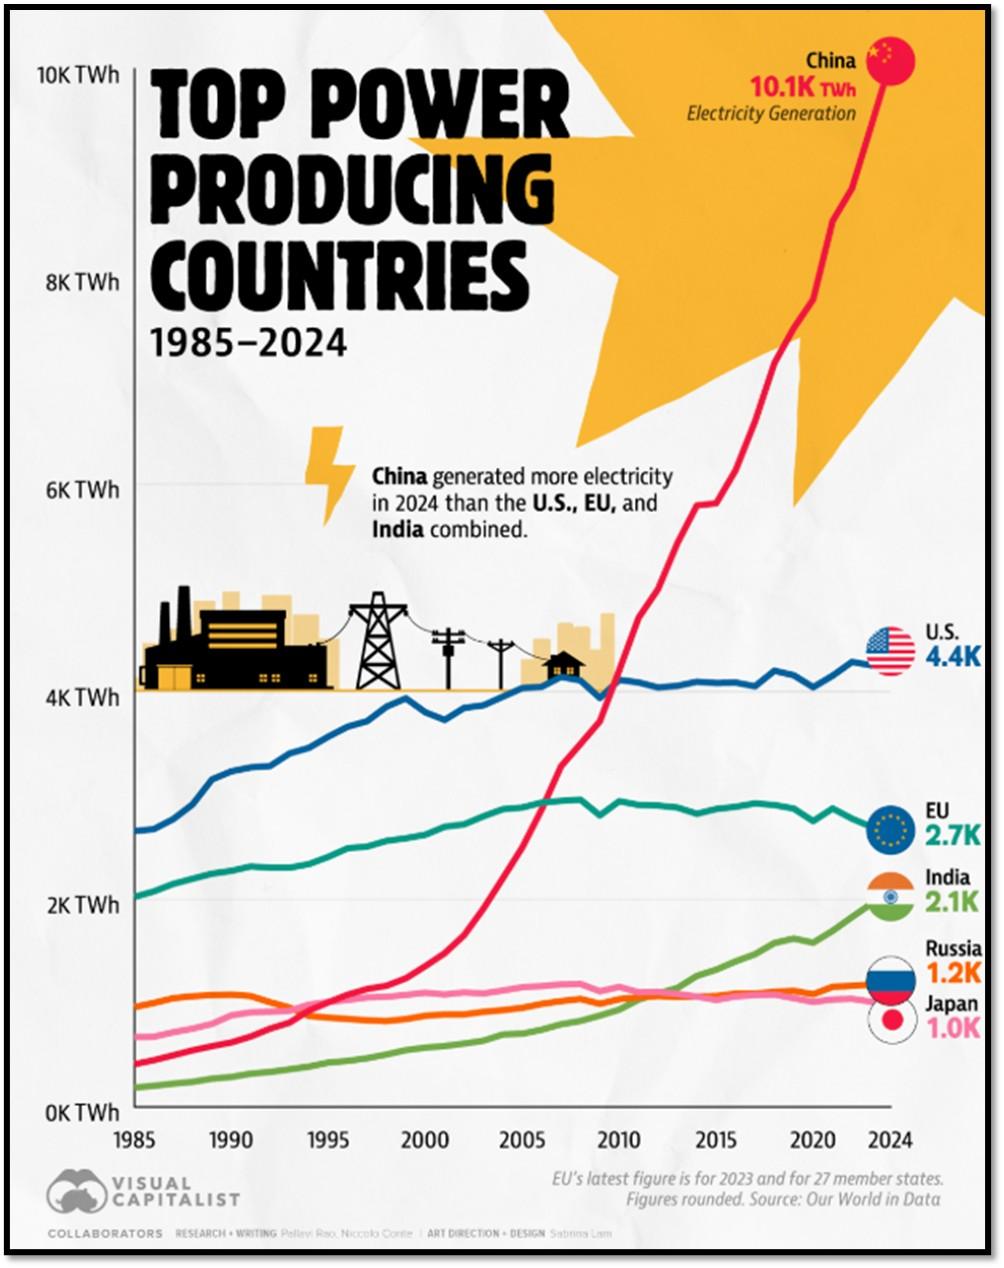
In hardware, the US leads in advanced design (90% EDA tools), equipment, and data-center capacity (45 GW vs. China’s 20 GW), supported by $450 billion investments and CHIPS Act goals for 23% leading-edge production by 2030. Yet China dominates rare earths (70-99% US supply), legacy/power chips through subsidies, indigenous advances (Huawei, SMIC) despite bans, and electricity generation capacity—critical for AI’s massive energy needs in training and data centers. In software, the US excels in foundational/high-impact models (40 in 2024 vs. China’s 15), research, and generative AI (OpenAI, Google), with $109 billion investment. China tops patents (2.3x more), applications (vision/NLP), and deployment (surveillance/smart cities), with $60 billion annual R&D.
Economically, AI could add $15.7 trillion globally by 2030 through productivity, but bifurcation risks over $1 trillion in restructuring and duplication. For the US, it protects security and adds jobs (e.g., 37,000 via incentives), but inflates costs, exposes input vulnerabilities (For example: 80% biotech materials are from China), and risks innovation slowdowns from talent shortages (100,000 engineers by 2030). For China, it boosts self-sufficiency and influence (e.g., cheap AI undercutting rivals), but restrictions may curb growth, heighten dependencies, provoke retaliation, and widen inequality in a fragmented global economy. Click onto picture below to access video with Jim Bianco. REF: WIRED, Forbes, VisualCapitalist, Bianco
3. TikTok’s parent company, ByteDance, has signed a deal to form a new US joint venture to avoid a ban, with the agreement receiving approval from both US President Trump and Chinese President Xi Jinping.
The three companies each owning 15% are:
- Oracle (tech giant providing cloud and algorithm licensing),
- Silver Lake (private equity firm with tech investments), and
- MGX (Abu Dhabi-based sovereign wealth fund Mubadala’s tech arm).
ByteDance retains 19.9%, while affiliates of its existing investors hold the remaining 30.1%. Key terms include Oracle licensing and retraining TikTok’s algorithm on US user data to prevent external manipulation, with the deal set to close on January 22, 2026. Highlights that stand out include resolving national security concerns by shifting majority control from ByteDance and averting a ban affecting 170 million US users, though critics argue it insufficiently protects privacy. Economically, allowing TikTok to operate sustains activity for over 170 million users and supports more than seven million small businesses through favorable profit-sharing, boosting advertising revenue, content creation jobs, and e-commerce. It preserves thousands of US-based TikTok jobs and fosters competition in social media, potentially driving innovation and lower ad costs, though ongoing privacy risks could lead to regulatory costs or fines. Click onto picture below to access video. REF: PBS, BBC
NOTE: Not investment advice or recommendations. Investors should carefully consider the investment objectives, risks, charges, and expenses before investing. For additional information about the securities mentioned above, please visit the respective security’s investor relations pages for additional information. Please read all materials carefully before investing.
With the current macro-economic backdrop, below are areas we currently favor:
- Fixed Income – (Corporates & Muni) High Yield as Opportunistic Allocation (Low-Beta)
- Fixed Income – Short-term Corporates & Muni (Low-Beta)
- Businesses that contribute to and benefit from AI & Automation (Market-Risk)
- Small-Cap & Bio-Technology (Market-Risk)
- Neo-Cloud Computing (Market-Risk)
- Fintech & Financials (Market-Risk)
- Digital Asset – Bitcoin (Market-Risk/Hedge)
- Cyber-Security & Software (Market-Risk)
- Quantum Computing (Market-Risk)
4. World Watch
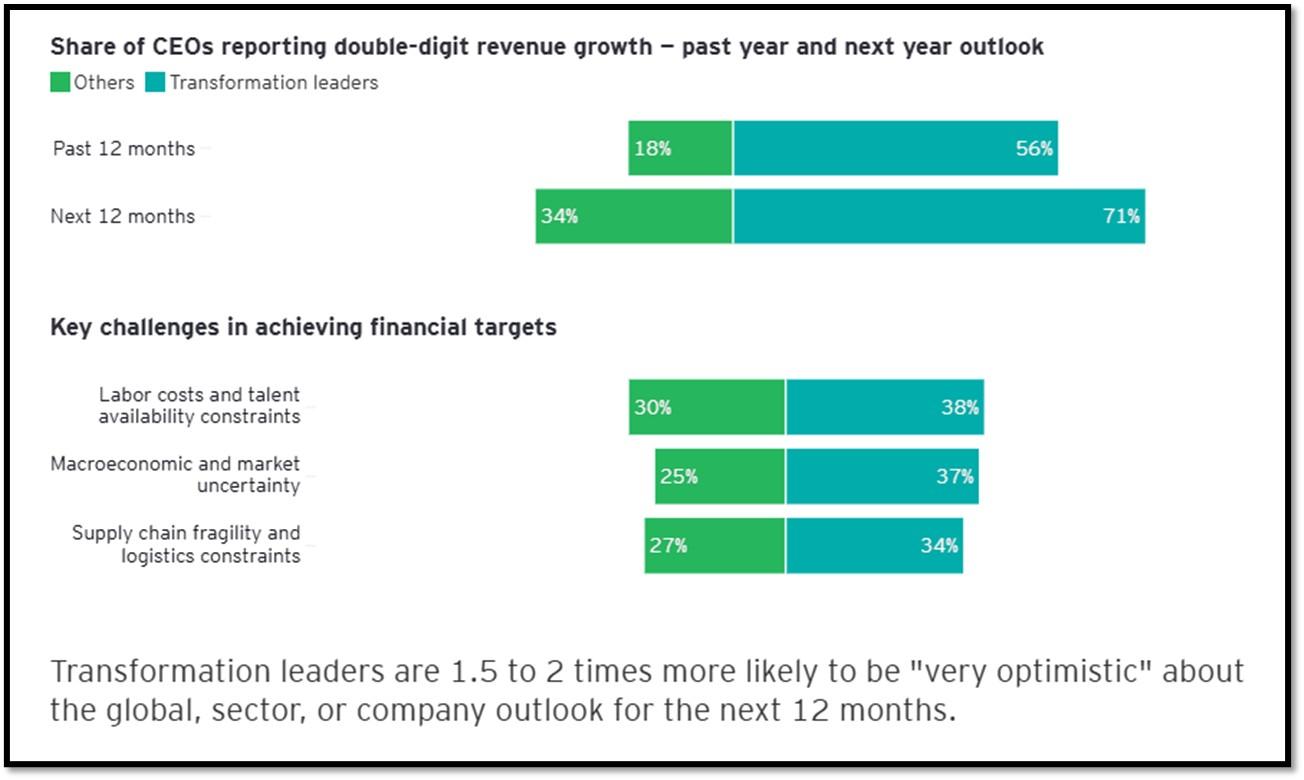
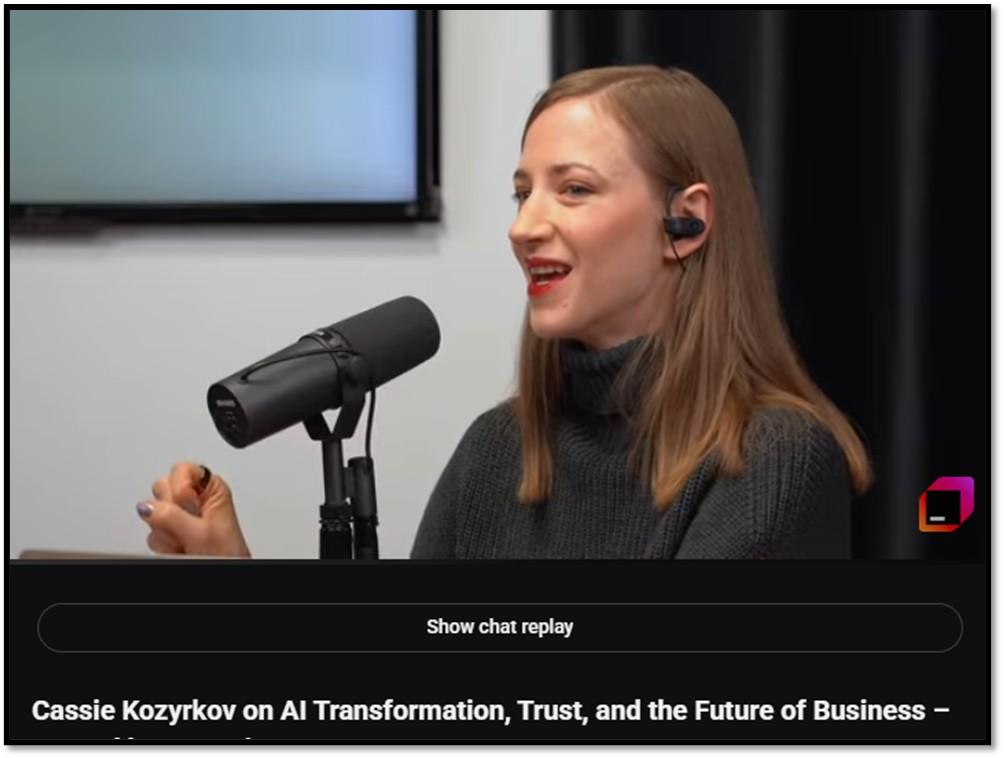
4A. EY Parthenon surveyed 1,200 CEOs showed despite volatility, 52% of CEOs are investing in transformation.
Despite 57% of respondents expecting geopolitical and economic volatility to persist beyond one year (with 24% forecasting it to last more than three years), driven by factors like trade tensions, tariffs, technology disruptions, and supply chain fragility, CEOs are not retreating. Instead, over half (52%) plan to increase investments to accelerate portfolio transformation, which involves reshaping business models, entering new markets, and leveraging technologies like AI for efficiency and innovation. This proactive approach stems from growing confidence in navigating turbulence, as evidenced by the EY-Parthenon CEO Confidence Index rising to 83 from 76.5 in May 2025, fueled by stronger earnings, adaptable operations, and access to capital.
This data implies positive economic implications for 2026-2027, as CEOs’ focus on transformation could drive sustained growth through increased M&A (with alliances and joint ventures emphasized for acquiring skills and tech), localization of supply chains (75% have already localized production, enhancing resilience and creating domestic jobs), and innovation investments amid a “great supply chain reset.” However, short-term headwinds like inflation (cited by 79% as a key risk), rising costs from regionalization, and regulatory scrutiny could strain margins and slow progress, potentially exacerbating inequality in fractured global markets if volatility persists longer than anticipated. Click onto picture further below to access video with Cassie Kozyrkov. REF: EYP-URL, Report
4B. India is grappling with severe air pollution in December 2025, particularly in Delhi and northern regions, where AQI levels have hit the “severe” category, disrupting businesses, travel, and daily life.
Under the Graded Response Action Plan (GRAP) Stage IV, the government has imposed strict measures, including bans on construction, restrictions on diesel vehicles, hybrid schooling, and starting December 18, a mandate requiring 50% of employees in government and private offices in Delhi to work from home, with fines for non-compliance. The pollution stems from a mix of vehicular and industrial emissions, construction dust, farm stubble burning, and winter weather trapping pollutants. Biomass cooking in urban slums also contributes to both household and ambient pollution.
Economically, air pollution costs India approximately 3% of GDP annually (around $95 billion in 2025), through healthcare burdens, premature deaths (1.7 million per year), lost productivity, reduced consumer spending, and immediate disruptions like halted construction projects, work-from-home mandates affecting operations, and logistics delays. Over the long term, it strains labor markets and exacerbates inequality, though sustained clean air efforts could generate co-benefits such as jobs in green sectors. Click onto pictures below to access videos. REF: BBC, NewIndianExpress, ScienceDirect


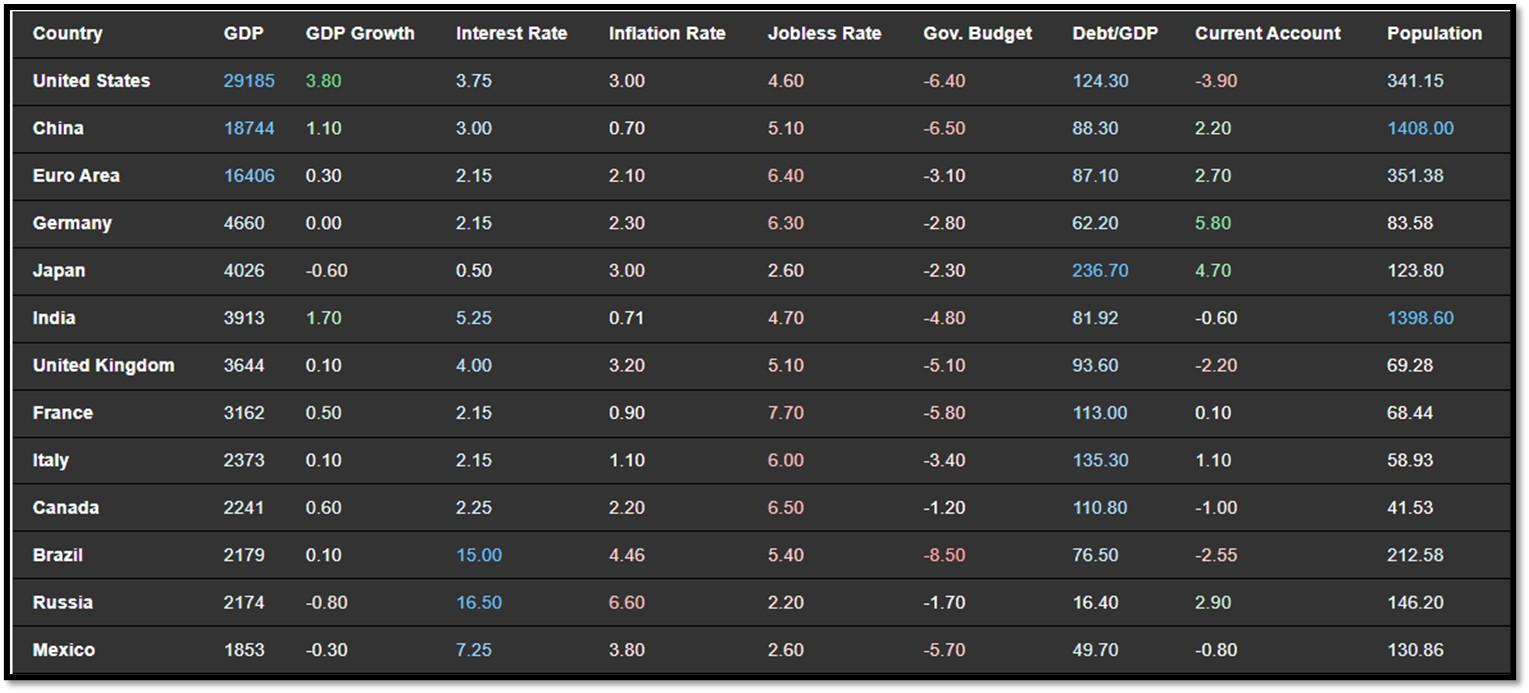
4C. An updated snapshot of the current global state of economy.
According to TradingEconomics as of 12/17/2025, REF: TradingEconomics:
- The Federal Reserve cut the federal funds rate by 25 bps to a range of 3.5%–3.75% in its December 2025 meeting, following similar reductions in September and October, and in line with expectations .
- The US unemployment rate increased to 4.6% in November 2025 from 4.4% in September, exceeding market expectations of 4.4% and marking the highest level since September 2021.
- China’s annual inflation rate picked up to 0.7% in November 2025 from 0.2% in the prior month, aligning with market consensus and marking the highest level since February 2024.
- India’s consumer price inflation picked up to 0.71% year-on-year in November 2025, rising from October’s record low of 0.25% and broadly matching the market consensus of 0.7%.
5. Quant & Technical Corner – A selection of quantitative & technical data we monitor on a regular basis to help gauge the overall financial market conditions and the investment environment.
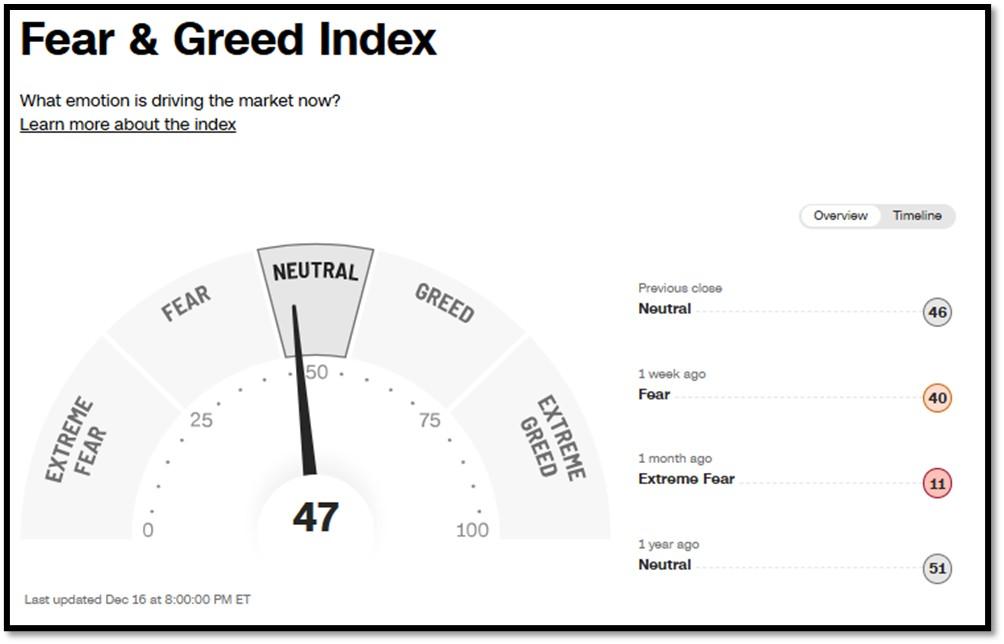
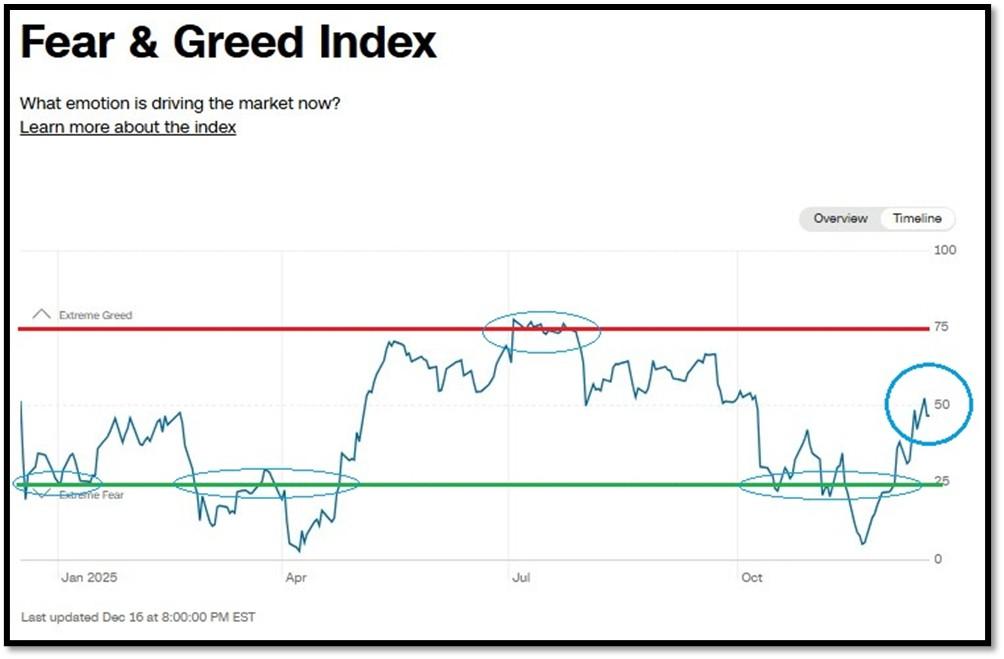
5A. Most recent read on the Fear & Greed Index with data as of 12/16/2025 – 8:00 PM-ET is 47 (Neutral). Last week’s data was 40 (Fear) (1-100). CNNMoney’s Fear & Greed index looks at 7 indicators (Stock Price Momentum, Stock Price Strength, Stock Price Breadth, Put and Call Options, Junk Bond Demand, Market Volatility, and Safe Haven Demand). Keep in mind this is a contrarian indicator! REF: Fear&Greed via CNNMoney
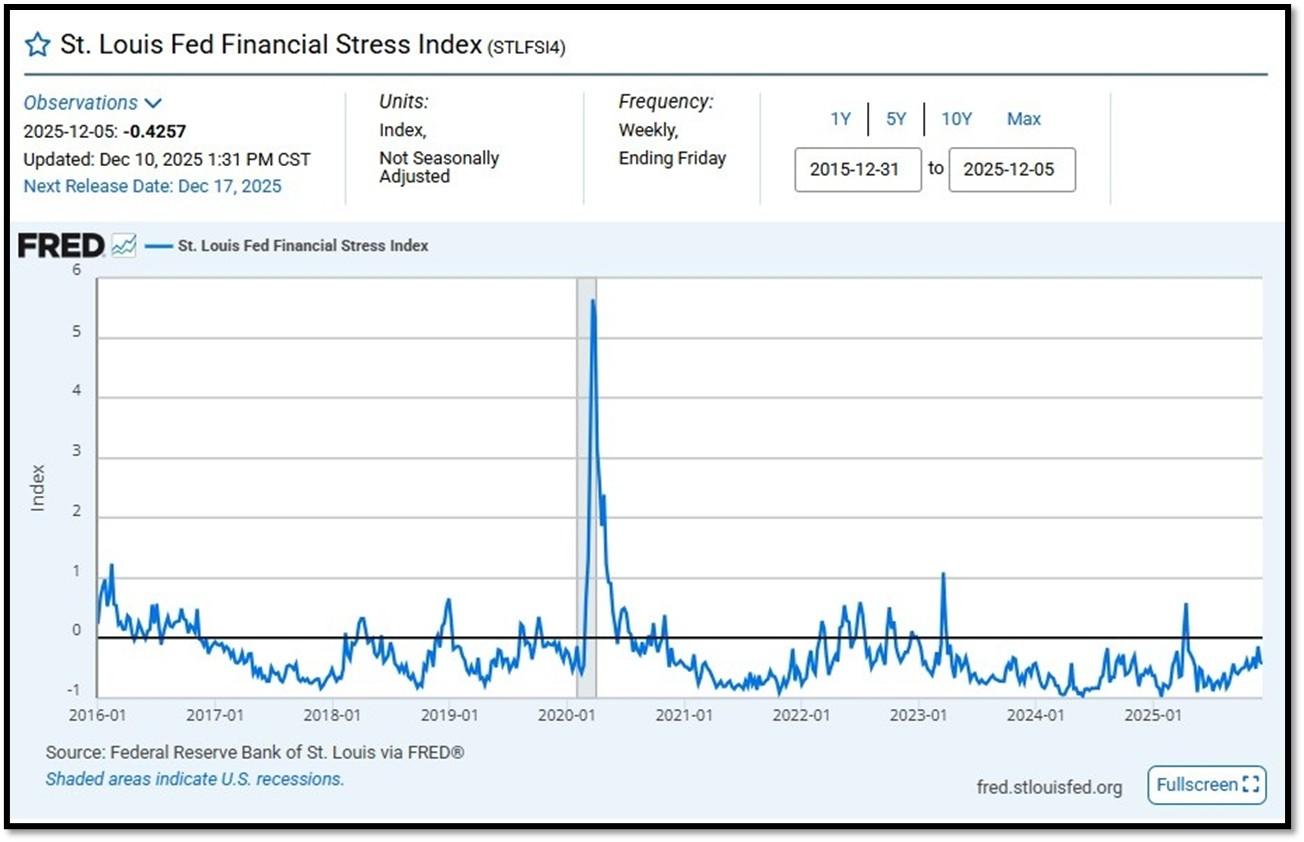
5B. St. Louis Fed Financial Stress Index’s (STLFSI4) most recent read is at –0.4257 as of December 10, 2025. Previous week’s data was -0.3964. A big spike up from previous readings reflecting the turmoil in the banking sector back in 2023. This weekly index is not seasonally adjusted. The STLFSI4 measures the degree of financial stress in the markets and is constructed from 18 weekly data series: seven interest rate series, six yield spreads and five other indicators. Each of these variables captures some aspect of financial stress. Accordingly, as the level of financial stress in the economy changes, the data series are likely to move together. REF: St. Louis Fed
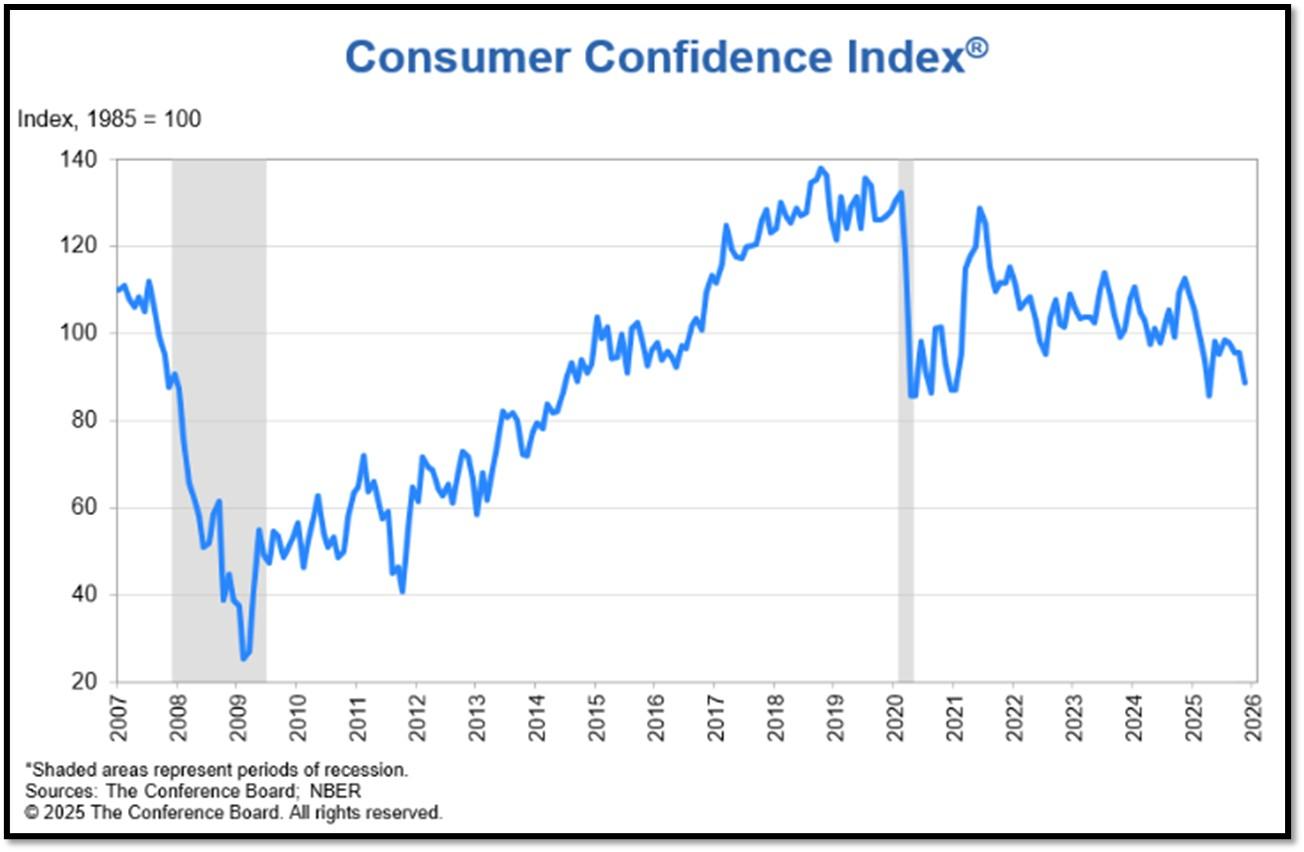
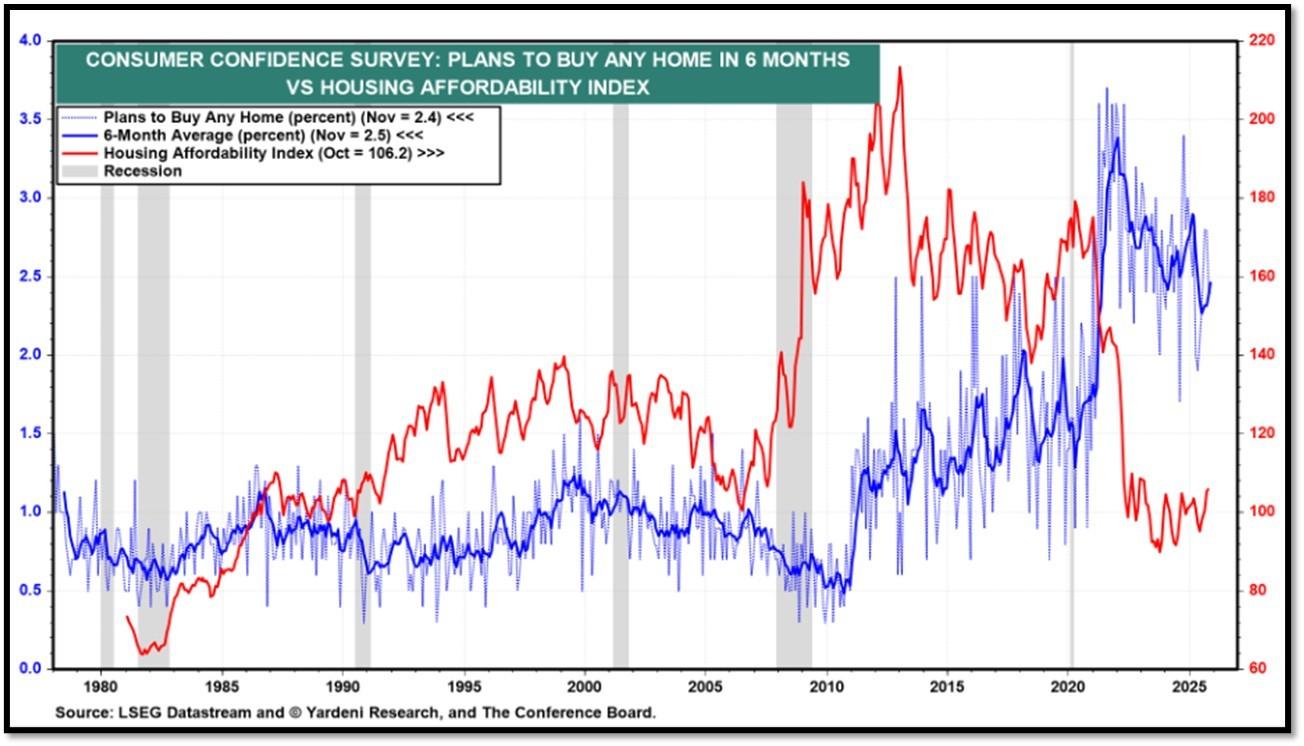
5C. Consumers revealed reduced confidence across jobs, incomes, and financial situations, both now and in the future, potentially due to the government shutdown. The Conference Board Consumer Confidence Index® declined by 6.8 points in November to 88.7 (1985=100) from 95.5 in October. “Consumer confidence tumbled in November to its lowest level since April after moving sideways for several months,” said Dana M Peterson, Chief Economist, The Conference Board. “All five components of the overall index flagged or remained weak. REF: ConsumerConfidence
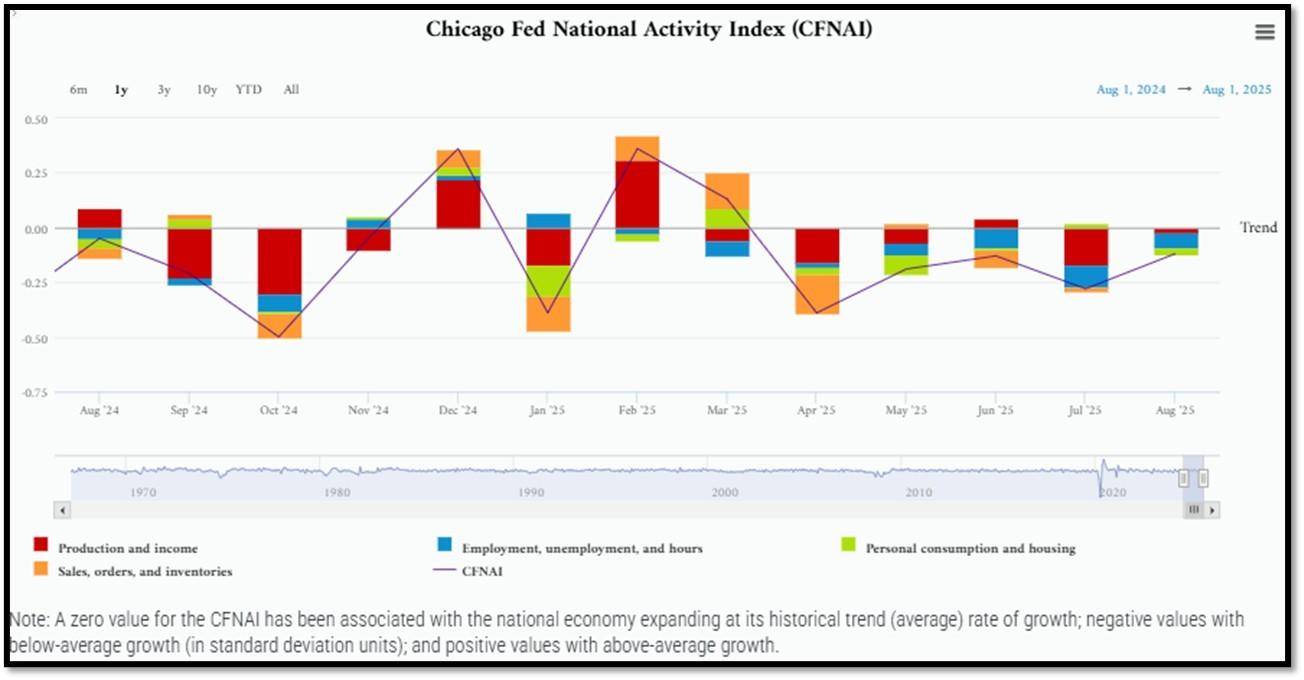
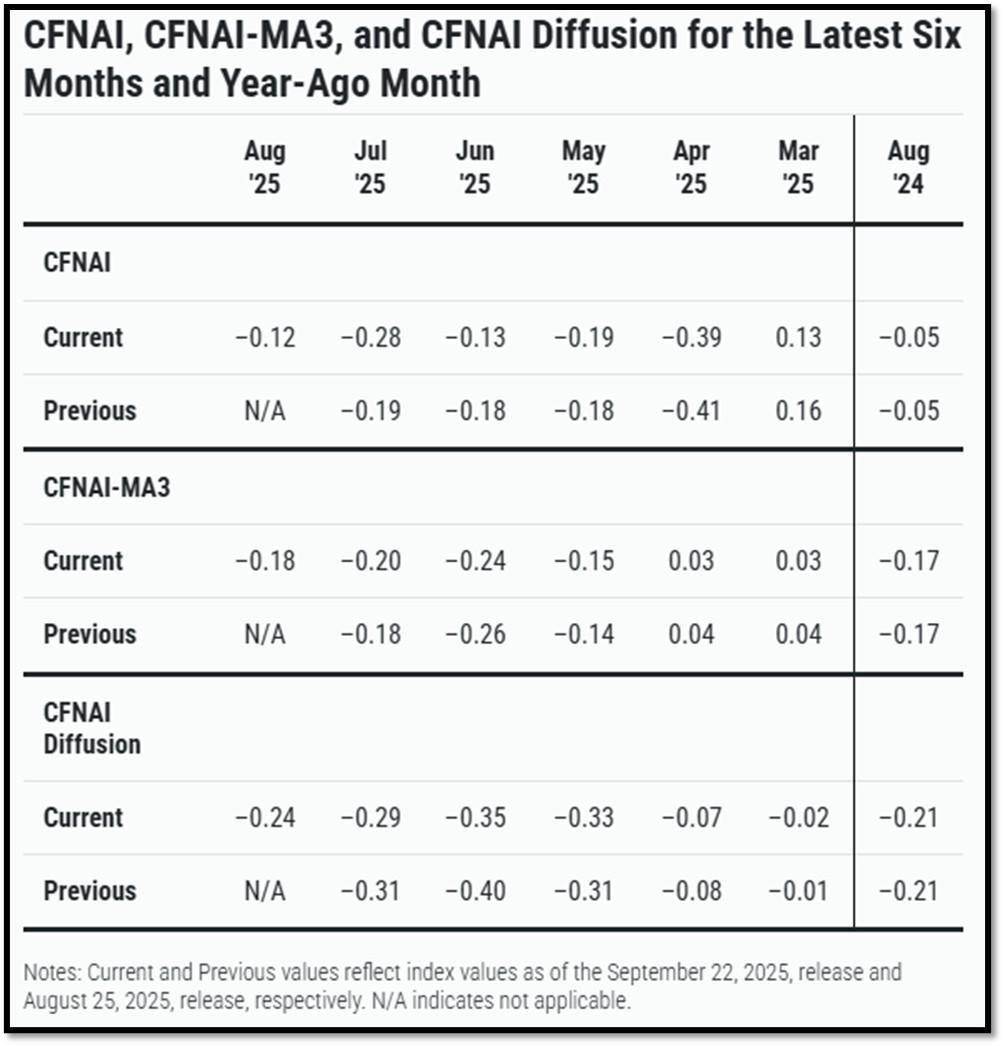
5D. The Chicago Fed National Activity Index (CFNAI) increased to –0.12 in August from –0.28 in July. Three of the four broad categories of indicators used to construct the index increased from July, but three categories made negative contributions in August. The index’s three-month moving average, CFNAI-MA3, increased to –0.18 in August from –0.20 in July. REF: ChicagoFed, August’s Report
5E. (12/9/2025) The Conference Board Leading Economic Index® (LEI) for the US declined by 0.3% in September 2025 to 98.3 (2016=100), after also declining by 0.3% in August (upwardly revised from an originally reported 0.5% decline). Overall, the LEI fell by 2.1% over the six months between March and September 2025, a faster rate of decline than its 1.3% contraction over the previous six-month period (September 2024 to March 2025). The composite economic indexes are the key elements in an analytic system designed to signal peaks and troughs in the business cycle. The indexes are constructed to summarize and reveal common turning points in the economy in a clearer and more convincing manner than any individual component. The CEI is highly correlated with real GDP. The LEI is a predictive variable that anticipates (or “leads”) turning points in the business cycle by around 7 months. Shaded areas denote recession periods or economic contractions. The dates above the shaded areas show the chronology of peaks and troughs in the business cycle. The ten components of The Conference Board Leading Economic Index® for the U.S. include: Average weekly hours in manufacturing; Average weekly initial claims for unemployment insurance; Manufacturers’ new orders for consumer goods and materials; ISM® Index of New Orders; Manufacturers’ new orders for nondefense capital goods excluding aircraft orders; Building permits for new private housing units; S&P 500® Index of Stock Prices; Leading Credit Index™; Interest rate spread (10-year Treasury bonds less federal funds rate); Average consumer expectations for business conditions. REF: ConferenceBoard, LEI Report for August (ReceesionAlert) (Released on 9/30/2025)
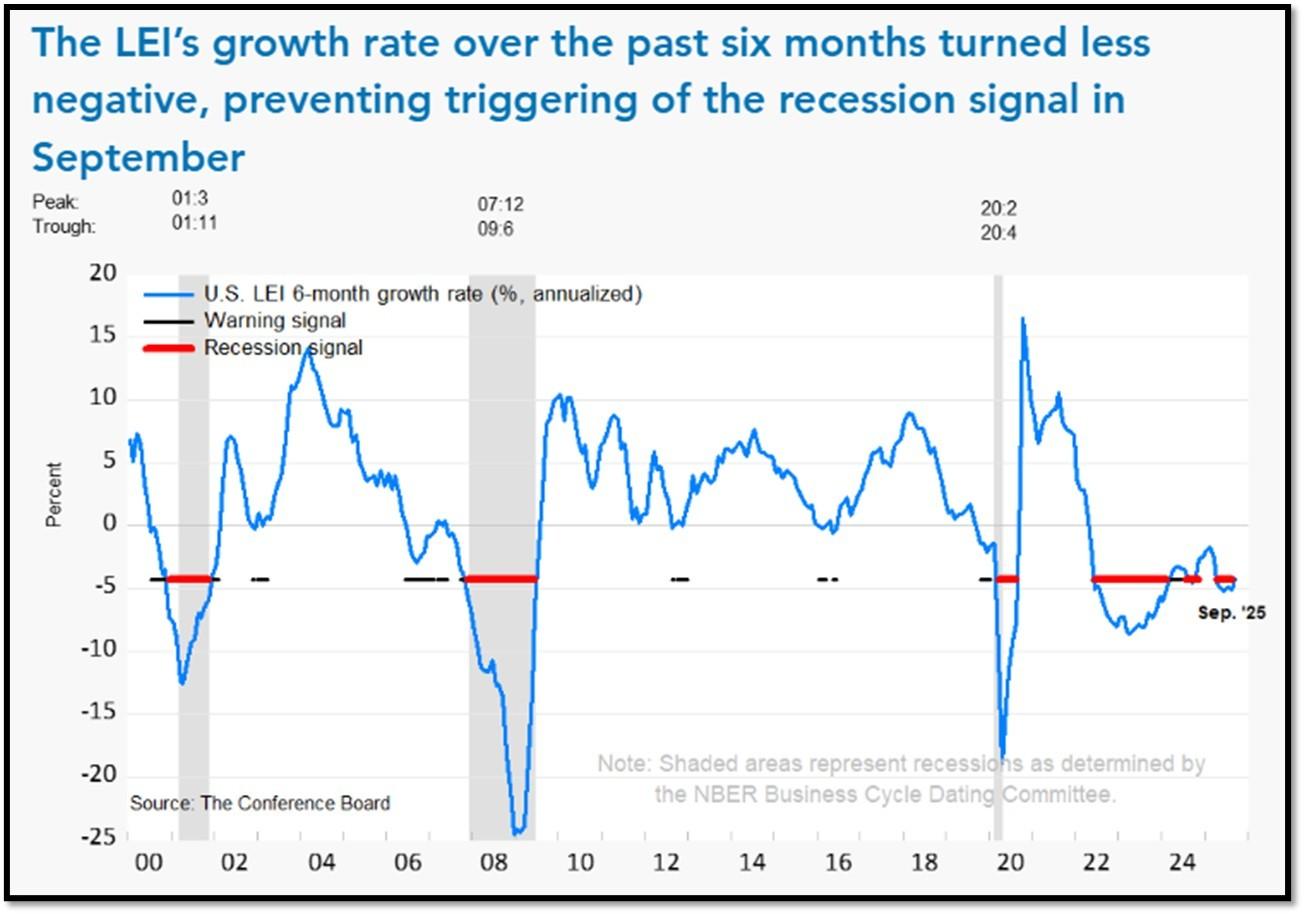
We have experienced a “rolling recession” since June 2022 and are only now emerging from it. However, authorities are not labeling it a recession due to high employment data from June 2022-2025.
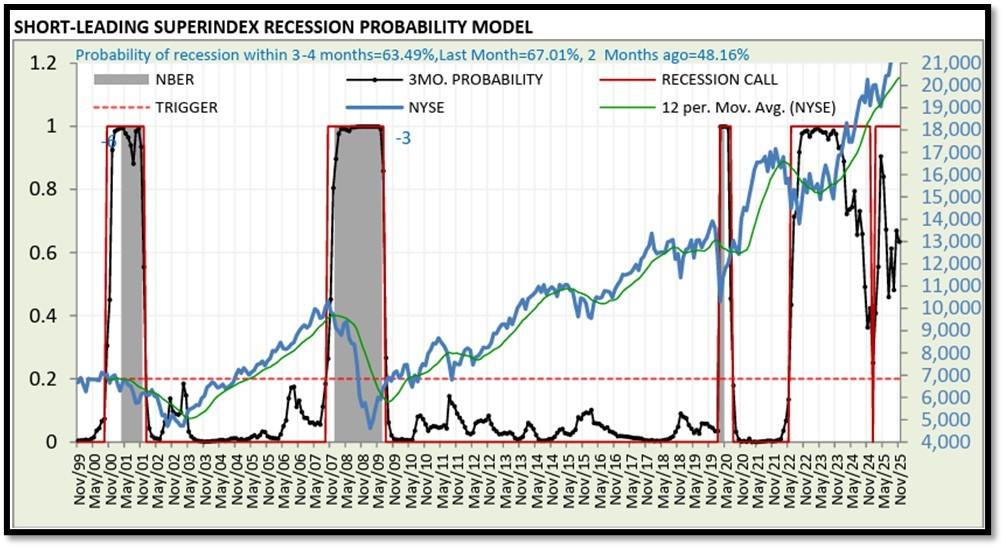
5F. Probability of U.S. falling into Recession within 3 to 4 months is currently at 63.49% (with data as of 12/01/2025 – Next Report 12/15/2025) according to RecessionAlert Research. Last release’s data was at 46.3%. This report is updated every two weeks. REF: RecessionAlertResearch
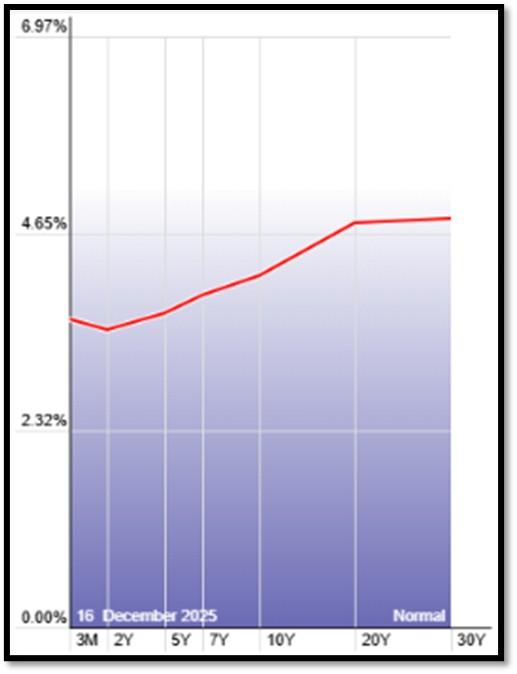
5G. Yield Curve as of 12/16/2025 is showing Normal. Spread on the 10-yr Treasury Yield (4.16%) minus yield on the 2-yr Treasury Yield (3.50%) is currently at 66bps. REF: Stockcharts The yield curve—specifically, the spread between the interest rates on the ten-year Treasury note and the three-month Treasury bill—is a valuable forecasting tool. It is simple to use and significantly outperforms other financial and macroeconomic indicators in predicting recessions two to six quarters ahead. REF: NYFED
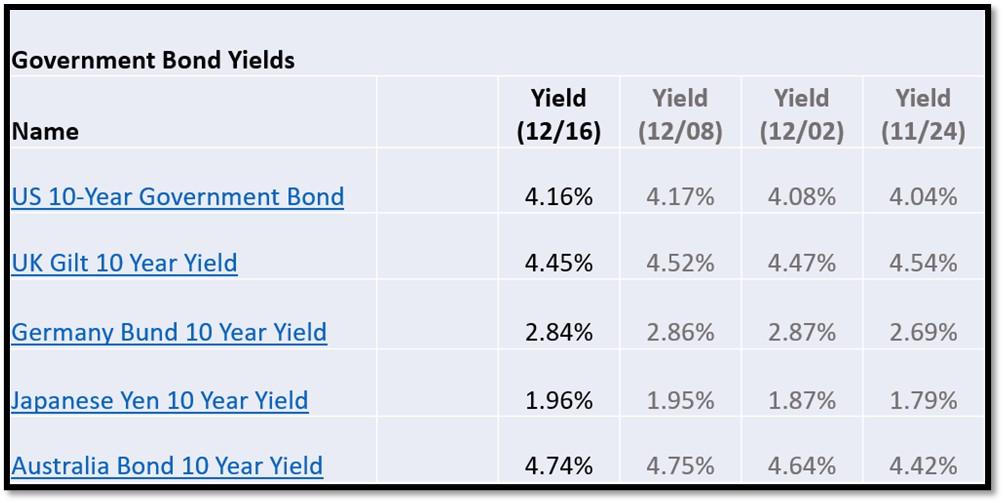
5H. Recent Yields in 10-Year Government Bonds. REF: Source is from Bloomberg.com, dated 12/16/2025, rates shown below are as of 12/16/2025, subject to change.
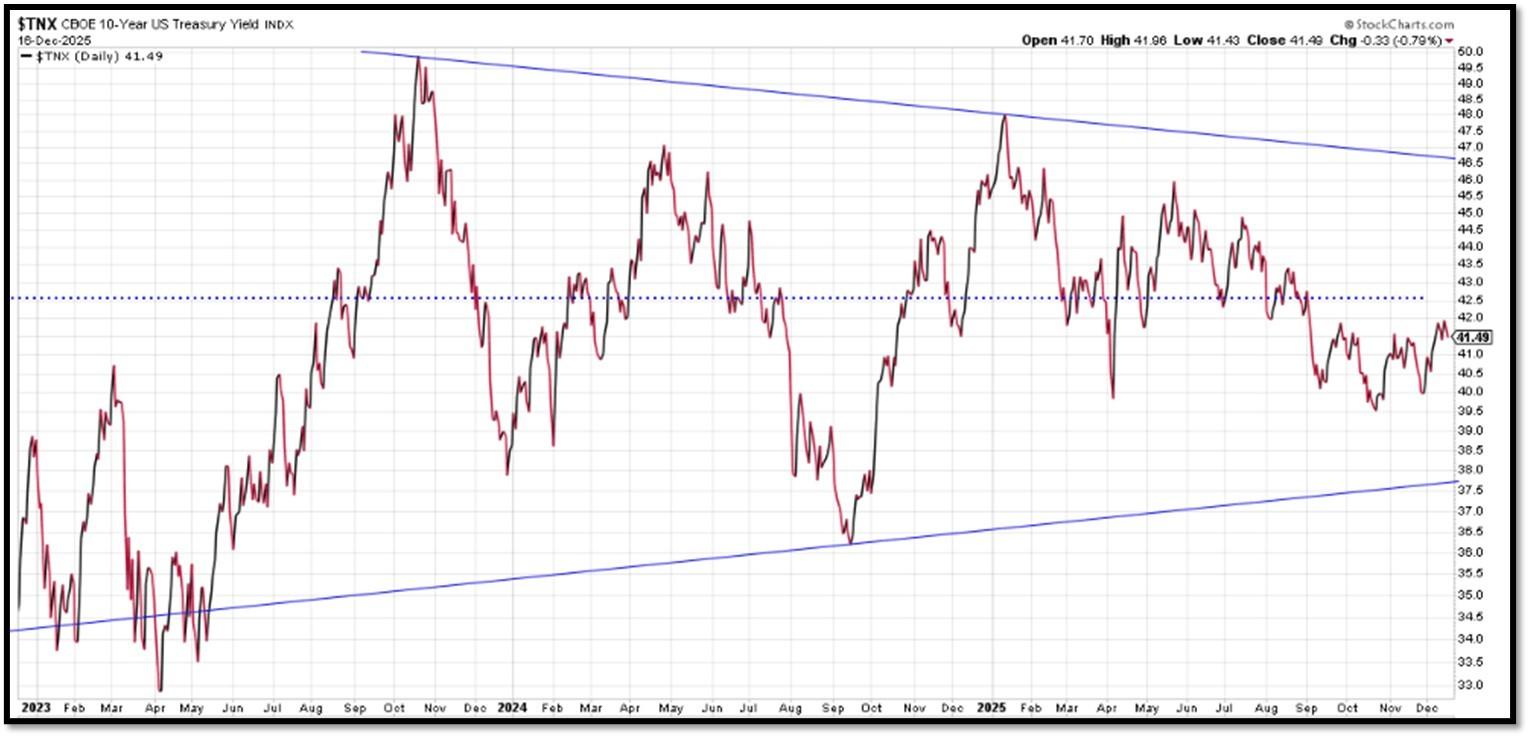
The 10-Year US Treasury Yield… The 10-Year Yield is indirectly related to inflation and prospect of the economy. I expect the 10-Year Yield to drop towards the support line. REF: StockCharts1
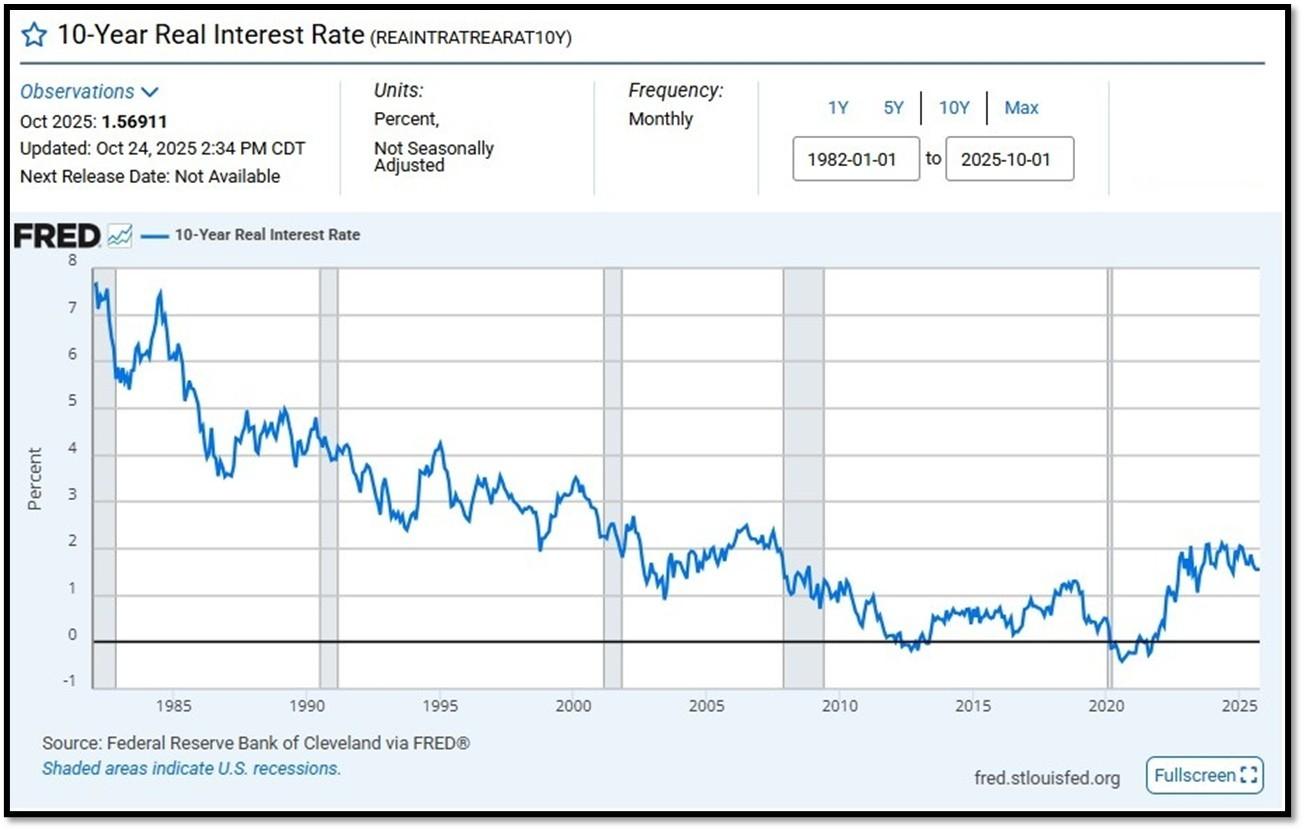
10-Year Real Interest Rate at 1.56911% as of 10/24/25. Last month’s data was 1.56046%. REF: REAINTRATREARAT10Y
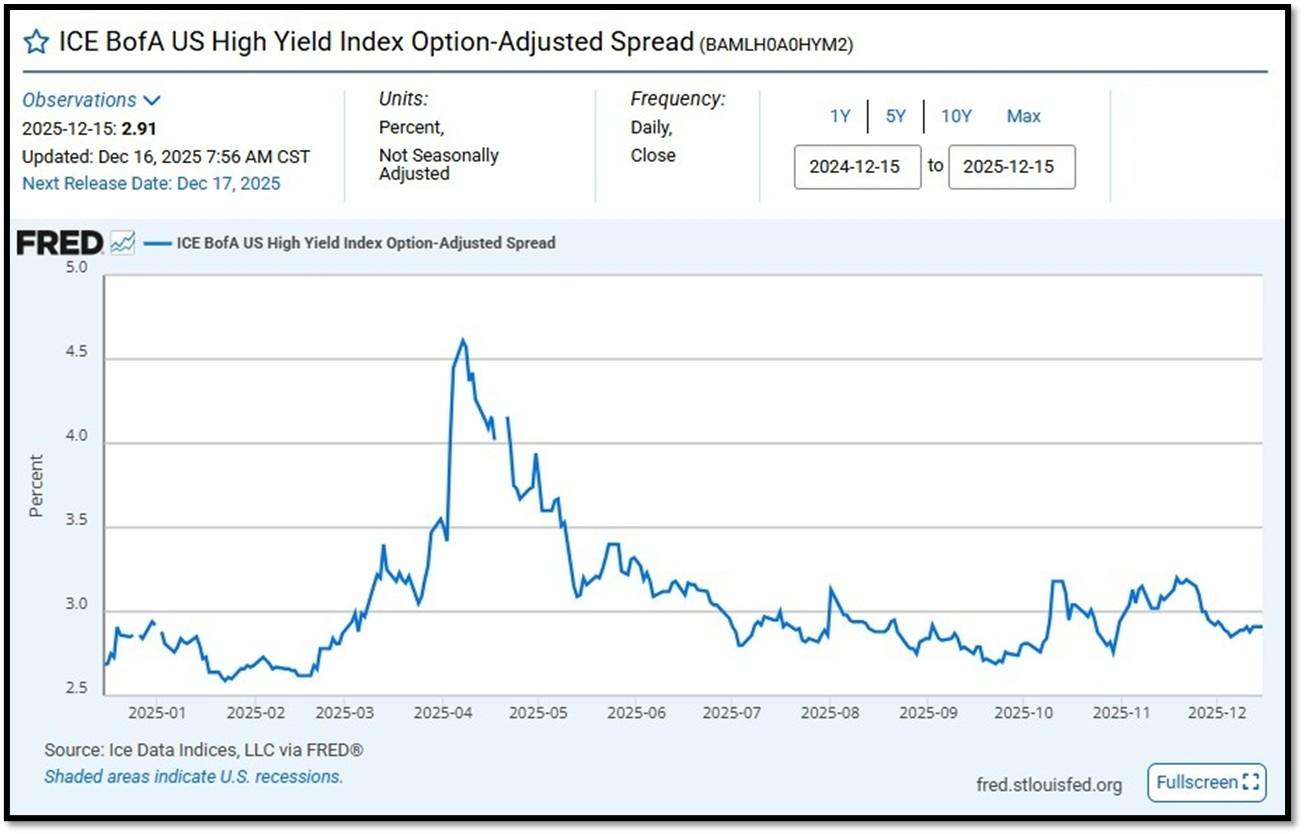
ICE BofA US High Yield Index Option-Adjusted Spread (BAMLH0A0HYM2) currently at 2.91 as of December 16, 2025. This is a key indicator of market sentiment, particularly regarding risk and economic health. At its core, the spread reflects the extra return investors demand to hold riskier corporate debt over safer government securities. High-yield bonds are issued by companies with lower credit ratings (below investment grade, like BB or lower), meaning they carry a higher chance of default. The spread compensates for this risk. When the spread is narrow—say, around 2.5% to 3%, as seen recently—it suggests investors are confident, willing to accept less extra yield because they perceive lower default risk or a strong economy. Narrow spreads often align with bullish markets, where cash is flowing, growth is steady, and fear is low. REF: FRED-BAMLH0A0HYM2
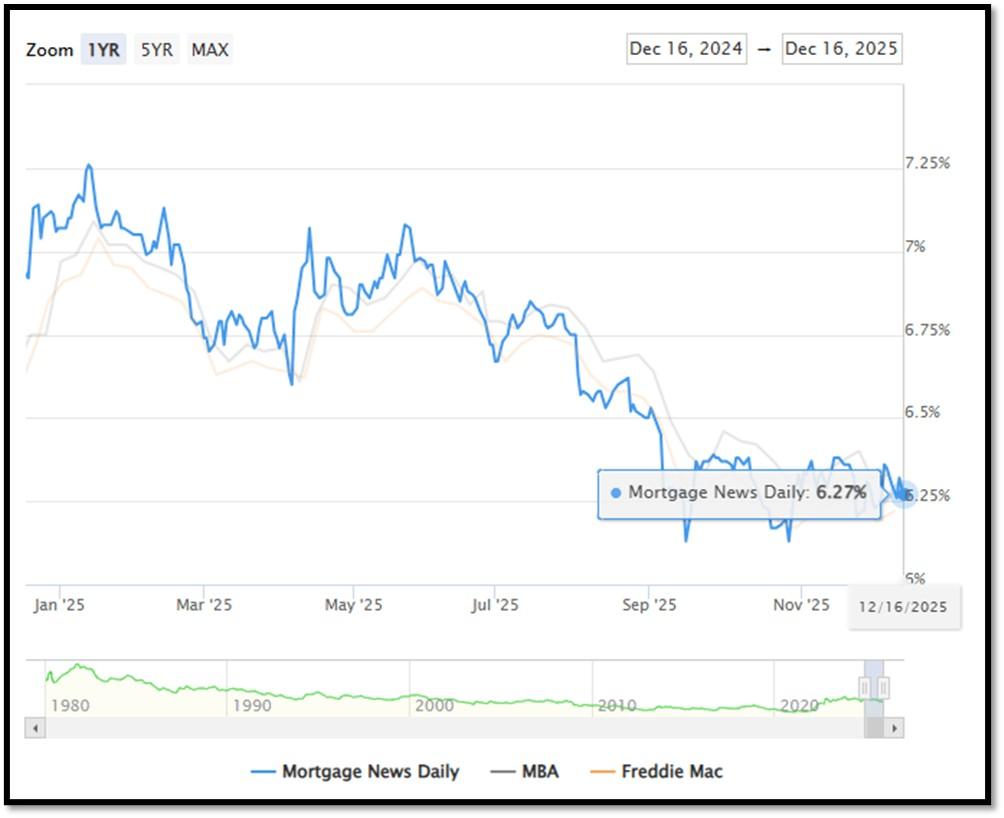
5I. (12/16/2025) Today’s National Average 30-Year Fixed Mortgage Rate is 6.27% (All Time High was 8.03% on 10/19/23). Last week’s data was 6.36%. This rate is the average 30-year fixed mortgage rates from several different surveys including Mortgage News Daily (daily index), Freddie Mac (weekly survey), Mortgage Bankers Association (weekly survey) and FHFA (monthly survey). REF: MortgageNewsDaily, Today’s Average Rate
The recent spike in the 30-year fixed-rate jumbo mortgage to 6.27%, compared to Freddie Mac’s rate at 6.22% and the Mortgage Bankers Association (MBA) rate at 6.33%, highlights key differences in the mortgage market. Jumbo mortgages, which exceed the conforming loan limits set by government agencies like Freddie Mac, typically carry higher interest rates because they are riskier for lenders. These loans are not backed by government entities, which increases the risk for lenders and, consequently, leads to higher rates. In contrast, Freddie Mac and MBA provide averages for conforming loans, which meet federal guidelines and have lower risk due to government backing, keeping their rates lower.
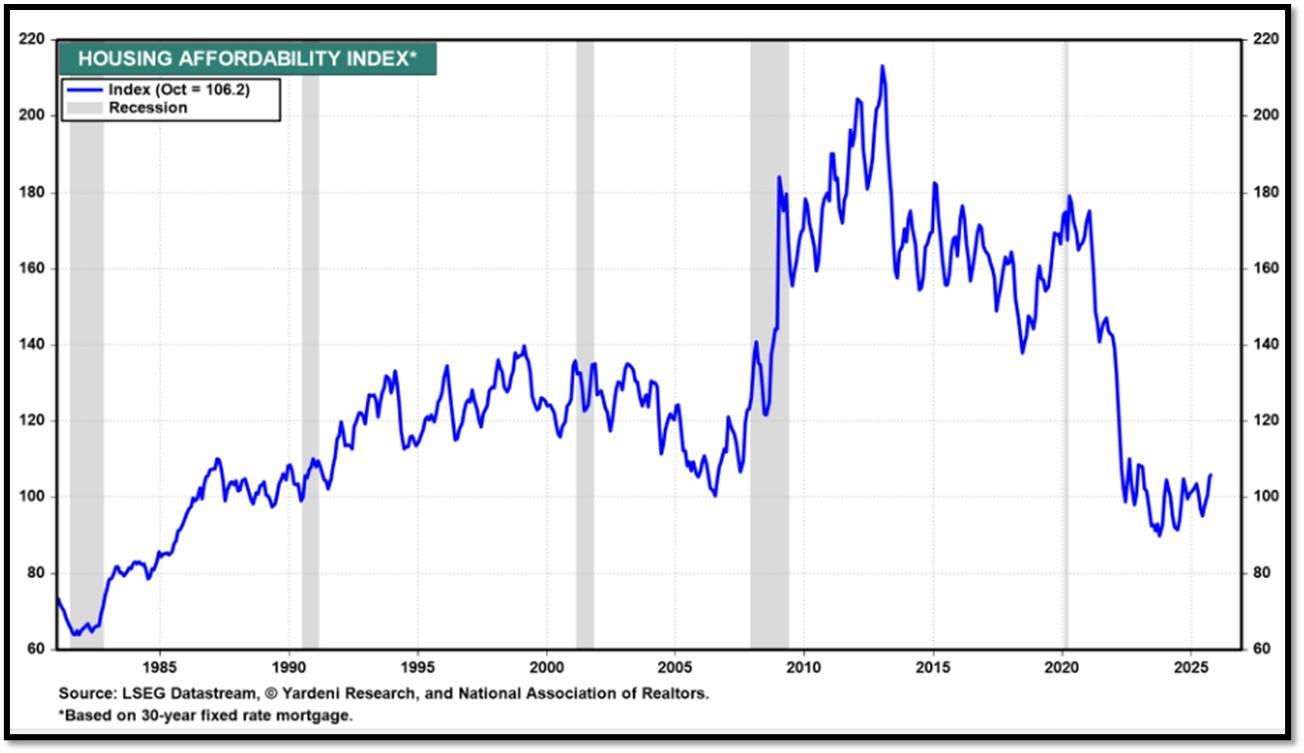
Housing Affordability Index for Oct = 106.2 // Sep = 104.5 // Aug = 100.5 // July = 98.8 // Jun = 94.4 // May = 97.2 // Apr = 101.0 // Mar = 103.2. Data provided by Yardeni Research. REF: Yardeni
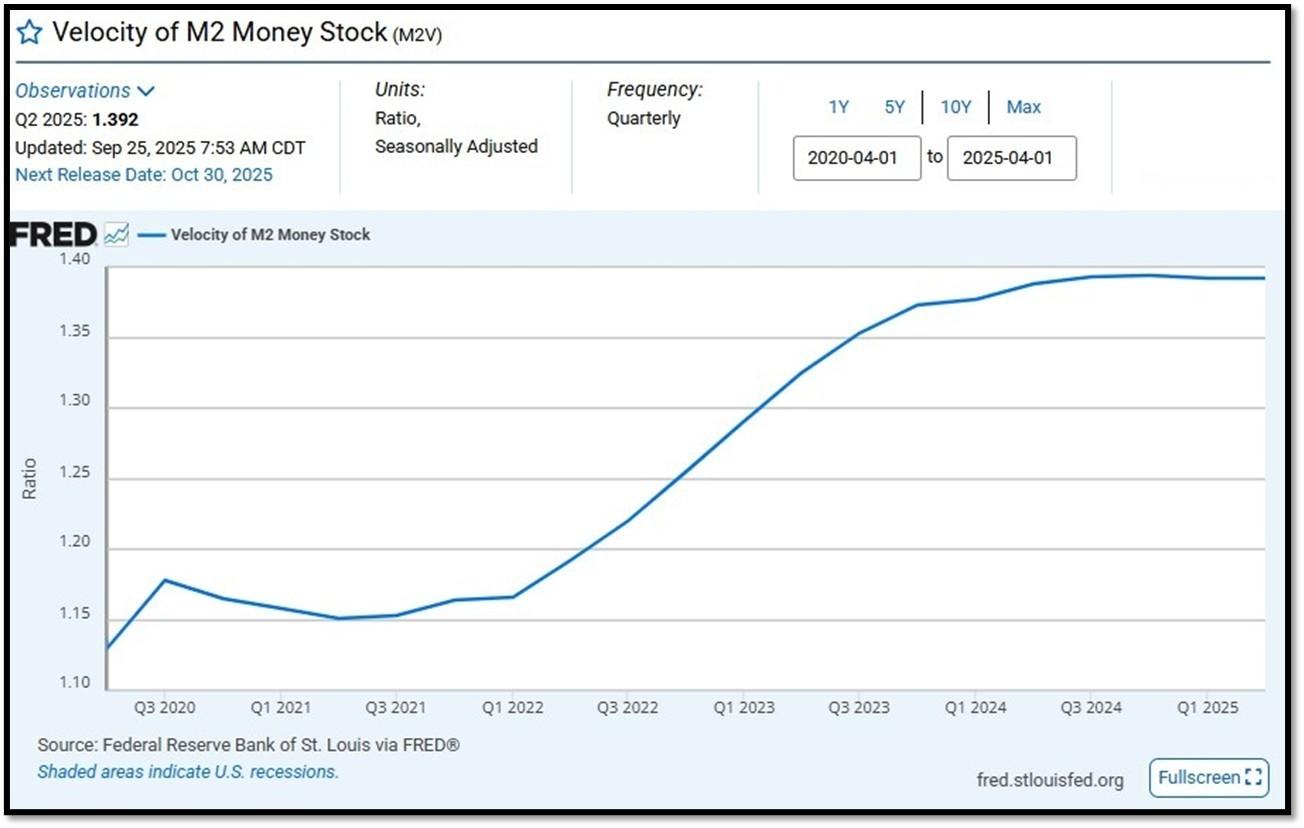
5J. Velocity of M2 Money Stock (M2V) with current read at 1.392 as of (Q2-2025 updated September 25, 2025). Previous quarter’s data was 1.386. The velocity of money is the frequency at which one unit of currency is used to purchase domestically- produced goods and services within a given time period. In other words, it is the number of times one dollar is spent to buy goods and services per unit of time. If the velocity of money is increasing, then more transactions are occurring between individuals in an economy. Current Money Stock (M2) report can be viewed in the reference link. REF: St.LouisFed-M2V
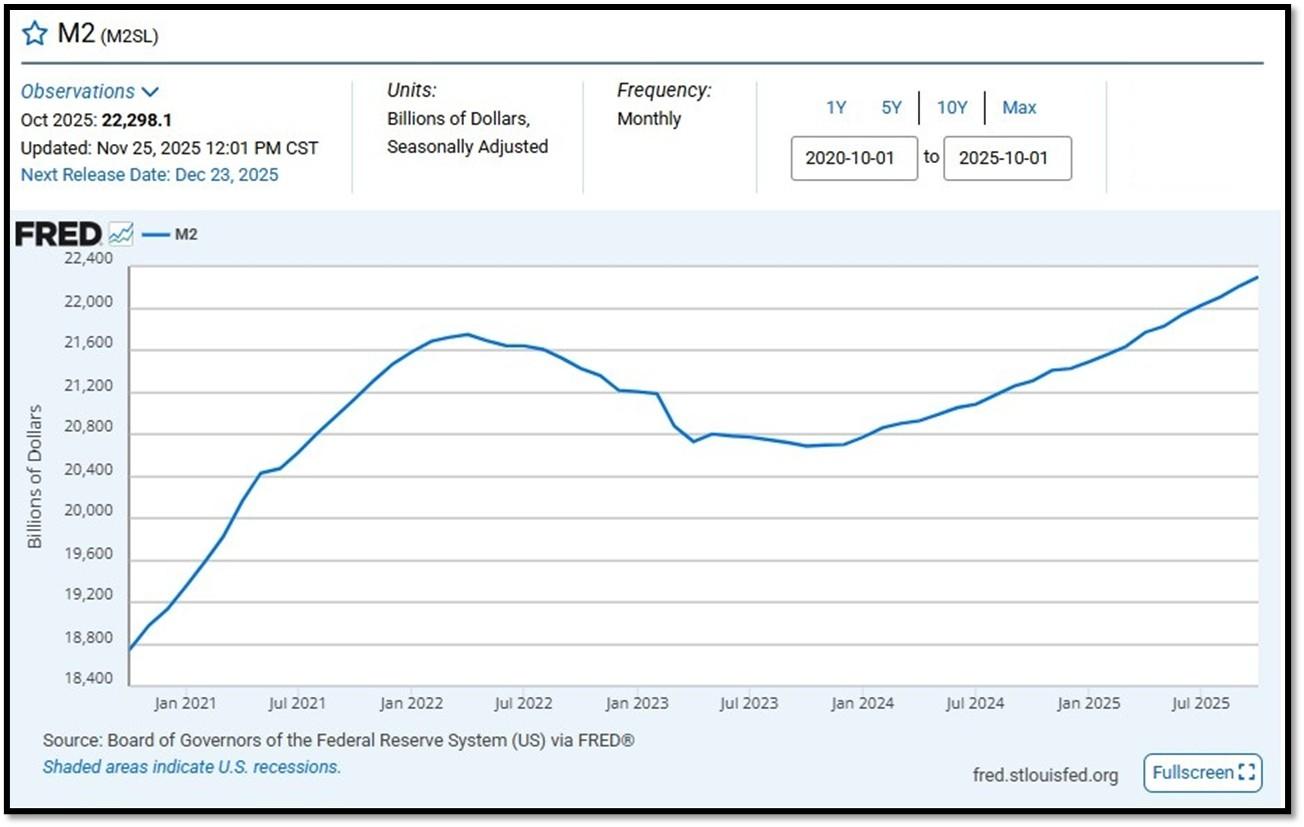
M2 consists of M1 plus (1) small-denomination time deposits (time deposits in amounts of less than $100,000) less IRA and Keogh balances at depository institutions; and (2) balances in retail MMFs less IRA and Keogh balances at MMFs. Seasonally adjusted M2 is constructed by summing savings deposits (before May 2020), small-denomination time deposits, and retail MMFs, each seasonally adjusted separately, and adding this result to seasonally adjusted M1. Board of Governors of the Federal Reserve System (US), M2 [M2SL], retrieved from FRED, Federal Reserve Bank of St. Louis; Updated on November 25, 2025. REF: St.LouisFed-M2
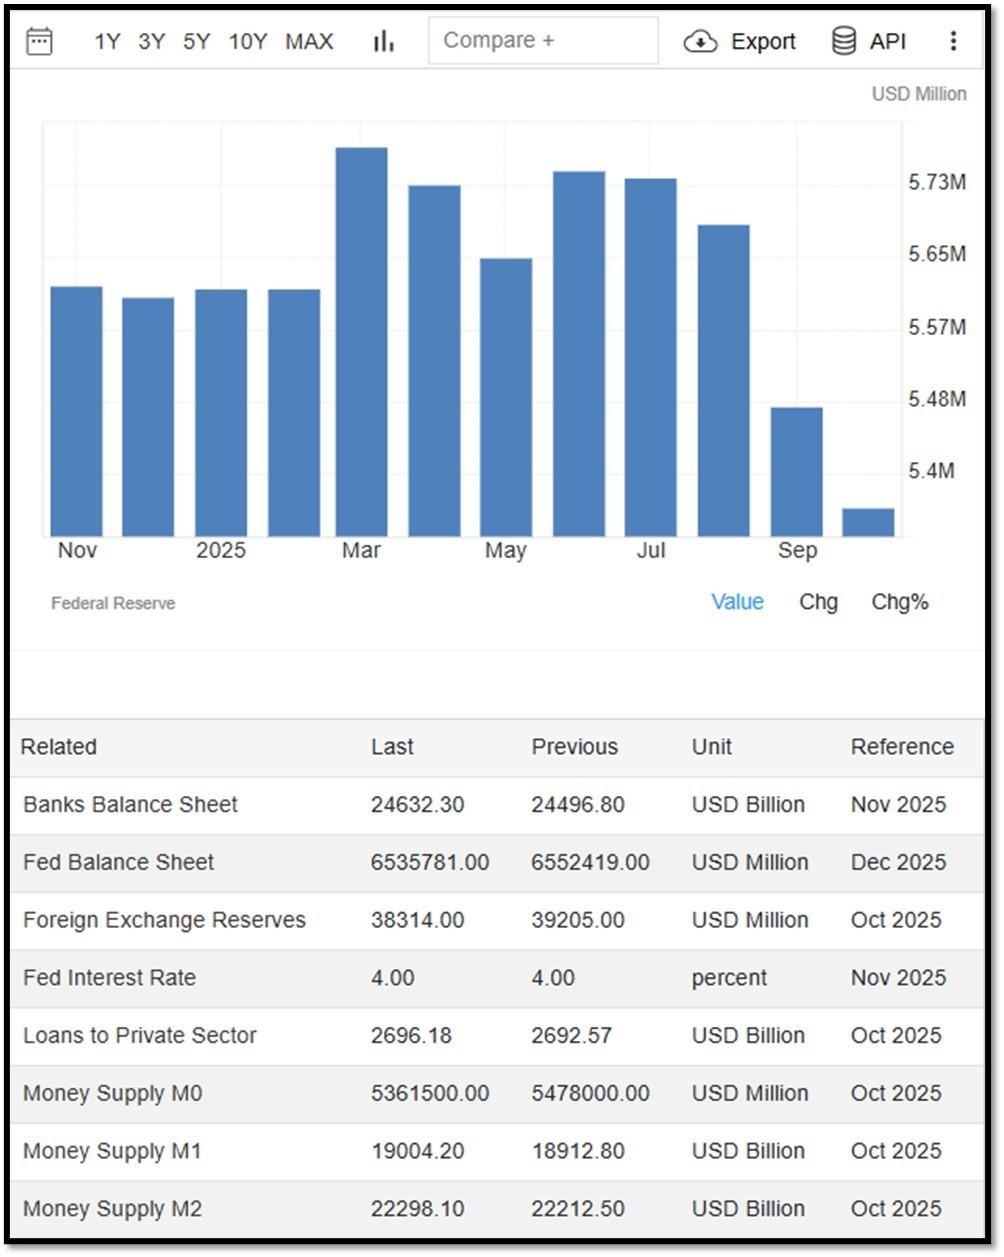
Money Supply M0 in the United States increased to 53,615,000 USD Million in October from 5,478,000 USD Million in September of 2025. Money Supply M0 in the United States averaged 1,222,051.25 USD Million from 1959 until 2025, reaching an all time high of 6,413,100.00 USD Million in December of 2021 and a record low of 48,400.00 USD Million in February of 1961. REF: TradingEconomics, M0
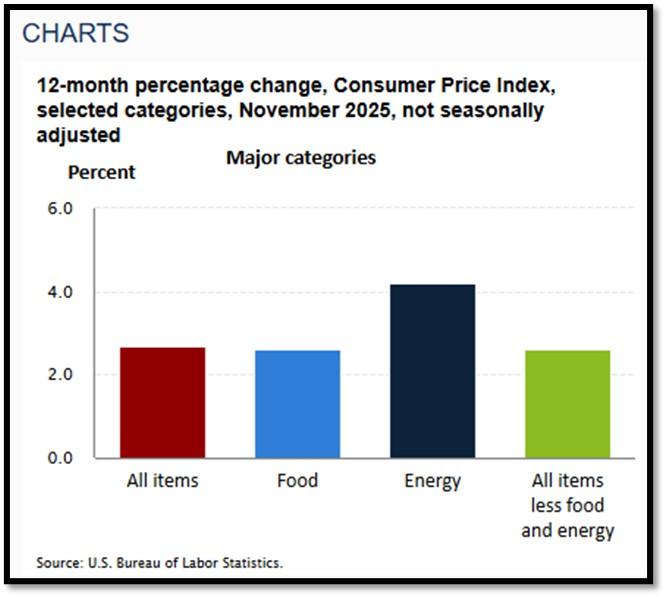
5K. In November, the Consumer Price Index for All Urban Consumers rose 2.7 percent over the last 12 months, not seasonally adjusted. The index for all items less food and energy increased 2.6 percent over the year (NSA). December 2025 CPI data are scheduled to be released on January 13, 2026, at 8:30 A.M. Eastern Time. REF: BLS, BLS.GOV
Federal Government Shutdown
BLS did not collect survey data for October 2025 due to a lapse in appropriations. BLS was unable to
retroactively collect these data. For a few indexes, BLS uses non-survey data sources instead of survey data
to make the index calculations. BLS was able to retroactively acquire most of the non-survey data for October.
CPI data collection resumed on November 14, 2025.
Additional information about the impact of the shutdown on CPI data is available online at
URL: https://www.bls.gov/cpi/additional-resources/2025-federal-government-shutdown-impact-cpi.htm
5L. Technical Analysis of the S&P500 Index. Click onto reference links below for images.
- Short-term Chart: Trend Less Bullish on 12/16/2025 – REF: Short-term S&P500 Chart by Marc Slavin (Click Here to Access Chart)
- Medium-term Chart: Trend Bullish on 12/16/2025 – REF: Medium-term S&P500 Chart by Marc Slavin (Click Here to Access Chart)
- Market Timing Indicators – S&P500 Index as of 12/16/2025 – REF: S&P500 Charts (7 of them) by Joanne Klein’s Top 7 (Click Here to Access Updated Charts)
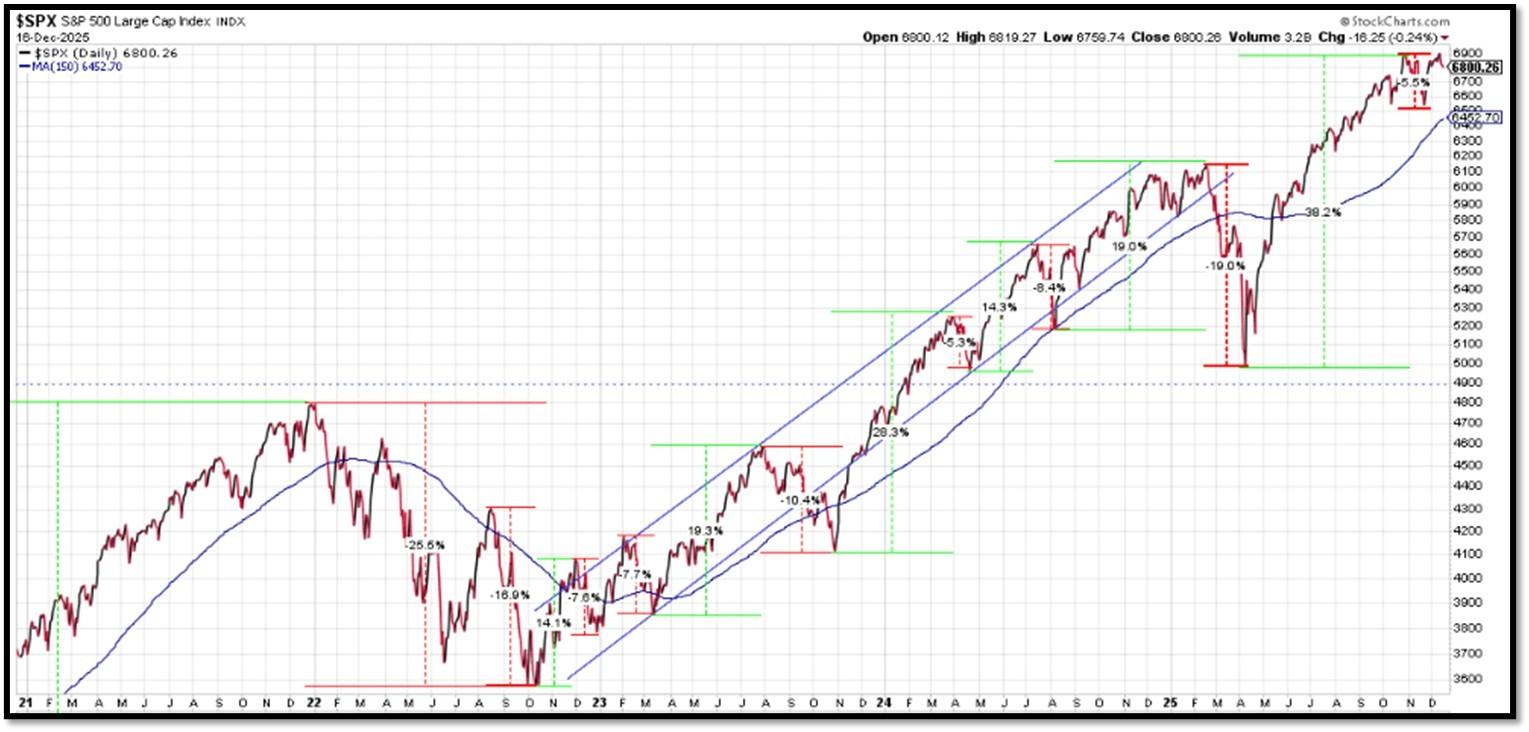
- The S&P500 is sitting near all-time-high levels, rebounding from two V-shaped recoveries. REF: Stockcharts
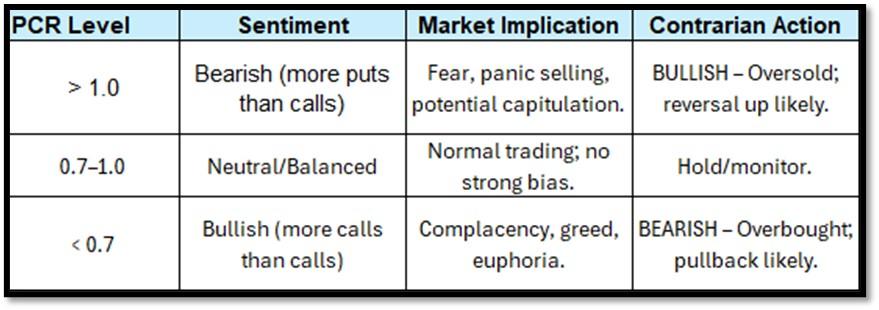
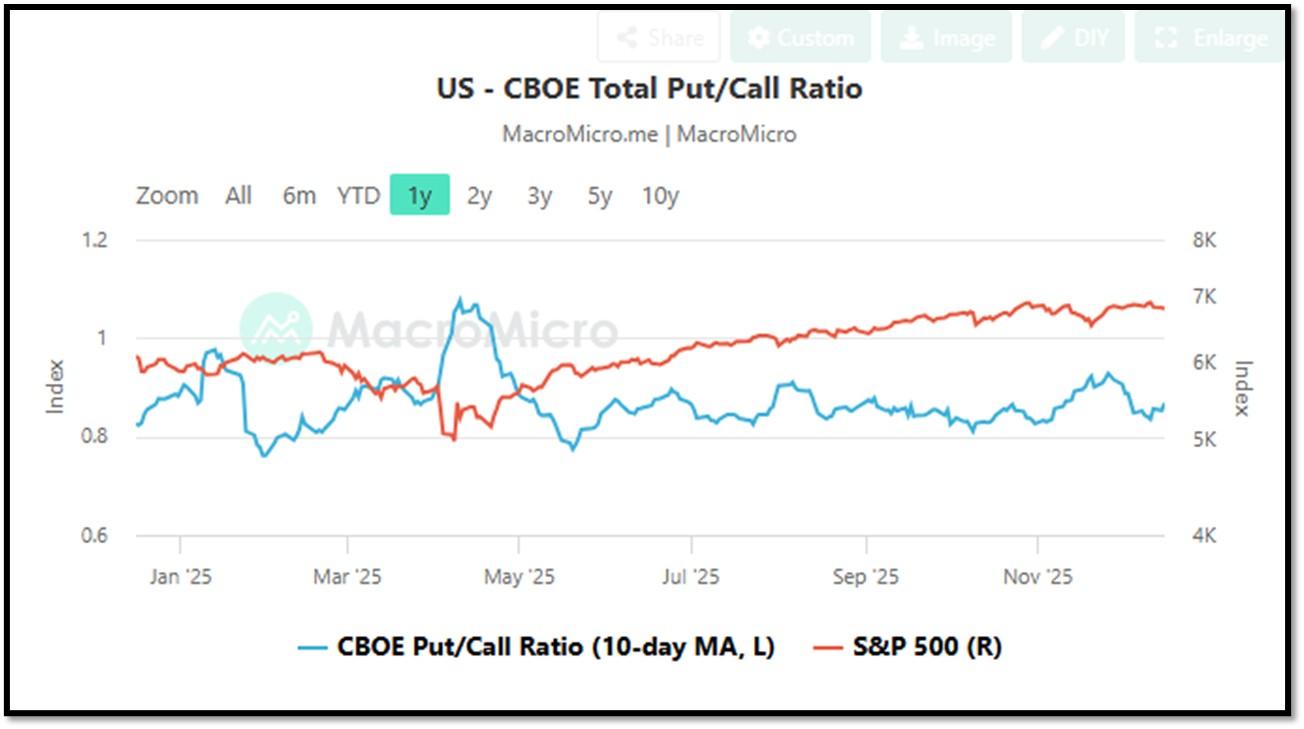
- CBOE Total Put/Call Ratio as of 12/16/2025. REF: MacroMicro
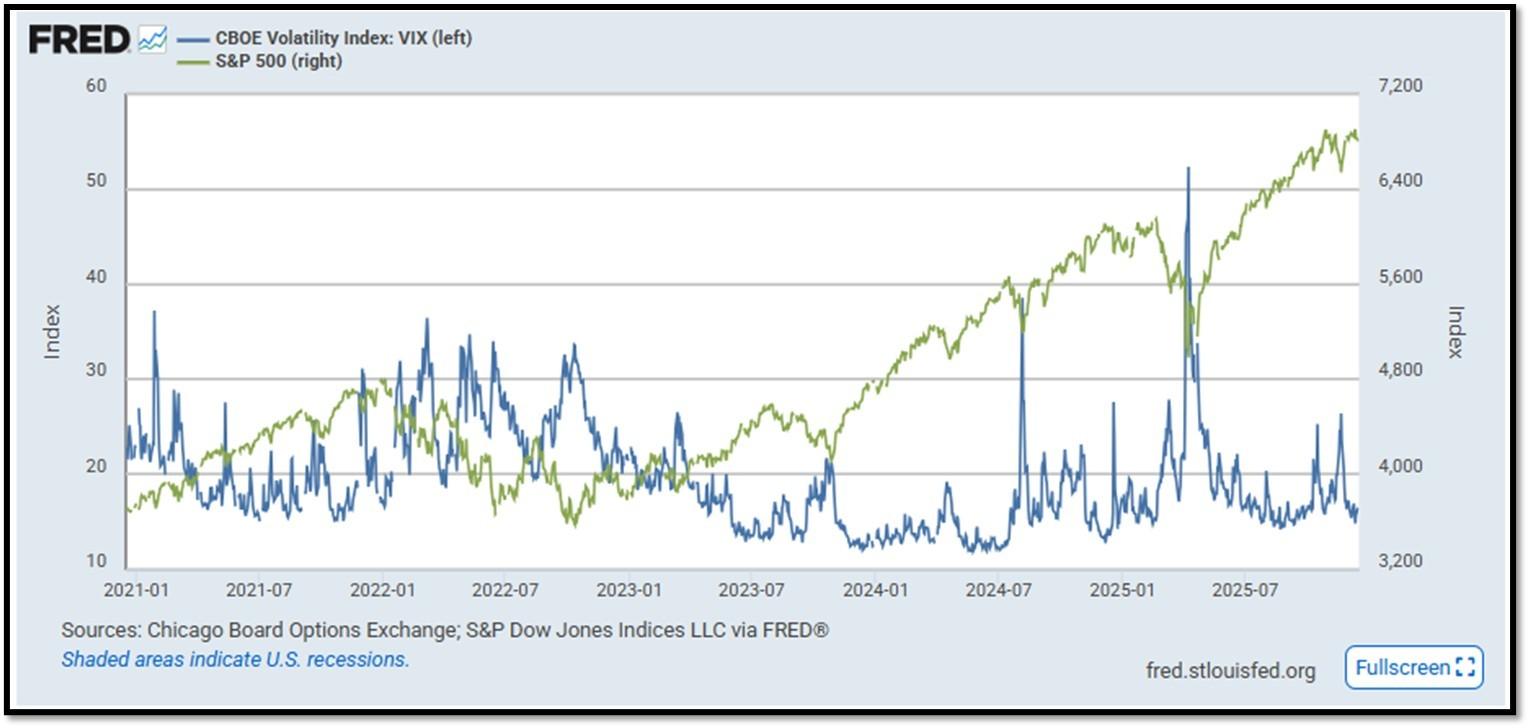
- S&P500 and CBOE Volatility Index (VIX) as of 12/16/2025. REF: FRED, Today’s Print
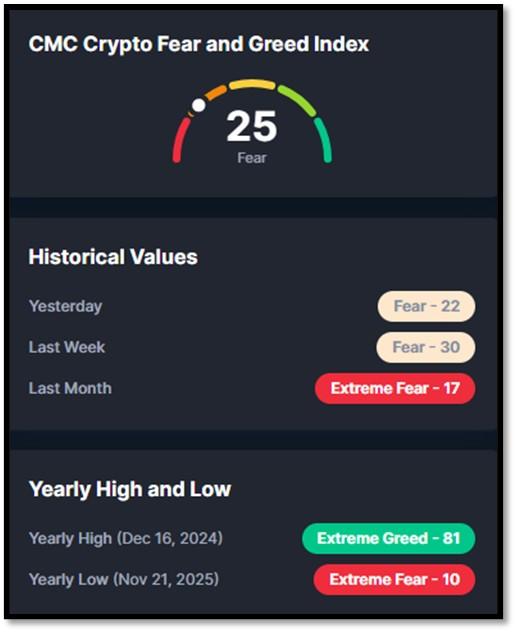
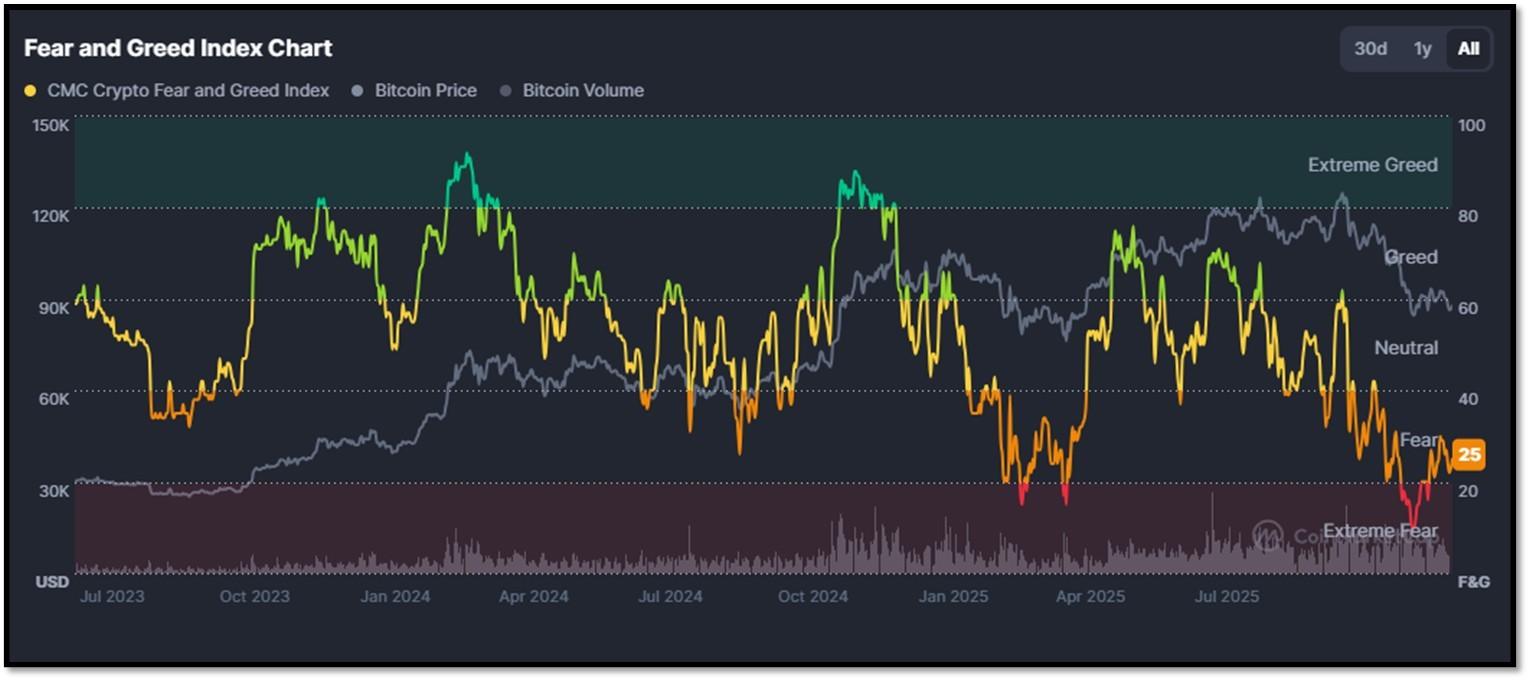
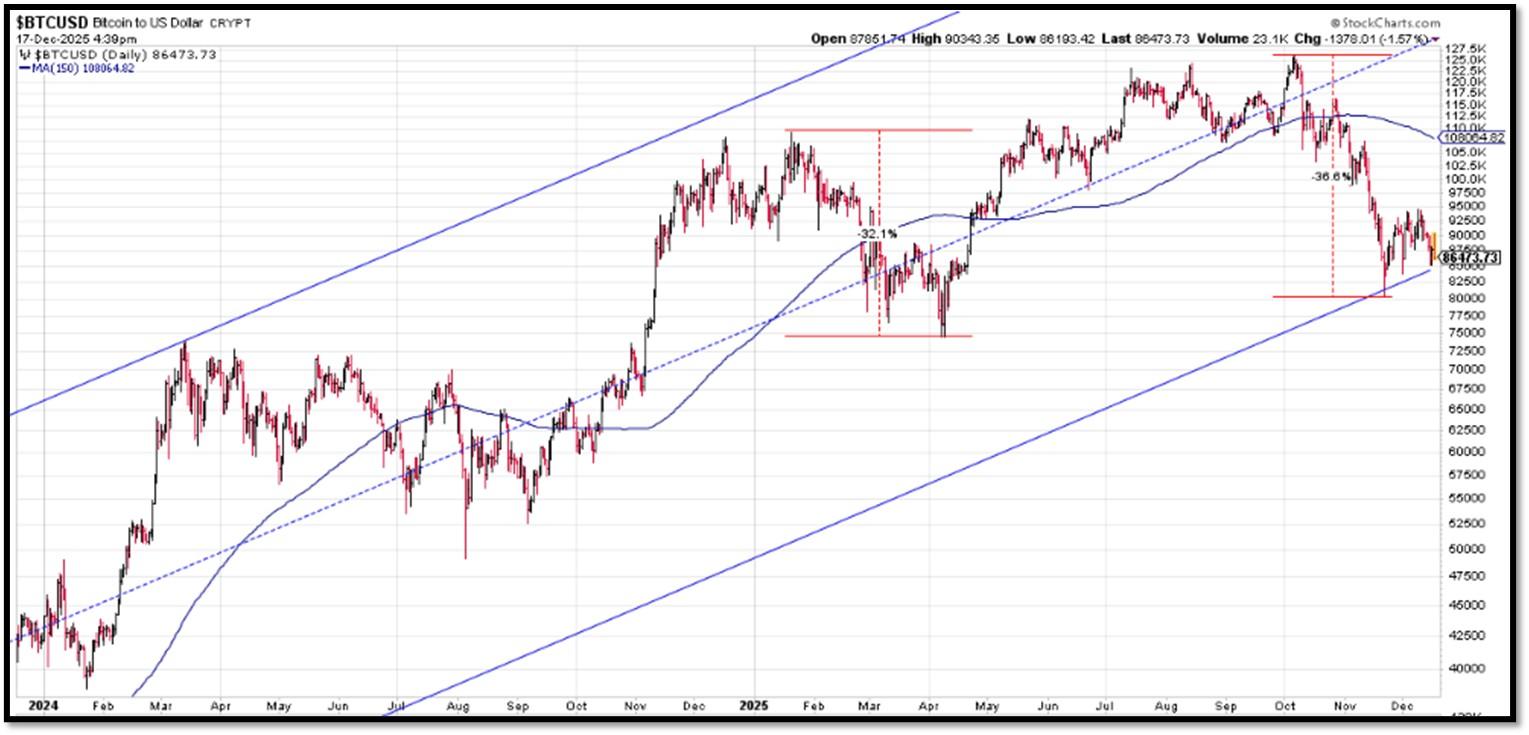
5M. Most recent read on the Crypto Fear & Greed Index with data as of 12/17/2025 is 25 (Fear). Last week’s data was 30 (Fear) (1-100). Fear & Greed Index – A Contrarian Data. The crypto market behavior is very emotional. People tend to get greedy when the market is rising which results in FOMO (Fear of missing out). Also, people often sell their coins in irrational reaction of seeing red numbers. With the Crypto Fear and Greed Index, the data try to help save investors from their own emotional overreactions. There are two simple assumptions:
- Extreme fear can be a sign that investors are too worried. That could be a buying opportunity.
- When Investors are getting too greedy, that means the market is due for a correction.
Therefore, the program for this index analyzes the current sentiment of the Bitcoin market and crunch the numbers into a simple meter from 0 to 100. Zero means “Extreme Fear”, while 100 means “Extreme Greed”. REF: Coinmarketcap.com, Today’sReading
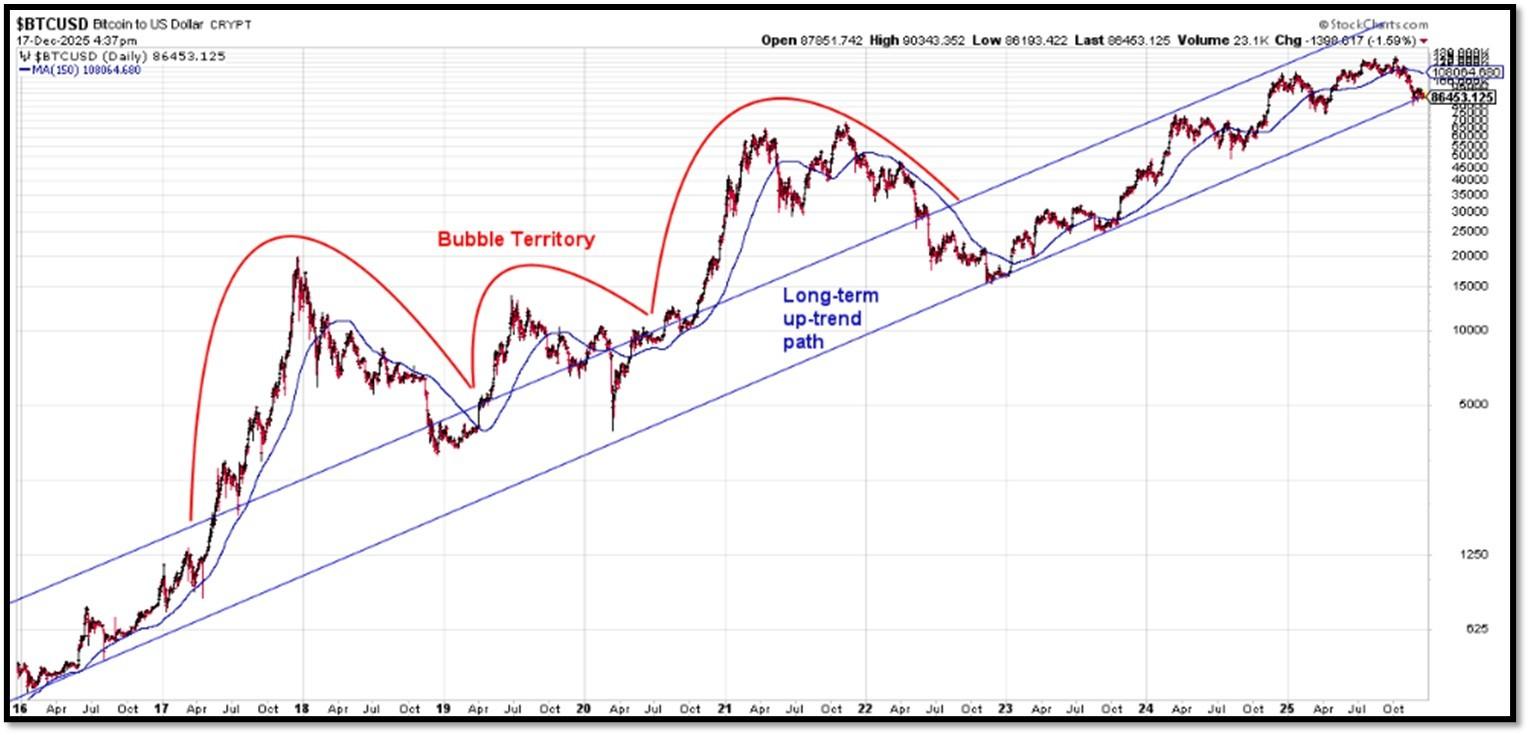
Bitcoin – 10-Year & 2-Year Charts. REF: Stockcharts10Y, Stockcharts2Y
From the desk of our Chief Investment Officer
As an investment professional with over twenty-six years of experience in the financial services industry, Andrew helps clients to protect, grow and transfer wealth during their lifetime with objective, unbiased, customized and efficient strategies.
Education, Professional Licenses Acquired & Affiliations
- Passed the Series 7, 63, 65 and 24 license examinations
- Currently holding Series 65 License
- BA in Economics – Boston University (Boston, MA) 1993
- Certificate in Commodities Trading – New York University (New York, NY) 1991
- Certificate in Financial Planning – New York University (New York, NY) April 2011
With extensive experience in the Financial Services Industry, Andrew Tang and Turner Financial Group provides disciplined wealth management with an intelligent caring approach to each and every client that compliments the Dedicated Financial offering.


Len writes much of his own content, and also shares helpful content from other trusted providers like Turner Financial Group (TFG).
The material contained herein is intended as a general market commentary, solely for informational purposes and is not intended to make an offer or solicitation for the sale or purchase of any securities. Such views are subject to change at any time without notice due to changes in market or economic conditions and may not necessarily come to pass. This information is not intended as a specific offer of investment services by Dedicated Financial and Turner Financial Group, Inc.
Dedicated Financial and Turner Financial Group, Inc., do not provide tax, legal or accounting advice. You should consult your own tax, legal and accounting advisors before engaging in any transaction.
Any hyperlinks in this document that connect to Web Sites maintained by third parties are provided for convenience only. Turner Financial Group, Inc. has not verified the accuracy of any information contained within the links and the provision of such links does not constitute a recommendation or endorsement of the company or the content by Dedicated Financial or Turner Financial Group, Inc. The prices/quotes/statistics referenced herein have been obtained from sources verified to be reliable for their accuracy or completeness and may be subject to change.
Past performance is no guarantee of future returns. Investing involves risk and possible loss of principal capital. The views and strategies described herein may not be suitable for all investors. To the extent referenced herein, real estate, hedge funds, and other private investments can present significant risks, including loss of the original amount invested. All indexes are unmanaged, and an individual cannot invest directly in an index. Index returns do not include fees or expenses.
Turner Financial Group, Inc. is an Investment Adviser registered with the United States Securities and Exchange Commission however, such registration does not imply a certain level of skill or training and no inference to the contrary should be made. Additional information about Turner Financial Group, Inc. is also available at www.adviserinfo.sec.gov. Advisory services are only offered to clients or prospective clients where Turner Financial Group, Inc. and its representatives are properly licensed or exempt from licensure. No advice may be rendered by Turner Financial Group, Inc. unless a client service agreement is in place.


