

- 1. Things look bad on the surface given the recent tech selloff, but the broader economy and overall stock market remain on much steadier footing. As always, there will be clear winners and losers beneath the headline moves, and this rotation does not signal systemic weakness.
- 2. The January jobs report came in stronger than expected, with nonfarm payrolls rising by +130,000, more than double economists’ consensus expectations of roughly +60,000, reinforcing the view that U.S. labor demand remains resilient despite higher interest rates and prior downward revisions to 2025 employment data.
- 3. Cathie Wood addresses the recent volatility shaking global markets and the narratives driving investor anxiety. From growing fears of an AI bubble and accelerating “SaaSpocalypse” reshaping traditional software models, to renewed questions around Bitcoin volatility and concerns about a broader stock market crash, Cathie breaks down what’s signal versus noise.
- 4. World Watch
- 4A. CHINA’S SECOND SHOCK refers to a renewed surge of Chinese exports that is now reshaping European manufacturing in a way that strongly echoes what the United States experienced in 2001 when China joined the World Trade Organization.
- 4B. A landslide victory for Sanae Takaichi signaled greater continuity, and likely intensification, of Japan’s alignment with U.S. strategic priorities.
- 4C. An updated snapshot of the current global state of economy.
- 5. Quant & Technical Corner – A selection of quantitative & technical data we monitor on a regular basis to help gauge the overall financial market conditions and the investment environment.
1. Things look bad on the surface given the recent tech selloff, but the broader economy and overall stock market remain on much steadier footing. As always, there will be clear winners and losers beneath the headline moves, and this rotation does not signal systemic weakness.
The biggest highlight of the week is the jobs data, which warrants deeper discussion below and continues to be the most important driver of economic momentum and market expectations. Retail sales came in flat and below expectations, pointing to some consumer moderation but not a collapse in demand. Meanwhile, crude oil inventories rose more than expected, reinforcing the view that near-term inflation pressures remain contained. With CPI data due on Friday the 13th, the setup suggests a relatively tame inflation print, supporting the narrative that the economy is cooling at the margin without tipping into recession.
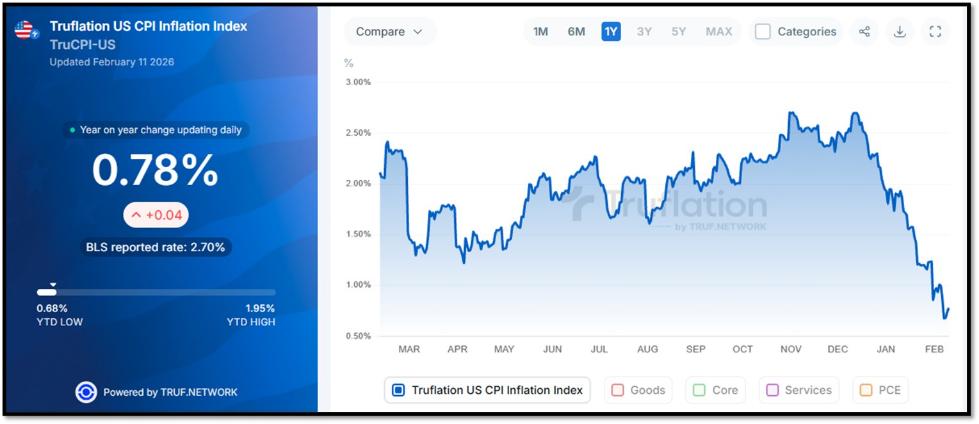
Truflation is an alternative inflation index that measures price changes using real-time, high-frequency data drawn from millions of live data points across the economy, including online prices, rental data, insurance costs, and everyday consumer expenses. Unlike the BLS’s CPI and PPI, which rely on survey-based methods, fixed baskets, and backward-looking sampling that can lag turning points, Truflation’s methodology is more current, dynamic, and reflective of how prices are actually moving today. Truflation’s most recent U.S. inflation readings suggest the early stages of an outright collapse in inflationary pressures, with the current measure now running below 1%. In my view, this decline is leading official CPI data and provides a more accurate signal of where inflation is headed, reinforcing the case that disinflation is advancing faster than widely acknowledged. REF: Breifing.com, Truflation
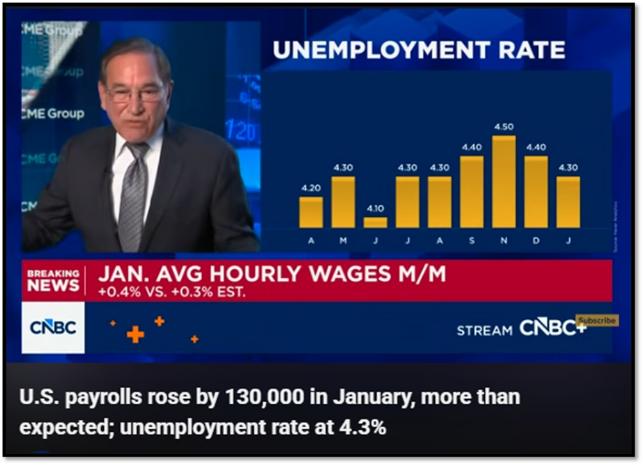
2. The January jobs report came in stronger than expected, with nonfarm payrolls rising by +130,000, more than double economists’ consensus expectations of roughly +60,000, reinforcing the view that U.S. labor demand remains resilient despite higher interest rates and prior downward revisions to 2025 employment data.
The unemployment rate edged lower to about 4.3%, while wage growth held near 3.7% year over year, signaling continued income support for consumer spending and a labor market that is stabilizing rather than deteriorating. Although job creation remains concentrated rather than broad-based, the size of the upside surprise challenges recessionary narratives and aligns with a slow-growth, non-recessionary environment consistent with a rolling recovery rather than a hard landing.
Where most January job gains occurred:
- Health Care: Hospitals, outpatient services, and long-term care, continuing to be the most consistent source of employment growth
- Social Assistance: Childcare, family services, and community-based support roles driven by structural demand
- Construction: Modest gains tied to infrastructure spending, reshoring activity, and data-center-related projects
In contrast, job cuts continue across several cyclical and efficiency-driven sectors, highlighting the uneven nature of the labor market despite stronger headline payroll growth. Layoffs remain concentrated in technology, finance, retail, transportation, and consumer goods, as companies respond to margin pressure, slower discretionary demand, automation, and AI-driven productivity gains. This reinforces a bifurcated labor environment—resilient hiring in services and construction alongside continued white-collar and corporate downsizing.
Examples of notable layoffs announced in early 2026 thus far:
- Amazon: ~16,000 corporate and support roles eliminated as part of ongoing restructuring
- Citigroup: Progressing toward ~20,000 cumulative job reductions under a multi-year simplification plan
- Salesforce: Fewer than 1,000 targeted layoffs, primarily in underperforming business units
- Target: Approximately 500 corporate and operational roles cut amid retail margin pressure
- Heineken: 5,000–6,000 global job cuts tied to weaker consumer demand and cost controls
- Gemini: Up to 200 employees laid off as part of restructuring and industry consolidation
While January’s payroll gains beat expectations, the continued scale of layoffs in corporate and capital-intensive sectors points to a labor market that is reallocating rather than contracting, consistent with a productivity-led, slower-growth expansion rather than a broad employment downturn. Click onto picture below to access video.
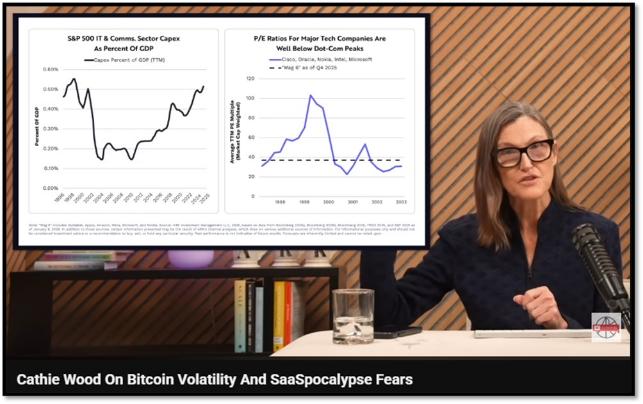
3. Cathie Wood addresses the recent volatility shaking global markets and the narratives driving investor anxiety. From growing fears of an AI bubble and accelerating “SaaSpocalypse” reshaping traditional software models, to renewed questions around Bitcoin volatility and concerns about a broader stock market crash, Cathie breaks down what’s signal versus noise.
Below is summary of her key points. Click onto picture further below to access video. REF: CathieWood, ARK-Invest
What’s driving markets right now
- Fear mix: AI bubble narratives, crypto volatility, and macro/Fed uncertainty.
- Positioning stress: Index-driven portfolios amplify selloffs as managers de-risk to stay benchmark-neutral.
- Sentiment > fundamentals: Anxiety is rooted more in past bubble memories than current data
AI stack & winners: hyperscalers, capex, chips
- Stack reshuffle: Infrastructure and platforms gain share; traditional SaaS loses relevance faster than expected.
- Platform dominance: AI-native platforms are scaling far faster than legacy software.
- Capex shock: Hyperscalers doubling AI spend unsettles investors used to cash hoards.
- Real demand: GPUs are fully utilized—this is not “dark fiber” overbuild.
Is AI a bubble? Capex & valuation context
- Capex looks large, not reckless: Still below historic bubble extremes as a share of GDP.
- Tech is ready now: Unlike the 1990s, AI is already deployable at scale.
- Valuations matter: Multiples are far lower than dot-com peaks.
- Conclusion: Early-cycle expansion, not a terminal bubble.
Crypto reset: Bitcoin vs gold
- Low correlation: Bitcoin and gold behave very differently in the short run.
- Leadership pattern: Gold often moves first; Bitcoin historically follows with higher beta.
- Structural case: Bitcoin represents a new monetary system, a technology layer, and a new asset class.
- Institutional appeal: Diversification benefits drive growing allocator interest despite volatility.
Macro & liquidity: Fed, rates, gold
- Liquidity dip: Government shutdown risk and slower Fed balance-sheet easing tightened conditions.
- Policy sensitivity: Fed and Treasury are responding to market stress.
- Gold overstretch: Recent gold surge reflects fear more than fundamentals.
Deflation, labor & productivity outlook
- Deflation emerging: Prices falling across energy, housing, consumer goods, and healthcare.
- Labor mismatch: Youth unemployment rising even as headline unemployment stays low.
- Productivity boom: AI lowers barriers to entrepreneurship and growth.
- Long-term view: Innovation-driven expansion outweighs short-term dislocation.
NOTE: Not investment/tax advice or recommendations. Investors should carefully consider the investment objectives, risks, charges, and expenses before investing. For additional information about the securities mentioned above, please visit the respective security’s investor relations page(s) for additional information. Please read all materials carefully before investing.
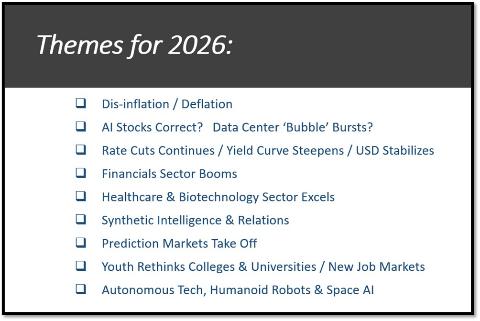
Below is a slide from my market update slide deck. Feel free to schedule a presentation for you and your audience.
4. World Watch
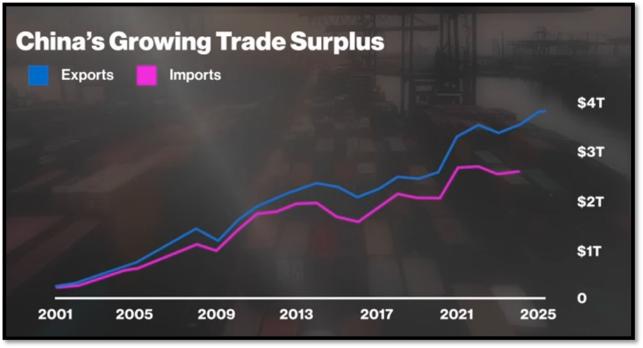
4A. CHINA’S SECOND SHOCK refers to a renewed surge of Chinese exports that is now reshaping European manufacturing in a way that strongly echoes what the United States experienced in 2001 when China joined the World Trade Organization.
At that time, a rapid influx of low-cost imports hollowed out large parts of US manufacturing. Today, Europe is facing a more advanced version of that same phenomenon. Chinese producers are no longer concentrated only in low value goods but now dominate strategic sectors, most notably electric vehicles, where Chinese brands now account for roughly 70 percent of Europe’s EV market. In regions such as Bavaria, local auto manufacturers are feeling acute pressure as Chinese firms leverage scale, state support, and aggressive pricing to capture market share, compress margins, and challenge Europe’s industrial base at its core.
Economists such as David Autor and Stephanie Flanders note that while the historical parallel to the 2001 US experience is striking, the current shock may unfold differently. Autor has long emphasized that sudden trade exposure can generate severe and lasting adjustment costs for workers and regions when policy responses lag reality. Flanders highlights that China’s export strategy has evolved, with Europe increasingly becoming the primary destination as Chinese firms diversify away from the US and move decisively up the value chain. Because this shock is hitting advanced manufacturing rather than just basic industries, Europe now faces a deeper structural challenge, one that forces a reassessment of trade policy, industrial protection, and how to manage economic dislocation in an era of intensified global competition. Click onto picture below to access video. REF: Bloomberg, The China Shock by Autor, Dorn & Hanson

4B. A landslide victory for Sanae Takaichi signaled greater continuity, and likely intensification, of Japan’s alignment with U.S. strategic priorities.
Takaichi is someone who favors stronger defense spending, constitutional reinterpretation to expand military capabilities, and a tougher posture toward China and North Korea; for Washington, this translates into a more reliable Indo-Pacific partner, deeper interoperability under the U.S.–Japan alliance, and stronger coordination on Taiwan deterrence, supply-chain security, and advanced technologies. While her nationalism could create occasional diplomatic friction (for example: Historical issues in East Asia), from a U.S. perspective the net effect would be positive: a more assertive Japan that shares burden-shifting, supports rules-based order, and reinforces the U.S.-led regional architecture at a time of heightened great-power competition. Click onto picture below to access video. REF: WSJ

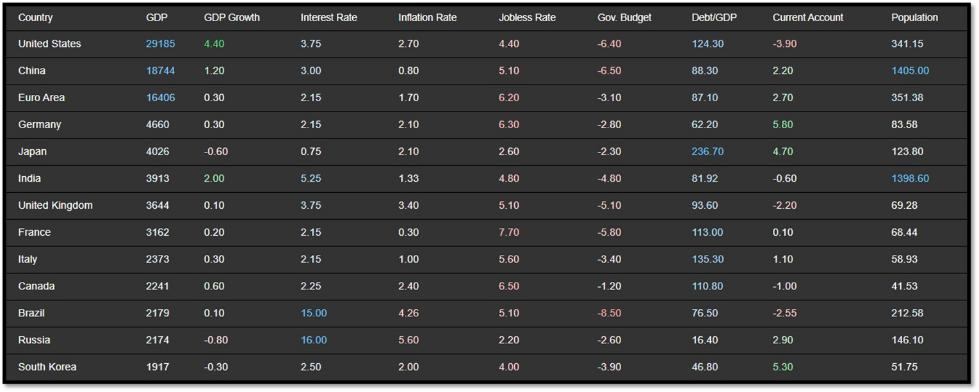
4C. An updated snapshot of the current global state of economy.
According to TradingEconomics as of 2/9/2026. REF: TradingEconomics
- France’s annual inflation rate slowed to 0.3% in January 2026, the lowest since late 2020, down from 0.8% in December and below expectations of 0.6%, according to preliminary estimates.
- Italy’s annual inflation rate edged down to 1% in January 2026 from 1.2% in the previous month, in line with market expectations, preliminary estimates showed.
- The unemployment rate in Canada fell to 6.5% in January 2026 from 6.8% in the previous month, undershooting market expectations of 6.8% and marking the lowest level in 16 months, as fewer people searched for work.
- Russia’s unemployment rate ticked up to 2.2% in December 2025 from 2.1% in the previous month, in line with market expectations.
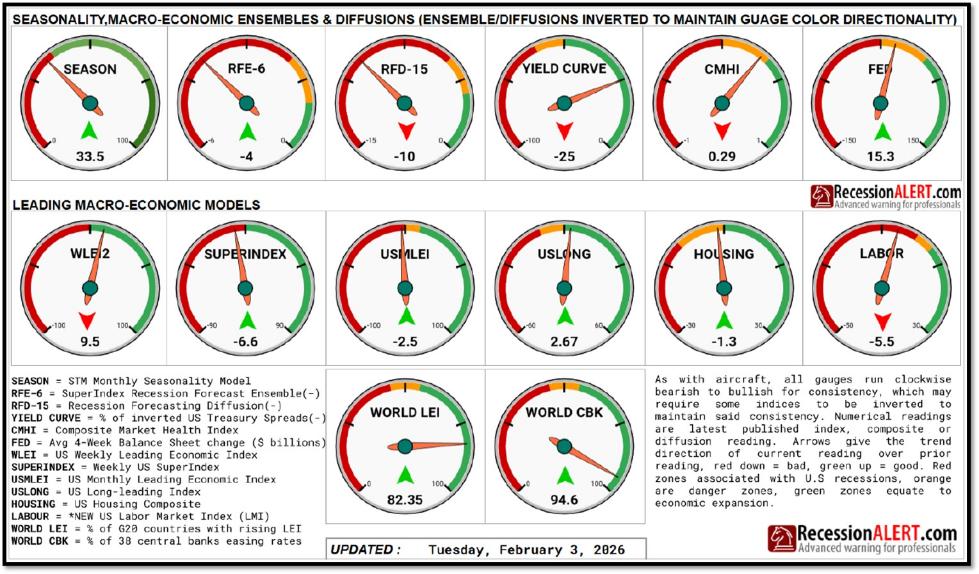
5. Quant & Technical Corner – A selection of quantitative & technical data we monitor on a regular basis to help gauge the overall financial market conditions and the investment environment.
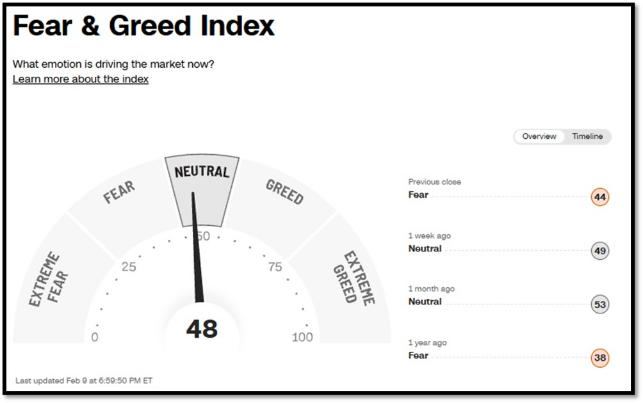
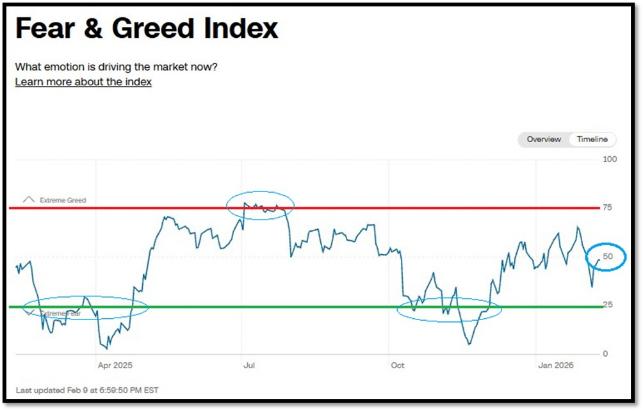
5A. Most recent read on the Fear & Greed Index with data as of 2/9/2026 – 6:59 PM-ET is 48 (Neutral). Last week’s data was 49 (Neutral) (1-100). CNNMoney’s Fear & Greed index looks at 7 indicators (Stock Price Momentum, Stock Price Strength, Stock Price Breadth, Put and Call Options, Junk Bond Demand, Market Volatility, and Safe Haven Demand). Keep in mind this is a contrarian indicator! REF: Fear&Greed via CNNMoney
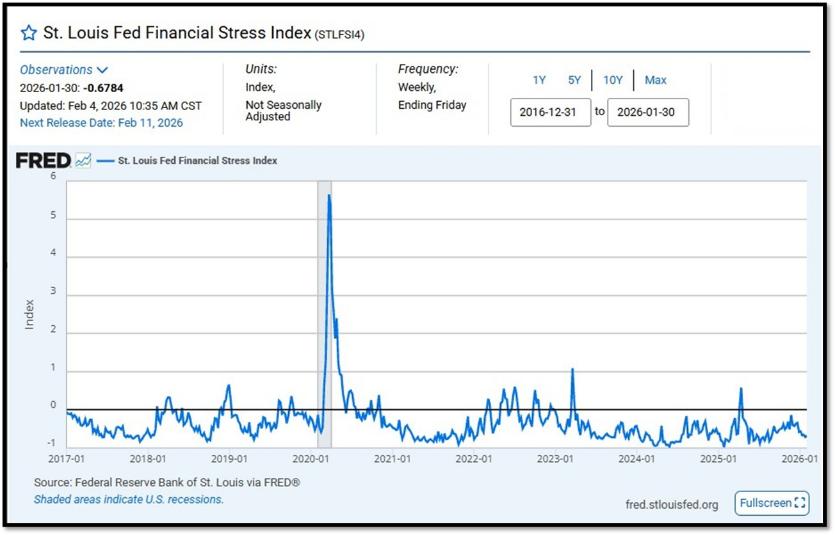
5B. St. Louis Fed Financial Stress Index’s (STLFSI4) most recent read is at –0.6784 as of February 4, 2025. Previous week’s data was -0.7123. A big spike up from previous readings reflecting the turmoil in the banking sector back in 2023. This weekly index is not seasonally adjusted. The STLFSI4 measures the degree of financial stress in the markets and is constructed from 18 weekly data series: seven interest rate series, six yield spreads and five other indicators. Each of these variables captures some aspect of financial stress. Accordingly, as the level of financial stress in the economy changes, the data series are likely to move together. REF: St. Louis Fed
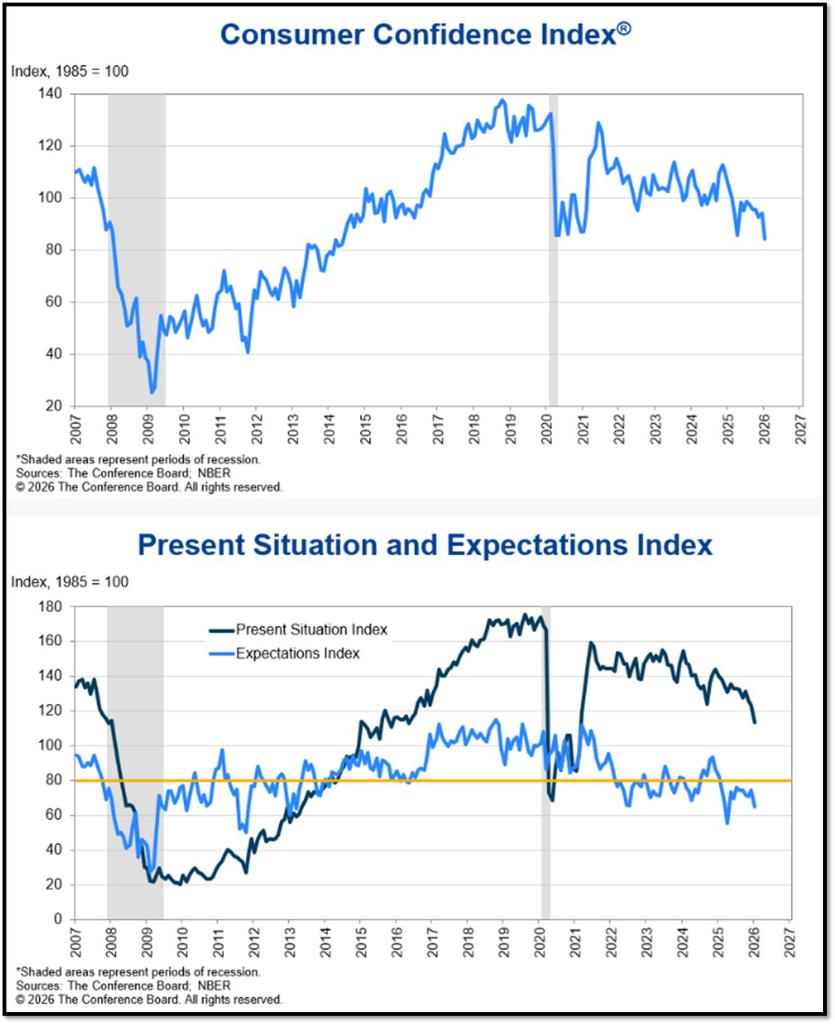
5C. The Conference Board Consumer Confidence Index® fell by 9.7 points in January to 84.5 (1985=100), from an upwardly revised 94.2 in December. A 5.1-point upward revision to December’s reading of the Index resulted in a slight increase last month, reversing the initially reported decline. However, January’s preliminary results showed confidence resumed declining after a one-month uptick. Data as of January 27, 2026. REF: ConsumerConfidence
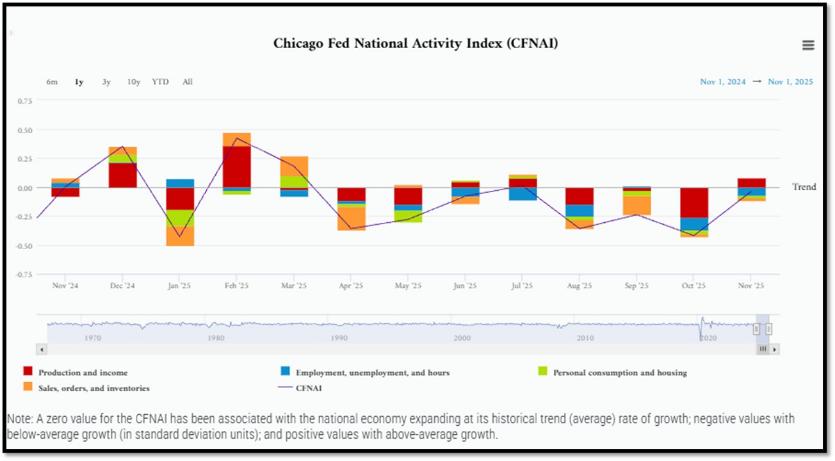
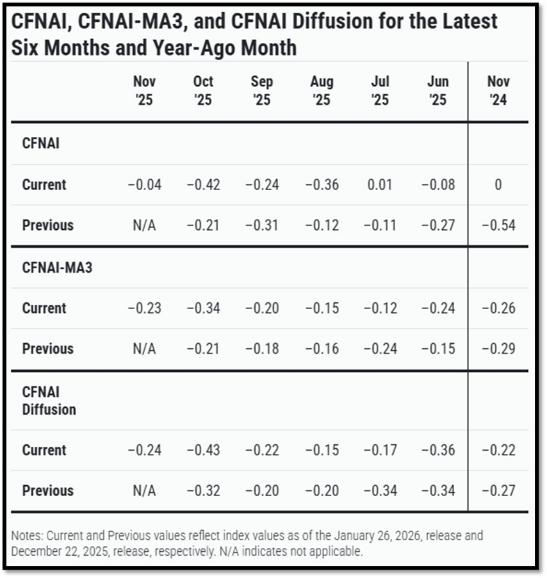
5D. The Chicago Fed National Activity Index (CFNAI) increased to –0.04 in November from –0.42 in October. Three of the four broad categories of indicators used to construct the index increased from October, but three categories made negative contributions in November. The index’s three-month moving average, CFNAI-MA3, increased to –0.23 in November from –0.34 in October. REF: ChicagoFed, November’s Report
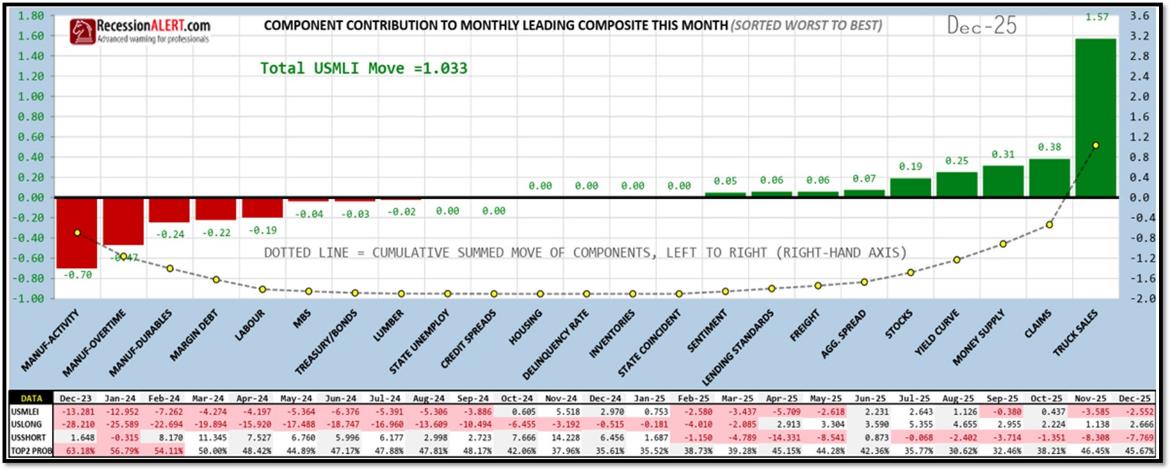
5E. (1/23/2026) The Conference Board Leading Economic Index® (LEI) for the US declined by 0.3% in November 2025 to 97.9 (2016=100), after declining by 0.1% in October to 98.2, down from 98.3 in September. Overall, the LEI fell by 1.2% over the six months between May and November 2025, a much more moderate rate of decline than its 2.6% contraction over the previous six-month period (November 2024 to May 2025). The composite economic indexes are the key elements in an analytic system designed to signal peaks and troughs in the business cycle. The indexes are constructed to summarize and reveal common turning points in the economy in a clearer and more convincing manner than any individual component. The CEI is highly correlated with real GDP. The LEI is a predictive variable that anticipates (or “leads”) turning points in the business cycle by around 7 months. Shaded areas denote recession periods or economic contractions. The dates above the shaded areas show the chronology of peaks and troughs in the business cycle. The ten components of The Conference Board Leading Economic Index® for the U.S. include: Average weekly hours in manufacturing; Average weekly initial claims for unemployment insurance; Manufacturers’ new orders for consumer goods and materials; ISM® Index of New Orders; Manufacturers’ new orders for nondefense capital goods excluding aircraft orders; Building permits for new private housing units; S&P 500® Index of Stock Prices; Leading Credit Index™; Interest rate spread (10-year Treasury bonds less federal funds rate); Average consumer expectations for business conditions. REF: ConferenceBoard, LEI Report for December (ReceesionAlert) (Released on 1/29/2026)
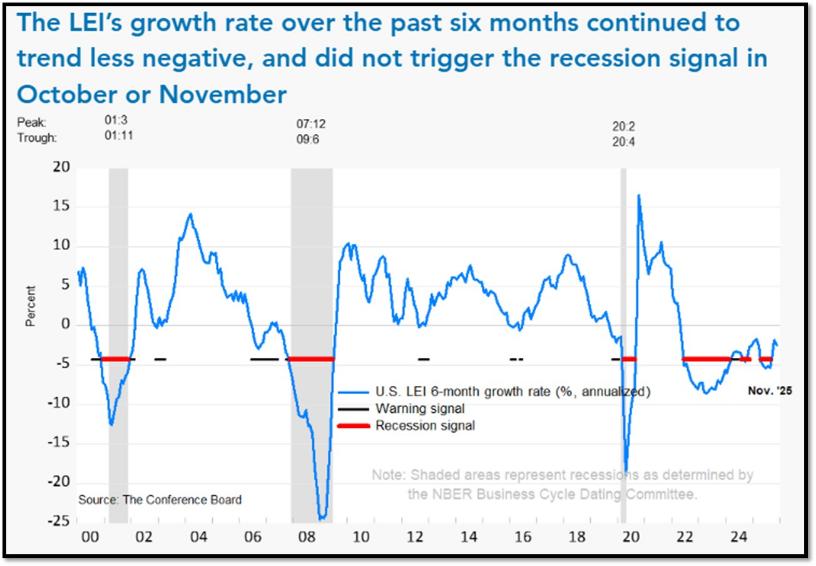
We have experienced a “rolling recession” since June 2022 and are only now emerging from it. However, authorities are not labeling it a recession due to high employment data from June 2022-2025.
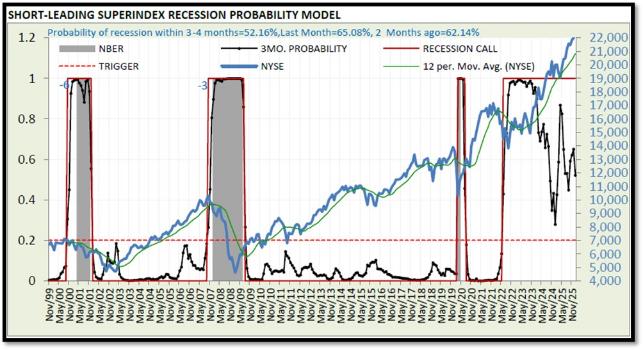
5F. Probability of U.S. falling into Recession within 3 to 4 months is currently at 52.16% (with data as of 02/3/2026 – Next Report 2/17/2026) according to RecessionAlert Research. Last release’s data was at 70.52%. This report is updated every two weeks. REF: RecessionAlertResearch
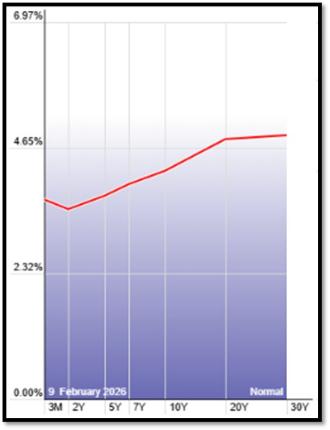
5G. Yield Curve as of 2/9/2026 is showing Normal. Spread on the 10-yr Treasury Yield (4.19%) minus yield on the 2-yr Treasury Yield (3.47%) is currently at 72bps. REF: Stockcharts The yield curve—specifically, the spread between the interest rates on the ten-year Treasury note and the three-month Treasury bill—is a valuable forecasting tool. It is simple to use and significantly outperforms other financial and macroeconomic indicators in predicting recessions two to six quarters ahead. REF: NYFED
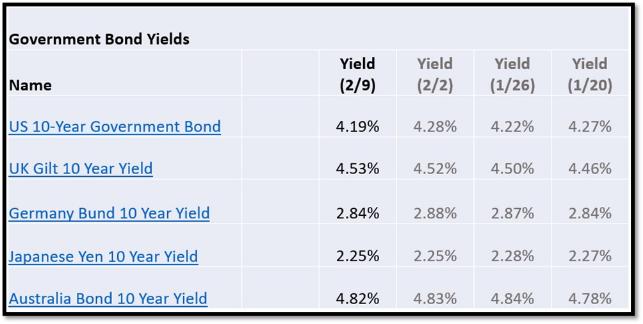
5H. Recent Yields in 10-Year Government Bonds. REF: Source is from Bloomberg.com, dated 2/9/2026, rates shown below are as of 2/9/2026, subject to change.
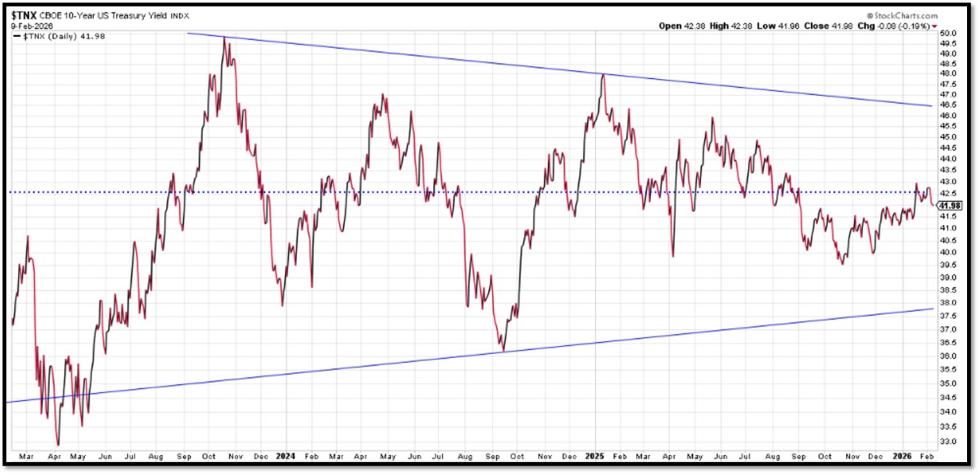
The 10-Year US Treasury Yield… The 10-Year Yield is indirectly related to inflation and prospect of the economy. REF: StockCharts1
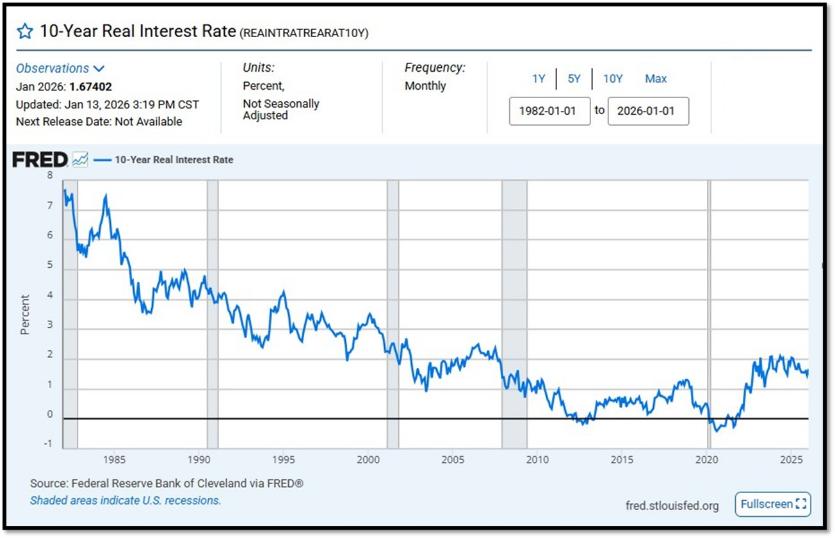
10-Year Real Interest Rate at 1.67402% as of 1/13/26. Last month’s data was 1.45392%. REF: REAINTRATREARAT10Y
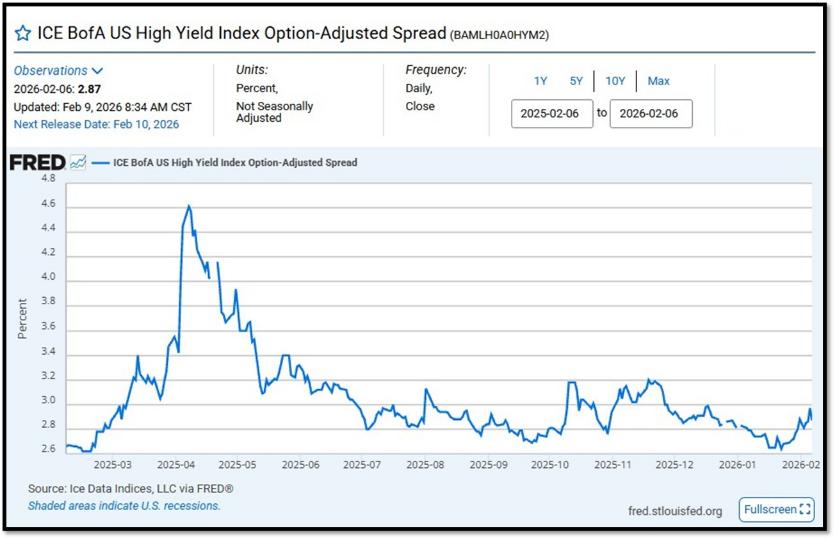
ICE BofA US High Yield Index Option-Adjusted Spread (BAMLH0A0HYM2) currently at 2.87 as of February 9, 2026. This is a key indicator of market sentiment, particularly regarding risk and economic health. At its core, the spread reflects the extra return investors demand to hold riskier corporate debt over safer government securities. High-yield bonds are issued by companies with lower credit ratings (below investment grade, like BB or lower), meaning they carry a higher chance of default. The spread compensates for this risk. When the spread is narrow—say, around 2.5% to 3%, as seen recently—it suggests investors are confident, willing to accept less extra yield because they perceive lower default risk or a strong economy. Narrow spreads often align with bullish markets, where cash is flowing, growth is steady, and fear is low. REF: FRED-BAMLH0A0HYM2
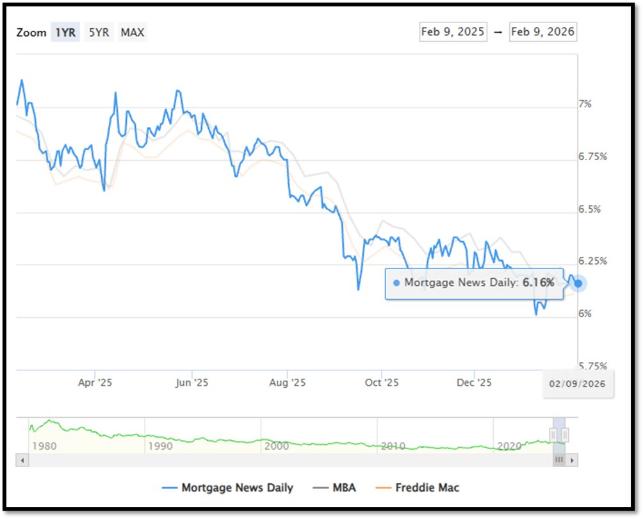
5I. (2/9/2026) Today’s National Average 30-Year Fixed Mortgage Rate is 6.16% (All Time High was 8.03% on 10/19/23). Last week’s data was 6.17%. This rate is the average 30-year fixed mortgage rates from several different surveys including Mortgage News Daily (daily index), Freddie Mac (weekly survey), Mortgage Bankers Association (weekly survey) and FHFA (monthly survey). REF: MortgageNewsDaily, Today’s Average Rate
The recent spike in the 30-year fixed-rate jumbo mortgage to 6.16%, compared to Freddie Mac’s rate at 6.11% and the Mortgage Bankers Association (MBA) rate at 6.24%, highlights key differences in the mortgage market. Jumbo mortgages, which exceed the conforming loan limits set by government agencies like Freddie Mac, typically carry higher interest rates because they are riskier for lenders. These loans are not backed by government entities, which increases the risk for lenders and, consequently, leads to higher rates. In contrast, Freddie Mac and MBA provide averages for conforming loans, which meet federal guidelines and have lower risk due to government backing, keeping their rates lower.
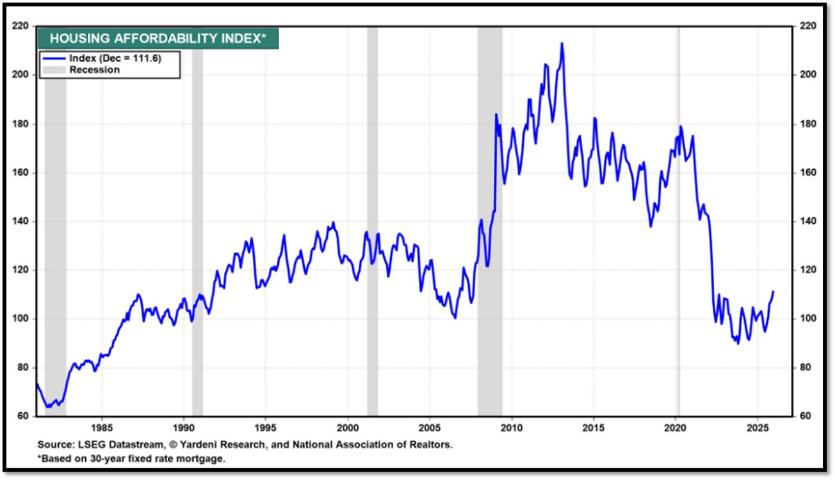
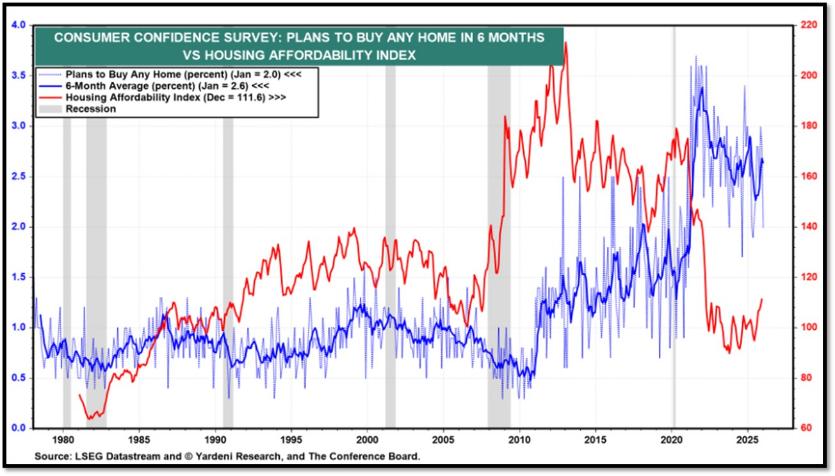
Housing Affordability Index for Dec = 111.6 // Nov = 108.4 // Oct = 106.2 // Sep = 104.5 // Aug = 100.5 // July = 98.8 // Jun = 94.4 // May = 97.2. Data provided by Yardeni Research. REF: Yardeni
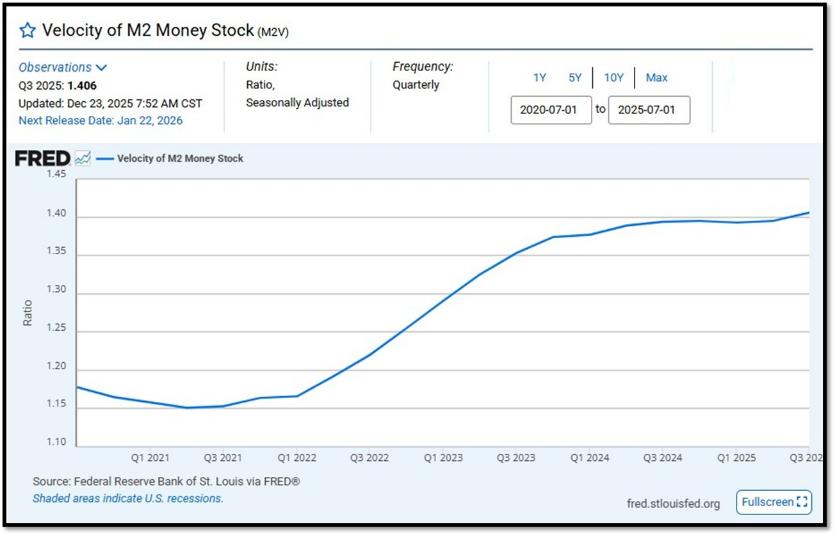
5J. Velocity of M2 Money Stock (M2V) with current read at 1.406 as of (Q3-2025 updated December 23, 2025). Previous quarter’s data was 1.392. The velocity of money is the frequency at which one unit of currency is used to purchase domestically- produced goods and services within a given time period. In other words, it is the number of times one dollar is spent to buy goods and services per unit of time. If the velocity of money is increasing, then more transactions are occurring between individuals in an economy. Current Money Stock (M2) report can be viewed in the reference link. REF: St.LouisFed-M2V
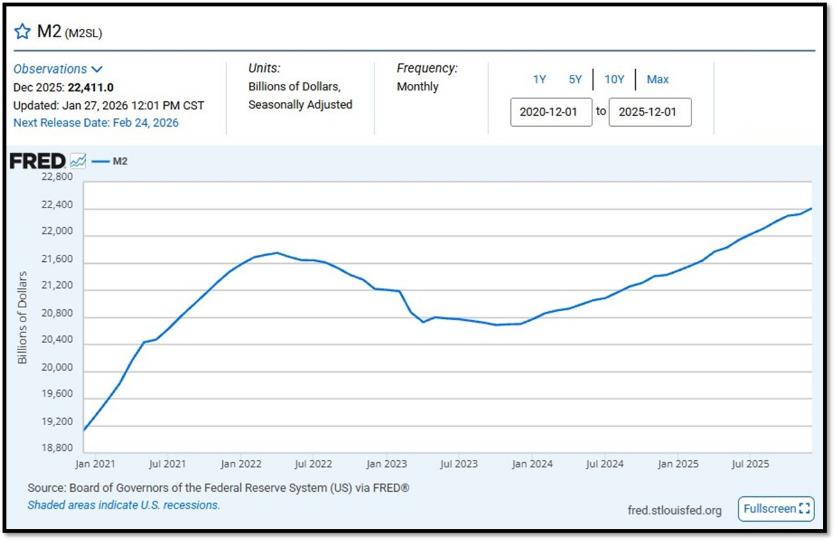
M2 consists of M1 plus (1) small-denomination time deposits (time deposits in amounts of less than $100,000) less IRA and Keogh balances at depository institutions; and (2) balances in retail MMFs less IRA and Keogh balances at MMFs. Seasonally adjusted M2 is constructed by summing savings deposits (before May 2020), small-denomination time deposits, and retail MMFs, each seasonally adjusted separately, and adding this result to seasonally adjusted M1. Board of Governors of the Federal Reserve System (US), M2 [M2SL], retrieved from FRED, Federal Reserve Bank of St. Louis; Updated on January 27, 2026. REF: St.LouisFed-M2
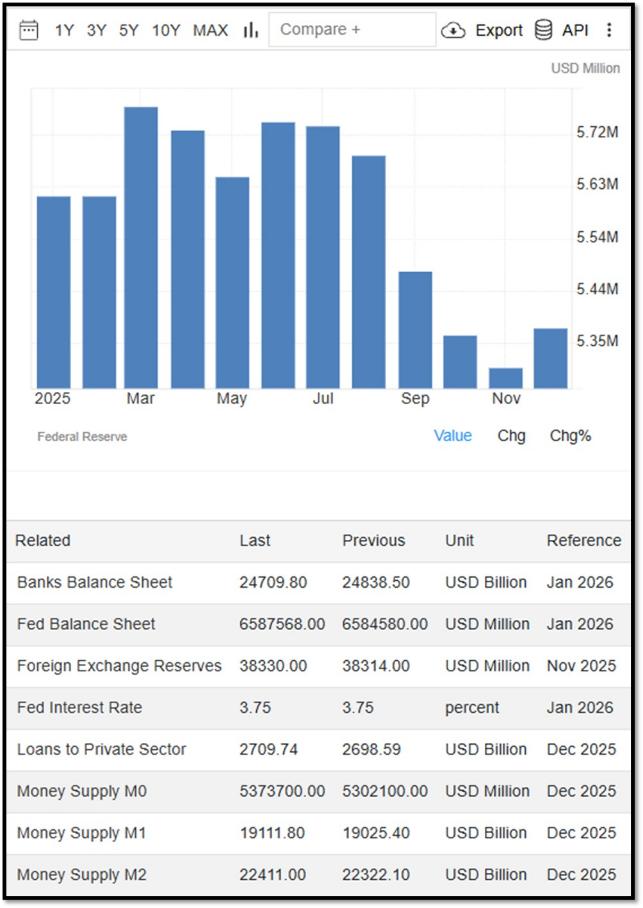
Money Supply M0 in the United States increased to 5,373,700 USD Million in December from 5,302,100 USD Million in November of 2025. Money Supply M0 in the United States averaged 1,232,289.80 USD Million from 1959 until 2025, reaching an all time high of 6,413,100.00 USD Million in December of 2021 and a record low of 48,400.00 USD Million in February of 1961. REF: TradingEconomics, M0
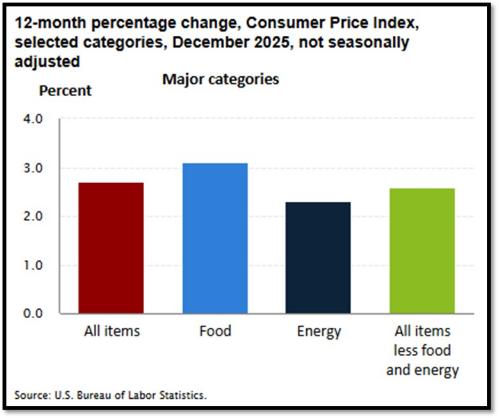
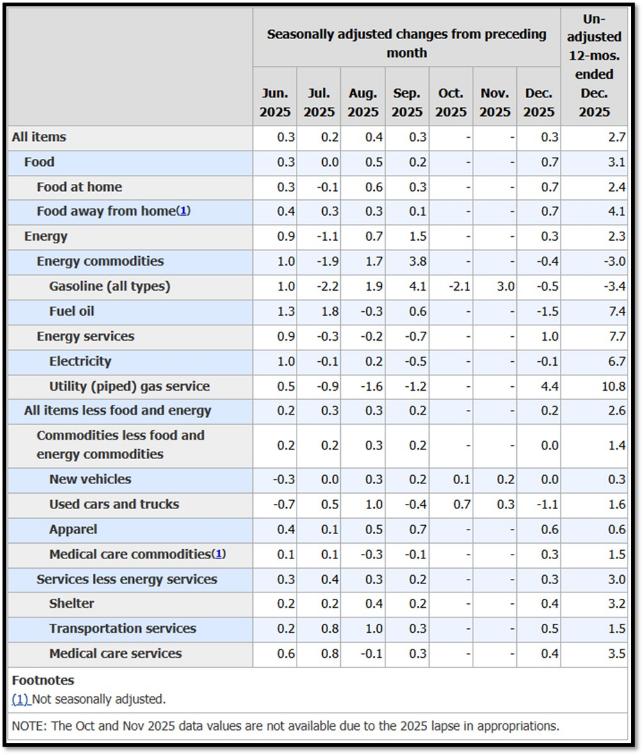
5K. In December, the Consumer Price Index for All Urban Consumers rose 0.3%, seasonally adjusted, and rose 2.7% over the last 12 months, not seasonally adjusted. The index for all items less food and energy increased 0.2% in December (SA); up 2.6% over the year (NSA). January 2026 CPI data are scheduled to be released on February 11, 2026, at 8:30 A.M. Eastern Time.. REF: BLS, BLS.GOV
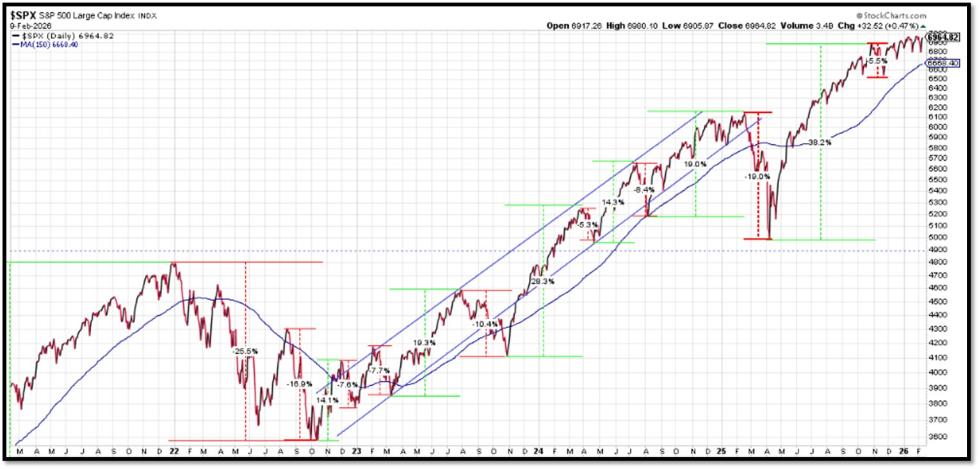
5L. Technical Analysis of the S&P500 Index. Click onto reference links below for images.
- Short-term Chart: Trend Bullish on 2/9/2026 – REF: Short-term S&P500 Chart by Marc Slavin (Click Here to Access Chart)
- Medium-term Chart: Trend Bullish on 2/9/2026 – REF: Medium-term S&P500 Chart by Marc Slavin (Click Here to Access Chart)
- Market Timing Indicators – S&P500 Index as of 2/9/2026 – REF: S&P500 Charts (7 of them) by Joanne Klein’s Top 7 (Click Here to Access Updated Charts)
- The S&P500 is sitting near all-time-high levels, rebounding from two V-shaped recoveries. REF: Stockcharts
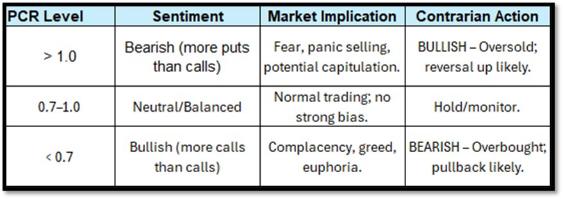
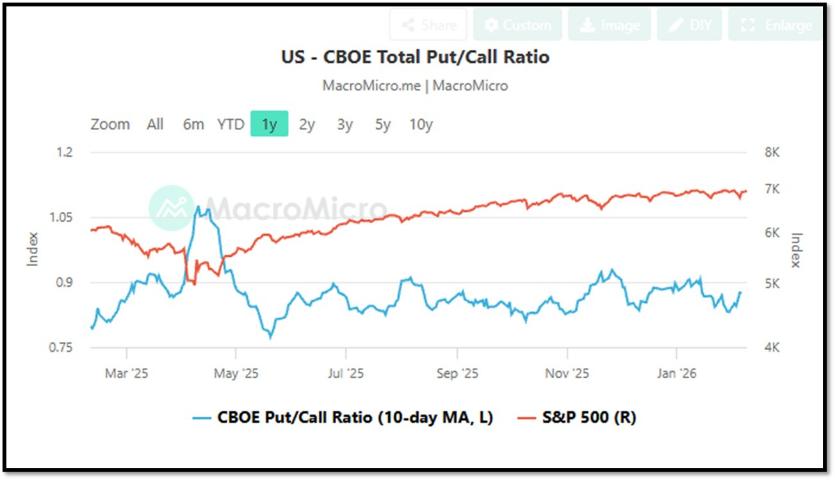
- CBOE Total Put/Call Ratio as of 2/9/2026. REF: MacroMicro
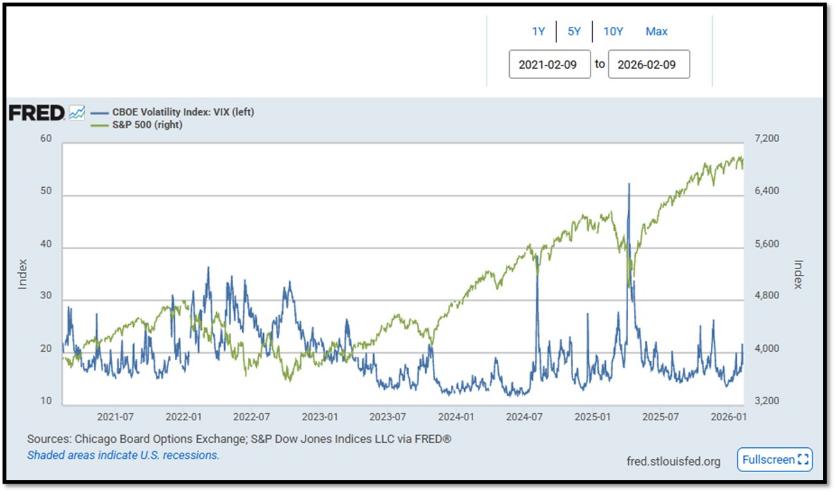
- S&P500 and CBOE Volatility Index (VIX) as of 2/9/2026. REF: FRED, Today’s Print
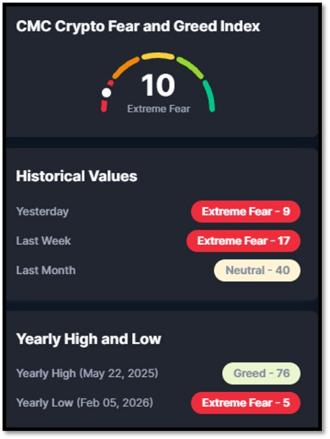
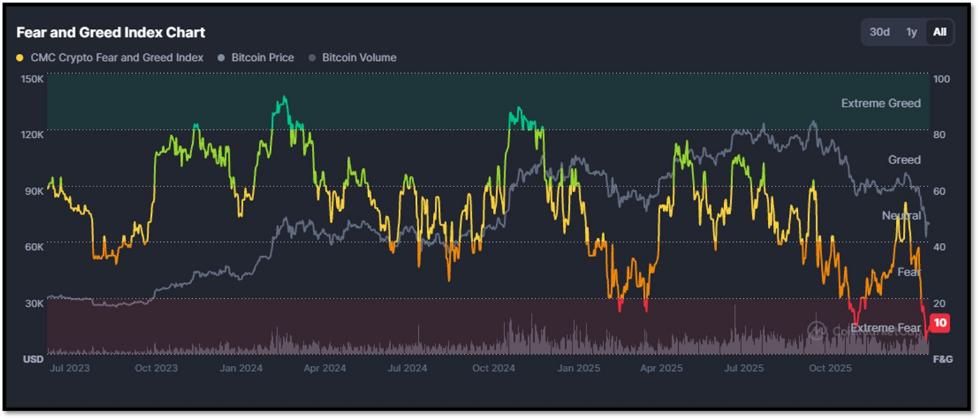
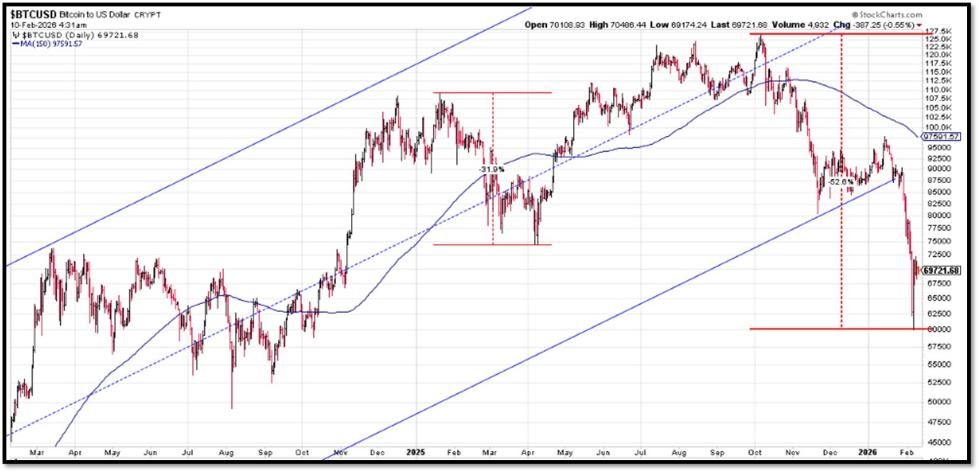
5M. Most recent read on the Crypto Fear & Greed Index with data as of 2/9/2026 is 10 (Extreme Fear). Last week’s data was 17 (Extreme Fear) (1-100). Fear & Greed Index – A Contrarian Data. The crypto market behavior is very emotional. People tend to get greedy when the market is rising which results in FOMO (Fear of missing out). Also, people often sell their coins in irrational reaction of seeing red numbers. With the Crypto Fear and Greed Index, the data try to help save investors from their own emotional overreactions. There are two simple assumptions:
- Extreme fear can be a sign that investors are too worried. That could be a buying opportunity.
- When Investors are getting too greedy, that means the market is due for a correction.
Therefore, the program for this index analyzes the current sentiment of the Bitcoin market and crunch the numbers into a simple meter from 0 to 100. Zero means “Extreme Fear”, while 100 means “Extreme Greed”. REF: Coinmarketcap.com, Today’sReading
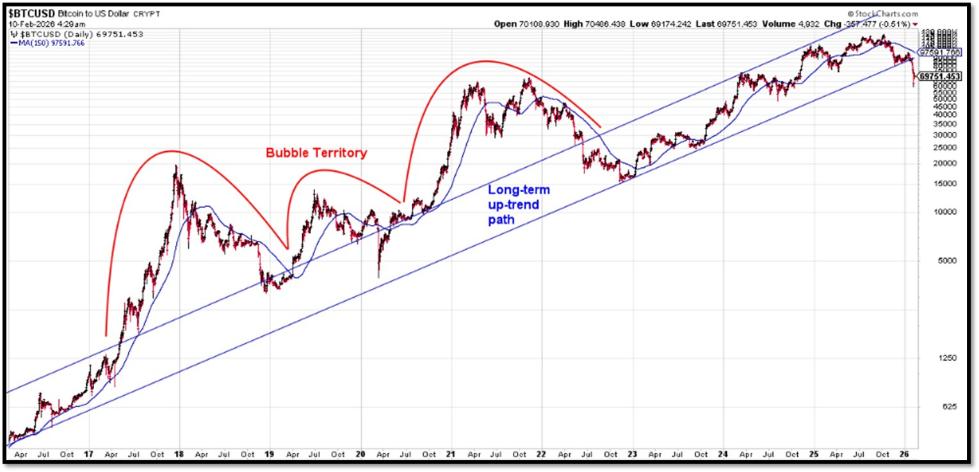
Bitcoin – 10-Year & 2-Year Charts. REF: Stockcharts10Y, Stockcharts2Y
From the desk of our Chief Investment Officer
As an investment professional with over twenty-six years of experience in the financial services industry, Andrew helps clients to protect, grow and transfer wealth during their lifetime with objective, unbiased, customized and efficient strategies.
Education, Professional Licenses Acquired & Affiliations
- Passed the Series 7, 63, 65 and 24 license examinations
- Currently holding Series 65 License
- BA in Economics – Boston University (Boston, MA) 1993
- Certificate in Commodities Trading – New York University (New York, NY) 1991
- Certificate in Financial Planning – New York University (New York, NY) April 2011
With extensive experience in the Financial Services Industry, Andrew Tang and Turner Financial Group provides disciplined wealth management with an intelligent caring approach to each and every client that compliments the Dedicated Financial offering.


Len writes much of his own content, and also shares helpful content from other trusted providers like Turner Financial Group (TFG).
The material contained herein is intended as a general market commentary, solely for informational purposes and is not intended to make an offer or solicitation for the sale or purchase of any securities. Such views are subject to change at any time without notice due to changes in market or economic conditions and may not necessarily come to pass. This information is not intended as a specific offer of investment services by Dedicated Financial and Turner Financial Group, Inc.
Dedicated Financial and Turner Financial Group, Inc., do not provide tax, legal or accounting advice. You should consult your own tax, legal and accounting advisors before engaging in any transaction.
Any hyperlinks in this document that connect to Web Sites maintained by third parties are provided for convenience only. Turner Financial Group, Inc. has not verified the accuracy of any information contained within the links and the provision of such links does not constitute a recommendation or endorsement of the company or the content by Dedicated Financial or Turner Financial Group, Inc. The prices/quotes/statistics referenced herein have been obtained from sources verified to be reliable for their accuracy or completeness and may be subject to change.
Past performance is no guarantee of future returns. Investing involves risk and possible loss of principal capital. The views and strategies described herein may not be suitable for all investors. To the extent referenced herein, real estate, hedge funds, and other private investments can present significant risks, including loss of the original amount invested. All indexes are unmanaged, and an individual cannot invest directly in an index. Index returns do not include fees or expenses.
Turner Financial Group, Inc. is an Investment Adviser registered with the United States Securities and Exchange Commission however, such registration does not imply a certain level of skill or training and no inference to the contrary should be made. Additional information about Turner Financial Group, Inc. is also available at www.adviserinfo.sec.gov. Advisory services are only offered to clients or prospective clients where Turner Financial Group, Inc. and its representatives are properly licensed or exempt from licensure. No advice may be rendered by Turner Financial Group, Inc. unless a client service agreement is in place.


