

- 1. It’s a shortened week at Wall Street with the holidays upon us. Many traders and institutional managers are off. Trading volume is light as expected but the week is packed with important economic data releases.
- 2. Main story this week focuses on Tesla, one of our Strategic Allocation in many investment portfolios.
- 3. Heard of ‘Tax-Aware Long-Short strategy’ before? It’s basically a beefed-up take on standard tax-loss harvesting that big Wall Street shops are pushing for ultra-rich clients slammed with massive capital gains taxes (think tech stock windfalls or AI boom profits).
- 4. World Watch
- 4A. The AI-driven surge in data-center development is reshaping commercial real estate, creating outsized gains for investors while introducing new structural risks.
- 4B. A Santa Claus rally refers to the historical tendency for U.S. equity markets to rise during the final five trading days of December and the first two trading days of January.
- 4C. An updated snapshot of the current global state of economy.
- 5. Quant & Technical Corner – A selection of quantitative & technical data we monitor on a regular basis to help gauge the overall financial market conditions and the investment environment.
1. It’s a shortened week at Wall Street with the holidays upon us. Many traders and institutional managers are off. Trading volume is light as expected but the week is packed with important economic data releases.
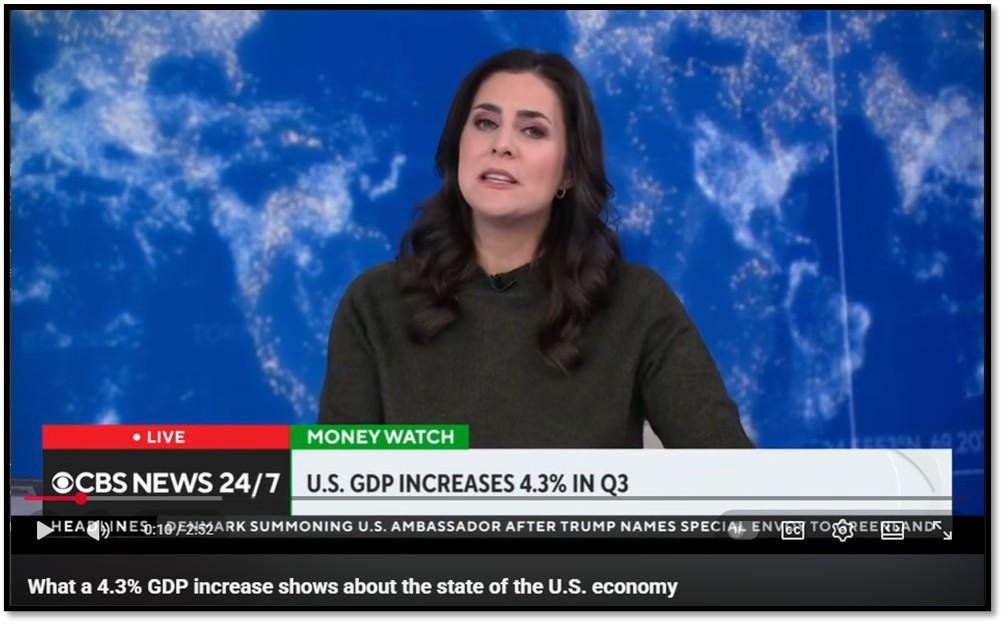
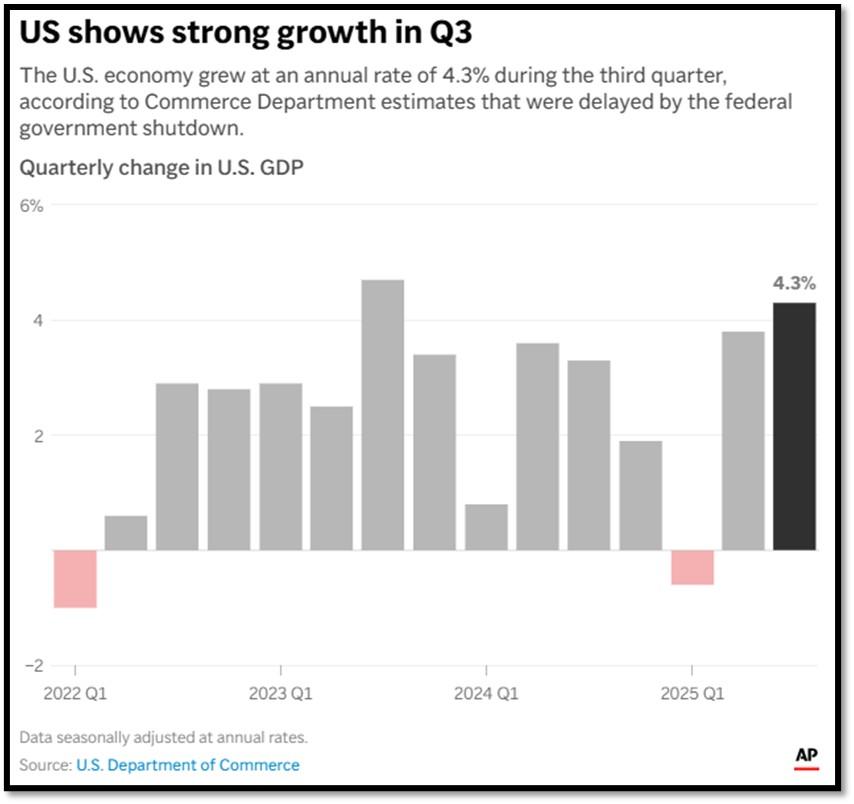
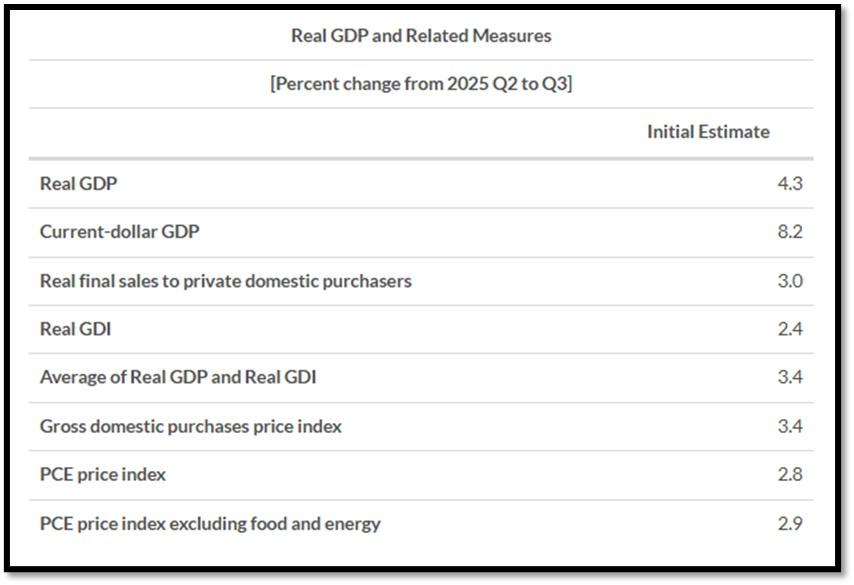
Today, the BEA (Bureau of Economic Analysis) released the initial estimate for Q3 2025 GDP, showing a strong 4.3% annualized growth rate (up from 3.8% in Q2). Key drivers included solid PCE (personal consumption expenditures) contributing around 2.4%, reflecting resilient consumer spending, alongside boosts from exports and government outlays. Gross Domestic Income (GDI), the income-side measure, provided a consistent picture of underlying strength, though details were impacted by prior data delays from the government shutdown. Next release is January 22, 2026, for updates to this data set.
Looking ahead, initial jobless claims data comes out tomorrow and it is expected to stay elevated, likely in the low-to-mid 220k range amid ongoing labor market softening signals. Click onto picture below to access video. REF: BEA, AP, Briefing
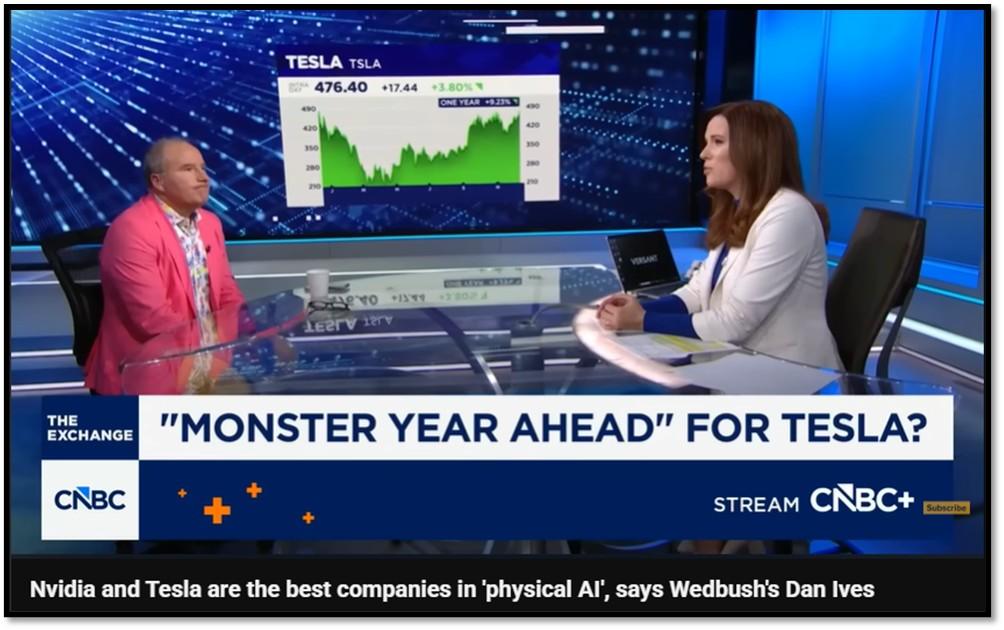
2. Main story this week focuses on Tesla, one of our Strategic Allocation in many investment portfolios.
Tesla heads into 2026 as a pivotal year, shifting from pure EV growth to autonomy, robotics, Real-World-AI-driven revenue, and potentially in-house chip production. Analysts and Elon Musk highlight several key catalysts, including Tesla’s push toward custom silicon to enhance self-reliance amid supply chain risks and geopolitical tensions.
Vehicle Deliveries and Core Auto Business – Wall Street consensus points to modest growth, with estimates around 1.75–2 million vehicle deliveries (up from approximately 1.8M in 2025). Focus shifts on affordability (new lower-cost models potentially launching early 2026) and energy storage ramp-up (Megapacks driving record margins). Tesla may accelerate its chip strategy, building on the Dojo supercomputer chips, to produce proprietary semiconductors for EVs and AI hardware, reducing dependence on external suppliers like TSMC and potentially lowering costs while improving performance.
Robotaxi and Cybercab Rollout – This dominates the narrative. Tesla targets volume production of the steering-wheel-less Cybercab starting April/Q2 2026, with initial fleets expanding unsupervised robotaxi services (already piloted in Austin/SF in late 2025). Analysts like Morgan Stanley forecast ~1,000 robotaxis operational in 2026, scaling rapidly; bulls see this unlocking high-margin software/services revenue and validating FSD as a precursor to broader unsupervised autonomy.
Optimus Humanoid Robot – Expect limited external sales/production toward late 2026 (after internal factory use in 2025), with Musk emphasizing its long-term potential to dwarf auto revenue and enable universal high income/abundance.
Broader Outlook – Energy business continues strong growth, while stock forecasts vary wildly. Meaningful upside can be achieved if autonomy and chip self-sufficiency hit milestones. Risks include regulatory delays, execution on production ramps (including chips), and competition (Waymo). Overall, 2026 is viewed as a “show-me” year for Tesla’s Real-World-AI pivot, with in-house chip production potentially transforming supply chain resilience and valuation from auto manufacturer to tech/platform giant. Click onto picture below to access video. REF: BARRON’S, MorningStar, CNBC, ARK-Invest
NOTE: Not investment advice or recommendations. Investors should carefully consider the investment objectives, risks, charges, and expenses before investing. For additional information about the securities mentioned above, please visit the respective security’s investor relations pages for additional information. Please read all materials carefully before investing.
https://ir.tesla.com/#quarterly-disclosure
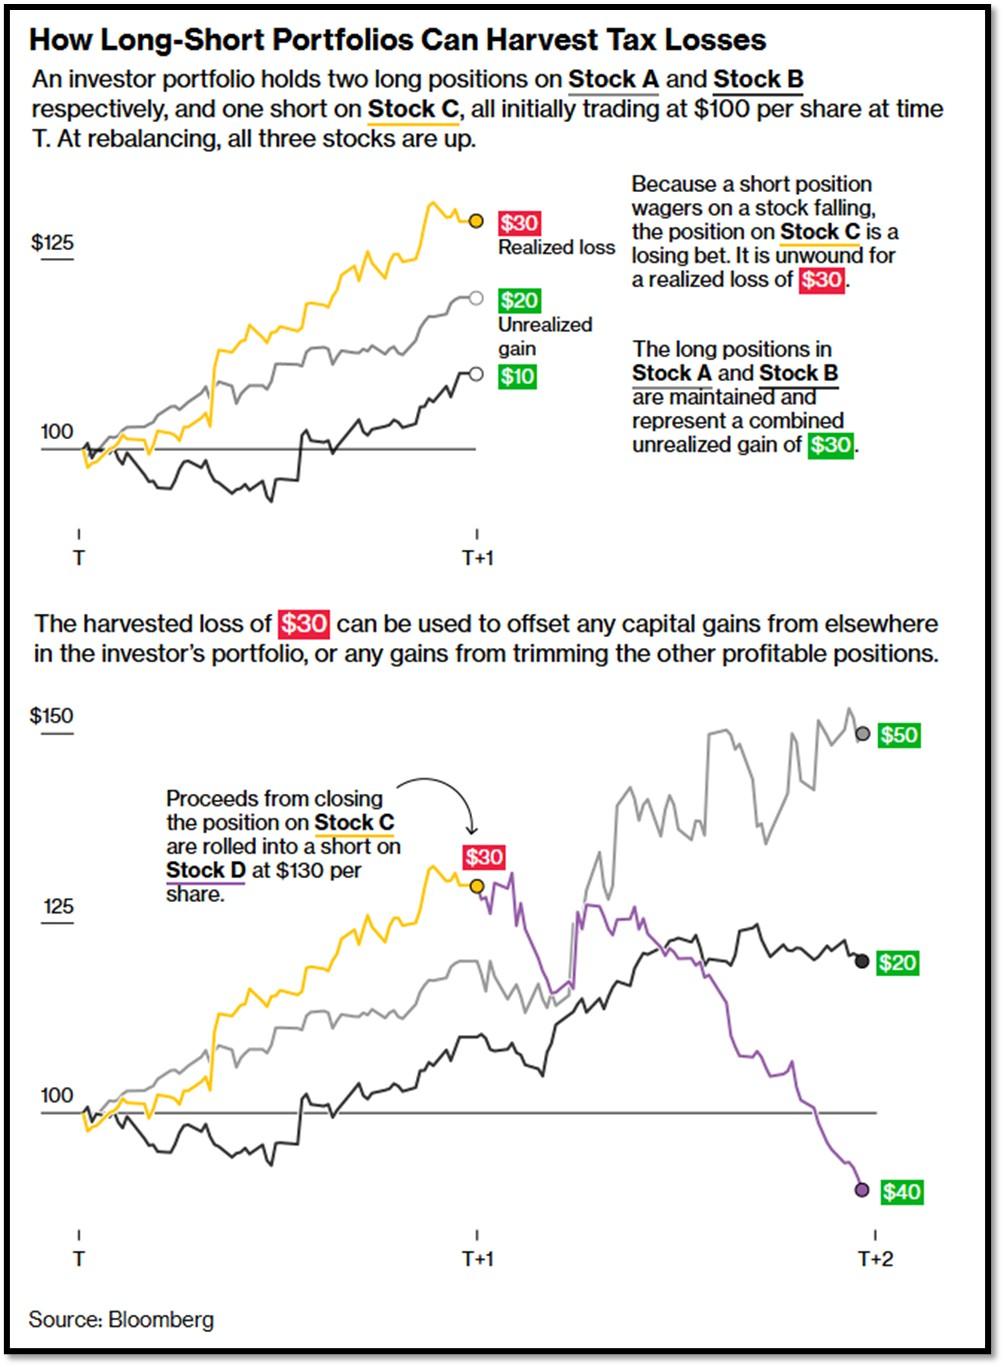
3. Heard of ‘Tax-Aware Long-Short strategy’ before? It’s basically a beefed-up take on standard tax-loss harvesting that big Wall Street shops are pushing for ultra-rich clients slammed with massive capital gains taxes (think tech stock windfalls or AI boom profits).
They build custom portfolios mixing longs (stocks you expect to climb) and shorts (ones likely to drop), often with leverage and factor tilts. The core hack is cranking turnover to intentionally rack up losses, mostly from shorts or laggards, while holding winners as long as possible. This spits out huge net capital losses early on (sometimes over 100% of your starting capital in the first couple years) without killing pre-tax returns, since the trading mostly follows the core alpha strategy.
The real juice isn’t just the losses, it’s the gain deferral, letting you push taxes on appreciation basically forever. Investors can usually expect after-tax returns that beat plain stock market benchmarks (like the S&P 500), thanks to the tax alpha—even if pre-tax returns are similar or a bit below due to costs. Costs aren’t cheap, though:
- Management fees: Typically, 1% to 2%+ for these bespoke setups
- Financing/margin interest: Around 0.8% to 1% net annualized
- Stock borrowing fees: Variable, can sting on crowded shorts
All-in effective expense ratios often hit 1.3% to 5.3% when factoring in borrowing and dividends. Assets in these plays have exploded lately, but they’re catching heat for widening the tax gap for the super-wealthy—plus risks like short squeezes or future IRS crackdowns. REF: Bloomberg, AQR
NOTE: Not investment/tax advice or recommendations. Investors should carefully consider the investment objectives, risks, charges, and expenses before investing. For additional information about the securities mentioned above, please visit the respective security’s investor relations pages for additional information. Please read all materials carefully before investing.
With the current macro-economic backdrop, below are areas we currently favor:
- Fixed Income – (Corporates & Muni) High Yield as Opportunistic Allocation (Low-Beta)
- Fixed Income – Short-term Corporates & Muni (Low-Beta)
- Businesses that benefit from AI & Automation (Market-Risk)
- Small-Cap & Bio-Technology (Market-Risk)
- Neo-Cloud Computing (Market-Risk)
- Fintech & Financials (Market-Risk)
- Cyber-Security & Software (Market-Risk)
- Quantum Computing (Market-Risk)
- Digital Asset – Bitcoin (Market-Risk/Hedge)
4. World Watch
4A. The AI-driven surge in data-center development is reshaping commercial real estate, creating outsized gains for investors while introducing new structural risks.
For the first time, spending on data-center construction is on track to exceed office-building construction, reflecting a fundamental shift in how capital is allocated within property markets. Demand from hyperscalers and AI infrastructure providers has driven rapid development, rising land values, and premium lease rates, particularly in power-rich regions.
However, this transformation also introduces concentration risk. Data centers are capital-intensive, highly specialized assets that depend on sustained AI demand, reliable energy supply, and favorable regulatory environments. Unlike traditional office real estate, these properties face limited alternative uses if demand cools, exposing investors to higher downside risk in the event of overbuilding, power constraints, or changes in technology efficiency. As AI reshapes the real estate landscape, investors must weigh exceptional near-term returns against longer-term cyclicality and asset-specific vulnerabilities. Click onto picture below to access video. REF: WSJ, CRE360, CNBC

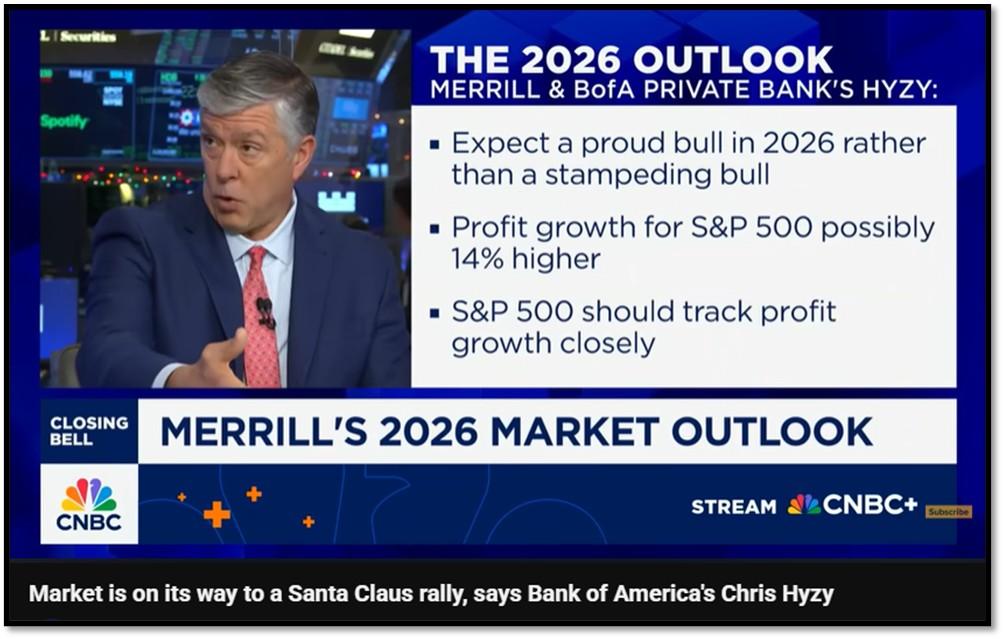
4B. A Santa Claus rally refers to the historical tendency for U.S. equity markets to rise during the final five trading days of December and the first two trading days of January.
The phenomenon is often attributed to a combination of factors, including year-end portfolio rebalancing, holiday optimism, lighter trading volumes, reinvestment of year-end bonuses, and tax-related positioning following November and December selling. Historically, this period has produced positive returns more often than not, and when the rally fails to materialize, it has sometimes preceded weaker market performance in the following year.
We should be experiencing a Santa Claus rally in the current environment given the convergence of supportive conditions. Inflation pressures have continued to moderate, the Federal Reserve has signaled a shift toward a more accommodative policy stance, and liquidity conditions typically improve as year-end funding pressures ease. In addition, positioning remains cautious following recent volatility, creating room for incremental buying rather than exhaustion. While no seasonal pattern is guaranteed, the macro and liquidity backdrop suggests the setup is consistent with the conditions under which a Santa Claus rally has historically occurred. Click onto picture below to access video. REF: CNBC
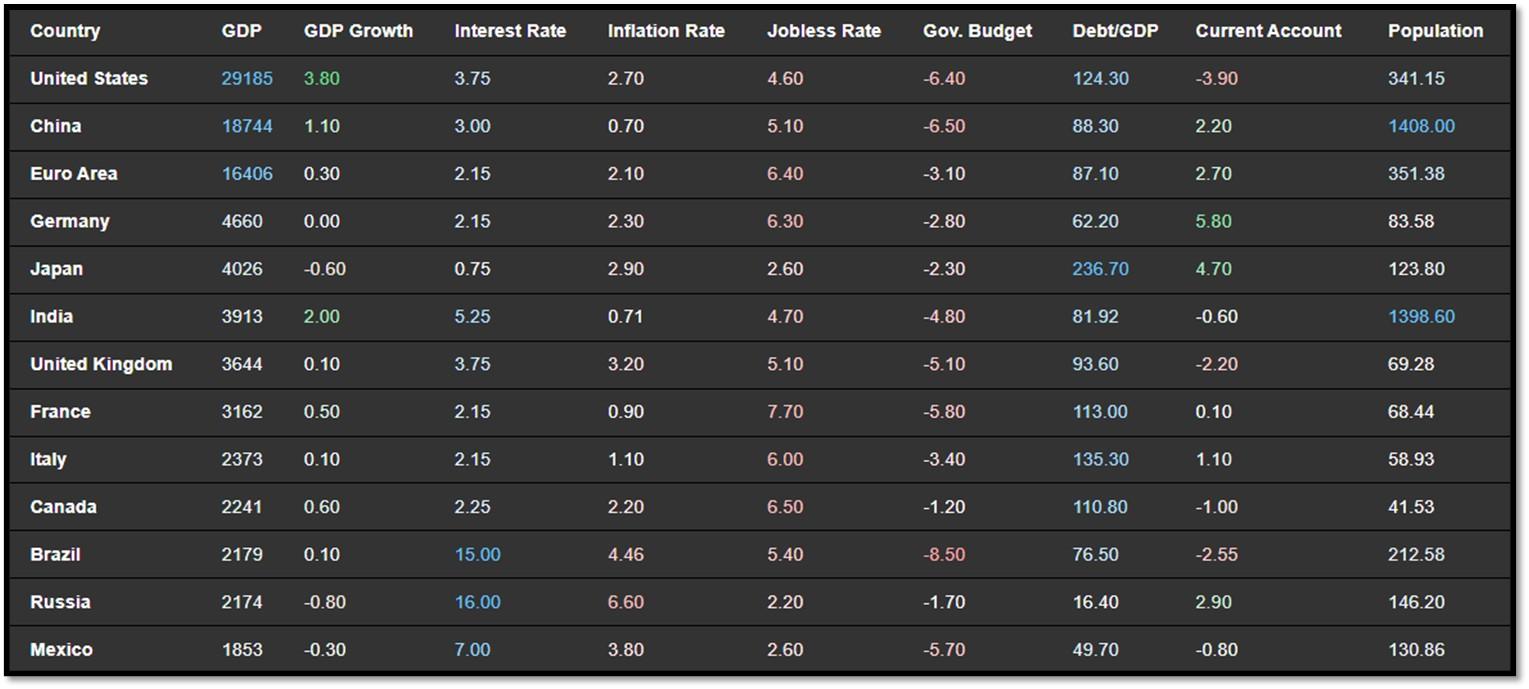
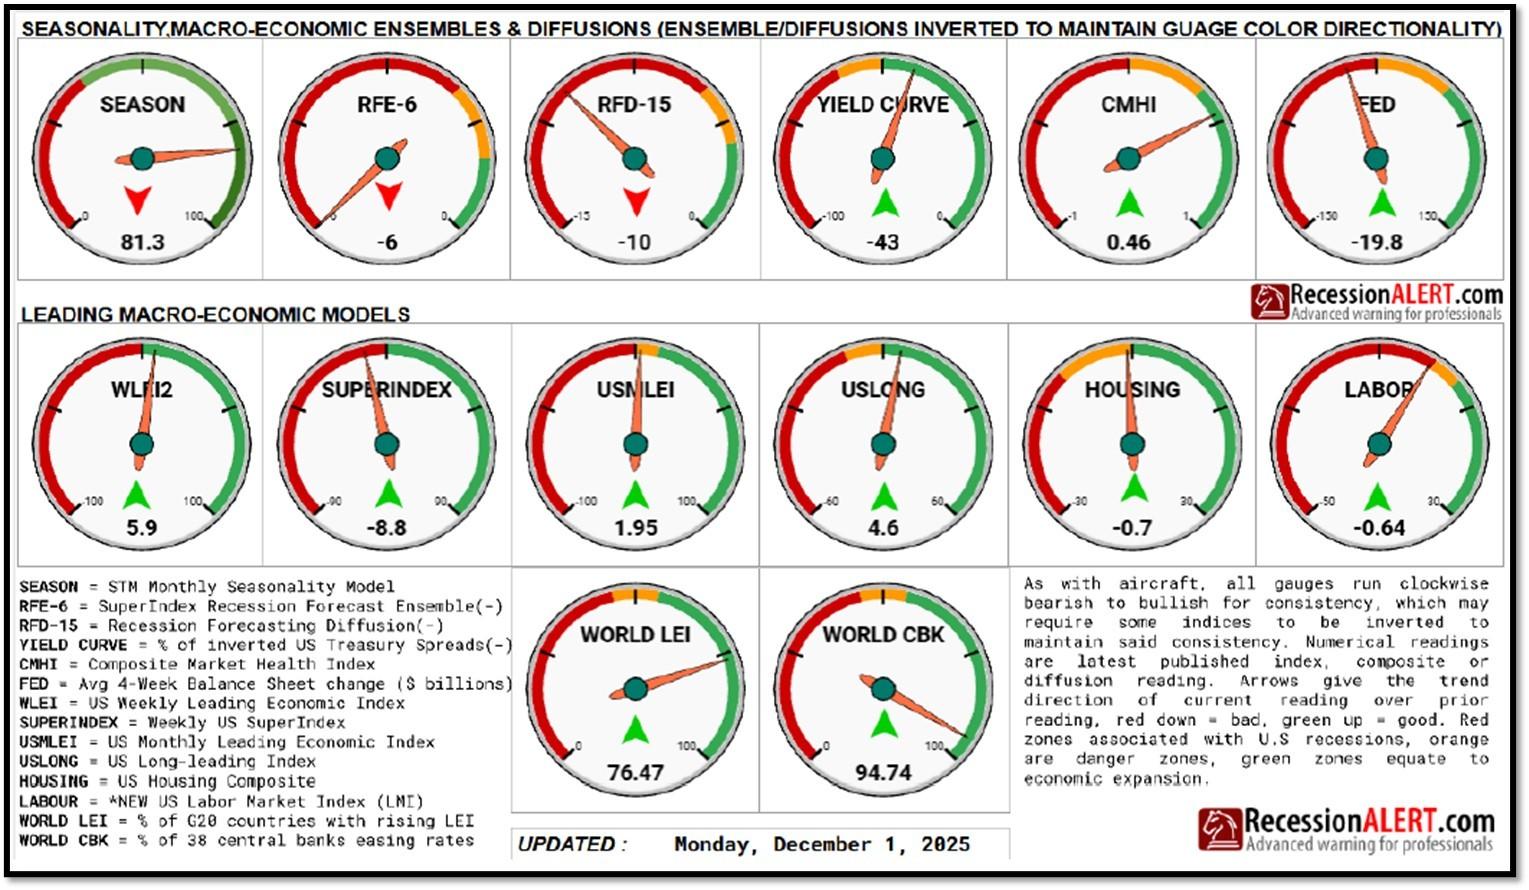
4C. An updated snapshot of the current global state of economy.
According to TradingEconomics as of 12/22/2025 (REF: TradingEconomics):
- The annual inflation rate in the US came in at 2.7% in December 2025, the lowest since July, below forecast of 3.1% and 3% reported for September.
- The Bank of Japan unanimously raised its key short-term interest rate by 25bps to 0.75% at its December meeting, marking the highest level since September 1995 and aligning with market expectation.
- Japan’s annual inflation rate edged down to 2.9% in November 2025 from October’s 3-month high of 3.0%, as food inflation hit its lowest in a year (6.1% vs 6.4% in October) amid the slowest rise in 15 months for rice prices.
- The gross domestic product in India expanded 2% quarter-on-quarter in the three months to September 2025, accelerating from a 1.8% growth in the previous period, according to data from OECD.
5. Quant & Technical Corner – A selection of quantitative & technical data we monitor on a regular basis to help gauge the overall financial market conditions and the investment environment.
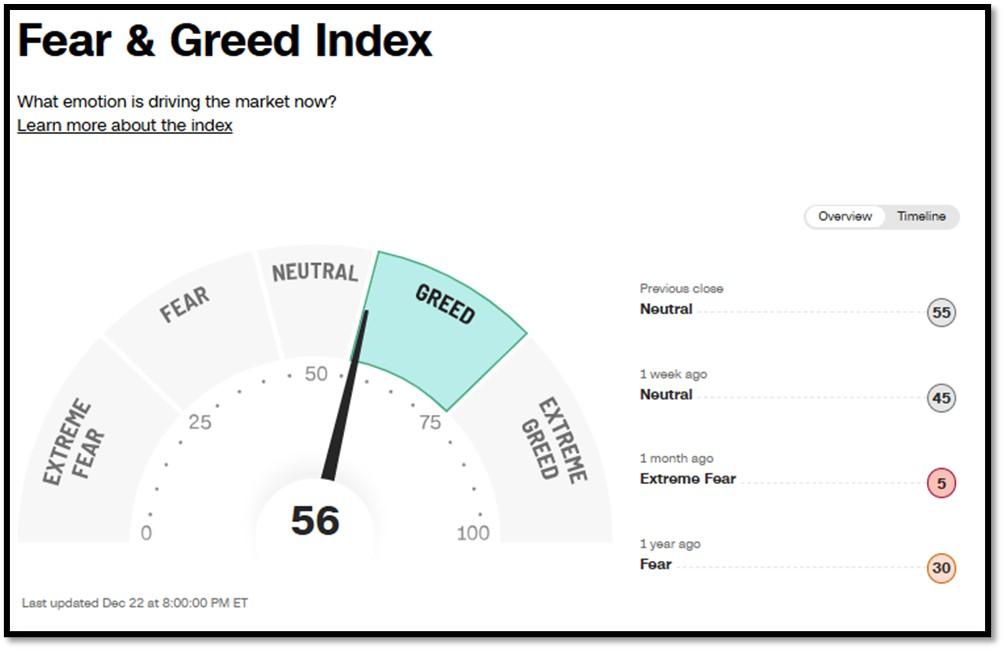
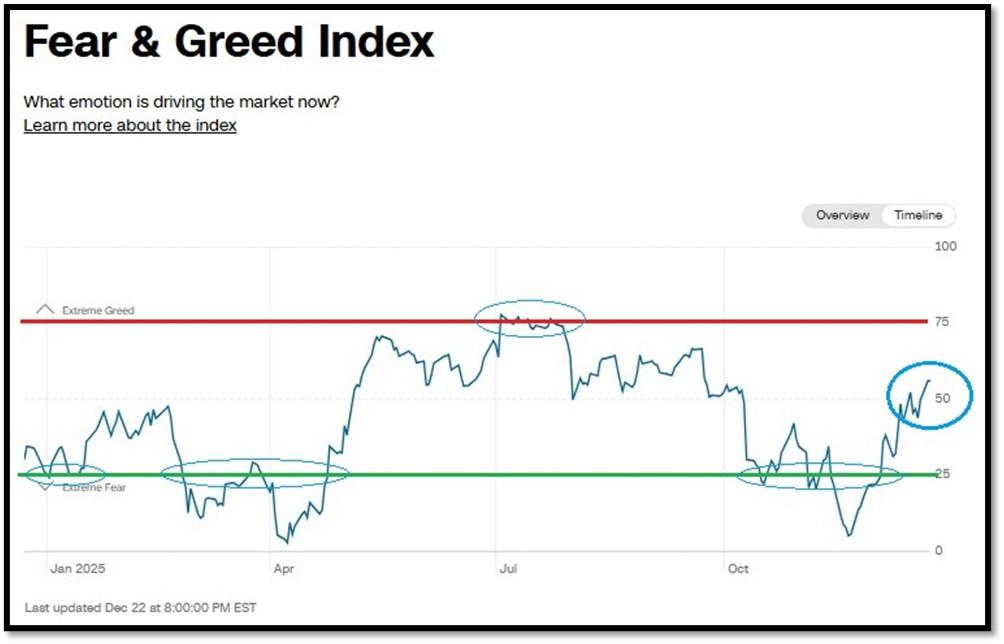
5A. Most recent read on the Fear & Greed Index with data as of 12/22/2025 – 8:00 PM-ET is 56 (Greed). Last week’s data was 45 (Neutral) (1-100). CNNMoney’s Fear & Greed index looks at 7 indicators (Stock Price Momentum, Stock Price Strength, Stock Price Breadth, Put and Call Options, Junk Bond Demand, Market Volatility, and Safe Haven Demand). Keep in mind this is a contrarian indicator! REF: Fear&Greed via CNNMoney
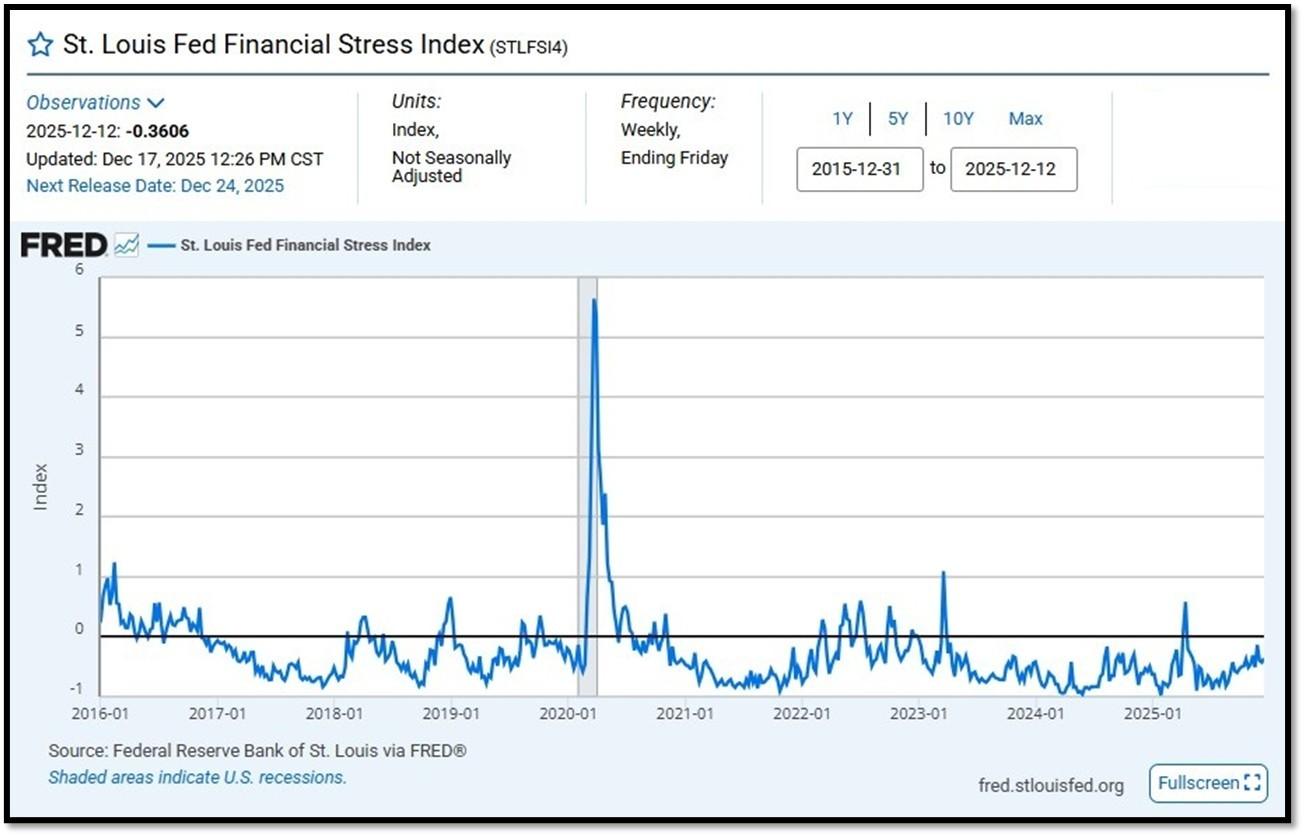
5B. St. Louis Fed Financial Stress Index’s (STLFSI4) most recent read is at –0.3606 as of December 17, 2025. Previous week’s data was -0.4257. A big spike up from previous readings reflecting the turmoil in the banking sector back in 2023. This weekly index is not seasonally adjusted. The STLFSI4 measures the degree of financial stress in the markets and is constructed from 18 weekly data series: seven interest rate series, six yield spreads and five other indicators. Each of these variables captures some aspect of financial stress. Accordingly, as the level of financial stress in the economy changes, the data series are likely to move together. REF: St. Louis Fed
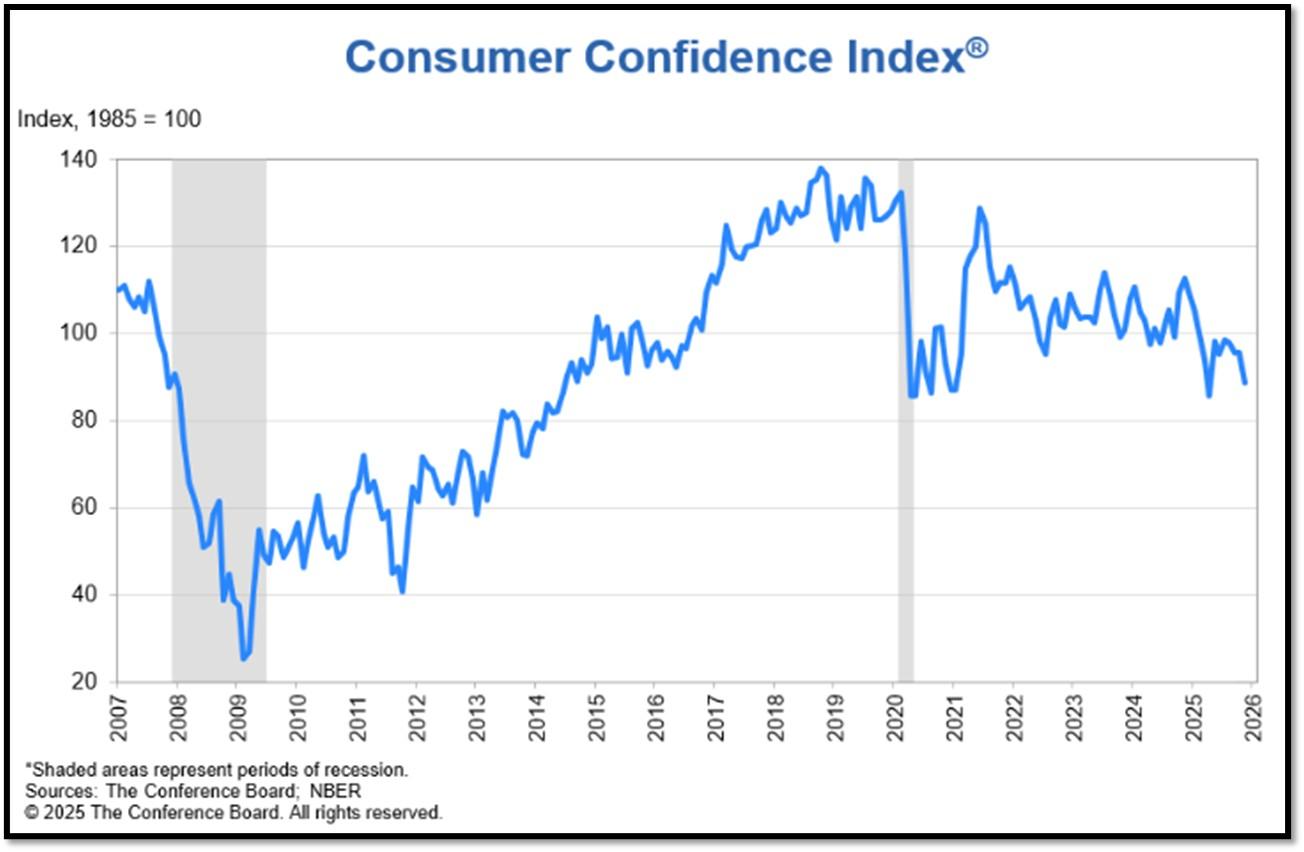
5C. Consumers revealed reduced confidence across jobs, incomes, and financial situations, both now and in the future, potentially due to the government shutdown. The Conference Board Consumer Confidence Index® declined by 6.8 points in November to 88.7 (1985=100) from 95.5 in October. “Consumer confidence tumbled in November to its lowest level since April after moving sideways for several months,” said Dana M Peterson, Chief Economist, The Conference Board. “All five components of the overall index flagged or remained weak. REF: ConsumerConfidence
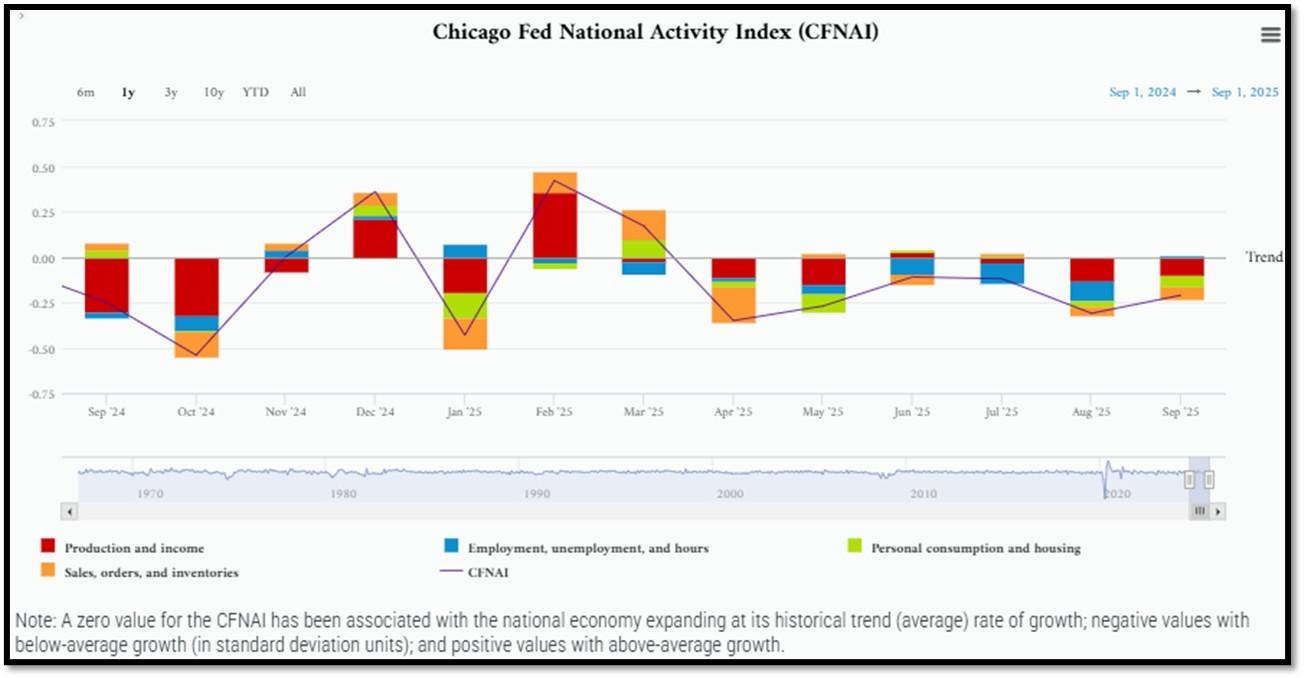
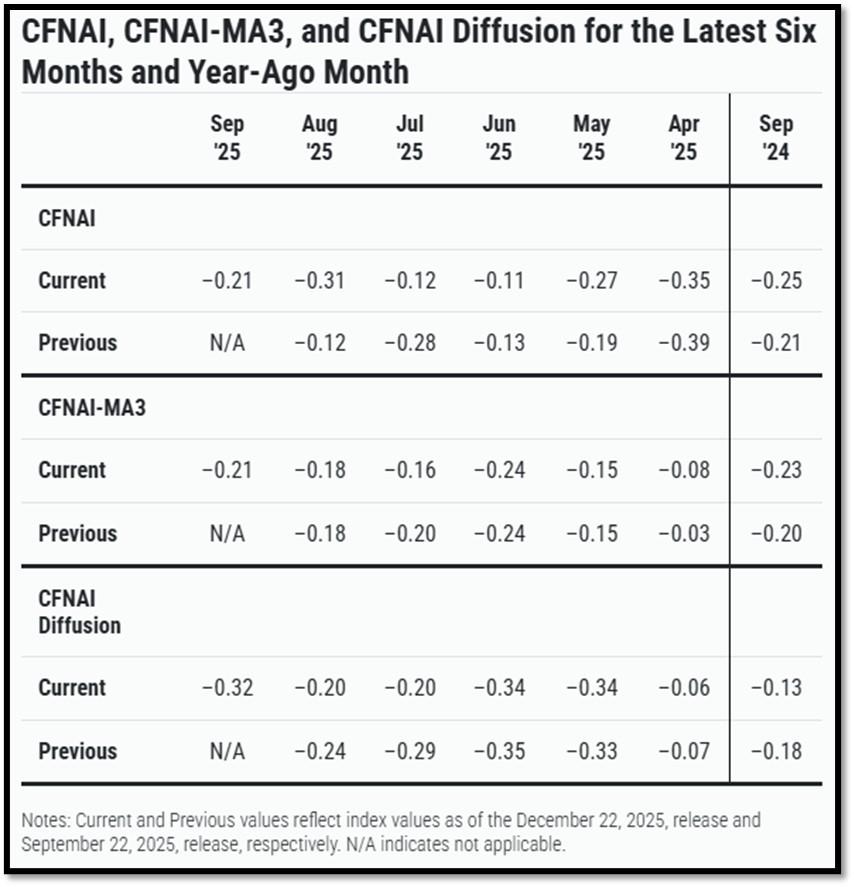
5D. The Chicago Fed National Activity Index (CFNAI) increased to –0.21 in September from –0.31 in August. Two of the four broad categories of indicators used to construct the index decreased from August, and three categories made negative contributions in September. The index’s three-month moving average, CFNAI-MA3, decreased to –0.21 in September from –0.18 in August. REF: ChicagoFed, September’s Report
5E. (12/9/2025) The Conference Board Leading Economic Index® (LEI) for the US declined by 0.3% in September 2025 to 98.3 (2016=100), after also declining by 0.3% in August (upwardly revised from an originally reported 0.5% decline). Overall, the LEI fell by 2.1% over the six months between March and September 2025, a faster rate of decline than its 1.3% contraction over the previous six-month period (September 2024 to March 2025). The composite economic indexes are the key elements in an analytic system designed to signal peaks and troughs in the business cycle. The indexes are constructed to summarize and reveal common turning points in the economy in a clearer and more convincing manner than any individual component. The CEI is highly correlated with real GDP. The LEI is a predictive variable that anticipates (or “leads”) turning points in the business cycle by around 7 months. Shaded areas denote recession periods or economic contractions. The dates above the shaded areas show the chronology of peaks and troughs in the business cycle. The ten components of The Conference Board Leading Economic Index® for the U.S. include: Average weekly hours in manufacturing; Average weekly initial claims for unemployment insurance; Manufacturers’ new orders for consumer goods and materials; ISM® Index of New Orders; Manufacturers’ new orders for nondefense capital goods excluding aircraft orders; Building permits for new private housing units; S&P 500® Index of Stock Prices; Leading Credit Index™; Interest rate spread (10-year Treasury bonds less federal funds rate); Average consumer expectations for business conditions. REF: ConferenceBoard, LEI Report for August (ReceesionAlert) (Released on 9/30/2025)
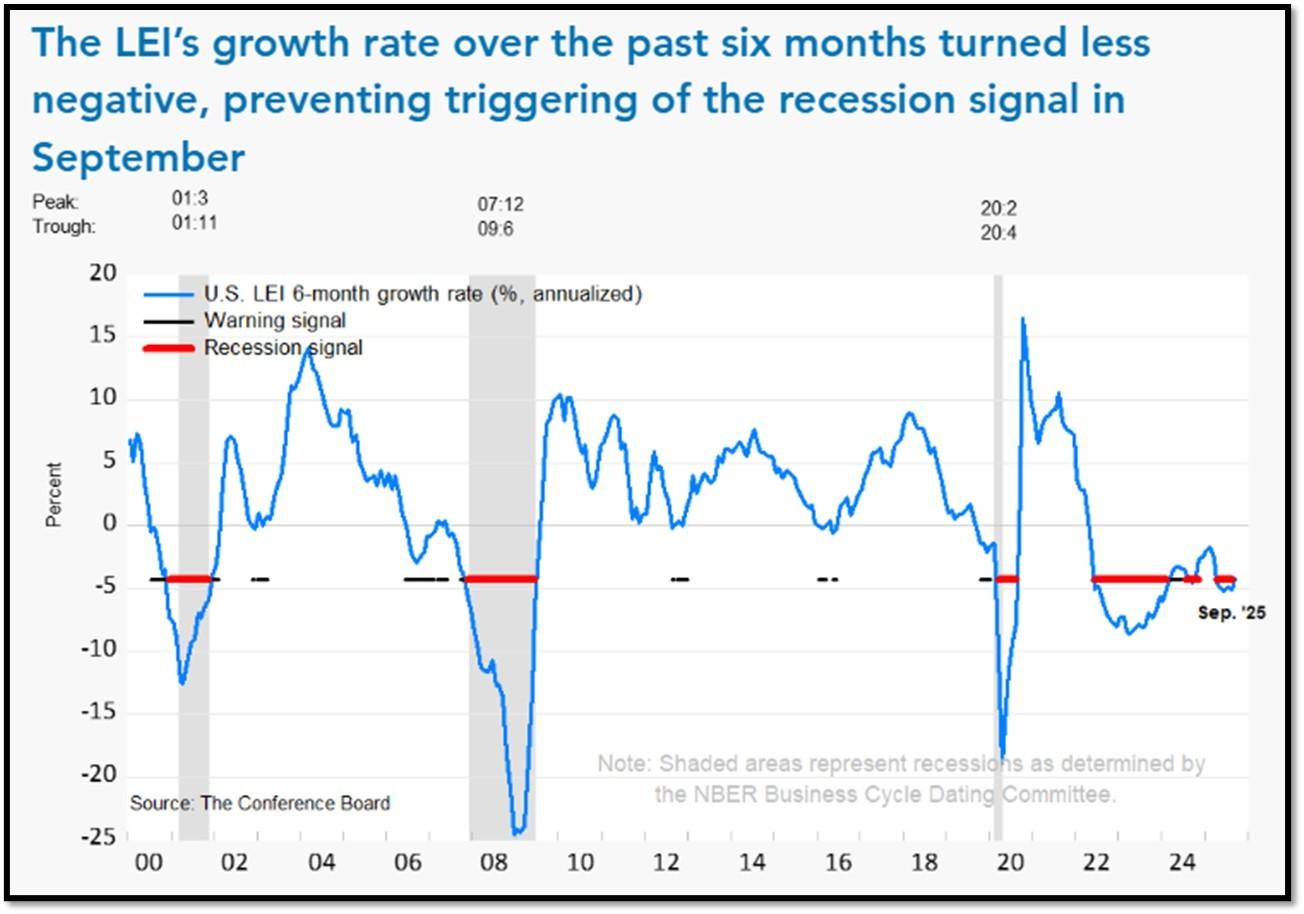
We have experienced a “rolling recession” since June 2022 and are only now emerging from it. However, authorities are not labeling it a recession due to high employment data from June 2022-2025.
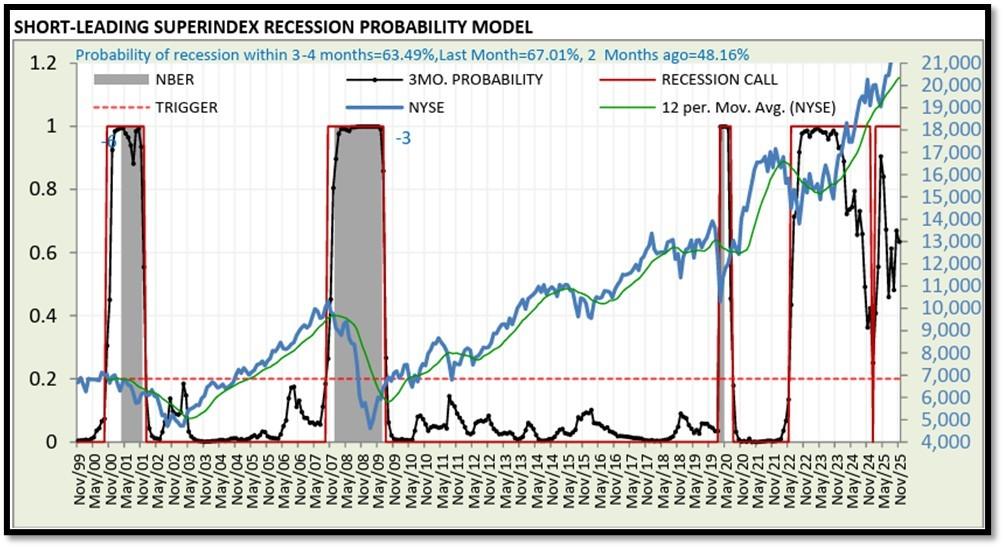
5F. Probability of U.S. falling into Recession within 3 to 4 months is currently at 63.49% (with data as of 12/01/2025 – Next Report 12/15/2025) according to RecessionAlert Research. Last release’s data was at 46.3%. This report is updated every two weeks. REF: RecessionAlertResearch
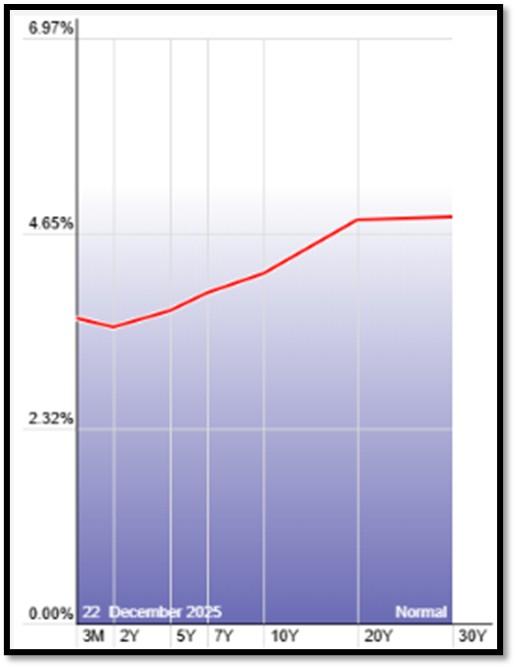
5G. Yield Curve as of 12/22/2025 is showing Normal. Spread on the 10-yr Treasury Yield (4.15%) minus yield on the 2-yr Treasury Yield (3.50%) is currently at 65bps. REF: Stockcharts The yield curve—specifically, the spread between the interest rates on the ten-year Treasury note and the three-month Treasury bill—is a valuable forecasting tool. It is simple to use and significantly outperforms other financial and macroeconomic indicators in predicting recessions two to six quarters ahead. REF: NYFED
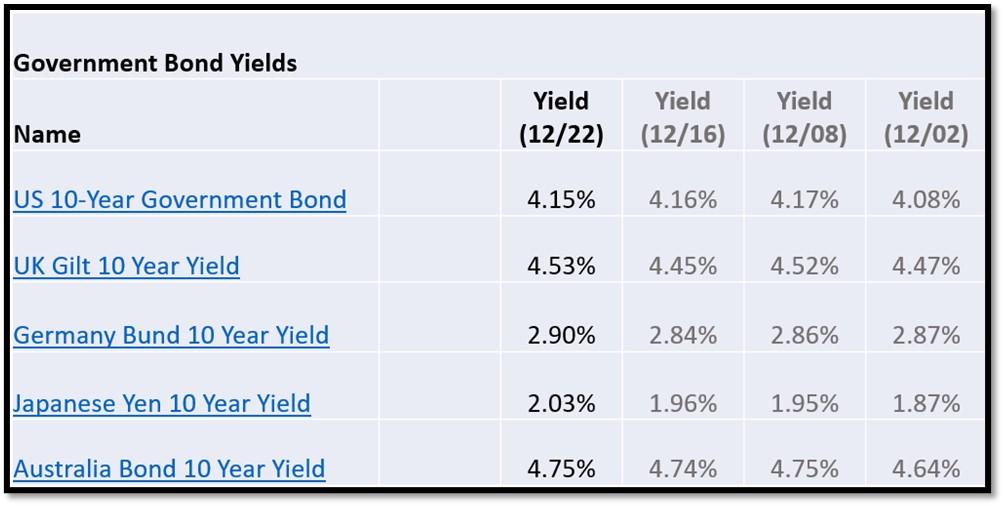
5H. Recent Yields in 10-Year Government Bonds. REF: Source is from Bloomberg.com, dated 12/22/2025, rates shown below are as of 12/22/2025, subject to change.
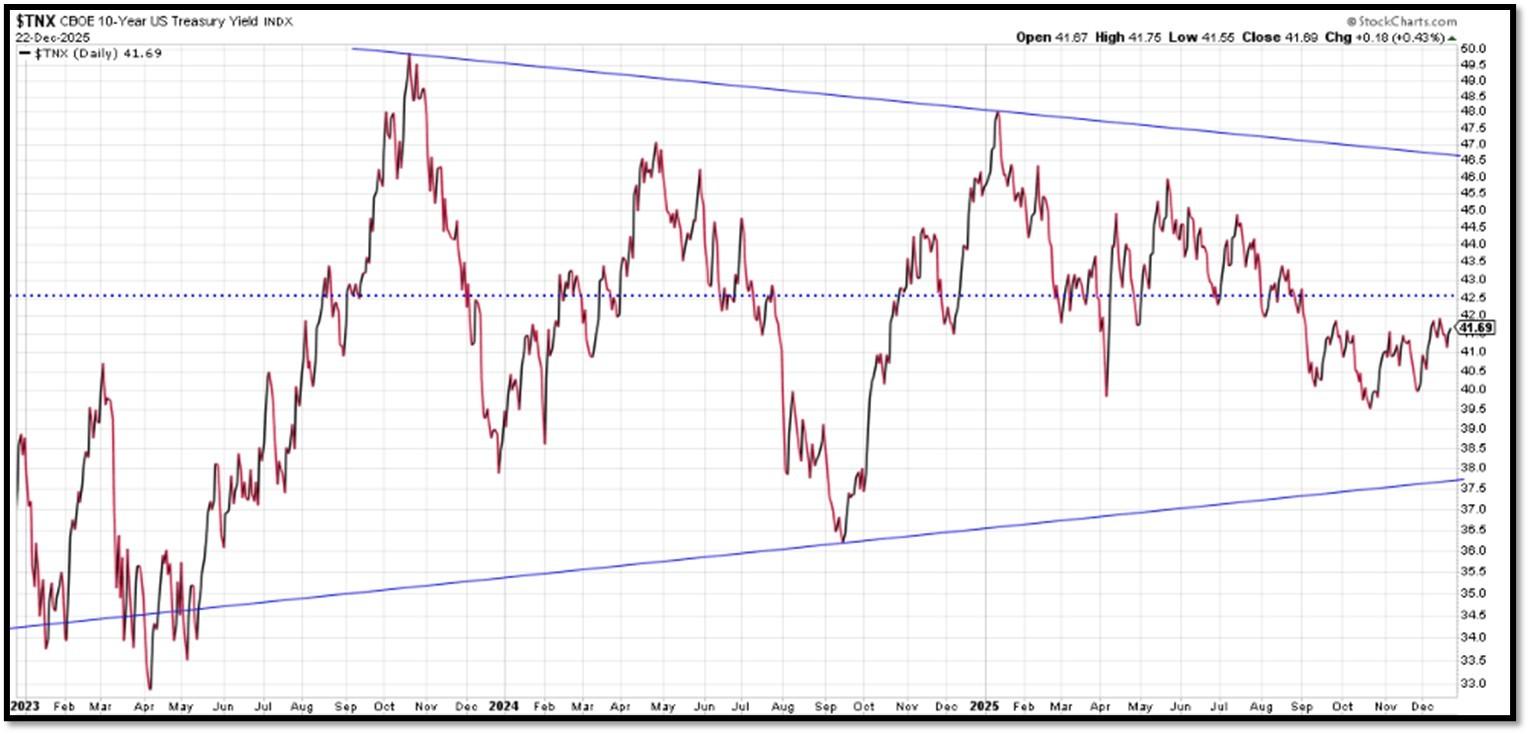
The 10-Year US Treasury Yield… The 10-Year Yield is indirectly related to inflation and prospect of the economy. I expect the 10-Year Yield to drop towards the support line. REF: StockCharts1
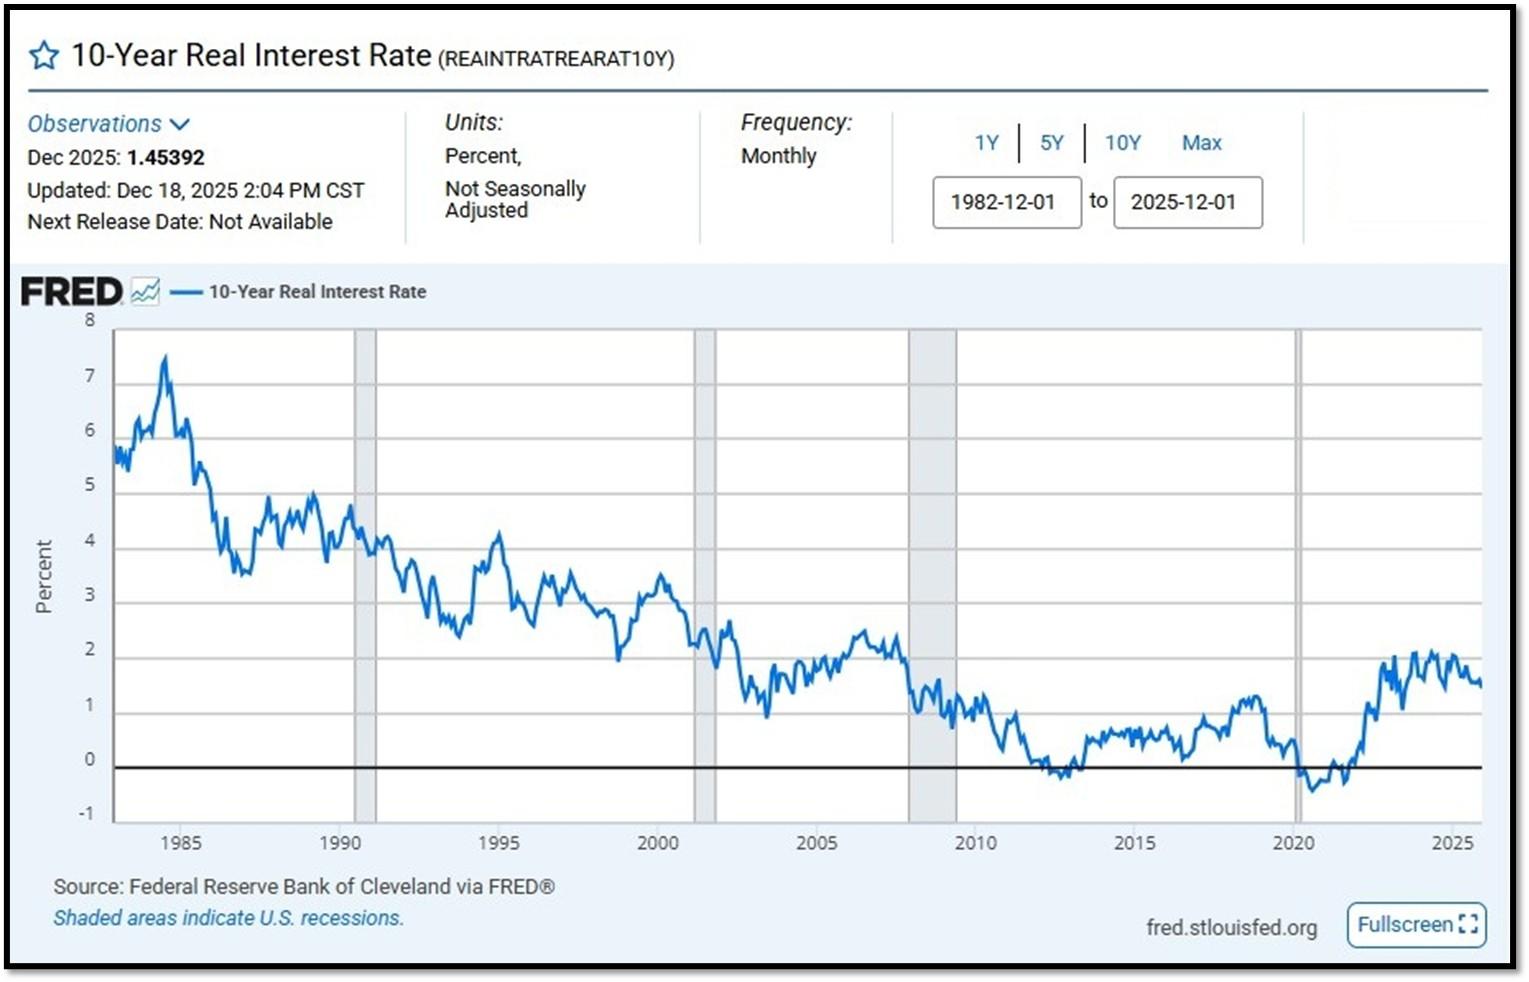
10-Year Real Interest Rate at 1.45392% as of 12/18/25. Last month’s data was 1.56911%. REF: REAINTRATREARAT10Y
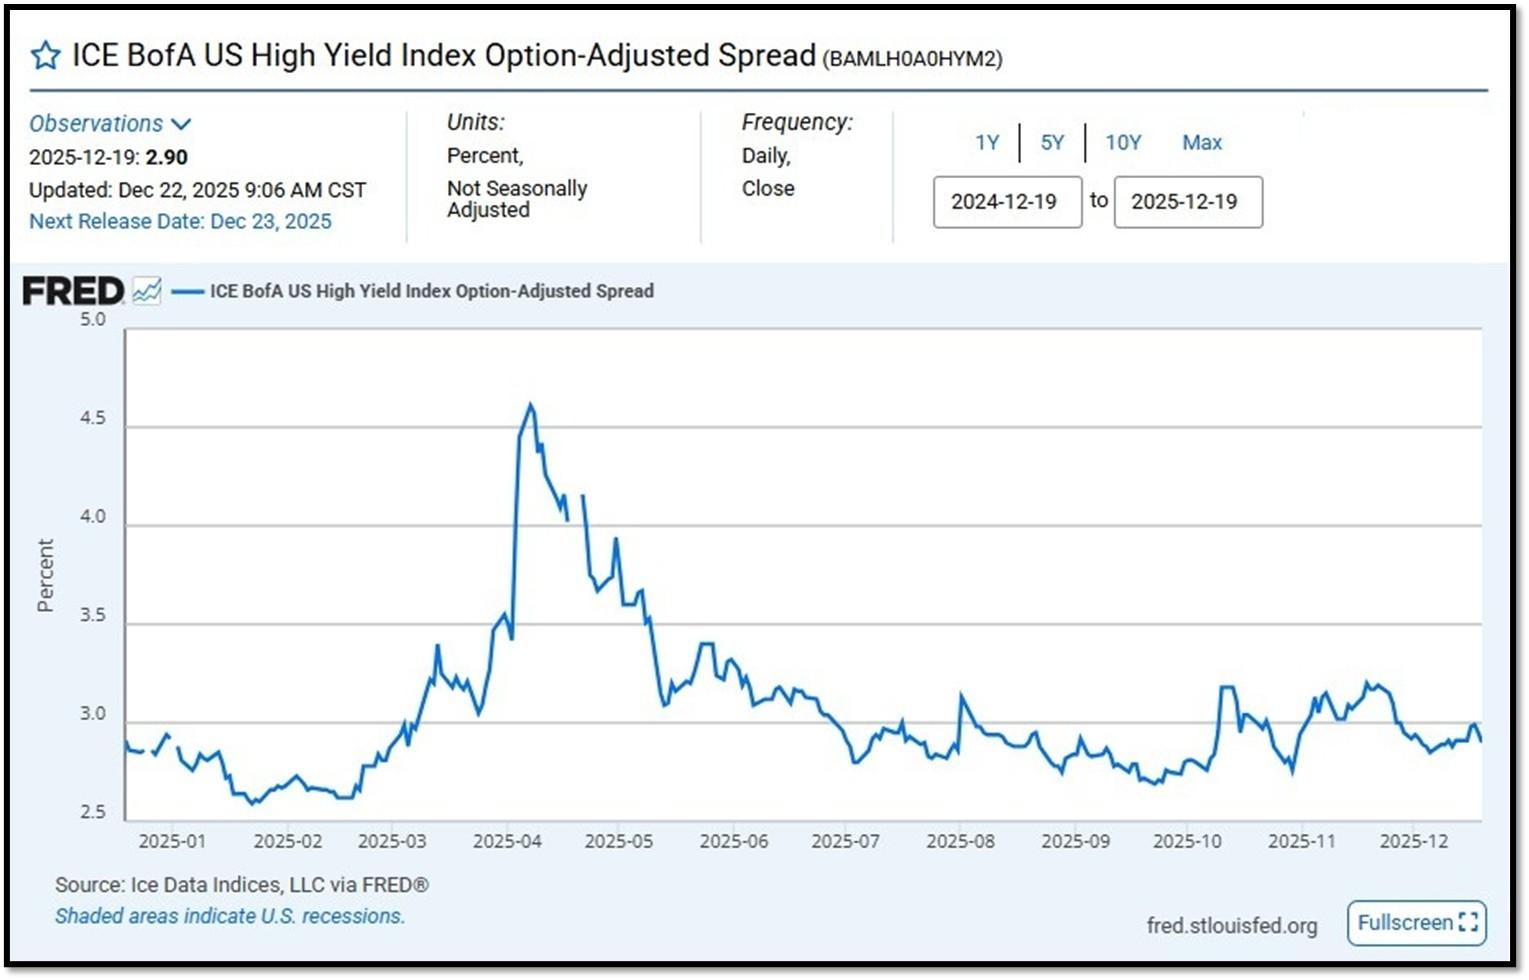
ICE BofA US High Yield Index Option-Adjusted Spread (BAMLH0A0HYM2) currently at 2.90 as of December 22, 2025. This is a key indicator of market sentiment, particularly regarding risk and economic health. At its core, the spread reflects the extra return investors demand to hold riskier corporate debt over safer government securities. High-yield bonds are issued by companies with lower credit ratings (below investment grade, like BB or lower), meaning they carry a higher chance of default. The spread compensates for this risk. When the spread is narrow—say, around 2.5% to 3%, as seen recently—it suggests investors are confident, willing to accept less extra yield because they perceive lower default risk or a strong economy. Narrow spreads often align with bullish markets, where cash is flowing, growth is steady, and fear is low. REF: FRED-BAMLH0A0HYM2
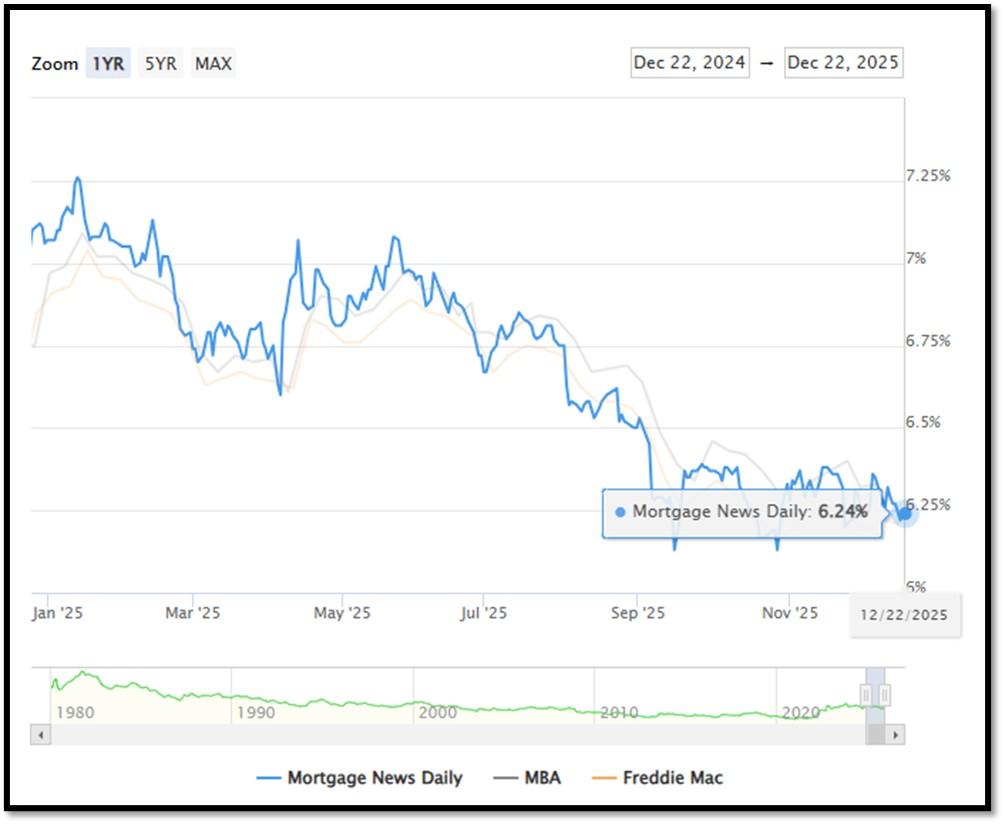
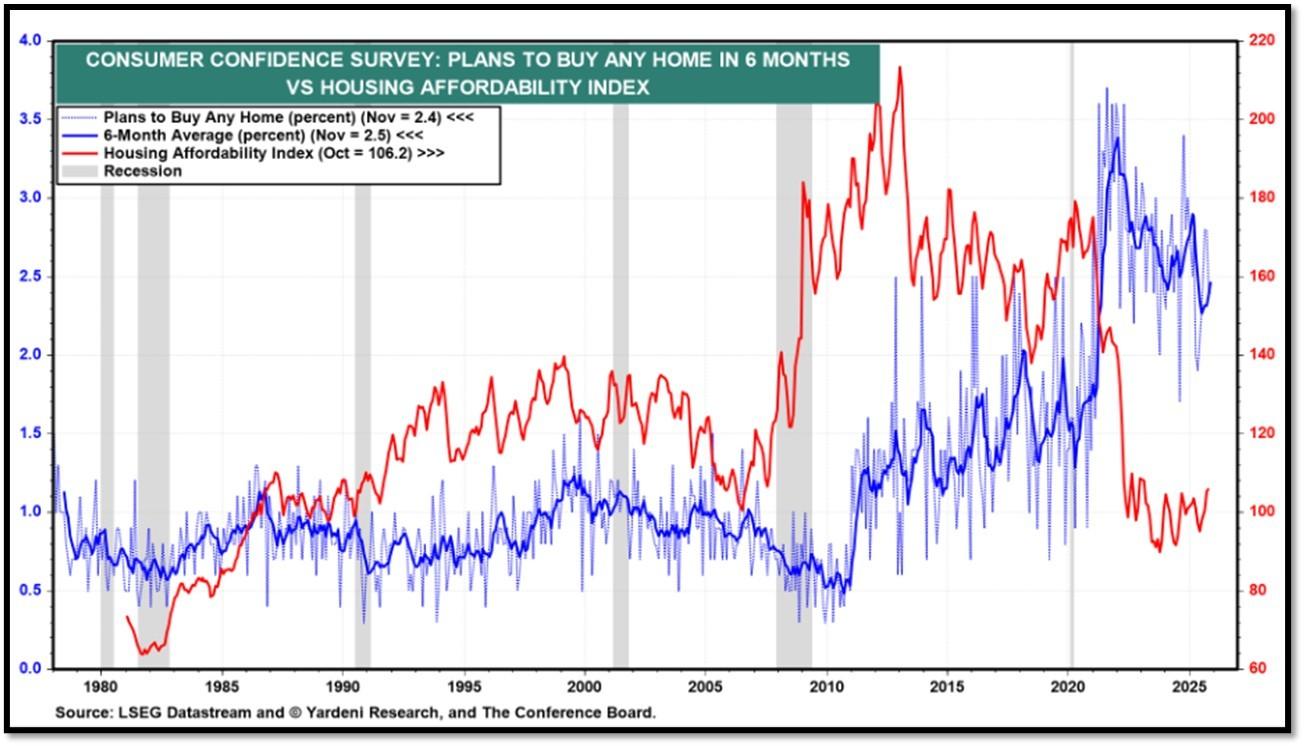
5I. (12/22/2025) Today’s National Average 30-Year Fixed Mortgage Rate is 6.24% (All Time High was 8.03% on 10/19/23). Last week’s data was 6.27%. This rate is the average 30-year fixed mortgage rates from several different surveys including Mortgage News Daily (daily index), Freddie Mac (weekly survey), Mortgage Bankers Association (weekly survey) and FHFA (monthly survey). REF: MortgageNewsDaily, Today’s Average Rate
The recent spike in the 30-year fixed-rate jumbo mortgage to 6.24%, compared to Freddie Mac’s rate at 6.21% and the Mortgage Bankers Association (MBA) rate at 6.33%, highlights key differences in the mortgage market. Jumbo mortgages, which exceed the conforming loan limits set by government agencies like Freddie Mac, typically carry higher interest rates because they are riskier for lenders. These loans are not backed by government entities, which increases the risk for lenders and, consequently, leads to higher rates. In contrast, Freddie Mac and MBA provide averages for conforming loans, which meet federal guidelines and have lower risk due to government backing, keeping their rates lower.
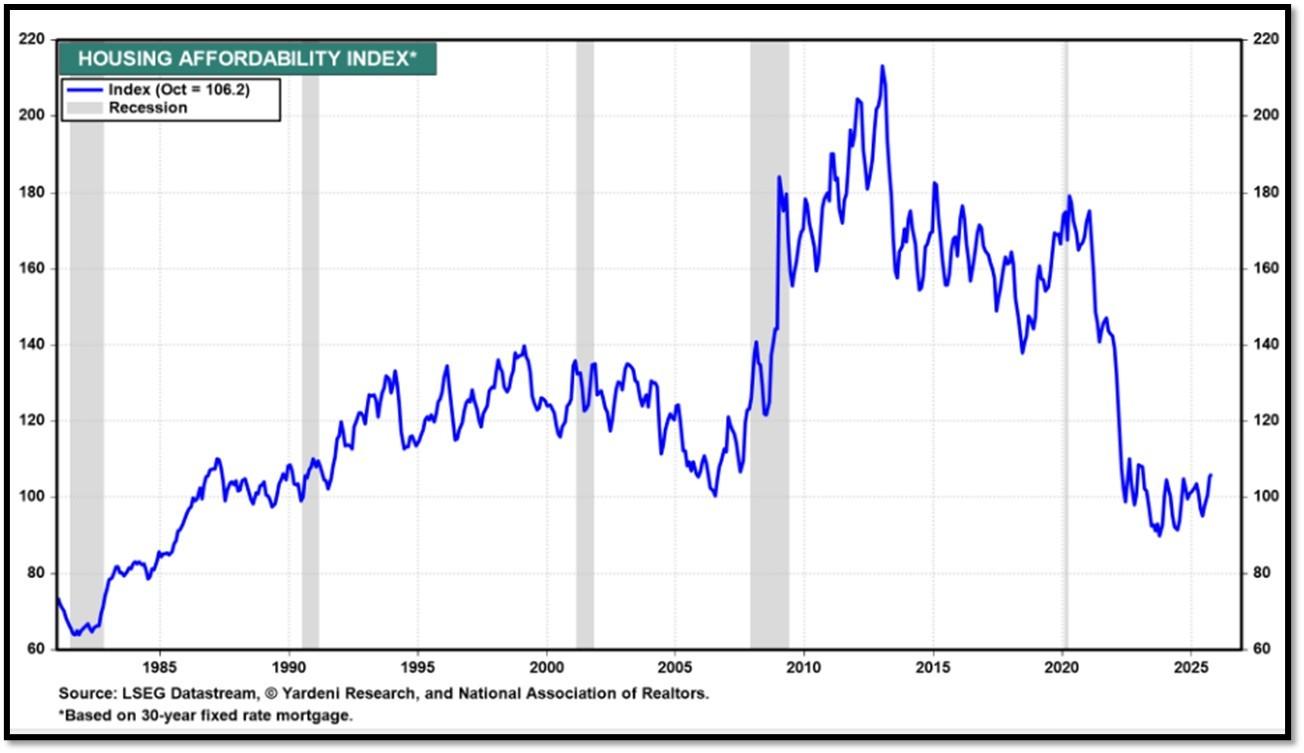
Housing Affordability Index for Oct = 106.2 // Sep = 104.5 // Aug = 100.5 // July = 98.8 // Jun = 94.4 // May = 97.2 // Apr = 101.0 // Mar = 103.2. Data provided by Yardeni Research. REF: Yardeni
5J. Velocity of M2 Money Stock (M2V) with current read at 1.392 as of (Q2-2025 updated September 25, 2025). Previous quarter’s data was 1.386. The velocity of money is the frequency at which one unit of currency is used to purchase domestically- produced goods and services within a given time period. In other words, it is the number of times one dollar is spent to buy goods and services per unit of time. If the velocity of money is increasing, then more transactions are occurring between individuals in an economy. Current Money Stock (M2) report can be viewed in the reference link. REF: St.LouisFed-M2V
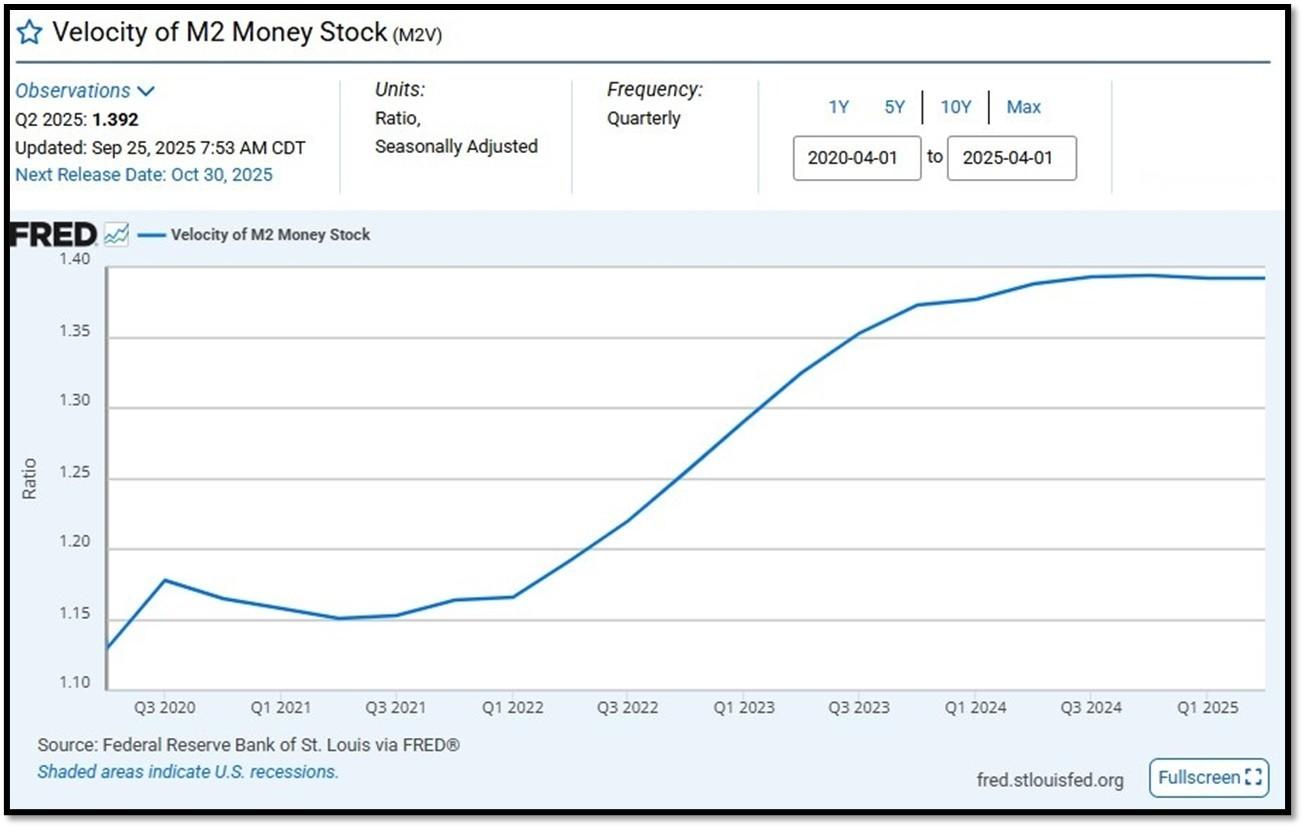
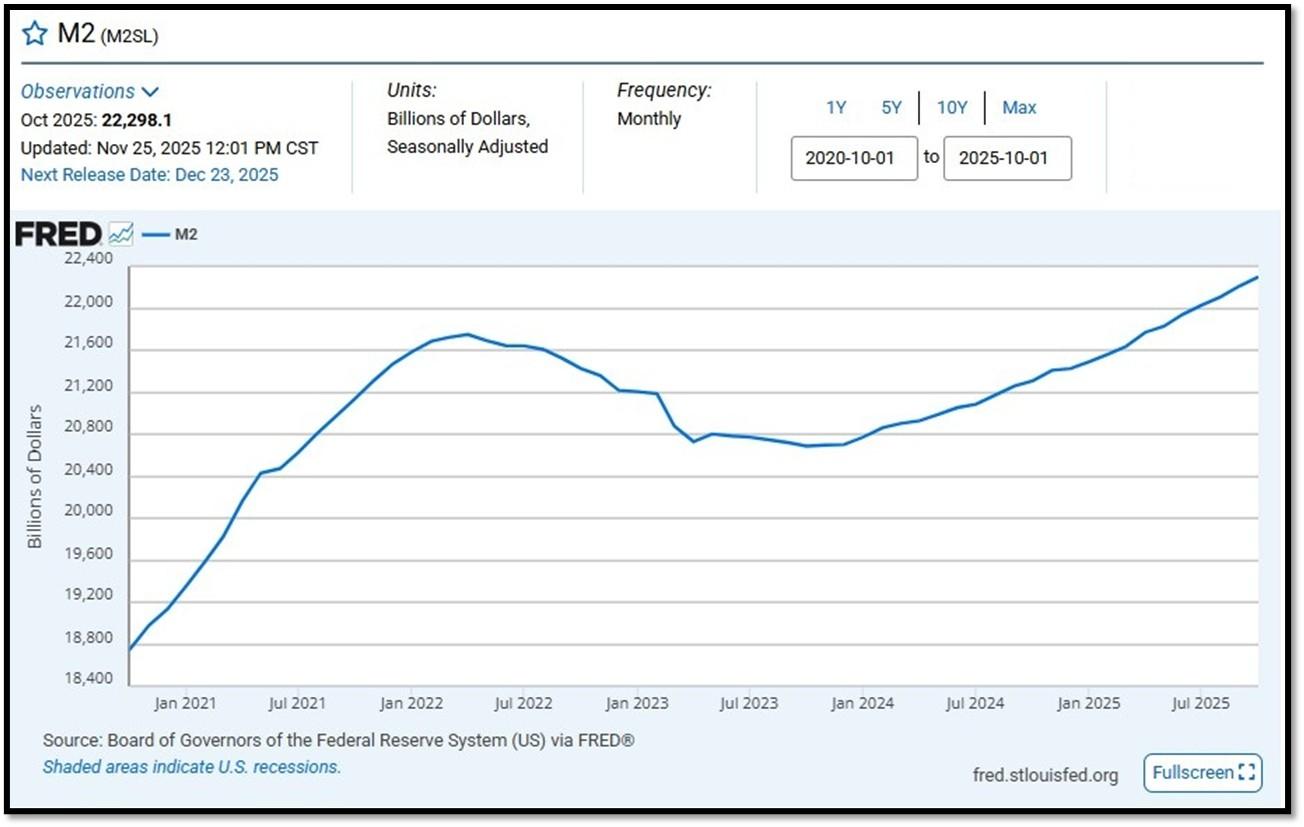
M2 consists of M1 plus (1) small-denomination time deposits (time deposits in amounts of less than $100,000) less IRA and Keogh balances at depository institutions; and (2) balances in retail MMFs less IRA and Keogh balances at MMFs. Seasonally adjusted M2 is constructed by summing savings deposits (before May 2020), small-denomination time deposits, and retail MMFs, each seasonally adjusted separately, and adding this result to seasonally adjusted M1. Board of Governors of the Federal Reserve System (US), M2 [M2SL], retrieved from FRED, Federal Reserve Bank of St. Louis; Updated on November 25, 2025. REF: St.LouisFed-M2
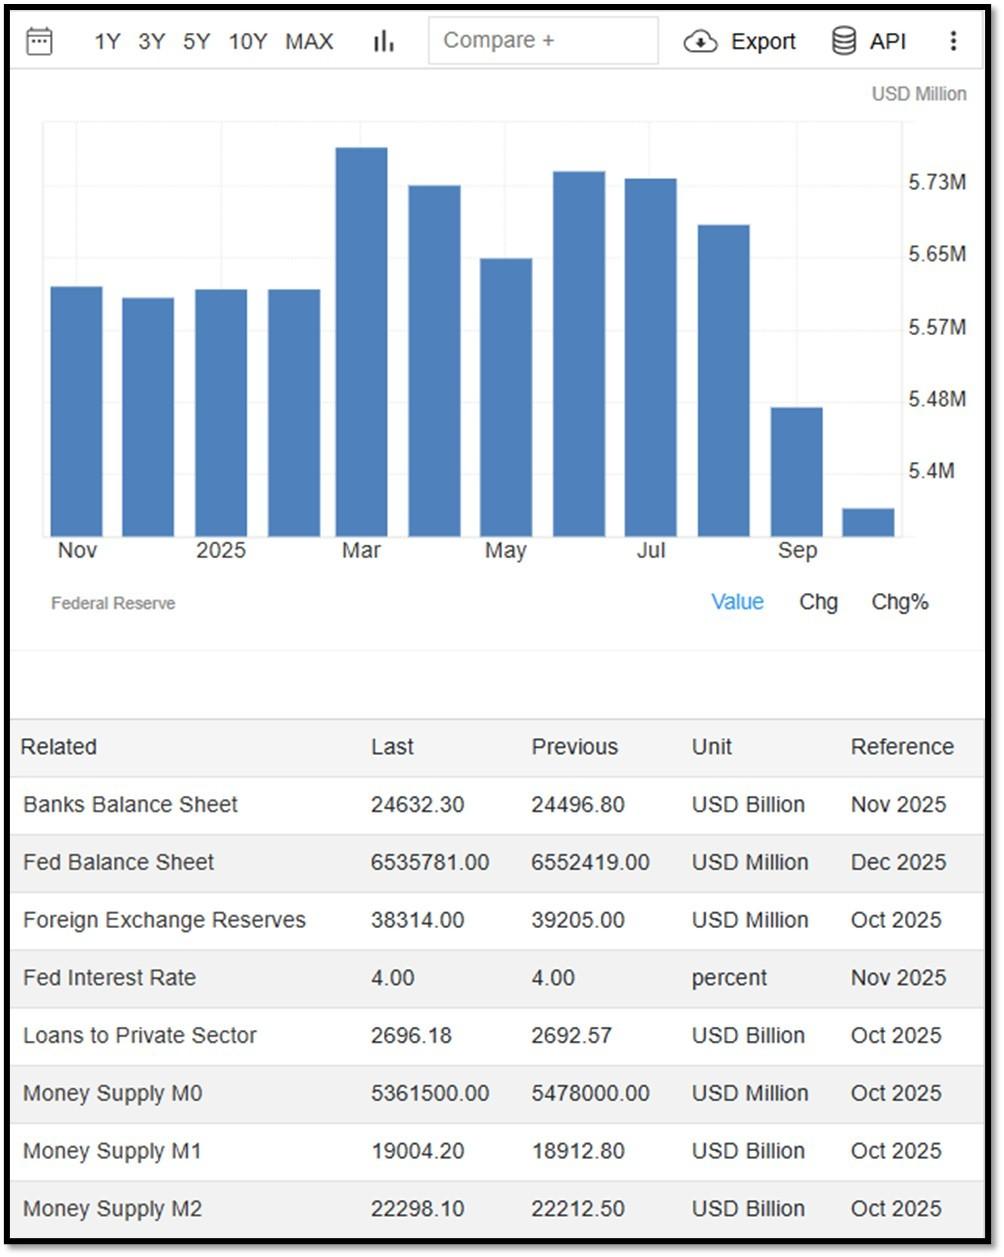
Money Supply M0 in the United States increased to 53,615,000 USD Million in October from 5,478,000 USD Million in September of 2025. Money Supply M0 in the United States averaged 1,222,051.25 USD Million from 1959 until 2025, reaching an all time high of 6,413,100.00 USD Million in December of 2021 and a record low of 48,400.00 USD Million in February of 1961. REF: TradingEconomics, M0
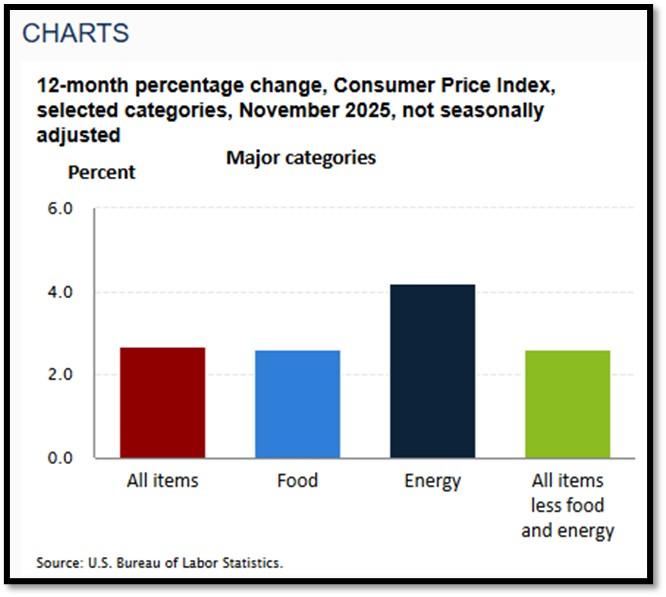
5K. In November, the Consumer Price Index for All Urban Consumers rose 2.7 percent over the last 12 months, not seasonally adjusted. The index for all items less food and energy increased 2.6 percent over the year (NSA). December 2025 CPI data are scheduled to be released on January 13, 2026, at 8:30 A.M. Eastern Time. REF: BLS, BLS.GOV
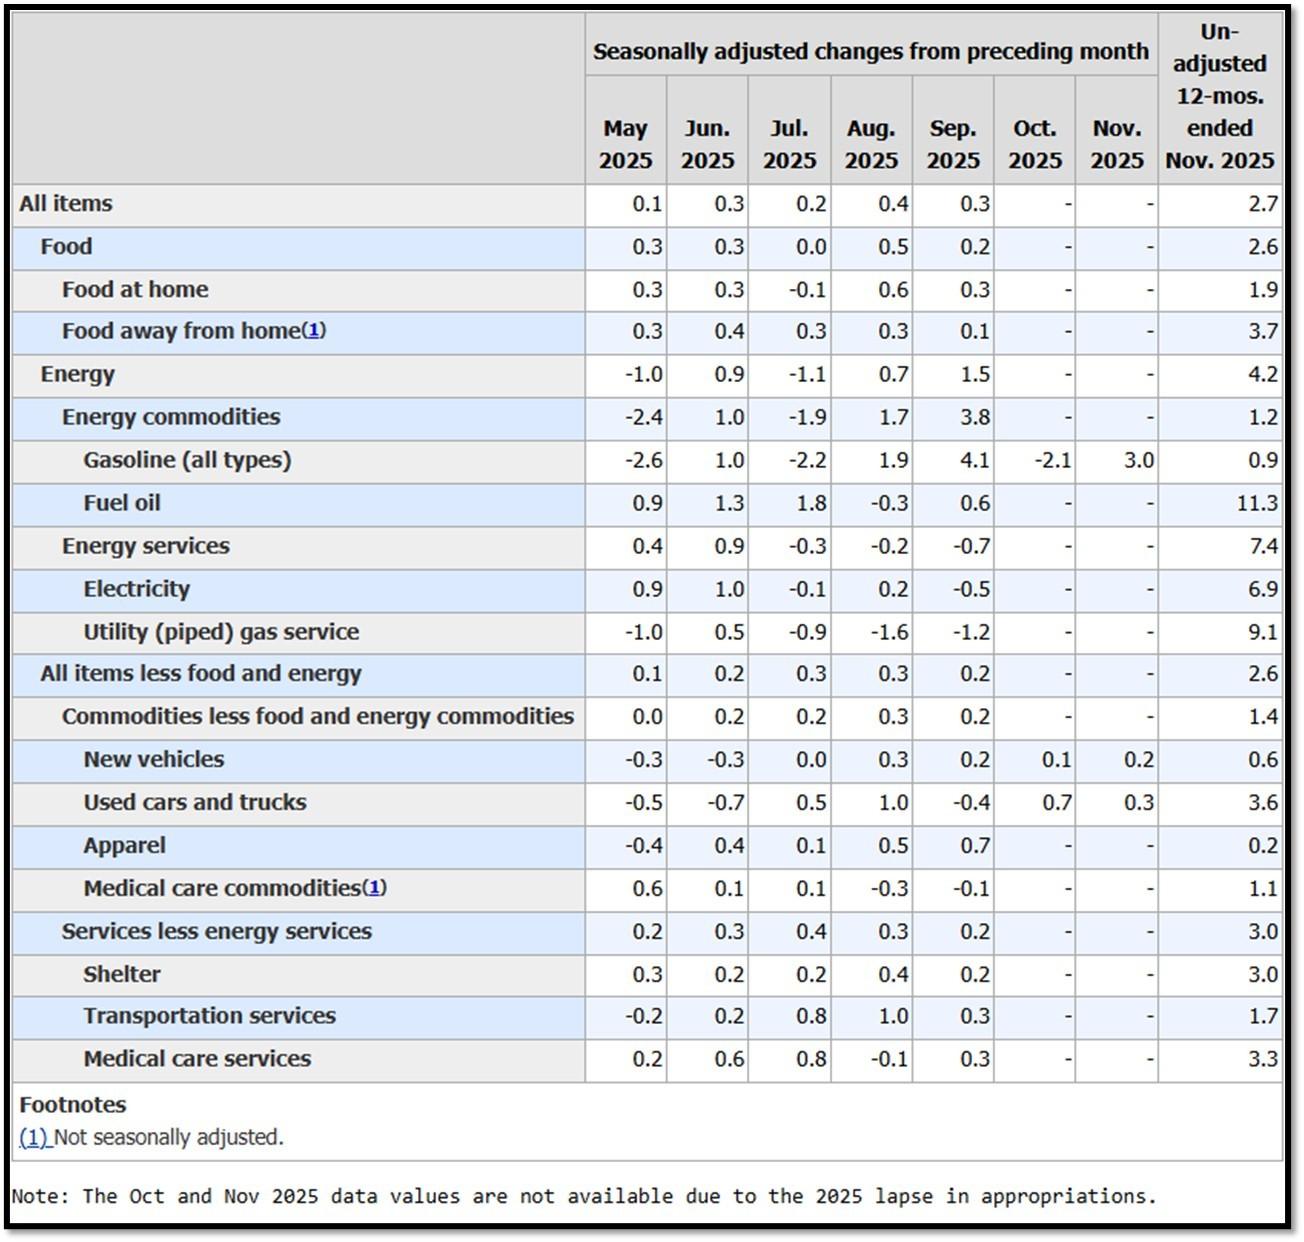
Federal Government Shutdown
BLS did not collect survey data for October 2025 due to a lapse in appropriations. BLS was unable to
retroactively collect these data. For a few indexes, BLS uses non-survey data sources instead of survey data
to make the index calculations. BLS was able to retroactively acquire most of the non-survey data for October.
CPI data collection resumed on November 14, 2025.
Additional information about the impact of the shutdown on CPI data is available online at
URL: https://www.bls.gov/cpi/additional-resources/2025-federal-government-shutdown-impact-cpi.htm
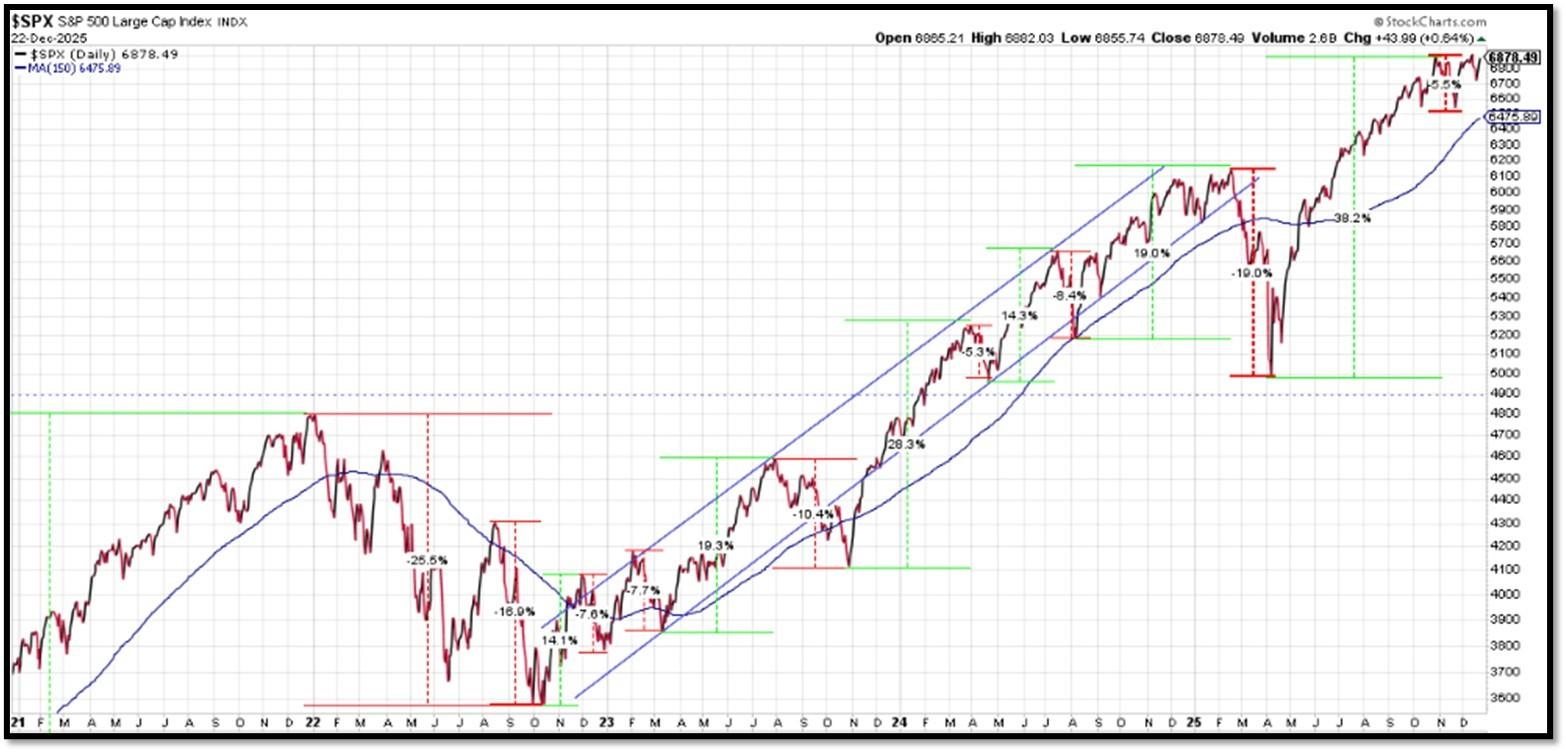
5L. Technical Analysis of the S&P500 Index. Click onto reference links below for images.
- Short-term Chart: Trend Bullish on 12/22/2025 – REF: Short-term S&P500 Chart by Marc Slavin (Click Here to Access Chart)
- Medium-term Chart: Trend Bullish on 12/22/2025 – REF: Medium-term S&P500 Chart by Marc Slavin (Click Here to Access Chart)
- Market Timing Indicators – S&P500 Index as of 12/22/2025 – REF: S&P500 Charts (7 of them) by Joanne Klein’s Top 7 (Click Here to Access Updated Charts)
- The S&P500 is sitting near all-time-high levels, rebounding from two V-shaped recoveries. REF: Stockcharts
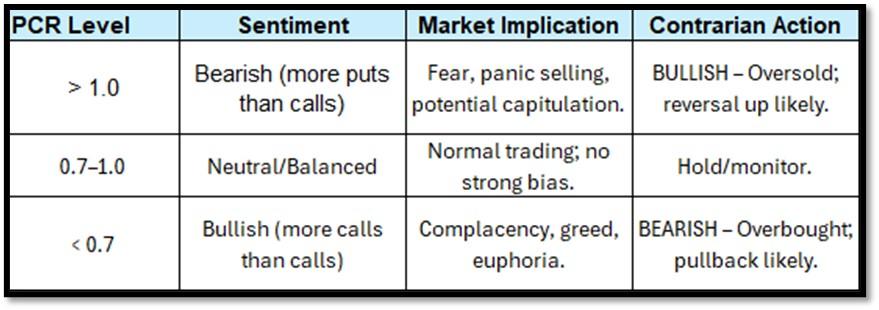
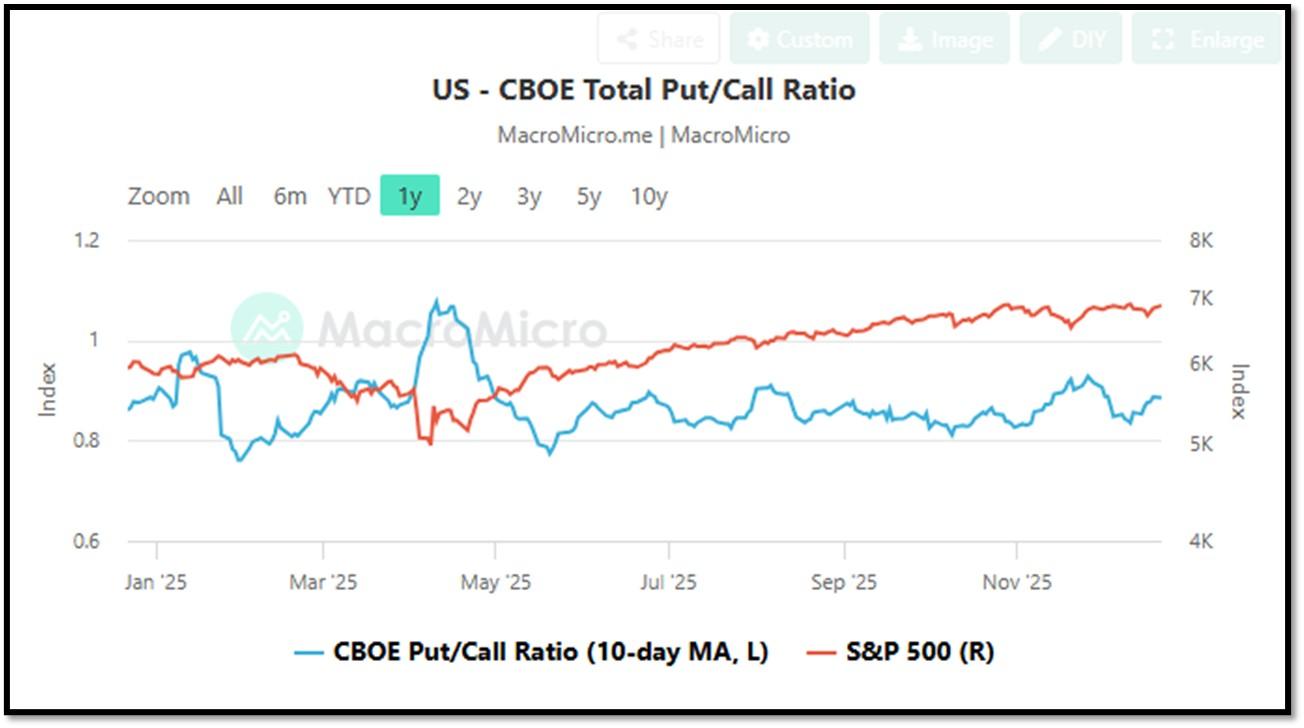
- CBOE Total Put/Call Ratio as of 12/22/2025. REF: MacroMicro
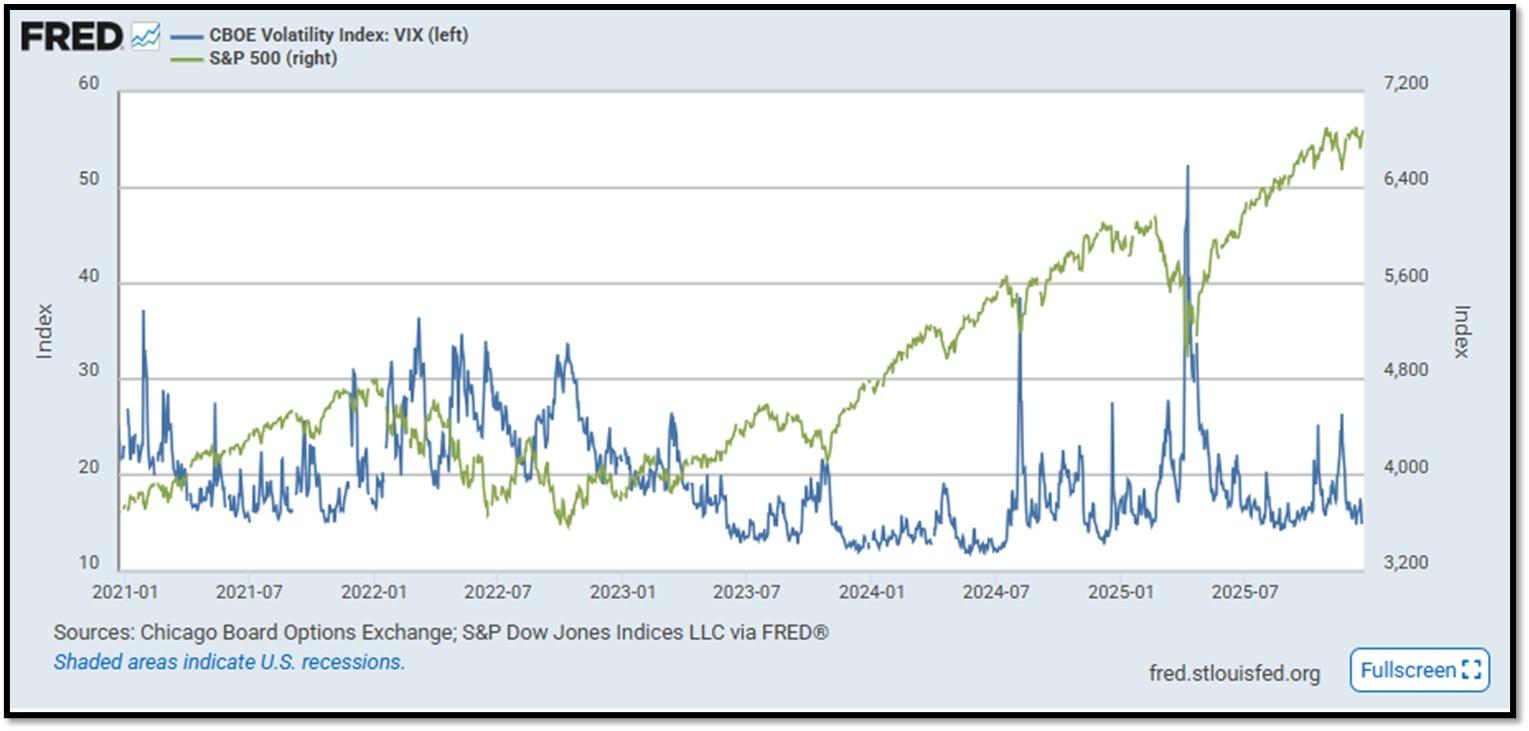
- S&P500 and CBOE Volatility Index (VIX) as of 12/22/2025. REF: FRED, Today’s Print
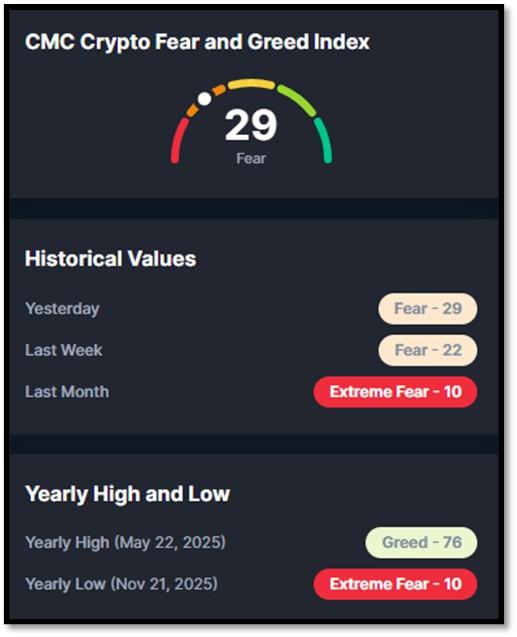
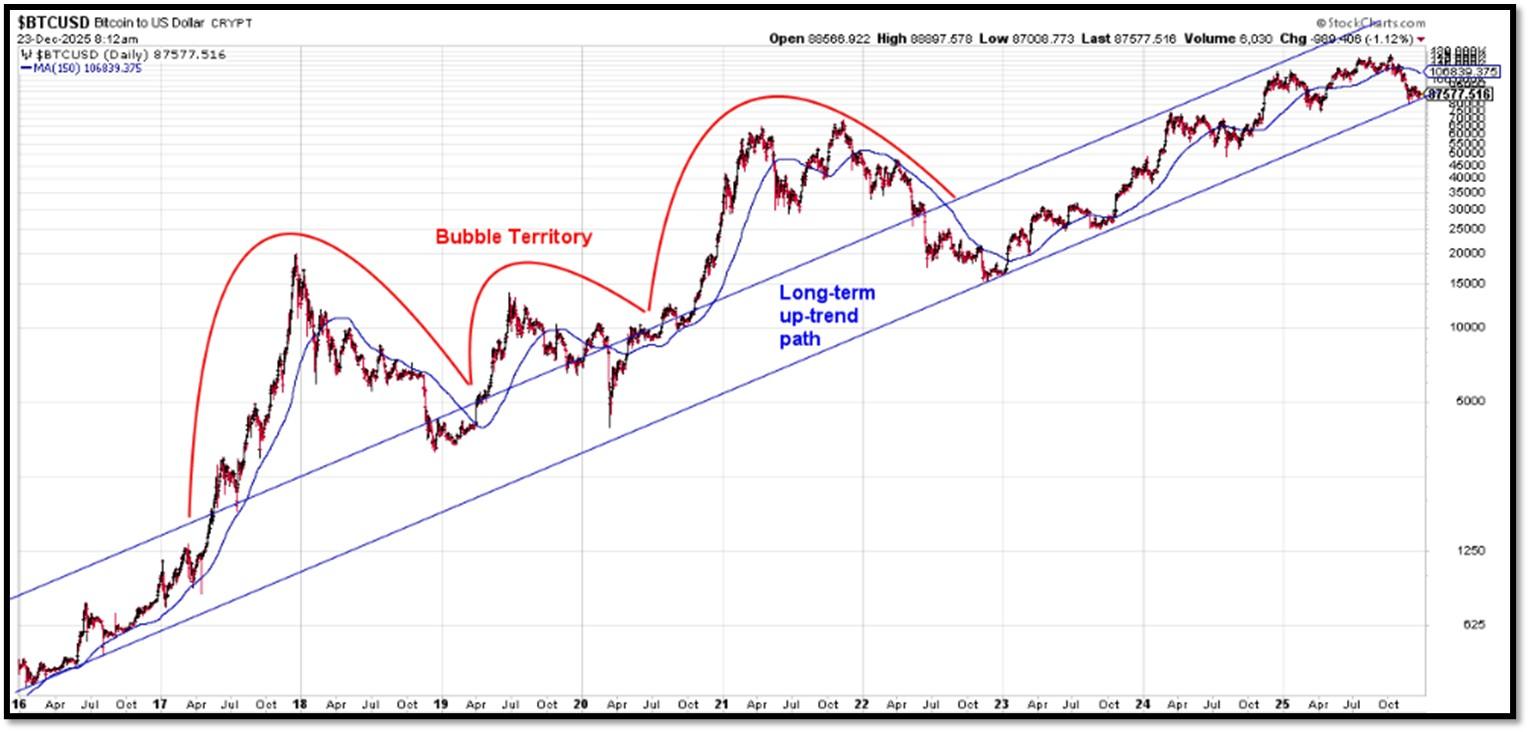
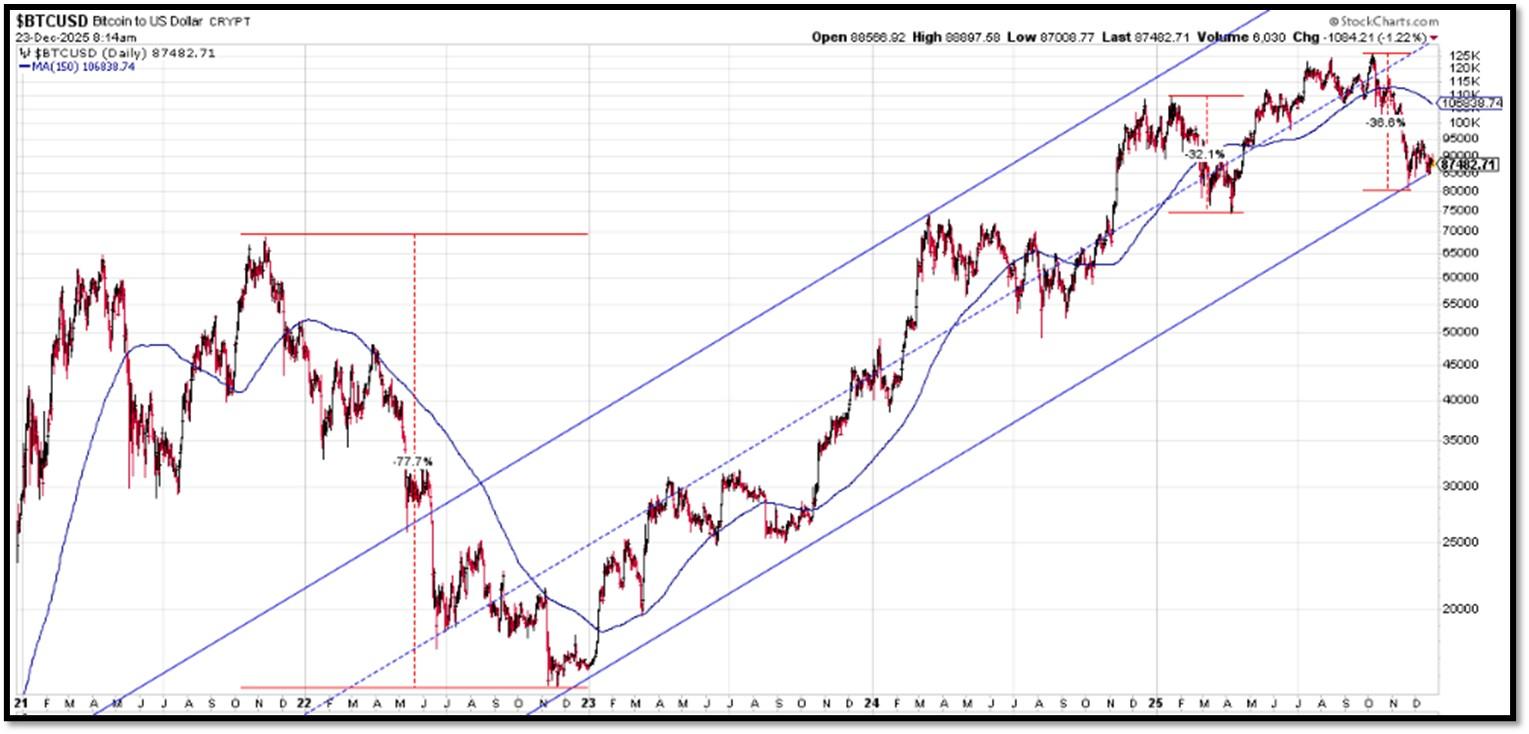
5M. Most recent read on the Crypto Fear & Greed Index with data as of 12/17/2025 is 25 (Fear). Last week’s data was 30 (Fear) (1-100). Fear & Greed Index – A Contrarian Data. The crypto market behavior is very emotional. People tend to get greedy when the market is rising which results in FOMO (Fear of missing out). Also, people often sell their coins in irrational reaction of seeing red numbers. With the Crypto Fear and Greed Index, the data try to help save investors from their own emotional overreactions. There are two simple assumptions:
- Extreme fear can be a sign that investors are too worried. That could be a buying opportunity.
- When Investors are getting too greedy, that means the market is due for a correction.
Therefore, the program for this index analyzes the current sentiment of the Bitcoin market and crunch the numbers into a simple meter from 0 to 100. Zero means “Extreme Fear”, while 100 means “Extreme Greed”. REF: Coinmarketcap.com, Today’sReading
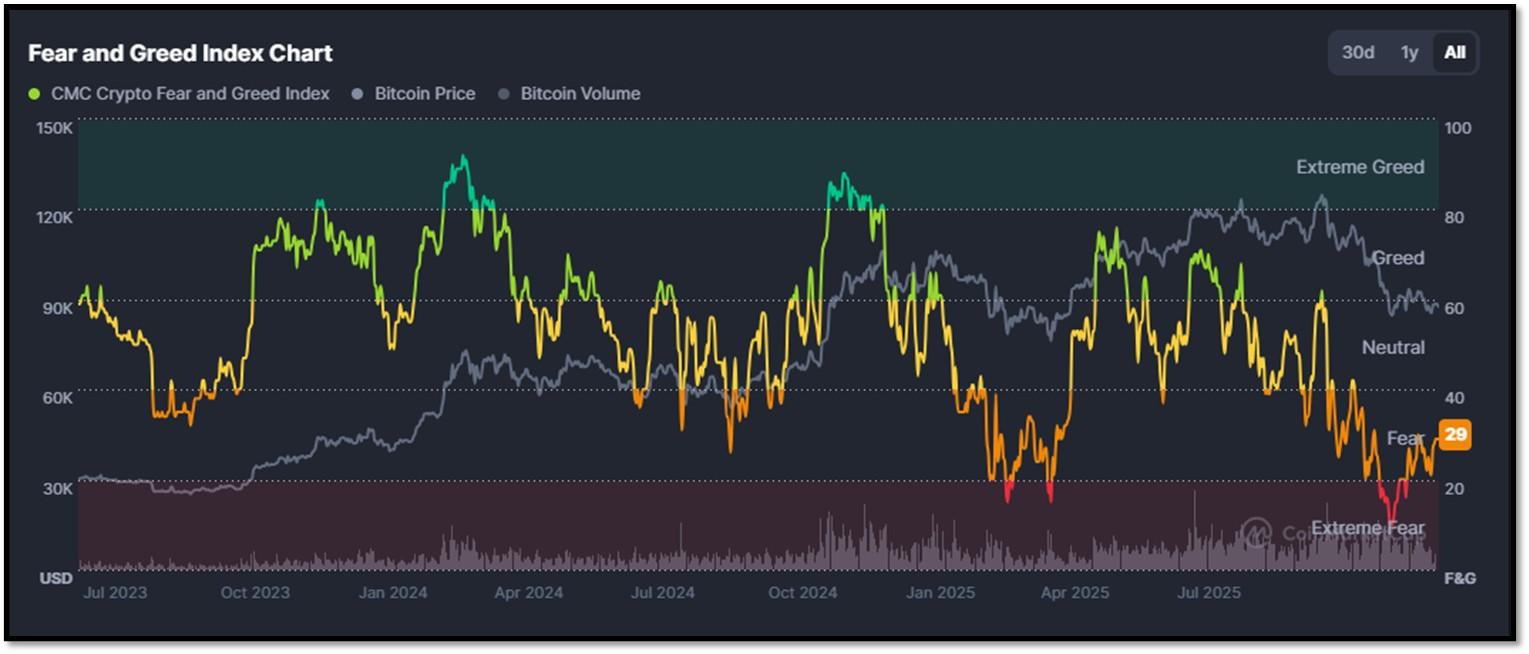
Bitcoin – 10-Year & 2-Year Charts. REF: Stockcharts10Y, Stockcharts2Y
From the desk of our Chief Investment Officer
As an investment professional with over twenty-six years of experience in the financial services industry, Andrew helps clients to protect, grow and transfer wealth during their lifetime with objective, unbiased, customized and efficient strategies.
Education, Professional Licenses Acquired & Affiliations
- Passed the Series 7, 63, 65 and 24 license examinations
- Currently holding Series 65 License
- BA in Economics – Boston University (Boston, MA) 1993
- Certificate in Commodities Trading – New York University (New York, NY) 1991
- Certificate in Financial Planning – New York University (New York, NY) April 2011
With extensive experience in the Financial Services Industry, Andrew Tang and Turner Financial Group provides disciplined wealth management with an intelligent caring approach to each and every client that compliments the Dedicated Financial offering.


Len writes much of his own content, and also shares helpful content from other trusted providers like Turner Financial Group (TFG).
The material contained herein is intended as a general market commentary, solely for informational purposes and is not intended to make an offer or solicitation for the sale or purchase of any securities. Such views are subject to change at any time without notice due to changes in market or economic conditions and may not necessarily come to pass. This information is not intended as a specific offer of investment services by Dedicated Financial and Turner Financial Group, Inc.
Dedicated Financial and Turner Financial Group, Inc., do not provide tax, legal or accounting advice. You should consult your own tax, legal and accounting advisors before engaging in any transaction.
Any hyperlinks in this document that connect to Web Sites maintained by third parties are provided for convenience only. Turner Financial Group, Inc. has not verified the accuracy of any information contained within the links and the provision of such links does not constitute a recommendation or endorsement of the company or the content by Dedicated Financial or Turner Financial Group, Inc. The prices/quotes/statistics referenced herein have been obtained from sources verified to be reliable for their accuracy or completeness and may be subject to change.
Past performance is no guarantee of future returns. Investing involves risk and possible loss of principal capital. The views and strategies described herein may not be suitable for all investors. To the extent referenced herein, real estate, hedge funds, and other private investments can present significant risks, including loss of the original amount invested. All indexes are unmanaged, and an individual cannot invest directly in an index. Index returns do not include fees or expenses.
Turner Financial Group, Inc. is an Investment Adviser registered with the United States Securities and Exchange Commission however, such registration does not imply a certain level of skill or training and no inference to the contrary should be made. Additional information about Turner Financial Group, Inc. is also available at www.adviserinfo.sec.gov. Advisory services are only offered to clients or prospective clients where Turner Financial Group, Inc. and its representatives are properly licensed or exempt from licensure. No advice may be rendered by Turner Financial Group, Inc. unless a client service agreement is in place.


