

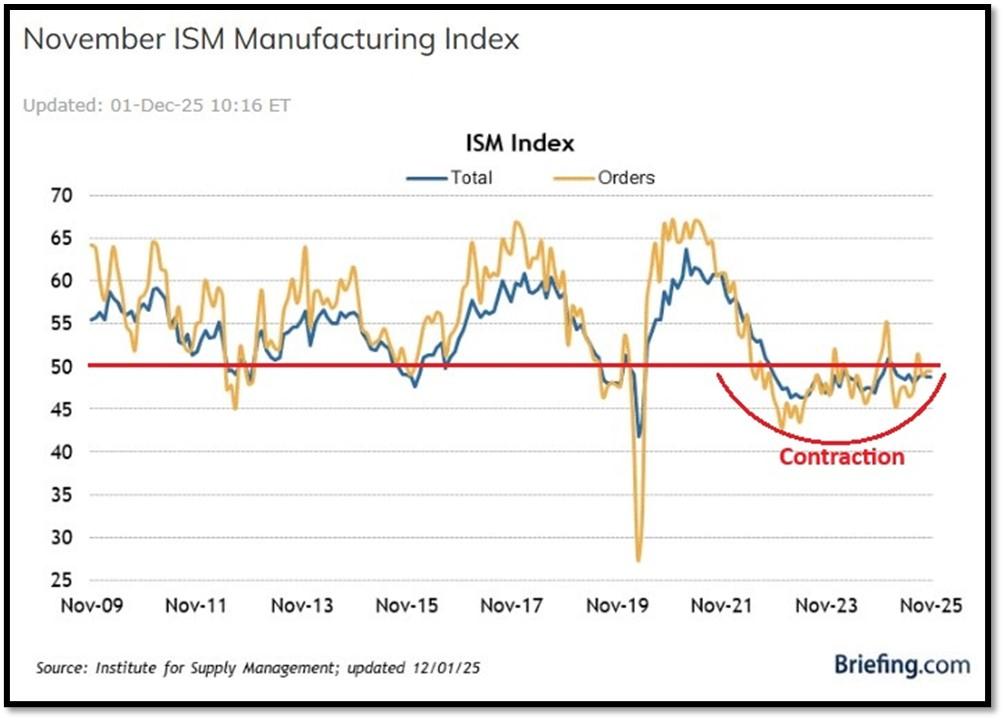
- 1. U.S. economic data continued to signal cooling activity: November ISM Manufacturing remained in contraction at 48.2 (anything below 50 indicates contraction), ADP private payrolls unexpectedly fell, and consumer confidence plunged to its lowest since April.
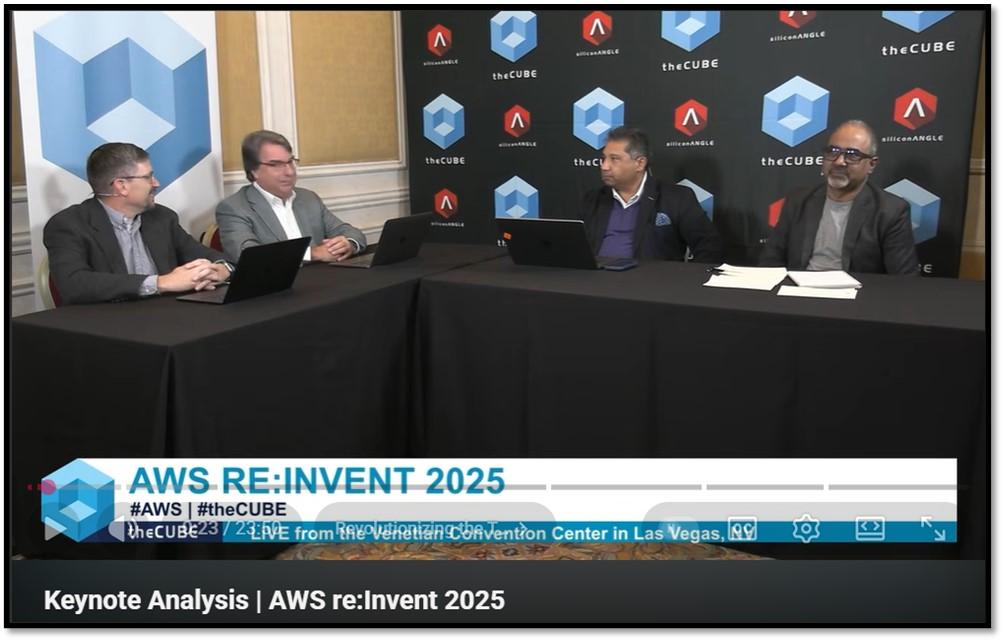
- 2. Main story this week focuses on AWS re:Invent 2025 held in Las Vegas, NV (from December 1 to December 5).
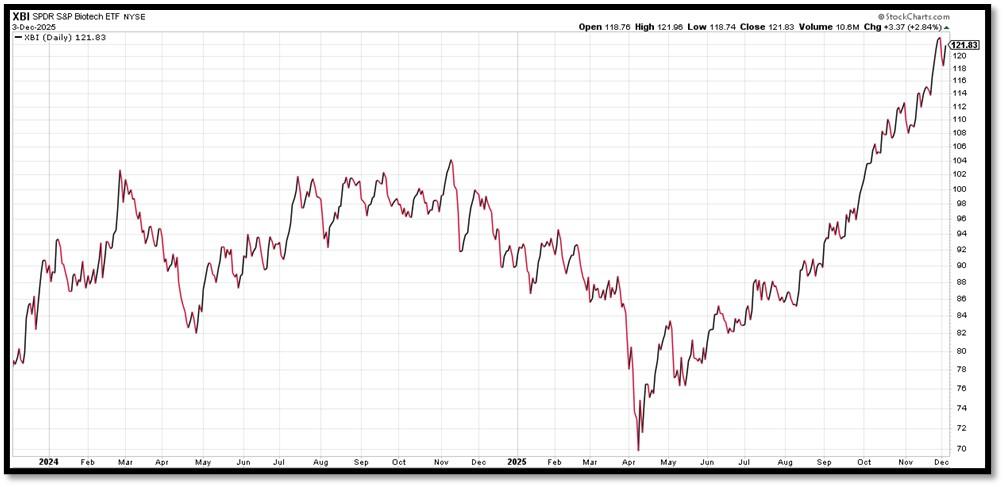
- 3. Small-cap and biotech stocks have sharply outperformed the Magnificent 7 in late 2025, with the Russell 2000 up >20% YTD (vs. S&P 500 +16%) and biotech ETFs like XBI +25-30% in the past quarter.
- 4. World Watch
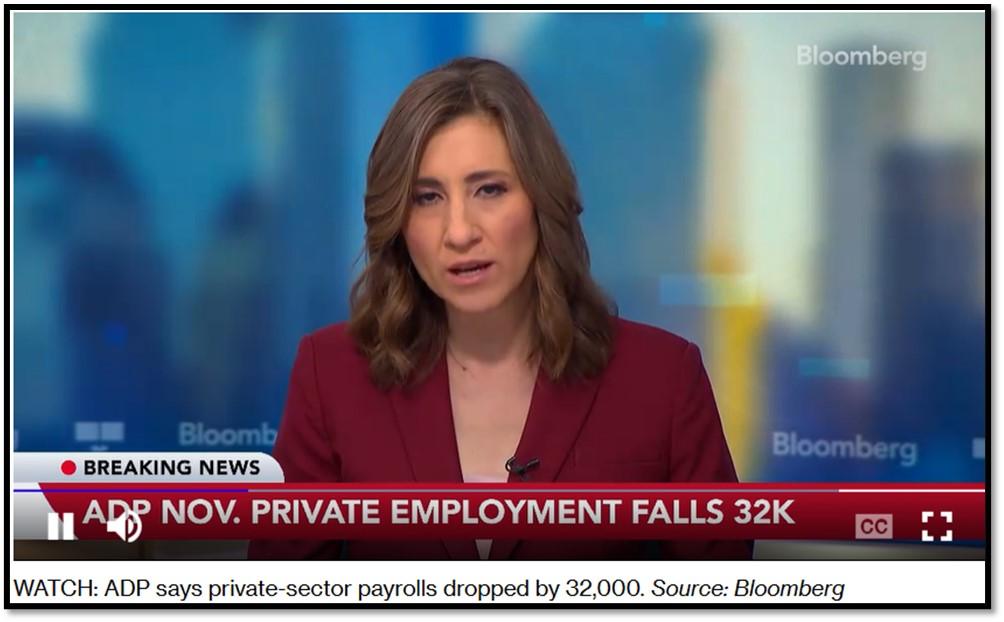
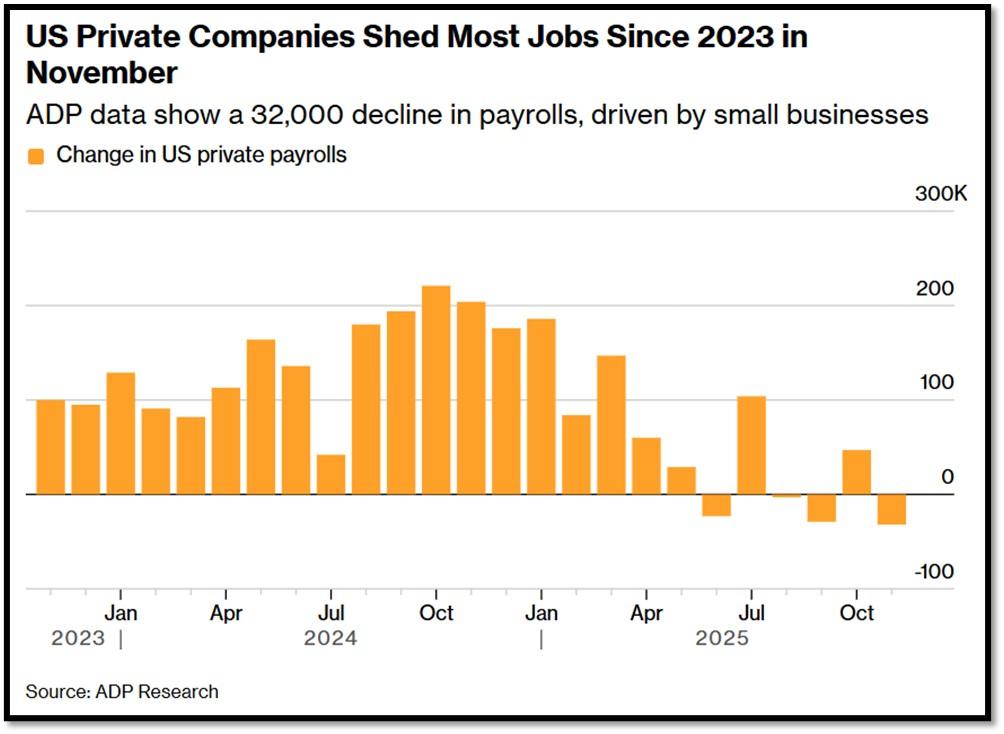
- 4A. According to Bloomberg, US private payrolls unexpectedly fell by 32,000 in November, the largest drop since March 2023 and only the fourth decline in six months, missing forecasts for a 10,000 gain.
- 4B. In Venezuela, even as President Trump deploys military assets in the Caribbean, tightens oil sanctions, and threatens intervention against Maduro, most citizens remain far more worried about hyperinflation than any foreign conflict.
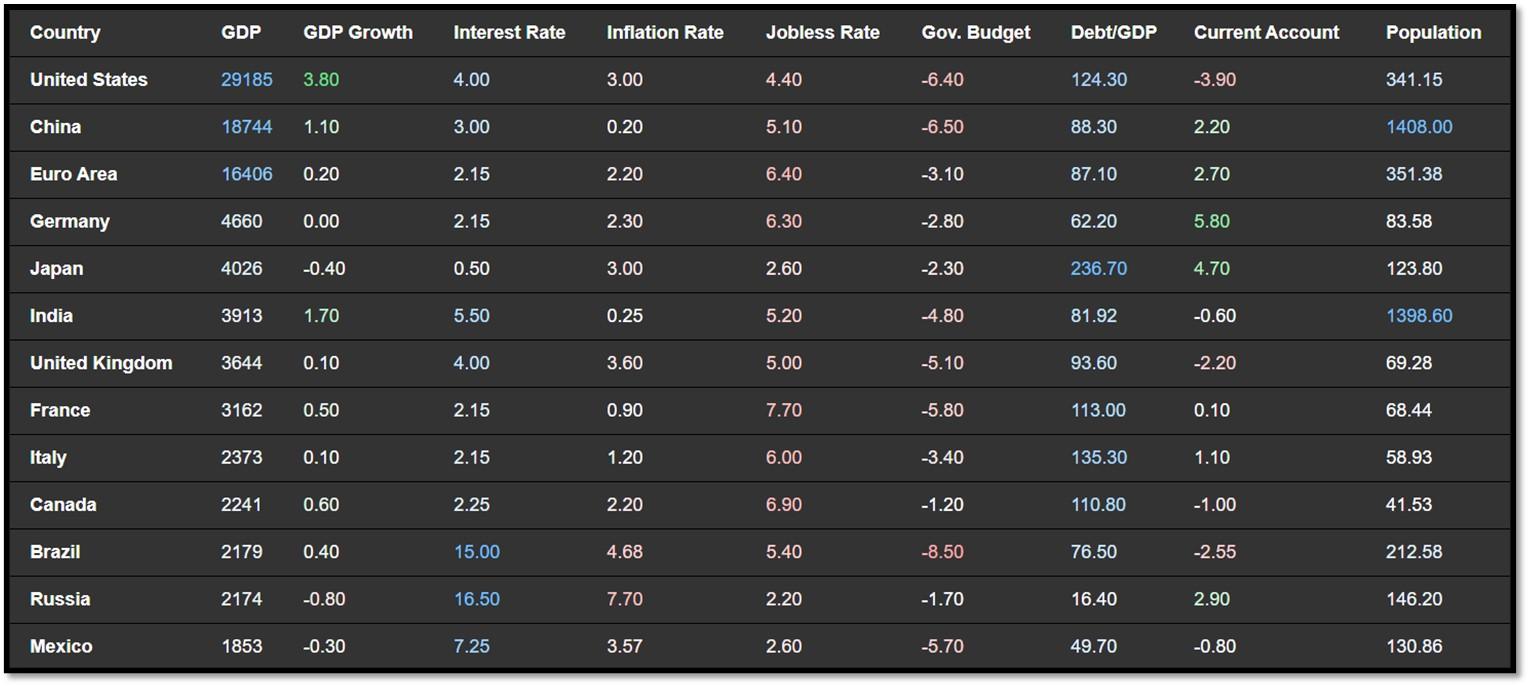
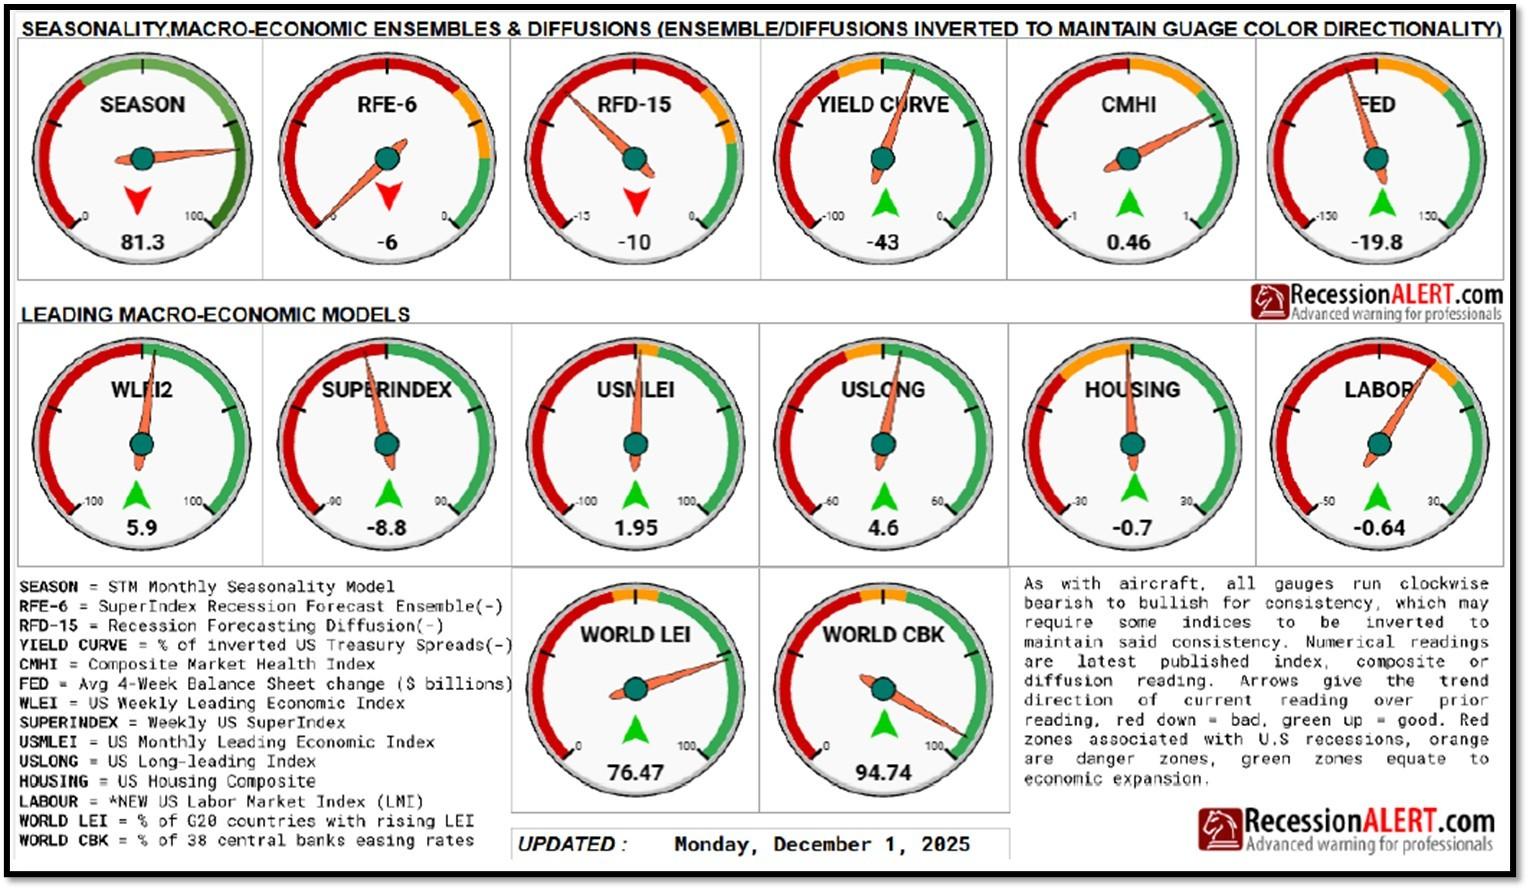
- 4C. An updated snapshot of the current global state of economy.
- 5. Quant & Technical Corner – A selection of quantitative & technical data we monitor on a regular basis to help gauge the overall financial market conditions and the investment environment.
1. U.S. economic data continued to signal cooling activity: November ISM Manufacturing remained in contraction at 48.2 (anything below 50 indicates contraction), ADP private payrolls unexpectedly fell, and consumer confidence plunged to its lowest since April.
These releases, alongside tame core inflation, pushed the odds of a 25 bps Fed rate cut in December to ~89%. Globally, Chinese factory activity contracted for an eighth straight month, German GDP stagnated, and the UK’s tax-heavy budget trimmed growth forecasts. Stocks rallied strongly in the holiday-shortened week, with the S&P 500 +3.7%, Dow +3.2%, Nasdaq +4.9%, and small-caps +5.5%. Treasury yields eased, taking the 10-year note to 4.06% amid dovish Fed pricing; Treasuries, investment-grade and high-yield corporates advanced, while municipal issuance hit record levels. Markets opened December slightly softer but retain support from seasonal strength and expectations for additional rate cuts.
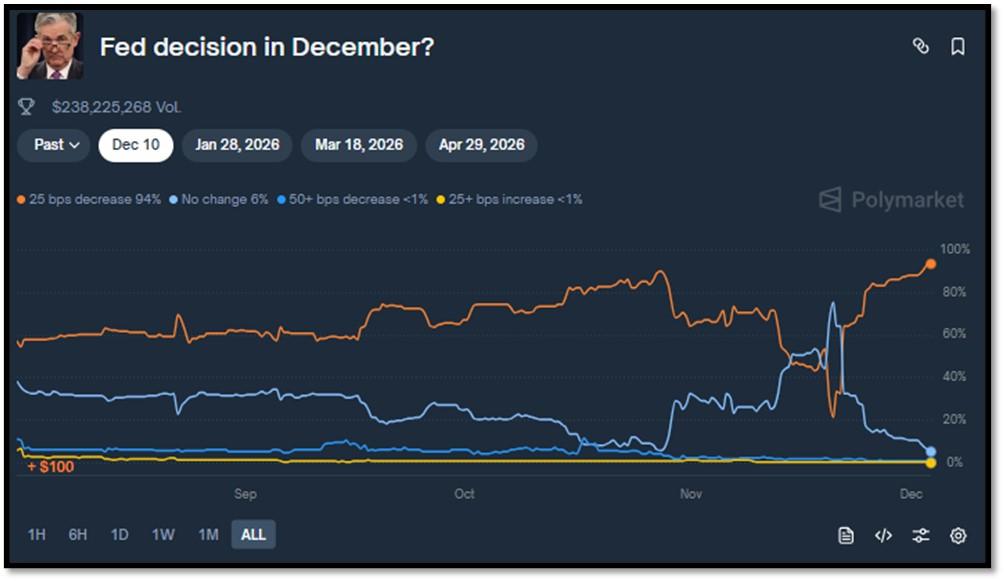
As of December 3, 2025, markets are pricing an 89% chance of a 25 bps Fed rate cut at the December 10-11 FOMC meeting (CME FedWatch), up sharply from 63% a month ago, driven by cooling labor data and dovish Fed signals. Polymarket traders are even more confident at 94% odds for the cut (vs. 6% for no change), with over $219M wagered on the outcome. REF: Briefing, Polymarket
2. Main story this week focuses on AWS re:Invent 2025 held in Las Vegas, NV (from December 1 to December 5).
AWS re:Invent is Amazon Web Services’ flagship annual cloud computing and AI conference that brings together developers, engineers, and business leaders for keynotes, technical training, product announcements, and industry networking. The event so far delivered the week’s clearest leap in AI: the launch of “frontier agents” (Kiro for coding, AWS Security Agent, DevOps Agent) powered by the expanded Amazon Nova models, plus the Trainium3 chip (up to 4.4× faster/cheaper training) and a forthcoming Trainium4 that natively runs Nvidia code.
Business & work implications – These autonomous agents can run complex, multi-day workflows (software development, security incident response, infrastructure management) with minimal human input, effectively replacing or shrinking entire teams of engineers, analysts, and ops staff. Companies can now shift from supervising AI tools to reviewing outcomes produced by fully independent systems, accelerating development cycles from weeks to hours and slashing operational costs by 50–90 % in affected roles. For many enterprises, this marks the first practical path to “lights-out” IT and security operations and could trigger the fastest workforce transformation since the arrival of the cloud itself. Click onto pictures below to access videos. Click onto reference links for additional information. REF: AWS_re:Invent, TechCrunch

3. Small-cap and biotech stocks have sharply outperformed the Magnificent 7 in late 2025, with the Russell 2000 up >20% YTD (vs. S&P 500 +16%) and biotech ETFs like XBI +25-30% in the past quarter.
Primary drivers: near-certain Fed rate cuts (89% odds for December) that slash borrowing costs for debt-heavy small firms, strong earnings from clinical wins and SMID-biopharma growth, a wave of M&A amid big pharma’s $176B patent cliff, and valuations still 40% below historical averages—triggering a classic rotation out of expensive mega-caps.
The rally can extend into 2026 if cuts proceed, FDA momentum holds, and deal activity accelerates with record cash on sidelines. Maturing pipelines in high-value areas and $148B projected net cash by 2030 reduce dilution risk and support self-funded growth. Risks remain (policy shocks or hotter inflation could pause momentum) but improving fundamentals and capital rotation suggest this shift is more structural than transient, favoring continued small-cap/biotech leadership if macro conditions cooperate. REF: Russell_Indices, MorningStar, Pitchbook
NOTE: Not investment advice or recommendations. Investors should carefully consider the investment objectives, risks, charges, and expenses before investing. For additional information about the securities mentioned above, please visit the respective fund’s documents pages for the fund’s prospectus. Please read all materials carefully before investing.
https://www.ssga.com/us/en/intermediary/etfs/state-street-spdr-sp-biotech-etf-xbi
With the current macro-economic backdrop, below are areas we currently favor:
- Fixed Income – (Corporates & Muni) High Yield as Opportunistic Allocation (Low-Beta)
- Fixed Income – Short-term Corporates & Muni (Low-Beta)
- Businesses that contribute to and benefit from AI & Automation (Market-Risk)
- Small-Cap & Bio-Technology (Market-Risk)
- Neo-Cloud Computing (Market-Risk)
- Fintech & Financials (Market-Risk)
- Digital Asset – Bitcoin (Market-Risk/Hedge)
- Cyber-Security & Software (Market-Risk)
- Quantum Computing (Market-Risk)
4. World Watch
4A. According to Bloomberg, US private payrolls unexpectedly fell by 32,000 in November, the largest drop since March 2023 and only the fourth decline in six months, missing forecasts for a 10,000 gain.
Small firms under 50 employees cut 120,000 jobs, the worst since May 2020, while larger companies added modestly. Hardest-hit sectors included professional services, information, and manufacturing, reflecting cautious hiring amid softening demand. Wage growth also cooled sharply: job-changers saw just 6.3% pay increases (lowest since February 2021), and job-stayers averaged 4.4%. This ADP report signals rising labor-market weakness just ahead of the Fed’s December 10-11 meeting, boosting odds of a 25 bps rate cut to over 89%. With Friday’s official BLS payrolls release (covering both October and November) looming, confirmation of this slowdown could push policymakers toward faster easing to counter recession risks, even as services remain relatively resilient. Click onto picture below to access video. REF: Bloomberg
4B. In Venezuela, even as President Trump deploys military assets in the Caribbean, tightens oil sanctions, and threatens intervention against Maduro, most citizens remain far more worried about hyperinflation than any foreign conflict.
A Wall Street Journal poll shows that collapsing wages, monthly inflation of 20 to 30 percent, and an insane annual rate of 172% per Trading Economics dominate daily life. The IMF forecasts inflation at 548% in 2025 and 629% in 2026, forcing families to ration holiday food and hoard staples before prices double again, making survival economics eclipse geopolitical drama.
This focus on immediate hardship reflects a decade long crisis deepened by sanctions that slashed oil output to 870,000 barrels per day and triggered widespread shortages. With half the population in poverty and remittances from eight million emigrants (including 770,000 in the United States) as a key lifeline, many see Trump’s rhetoric as distant compared to the relentless struggle for basics. As one Caracas resident put it, a war eventually ends, but inflation never stops eating us alive. Click onto picture below to access video. REF: TradingEconomics, WSJ, IMF


4C. An updated snapshot of the current global state of economy.
According to TradingEconomics as of 12/2/2025 (REF: TradingEconomics):
- The Italian gross domestic product expanded by 0.1% from the previous quarter on the three months to September of 2025, erasing the 0.1% contraction from the earlier period and revised higher from the preliminary estimate of a stall to meet the initial expectations by markets.
- The unemployment rate in Italy fell to 6% in October 2025, below expectations of 6.1% and down from 6.2% in September.
- The Canadian GDP rose by 0.6% on quarter in the third quarter of 2025, following a revised 0.5% contraction in the previous period.
- The Bank of Canada lowered its benchmark overnight rate by 25bps to 2.25% in its October 2025 meeting, as expected by markets, and signaled that it likely done with its cutting cycle if its base economic projection holds under the current uncertain backdrop.
5. Quant & Technical Corner – A selection of quantitative & technical data we monitor on a regular basis to help gauge the overall financial market conditions and the investment environment.
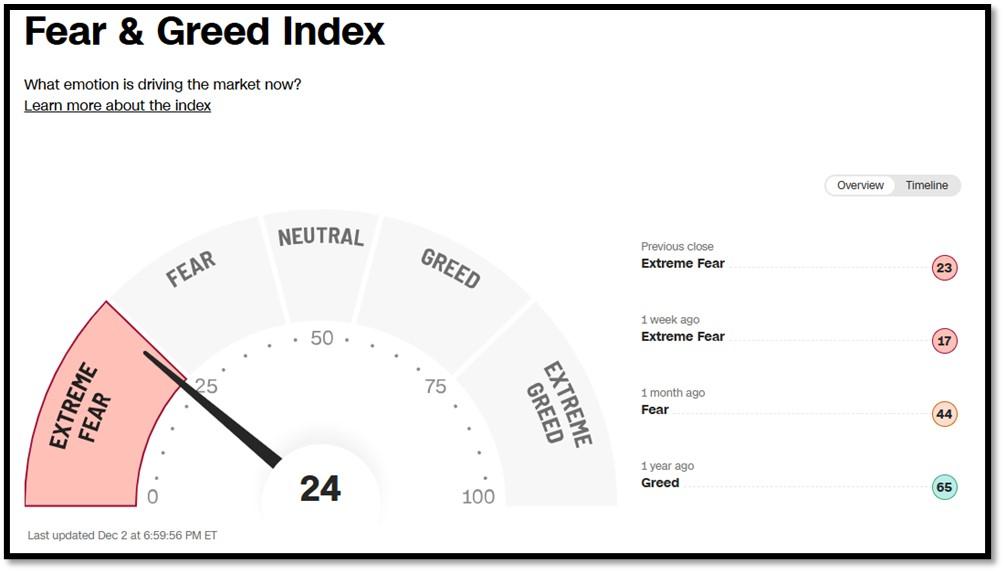
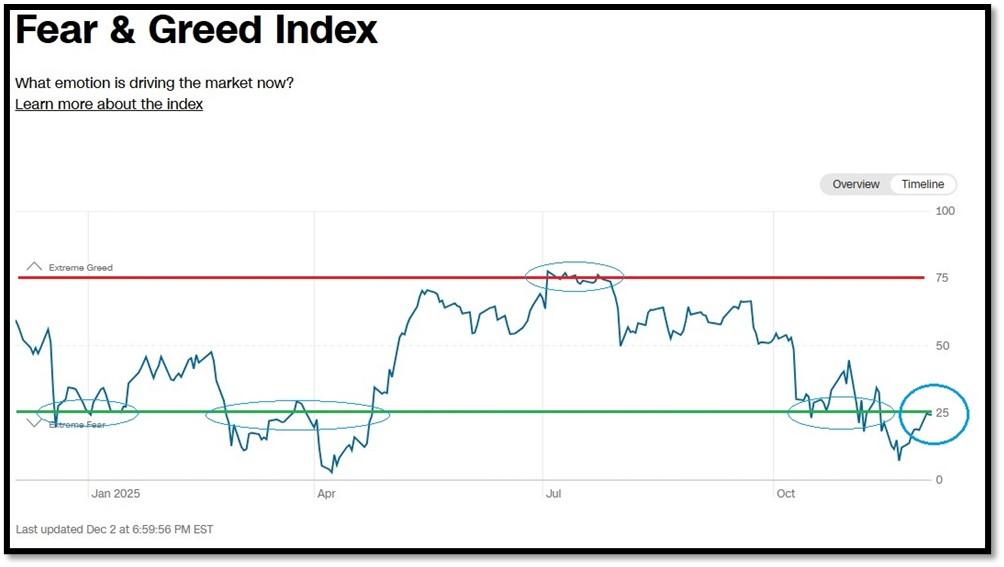
5A. Most recent read on the Fear & Greed Index with data as of 12/2/2025 – 6:59 PM-ET is 24 (Extreme Fear). Last week’s data was 17 (Extreme Fear) (1-100). CNNMoney’s Fear & Greed index looks at 7 indicators (Stock Price Momentum, Stock Price Strength, Stock Price Breadth, Put and Call Options, Junk Bond Demand, Market Volatility, and Safe Haven Demand). Keep in mind this is a contrarian indicator! REF: Fear&Greed via CNNMoney
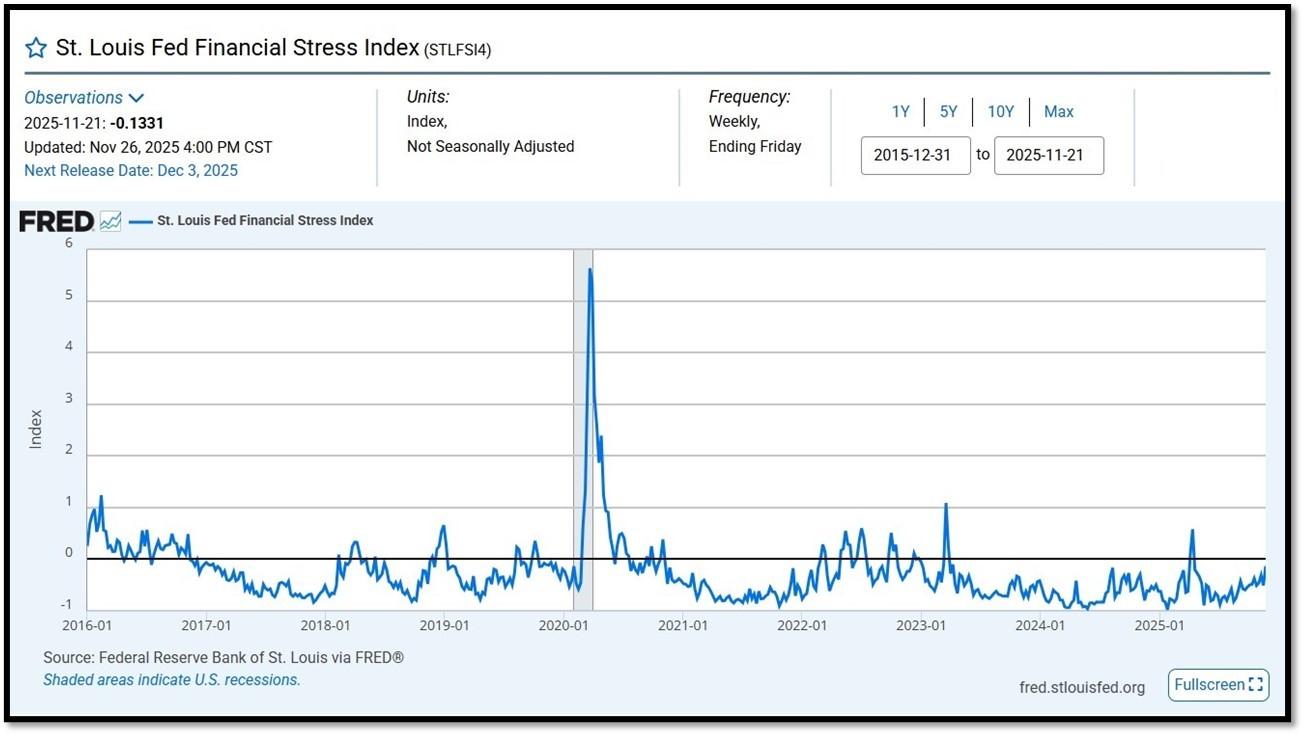
5B. St. Louis Fed Financial Stress Index’s (STLFSI4) most recent read is at –0.1331 as of November 26, 2025. Previous week’s data was -0.5064. A big spike up from previous readings reflecting the turmoil in the banking sector back in 2023. This weekly index is not seasonally adjusted. The STLFSI4 measures the degree of financial stress in the markets and is constructed from 18 weekly data series: seven interest rate series, six yield spreads and five other indicators. Each of these variables captures some aspect of financial stress. Accordingly, as the level of financial stress in the economy changes, the data series are likely to move together. REF: St. Louis Fed
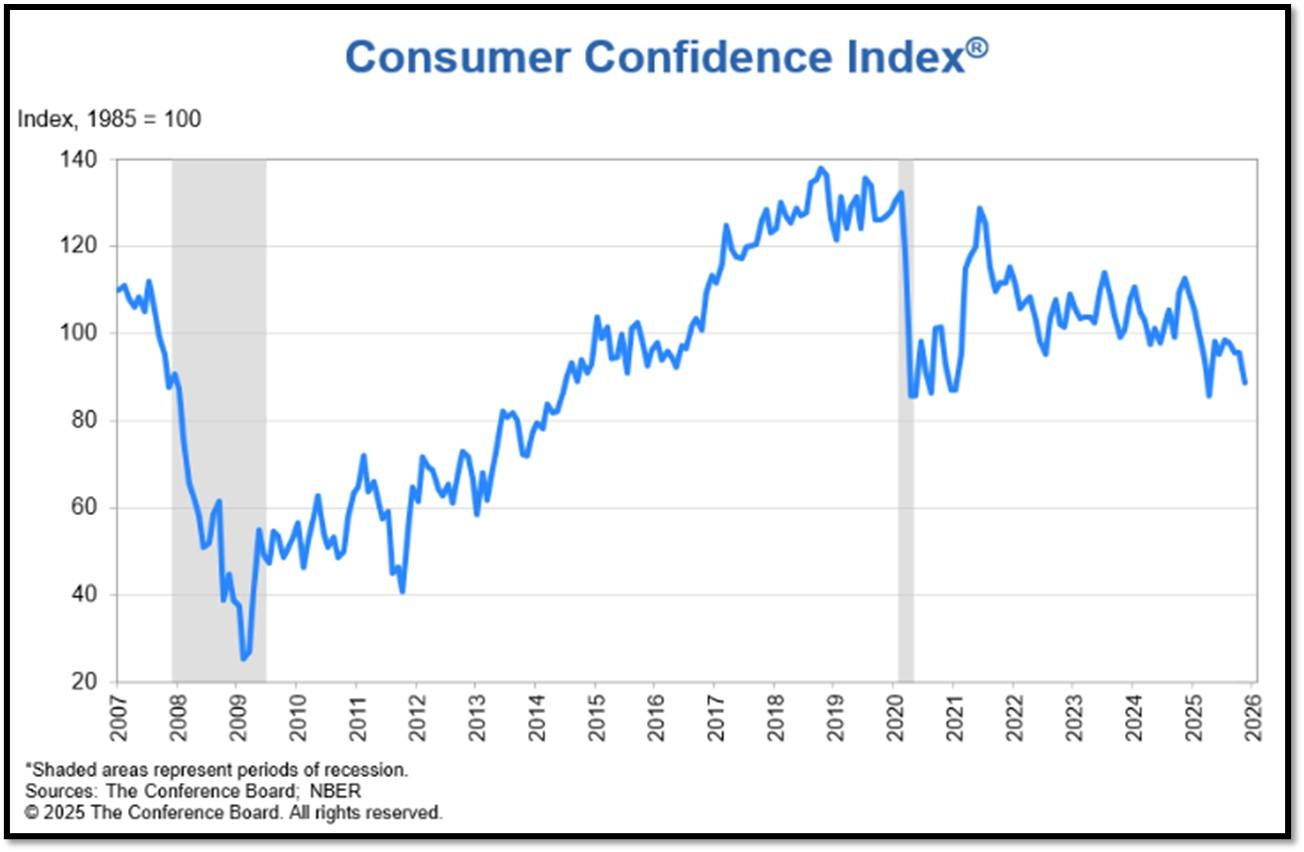
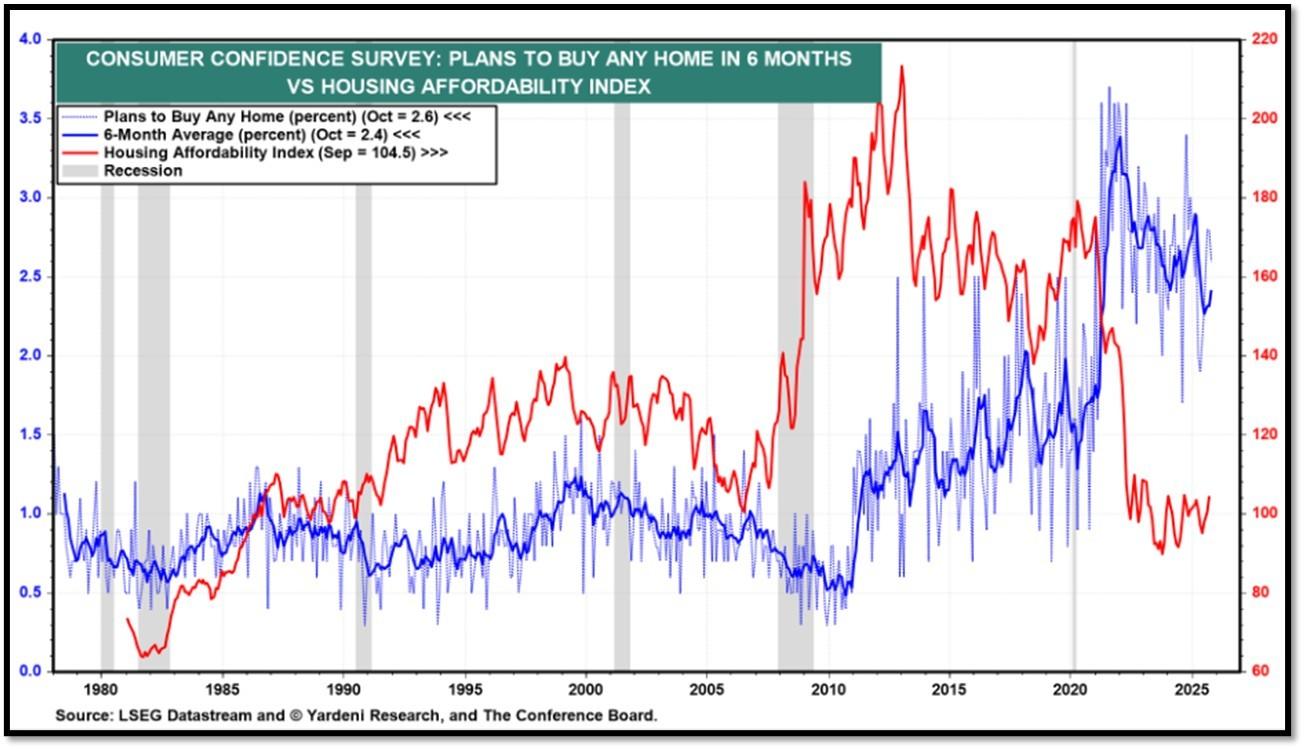
5C. Consumers revealed reduced confidence across jobs, incomes, and financial situations, both now and in the future, potentially due to the government shutdown. The Conference Board Consumer Confidence Index® declined by 6.8 points in November to 88.7 (1985=100) from 95.5 in October. “Consumer confidence tumbled in November to its lowest level since April after moving sideways for several months,” said Dana M Peterson, Chief Economist, The Conference Board. “All five components of the overall index flagged or remained weak. REF: ConsumerConfidence
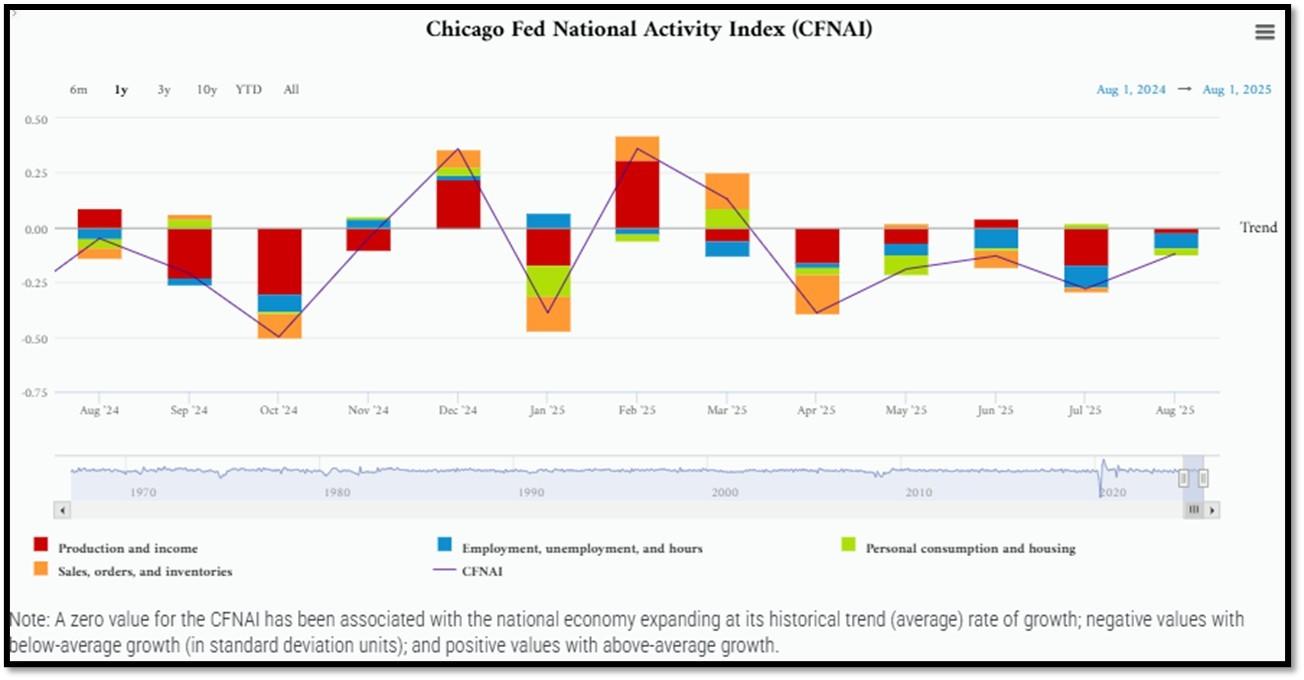
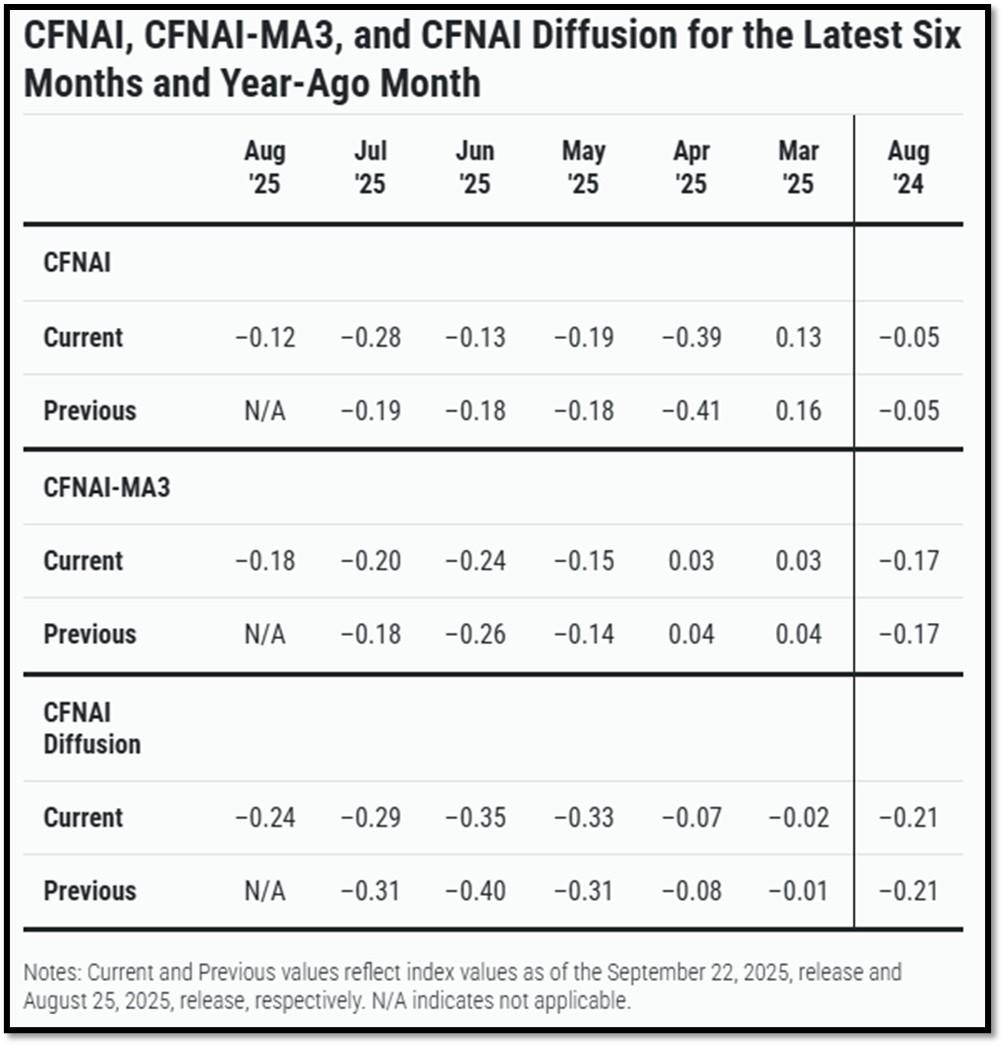
5D. The Chicago Fed National Activity Index (CFNAI) increased to –0.12 in August from –0.28 in July. Three of the four broad categories of indicators used to construct the index increased from July, but three categories made negative contributions in August. The index’s three-month moving average, CFNAI-MA3, increased to –0.18 in August from –0.20 in July. REF: ChicagoFed, August’s Report
5E. (9/18/2025) The Conference Board Leading Economic Index (LEI) for the US declined by 0.5% in August 2025 to 98.4 (2016=100), after a small 0.1% increase in July (upwardly revised from an originally reported 0.1% decline). The LEI fell by 2.8% over the six months between February and August 2025, a faster rate of decline than its 0.9% contraction over the previous six-month period (August 2024 to February 2025). The composite economic indexes are the key elements in an analytic system designed to signal peaks and troughs in the business cycle. The indexes are constructed to summarize and reveal common turning points in the economy in a clearer and more convincing manner than any individual component. The CEI is highly correlated with real GDP. The LEI is a predictive variable that anticipates (or “leads”) turning points in the business cycle by around 7 months. Shaded areas denote recession periods or economic contractions. The dates above the shaded areas show the chronology of peaks and troughs in the business cycle. The ten components of The Conference Board Leading Economic Index® for the U.S. include: Average weekly hours in manufacturing; Average weekly initial claims for unemployment insurance; Manufacturers’ new orders for consumer goods and materials; ISM® Index of New Orders; Manufacturers’ new orders for nondefense capital goods excluding aircraft orders; Building permits for new private housing units; S&P 500® Index of Stock Prices; Leading Credit Index™; Interest rate spread (10-year Treasury bonds less federal funds rate); Average consumer expectations for business conditions. REF: ConferenceBoard, LEI Report for August (ReceesionAlert) (Released on 9/30/2025)
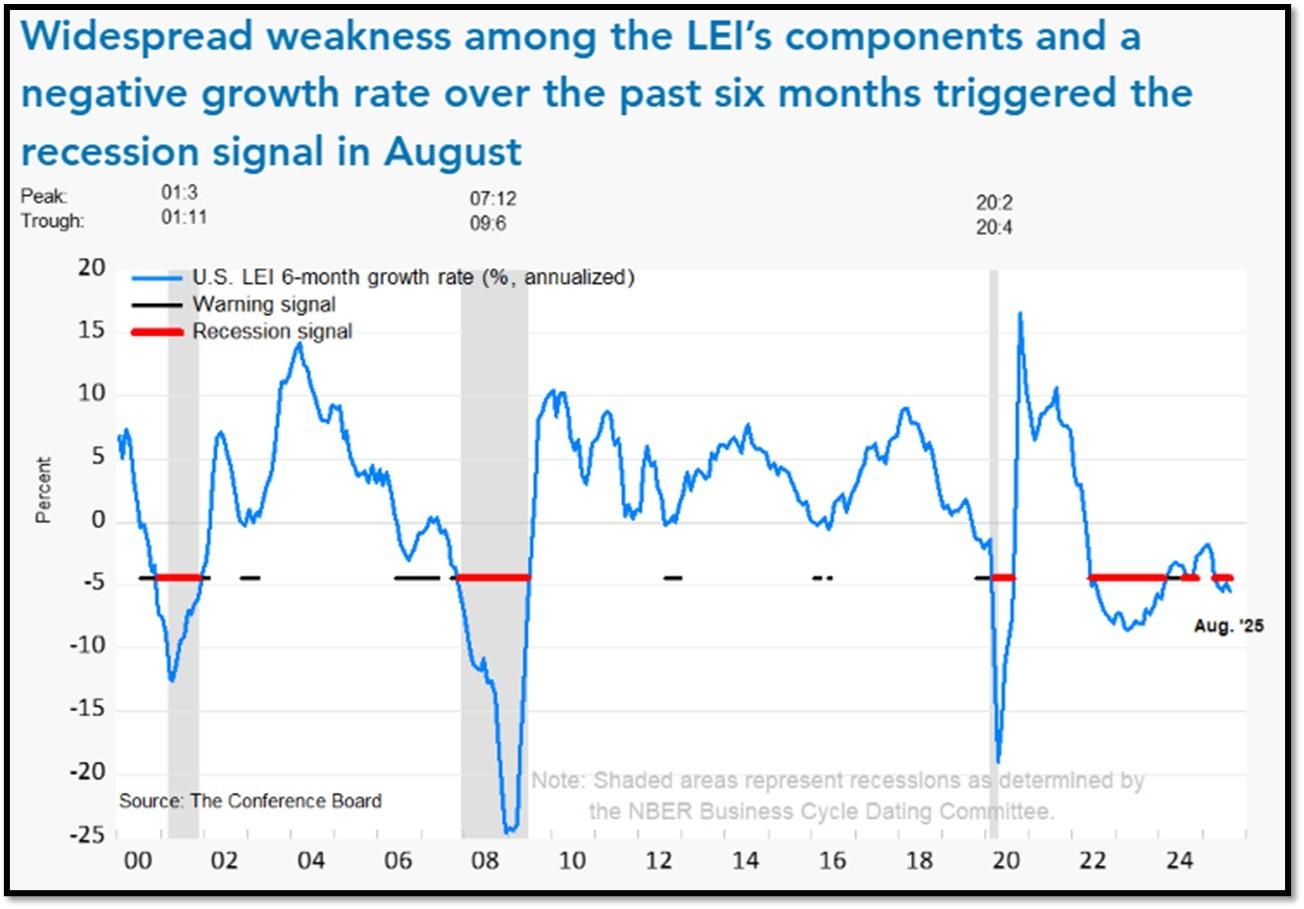
We have experienced a “rolling recession” since June 2022 and are only now emerging from it. However, authorities are not labeling it a recession due to high employment data from June 2022-2025.
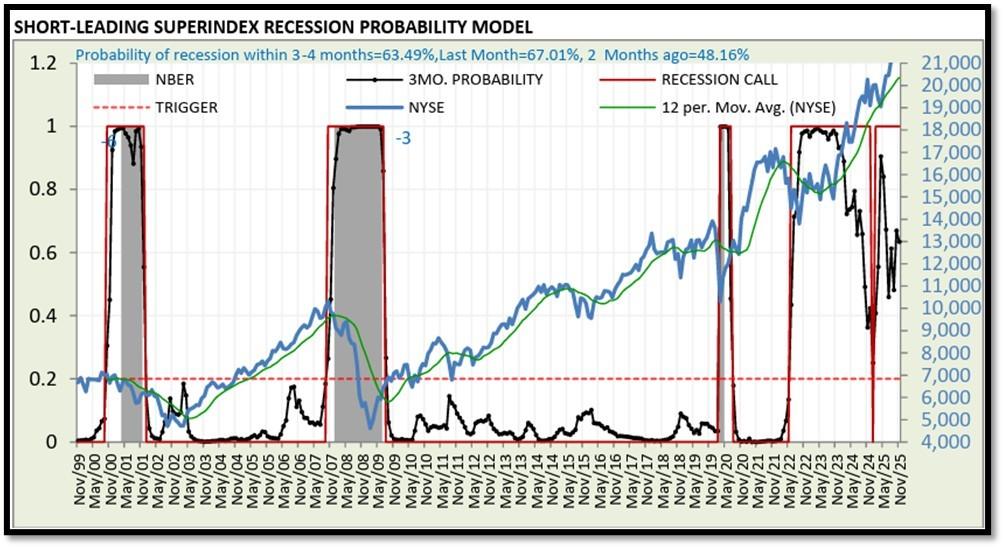
5F. Probability of U.S. falling into Recession within 3 to 4 months is currently at 63.49% (with data as of 12/01/2025 – Next Report 12/15/2025) according to RecessionAlert Research. Last release’s data was at 46.3%. This report is updated every two weeks. REF: RecessionAlertResearch
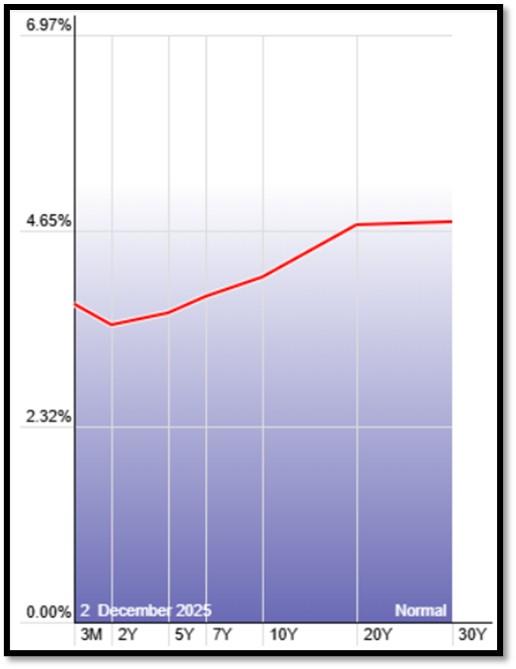
5G. Yield Curve as of 12/2/2025 is showing Normal. Spread on the 10-yr Treasury Yield (4.04%) minus yield on the 2-yr Treasury Yield (3.51%) is currently at 53bps as of 11/24/25. REF: Stockcharts The yield curve—specifically, the spread between the interest rates on the ten-year Treasury note and the three-month Treasury bill—is a valuable forecasting tool. It is simple to use and significantly outperforms other financial and macroeconomic indicators in predicting recessions two to six quarters ahead. REF: NYFED
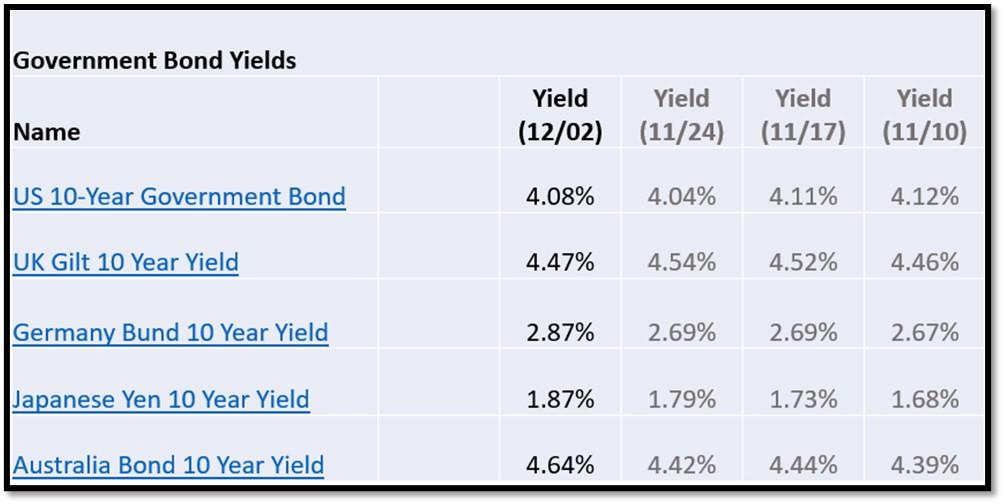
5H. Recent Yields in 10-Year Government Bonds. REF: Source is from Bloomberg.com, dated 12/2/2025, rates shown below are as of 12/2/2025, subject to change.
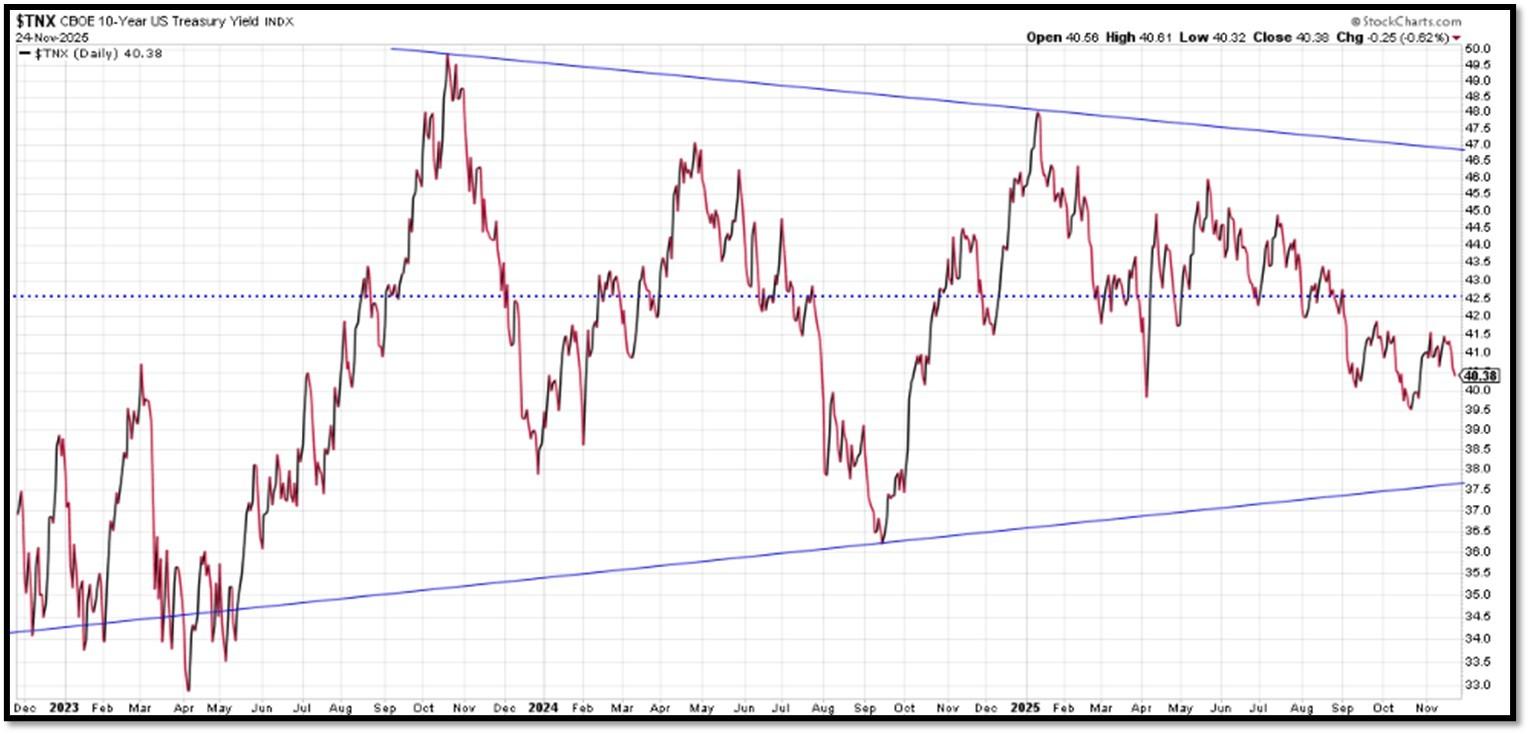
The 10-Year US Treasury Yield… The 10-Year Yield is indirectly related to inflation and prospect of the economy. I expect the 10-Year Yield to drop towards the support line. REF: StockCharts1
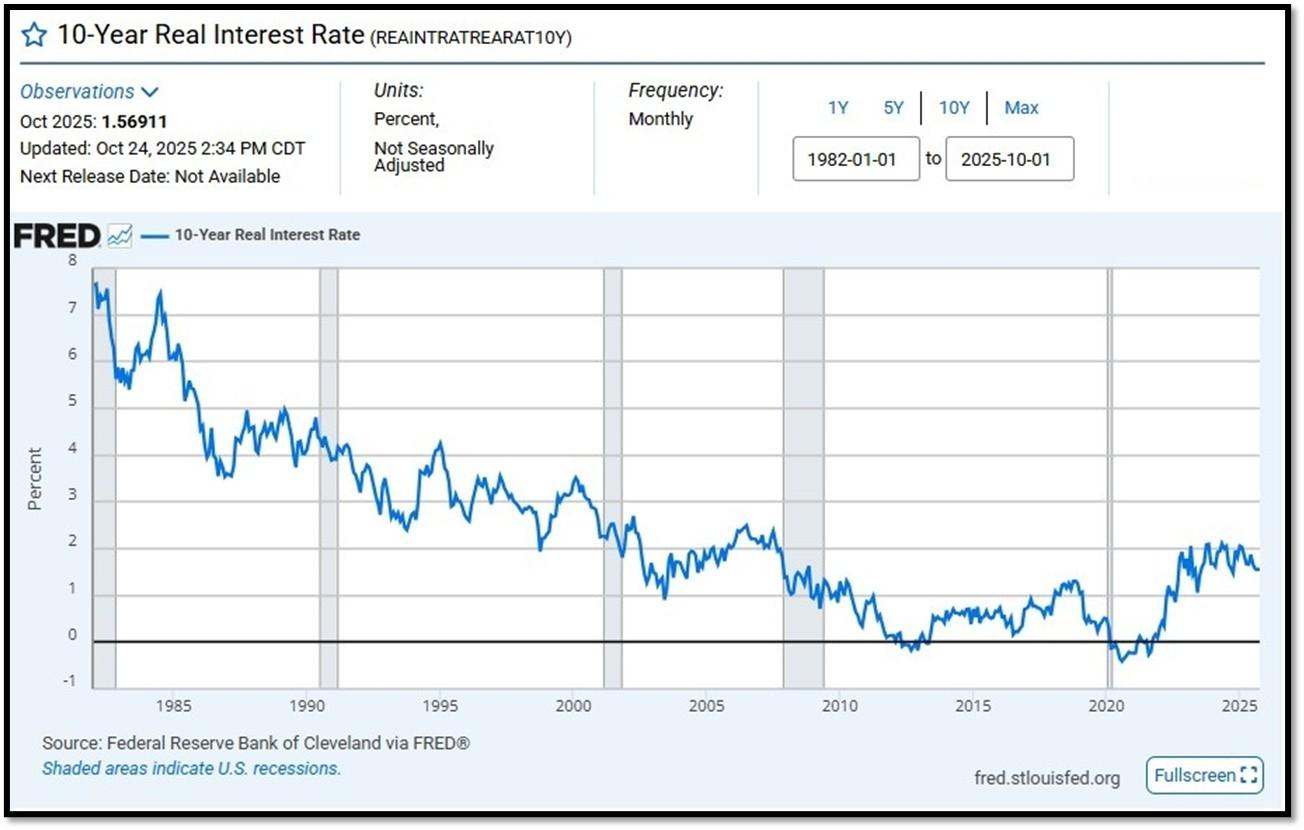
10-Year Real Interest Rate at 1.56911% as of 10/24/25. Last month’s data was 1.56046%. REF: REAINTRATREARAT10Y
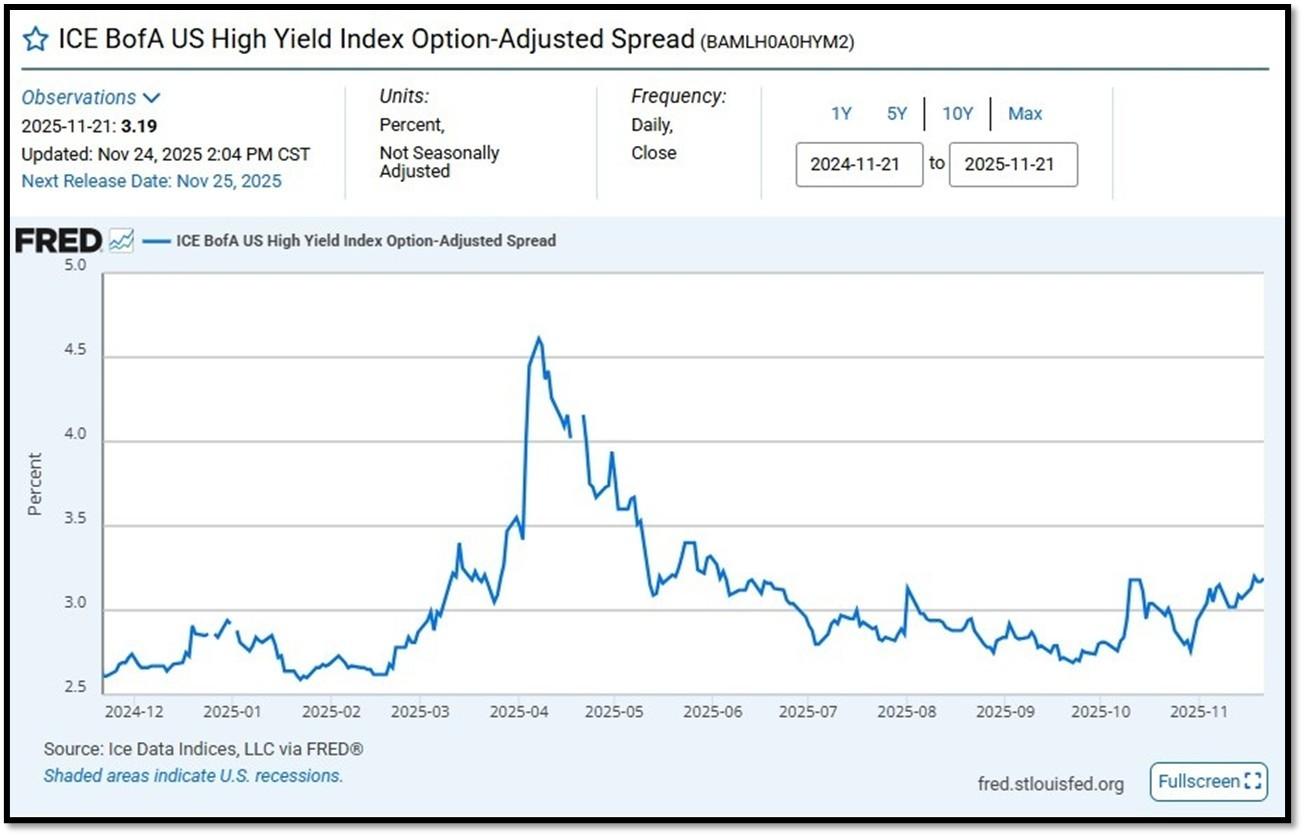
ICE BofA US High Yield Index Option-Adjusted Spread (BAMLH0A0HYM2) currently at 3.19 as of November 24, 2025. This is a key indicator of market sentiment, particularly regarding risk and economic health. At its core, the spread reflects the extra return investors demand to hold riskier corporate debt over safer government securities. High-yield bonds are issued by companies with lower credit ratings (below investment grade, like BB or lower), meaning they carry a higher chance of default. The spread compensates for this risk. When the spread is narrow—say, around 2.5% to 3%, as seen recently—it suggests investors are confident, willing to accept less extra yield because they perceive lower default risk or a strong economy. Narrow spreads often align with bullish markets, where cash is flowing, growth is steady, and fear is low. REF: FRED-BAMLH0A0HYM2
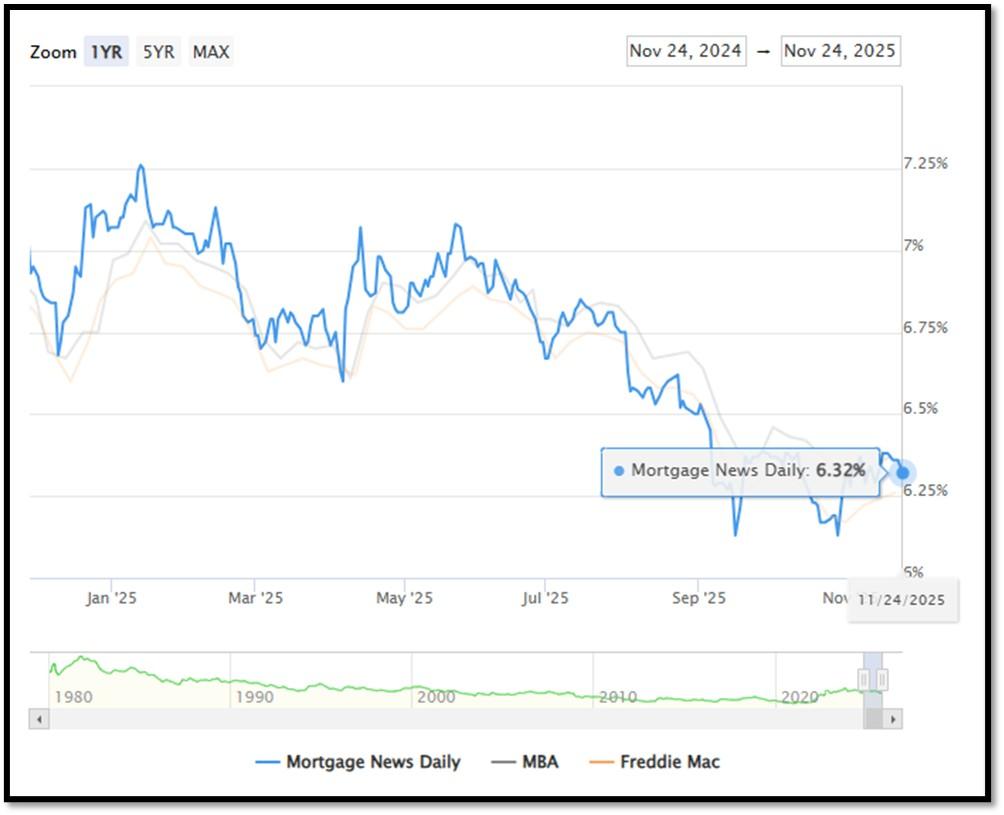
5I. (11/24/2025) Today’s National Average 30-Year Fixed Mortgage Rate is 6.32% (All Time High was 8.03% on 10/19/23). Last week’s data was 6.38%. This rate is the average 30-year fixed mortgage rates from several different surveys including Mortgage News Daily (daily index), Freddie Mac (weekly survey), Mortgage Bankers Association (weekly survey) and FHFA (monthly survey). REF: MortgageNewsDaily, Today’s Average Rate
The recent spike in the 30-year fixed-rate jumbo mortgage to 6.32%, compared to Freddie Mac’s rate at 6.26% and the Mortgage Bankers Association (MBA) rate at 6.37%, highlights key differences in the mortgage market. Jumbo mortgages, which exceed the conforming loan limits set by government agencies like Freddie Mac, typically carry higher interest rates because they are riskier for lenders. These loans are not backed by government entities, which increases the risk for lenders and, consequently, leads to higher rates. In contrast, Freddie Mac and MBA provide averages for conforming loans, which meet federal guidelines and have lower risk due to government backing, keeping their rates lower.
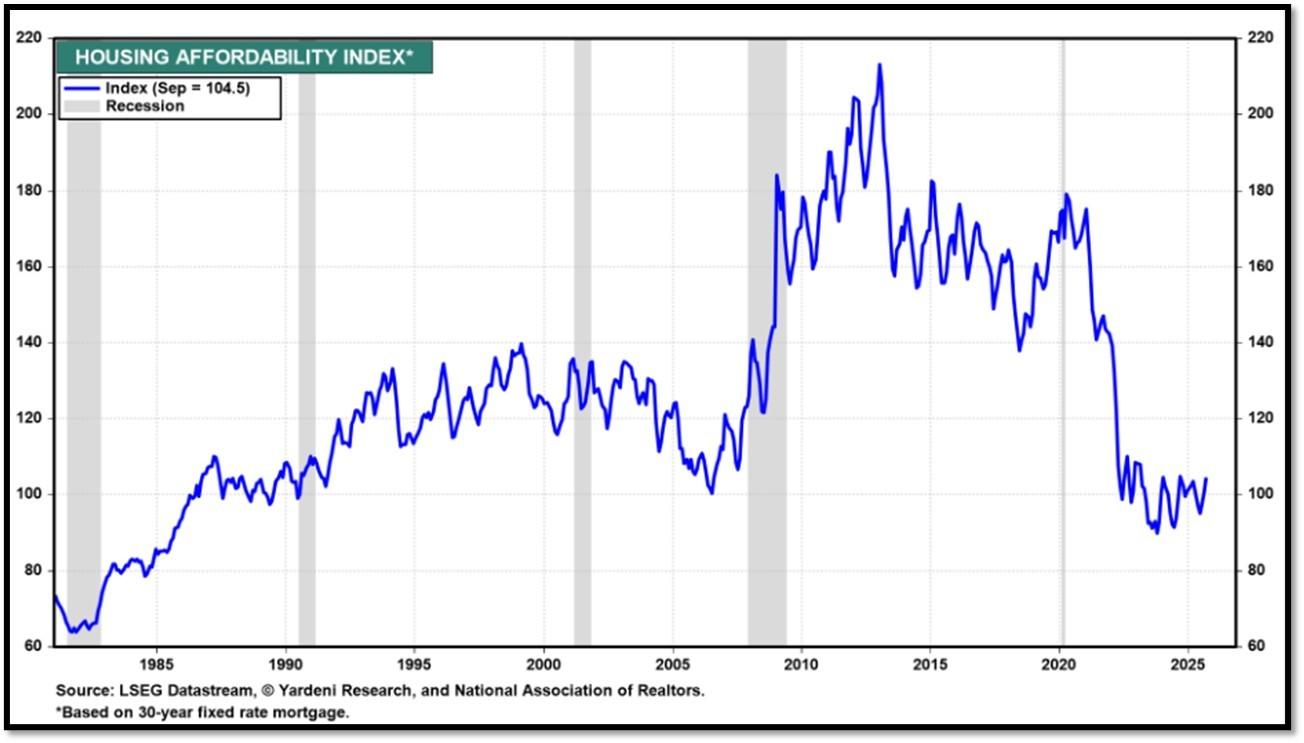
Housing Affordability Index for Sep = 104.5 // Aug = 100.5 // July = 98.8 // Jun = 94.4 // May = 97.2 // Apr = 101.0 // Mar = 103.2 // Feb = 102.2. Data provided by Yardeni Research. REF: Yardeni
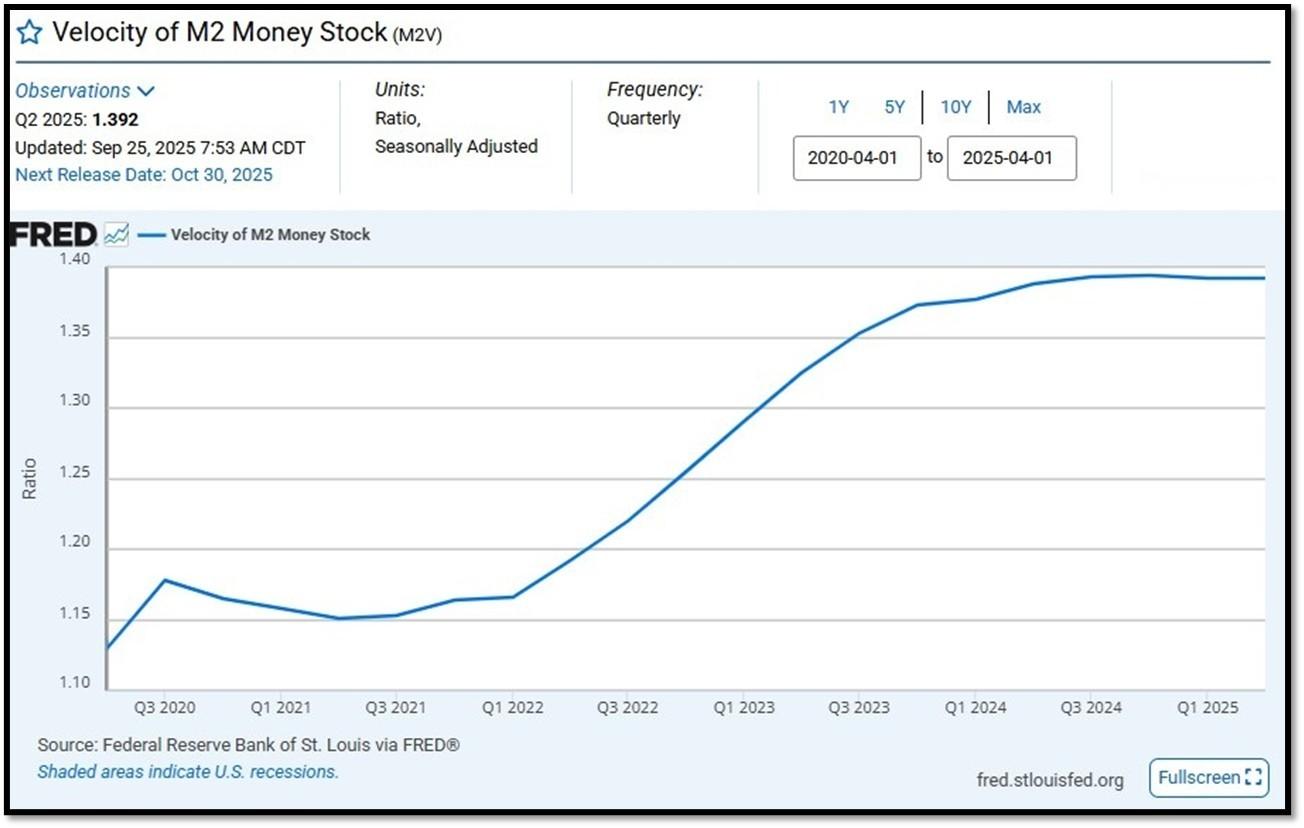
5J. Velocity of M2 Money Stock (M2V) with current read at 1.392 as of (Q2-2025 updated September 25, 2025). Previous quarter’s data was 1.386. The velocity of money is the frequency at which one unit of currency is used to purchase domestically- produced goods and services within a given time period. In other words, it is the number of times one dollar is spent to buy goods and services per unit of time. If the velocity of money is increasing, then more transactions are occurring between individuals in an economy. Current Money Stock (M2) report can be viewed in the reference link. REF: St.LouisFed-M2V
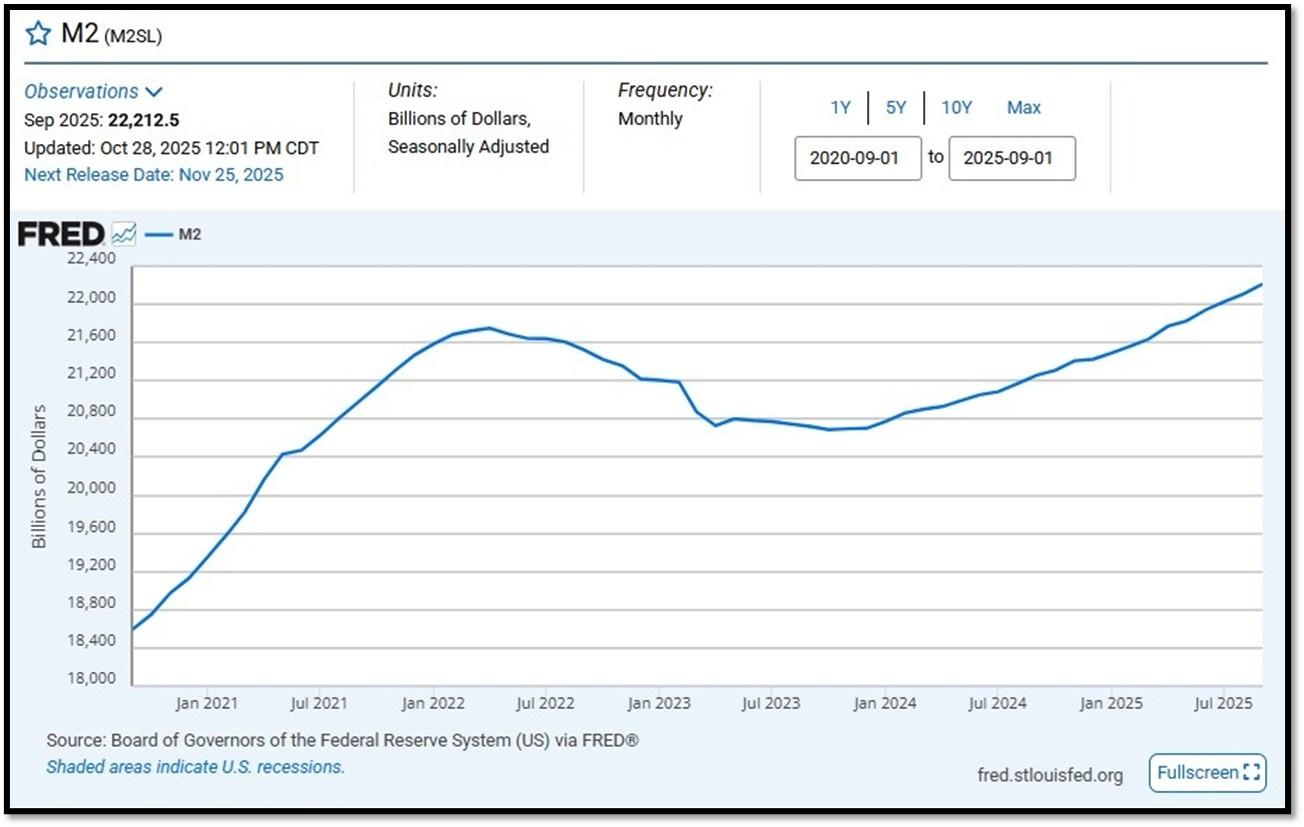
M2 consists of M1 plus (1) small-denomination time deposits (time deposits in amounts of less than $100,000) less IRA and Keogh balances at depository institutions; and (2) balances in retail MMFs less IRA and Keogh balances at MMFs. Seasonally adjusted M2 is constructed by summing savings deposits (before May 2020), small-denomination time deposits, and retail MMFs, each seasonally adjusted separately, and adding this result to seasonally adjusted M1. Board of Governors of the Federal Reserve System (US), M2 [M2SL], retrieved from FRED, Federal Reserve Bank of St. Louis; Updated on October 28, 2025. REF: St.LouisFed-M2
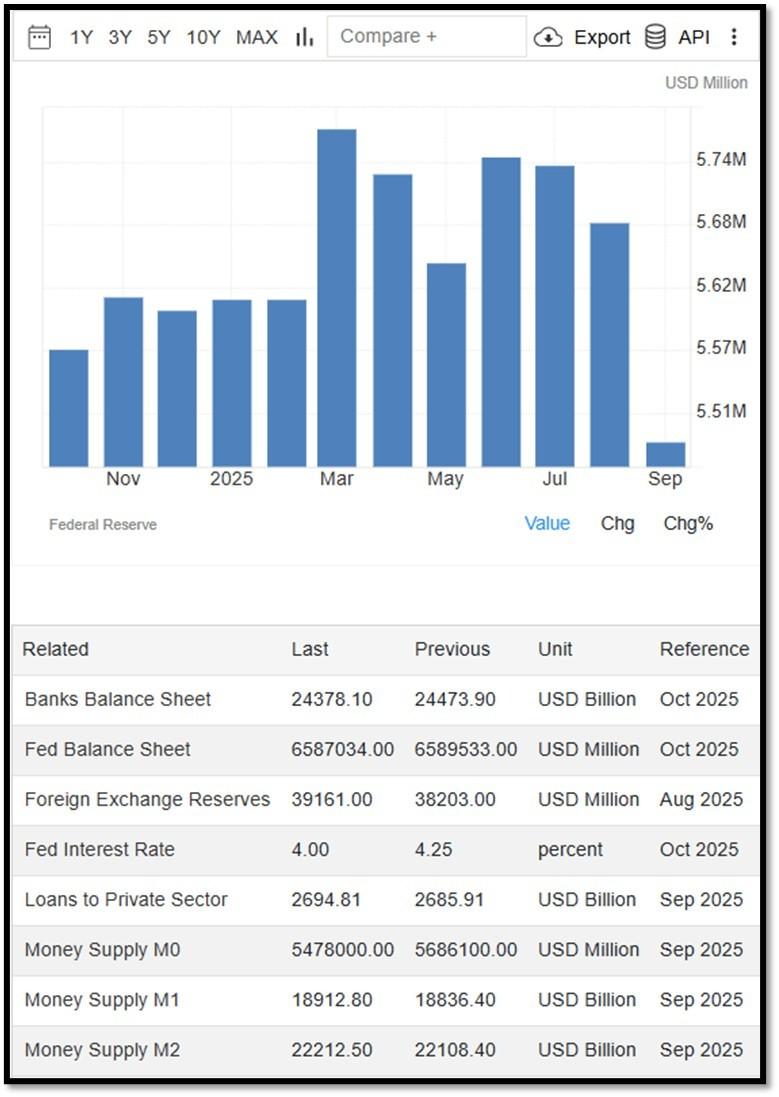
Money Supply M0 in the United States decreased to 5,478,000 USD Million in September from 5,686,100 USD Million in August of 2025. Money Supply M0 in the United States averaged 1,216,883.40 USD Million from 1959 until 2025, reaching an all time high of 6,413,100.00 USD Million in December of 2021 and a record low of 48,400.00 USD Million in February of 1961. REF: TradingEconomics, M0
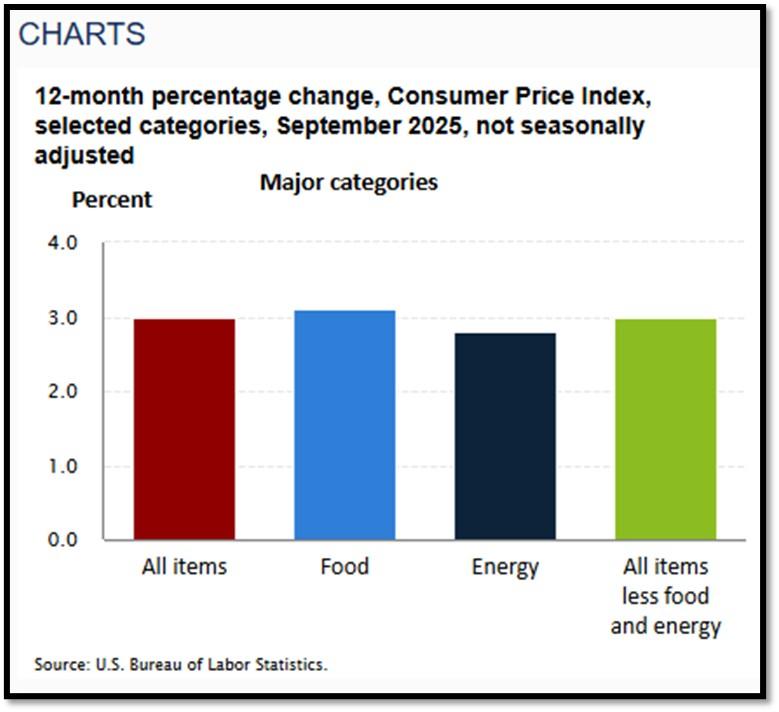
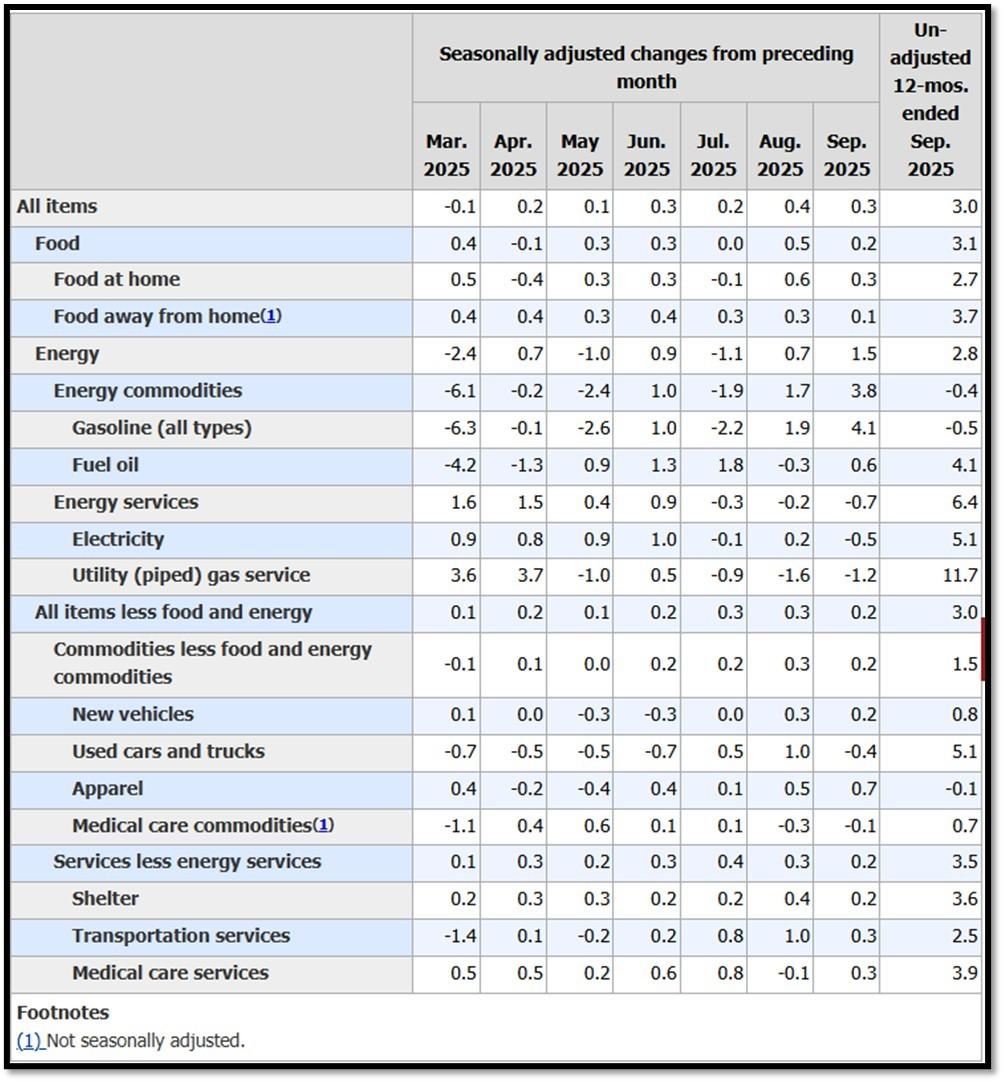
5K. In September, the Consumer Price Index for All Urban Consumers rose 0.3 percent, seasonally adjusted, and rose 3.0 percent over the last 12 months, not seasonally adjusted. The index for all items less food and energy increased 0.2 percent in September (SA); up 3.0 percent over the year (NSA). No announcement was made on October 2025’s CPI data. REF: BLS, BLS.GOV
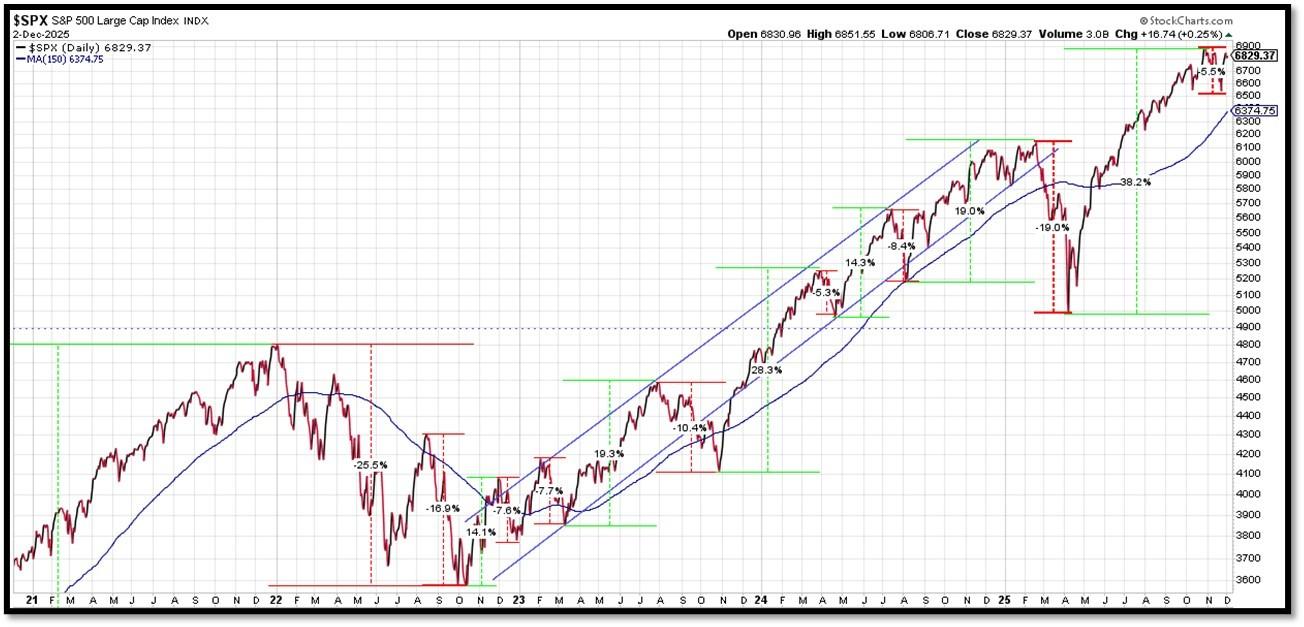
5L. Technical Analysis of the S&P500 Index. Click onto reference links below for images.
- Short-term Chart: Trend Bullish/Falling on 12/2/2025 – REF: Short-term S&P500 Chart by Marc Slavin (Click Here to Access Chart)
- Medium-term Chart: Trend Bullish on 12/2/2025 – REF: Medium-term S&P500 Chart by Marc Slavin (Click Here to Access Chart)
- Market Timing Indicators – S&P500 Index as of 12/2/2025 – REF: S&P500 Charts (7 of them) by Joanne Klein’s Top 7 (Click Here to Access Updated Charts)
- The S&P500 is sitting at all-time-high levels, rebounding from two V-shaped recoveries. REF: Stockcharts
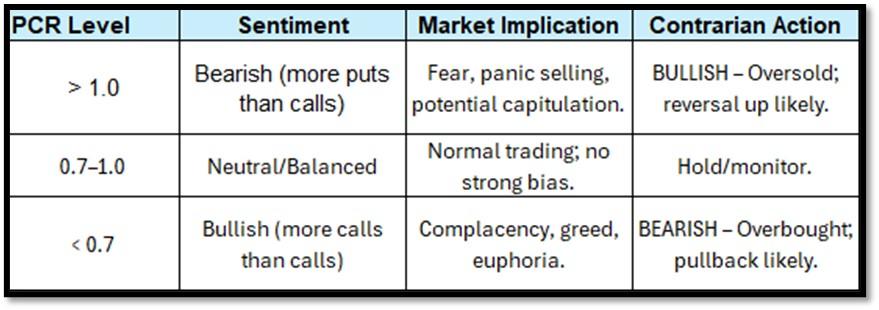
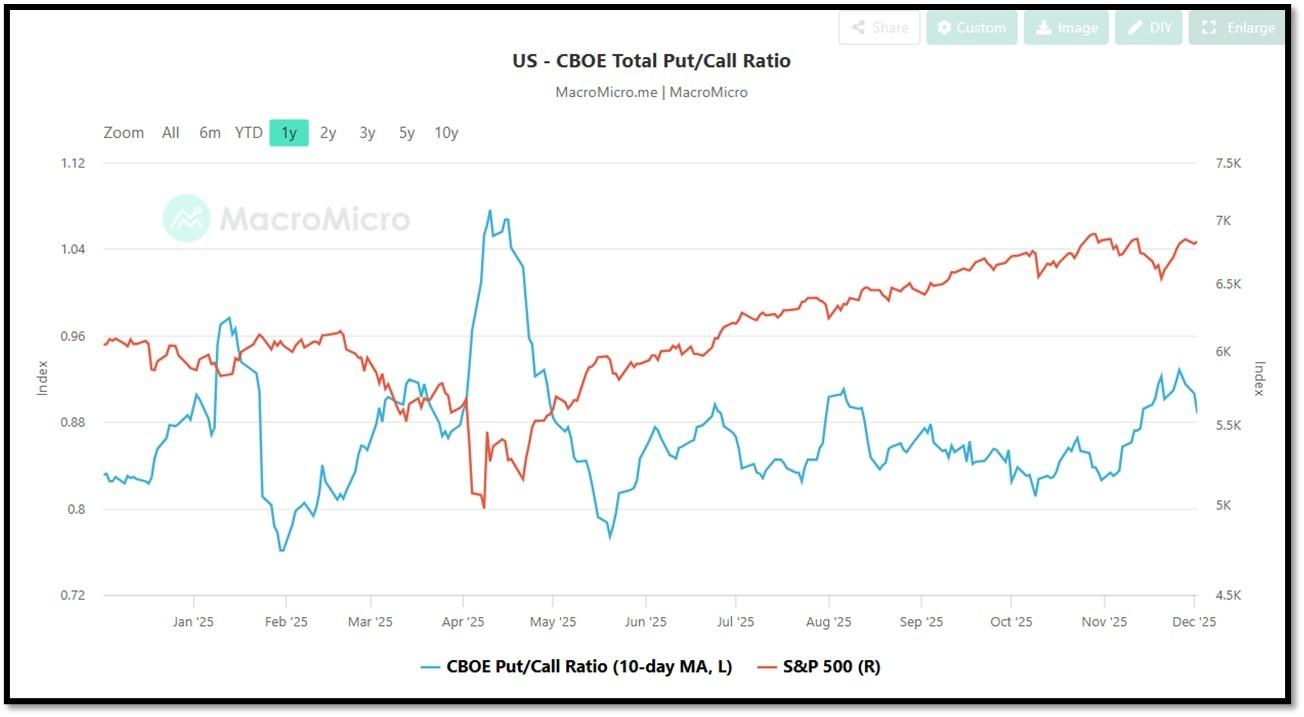
- CBOE Total Put/Call Ratio as of 12/2/2025. REF: MacroMicro
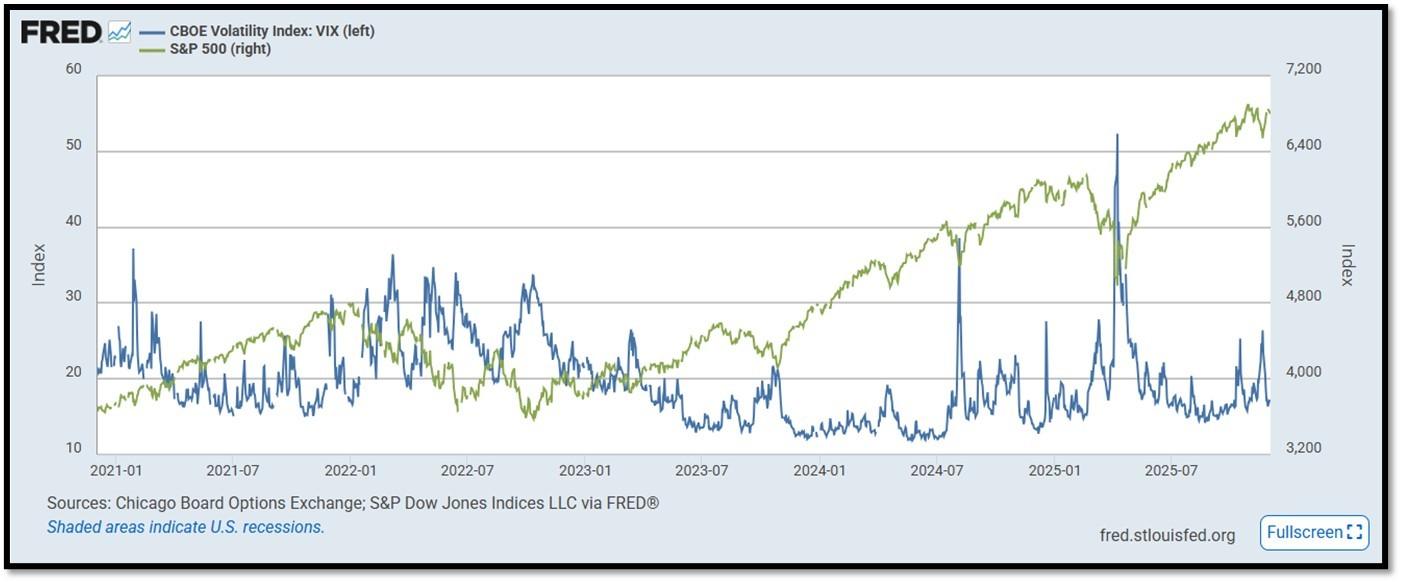
- S&P500 and CBOE Volatility Index (VIX) as of 12/2/2025. REF: FRED, Today’s Print
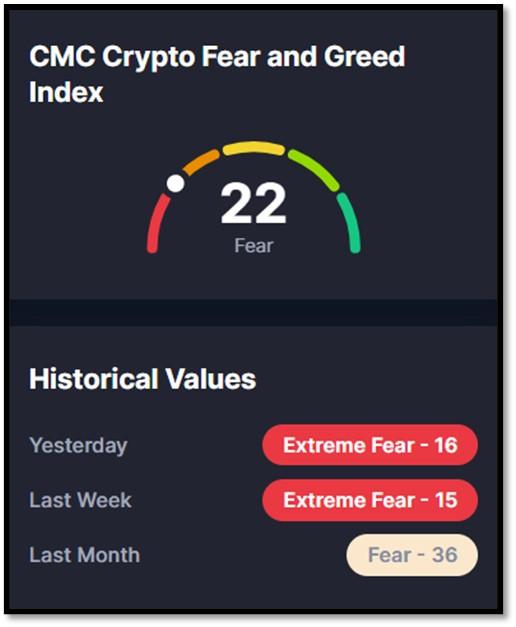
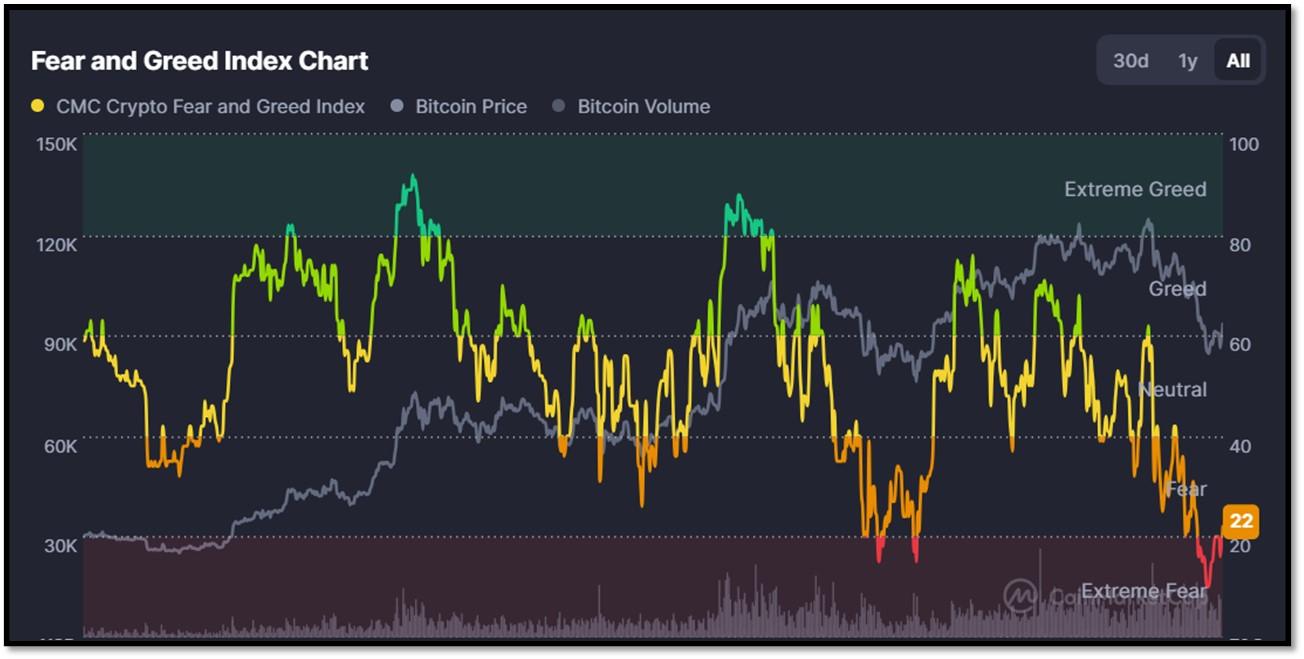
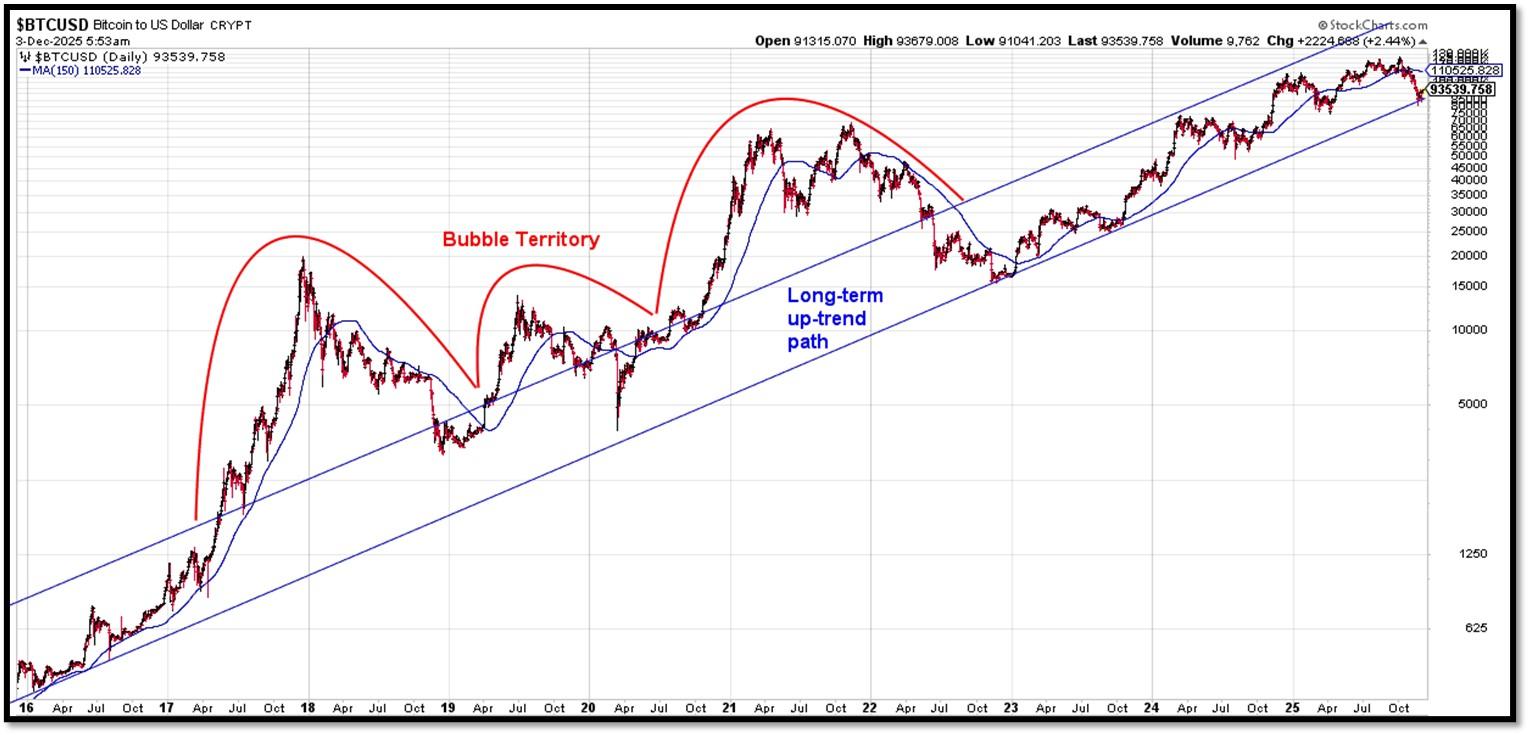
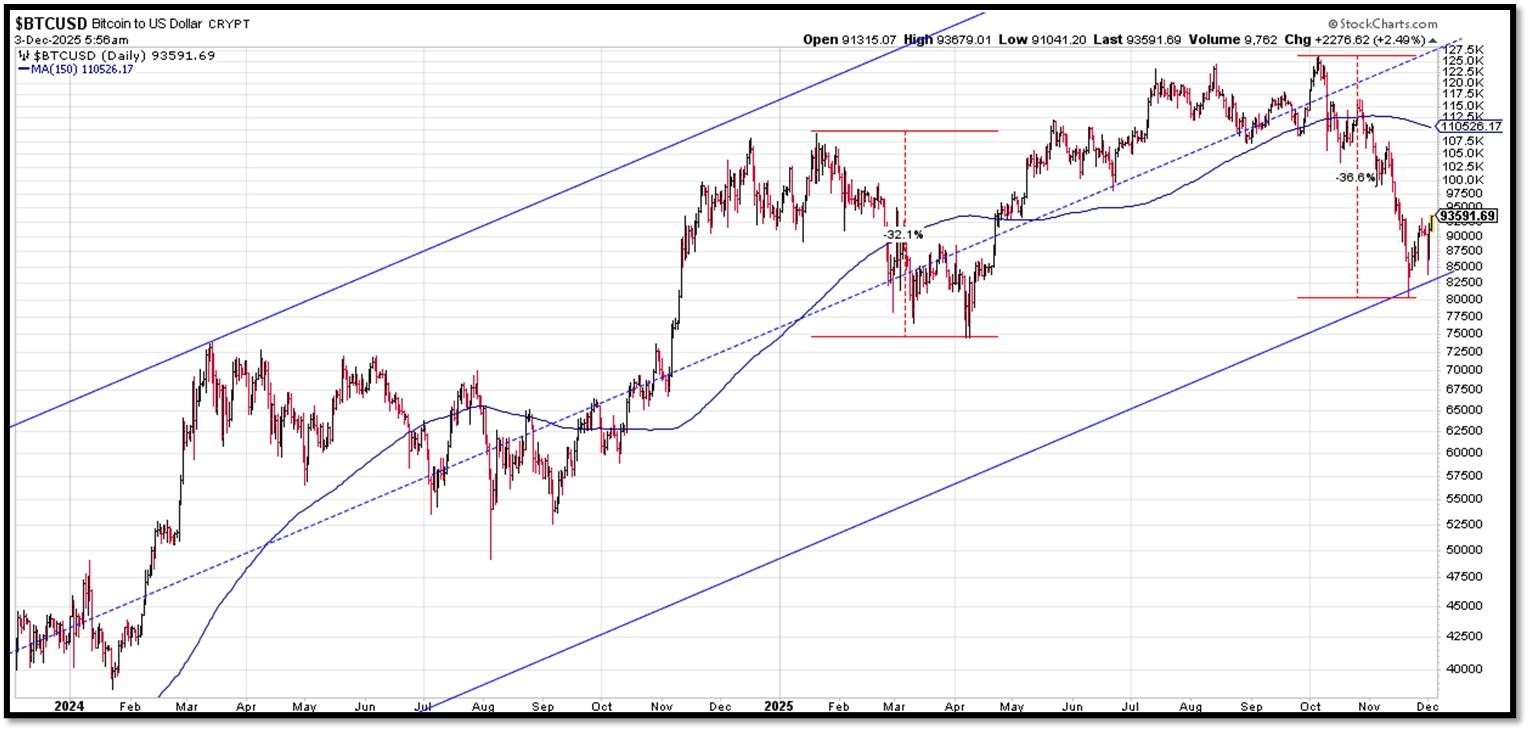
5M. Most recent read on the Crypto Fear & Greed Index with data as of 12/2/2025 is 22 (Fear). Last week’s data was 15 (Extreme Fear) (1-100). Fear & Greed Index – A Contrarian Data. The crypto market behavior is very emotional. People tend to get greedy when the market is rising which results in FOMO (Fear of missing out). Also, people often sell their coins in irrational reaction of seeing red numbers. With the Crypto Fear and Greed Index, the data try to help save investors from their own emotional overreactions. There are two simple assumptions:
- Extreme fear can be a sign that investors are too worried. That could be a buying opportunity.
- When Investors are getting too greedy, that means the market is due for a correction.
Therefore, the program for this index analyzes the current sentiment of the Bitcoin market and crunch the numbers into a simple meter from 0 to 100. Zero means “Extreme Fear”, while 100 means “Extreme Greed”. REF: Coinmarketcap.com, Today’sReading
Bitcoin – 10-Year & 2-Year Charts. REF: Stockcharts10Y, Stockcharts2Y
From the desk of our Chief Investment Officer
As an investment professional with over twenty-six years of experience in the financial services industry, Andrew helps clients to protect, grow and transfer wealth during their lifetime with objective, unbiased, customized and efficient strategies.
Education, Professional Licenses Acquired & Affiliations
- Passed the Series 7, 63, 65 and 24 license examinations
- Currently holding Series 65 License
- BA in Economics – Boston University (Boston, MA) 1993
- Certificate in Commodities Trading – New York University (New York, NY) 1991
- Certificate in Financial Planning – New York University (New York, NY) April 2011
With extensive experience in the Financial Services Industry, Andrew Tang and Turner Financial Group provides disciplined wealth management with an intelligent caring approach to each and every client that compliments the Dedicated Financial offering.


Len writes much of his own content, and also shares helpful content from other trusted providers like Turner Financial Group (TFG).
The material contained herein is intended as a general market commentary, solely for informational purposes and is not intended to make an offer or solicitation for the sale or purchase of any securities. Such views are subject to change at any time without notice due to changes in market or economic conditions and may not necessarily come to pass. This information is not intended as a specific offer of investment services by Dedicated Financial and Turner Financial Group, Inc.
Dedicated Financial and Turner Financial Group, Inc., do not provide tax, legal or accounting advice. You should consult your own tax, legal and accounting advisors before engaging in any transaction.
Any hyperlinks in this document that connect to Web Sites maintained by third parties are provided for convenience only. Turner Financial Group, Inc. has not verified the accuracy of any information contained within the links and the provision of such links does not constitute a recommendation or endorsement of the company or the content by Dedicated Financial or Turner Financial Group, Inc. The prices/quotes/statistics referenced herein have been obtained from sources verified to be reliable for their accuracy or completeness and may be subject to change.
Past performance is no guarantee of future returns. Investing involves risk and possible loss of principal capital. The views and strategies described herein may not be suitable for all investors. To the extent referenced herein, real estate, hedge funds, and other private investments can present significant risks, including loss of the original amount invested. All indexes are unmanaged, and an individual cannot invest directly in an index. Index returns do not include fees or expenses.
Turner Financial Group, Inc. is an Investment Adviser registered with the United States Securities and Exchange Commission however, such registration does not imply a certain level of skill or training and no inference to the contrary should be made. Additional information about Turner Financial Group, Inc. is also available at www.adviserinfo.sec.gov. Advisory services are only offered to clients or prospective clients where Turner Financial Group, Inc. and its representatives are properly licensed or exempt from licensure. No advice may be rendered by Turner Financial Group, Inc. unless a client service agreement is in place.


