

- 1. The Federal Reserve kept its benchmark interest rate unchanged at roughly 3.50% to 3.75%, signaling confidence that the U.S. economy remains resilient even as inflation stays above target and labor market conditions show signs of cooling at the margins.
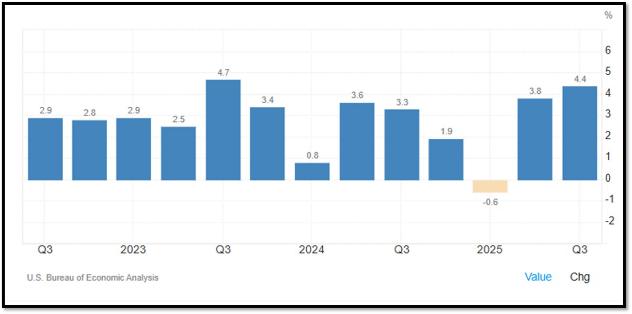
- 2. This Week’s Main Story Focuses on the strong 4.4% annualized growth of the U.S. economy in Q3 2025.
- 3. Tesla is a strategic holding in many of our Tactical Allocations. With its most recent earnings call that took place, here are the highlighted key announcements from Tesla’s Q4 2025 earnings call (January 28, 2026), rewritten for clarity and emphasis on the major highlights:
- 4. World Watch
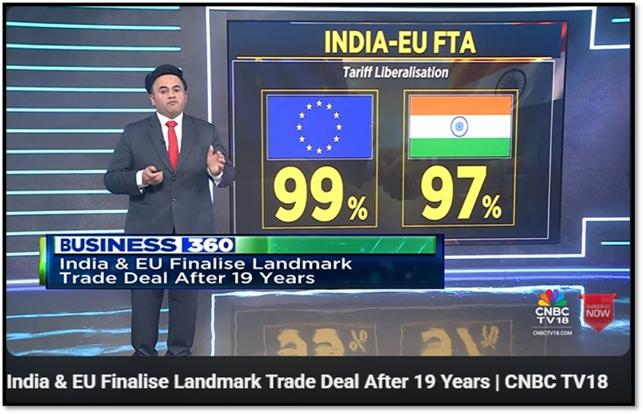
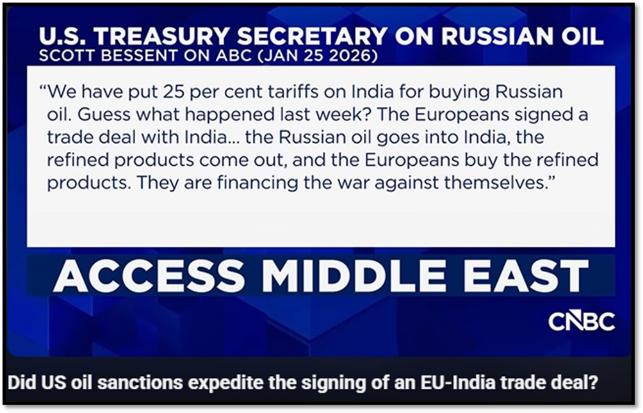
- 4A. After nearly two decades of negotiations, the European Union and India finalized a landmark free trade agreement alongside a new defense and security partnership.
- 4B. Nipah virus is a rare but severe infection first identified in Malaysia in 1998 that spreads from animals such as fruit bats and pigs to humans and, in some cases, between people, causing symptoms that range from fever and respiratory illness to fatal brain inflammation, with mortality rates often estimated between 45% and 75%.
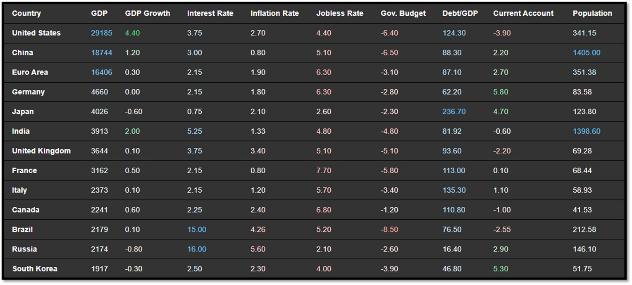
- 4C. An updated snapshot of the current global state of economy.
- 5. Quant & Technical Corner – A selection of quantitative & technical data we monitor on a regular basis to help gauge the overall financial market conditions and the investment environment.
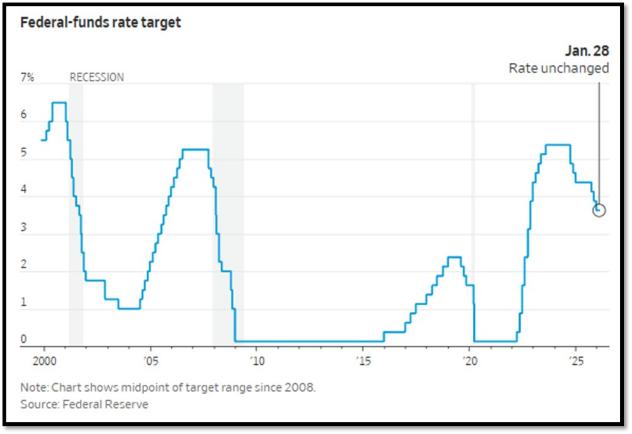
1. The Federal Reserve kept its benchmark interest rate unchanged at roughly 3.50% to 3.75%, signaling confidence that the U.S. economy remains resilient even as inflation stays above target and labor market conditions show signs of cooling at the margins.
The decision reflects a growing belief inside the Fed that policy is near a neutral level and that officials can afford to wait for clearer confirmation that inflation is sustainably heading back toward 2%. Still, the vote exposed internal debate, with two policymakers dissenting in favor of additional rate cuts, reinforcing the idea that the next phase of policy will be driven by incoming data rather than a preset easing path. Markets continue to price in rate reductions later this year, but the timing has become more uncertain as the Fed emphasizes patience and caution.
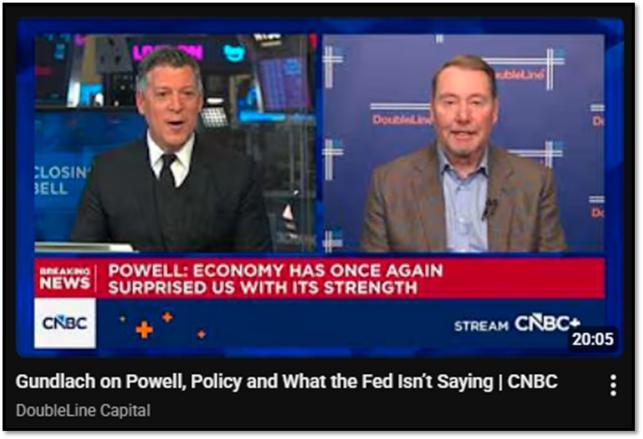
In a recent interview, Jeffrey Gundlach (DoubleLine Capital) largely echoed that cautious tone, warning that the Fed faces a difficult balancing act between slowing growth and lingering inflation risks. Gundlach highlighted that disinflation progress has been uneven, with services inflation and fiscal deficits still posing structural challenges, arguing that premature easing could reignite price pressures. At the same time, he noted that economic and market signals are becoming more fragile beneath the surface, suggesting that rate cuts are likely eventually, but only once the data clearly deteriorates. His takeaway aligns with the Fed’s current stance: policy is on hold not because risks are gone, but because uncertainty is high, making patience the least dangerous option for now. Click onto picture below to access video. REF: CNBC, WSJ
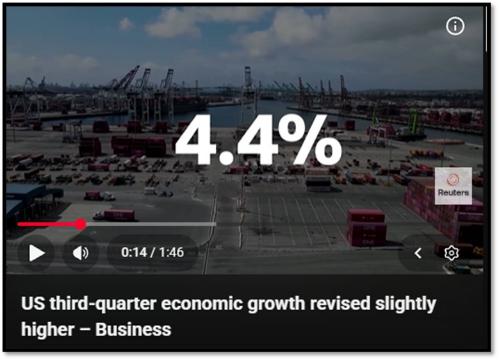
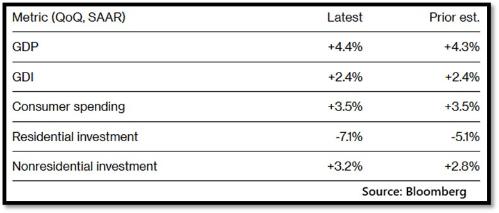
2. This Week’s Main Story Focuses on the strong 4.4% annualized growth of the U.S. economy in Q3 2025.
It is slightly above the initial 4.3 % estimate and the fastest growth since Q3 2023. The upward revision was driven mainly by stronger exports and a smaller drag from inventories, signaling healthier underlying demand rather than one-time statistical noise. Growth was broad based, with consumers continuing to spend, exports rebounding as global demand improved, and government outlays adding incremental support. Importantly, inventory headwinds eased, suggesting firms are better aligned with demand and positioned for continued production momentum rather than forced drawdowns.
This acceleration in economic growth sets the stage for faster US earnings growth, particularly as revenue expansion and operating leverage begin to reinforce each other. Key earnings implications include:
• Strong consumer spending translating directly into higher top line growth for consumer discretionary, services, and travel related sectors
• Export strength benefiting industrials, technology hardware, energy, and capital goods companies with global exposure
• Government spending supporting defense, infrastructure, healthcare, and select technology providers
• Improved inventory dynamics reducing margin pressure and supporting more efficient production cycles
• Higher capacity utilization allowing fixed costs to be spread over greater revenue, boosting operating margins
Taken together, a growth rate above trend typically leads earnings growth by one to two quarters. With demand holding up across households, global trade, and the public sector, US corporations are positioned for accelerating profit growth even without aggressive cost cutting, reinforcing the case for continued earnings resilience and equity market support. Click onto picture below to access video. REF: TradingEconomics, Bloomberg, EYP
3. Tesla is a strategic holding in many of our Tactical Allocations. With its most recent earnings call that took place, here are the highlighted key announcements from Tesla’s Q4 2025 earnings call (January 28, 2026), rewritten for clarity and emphasis on the major highlights:
- End of Model S and Model X production — Tesla will begin phasing out production of the Model S and Model X next quarter (Q1 2026), with production expected to stop entirely thereafter. This “honorable discharge” frees up factory space at the Fremont facility, as the company moves fully toward an autonomous future—only the next-gen Roadster will be an exception to fully autonomous vehicles.
- Major strategic shift to physical AI and robotics, Tesla is repositioning as a leader in autonomy and humanoid robotics, with Elon Musk describing the company’s evolving mission toward “amazing abundance” through AI-driven products like Robotaxi, Optimus, and energy solutions.
- Fremont factory conversion to Optimus production — The production space currently used for Model S and X will be converted into an Optimus factory, targeting a long-term capacity of 1 million units per year of Optimus humanoid robots in that dedicated Fremont area. This reflects a complete retooling of the line for robotics, with no major overlap from existing EV supply chains.
- Optimus Gen 3 unveiling and ramp — Third-generation Optimus (the first version designed for large-scale production, featuring redesigned hands and enhanced capabilities) will be unveiled in Q1 2026, with first-generation production lines already being installed in anticipation of volume manufacturing before the end of 2026.
- Heavy 2026 investment focus — Capex expected to exceed $20 billion in 2026 (a sharp increase) to support six major production ramps, including Cybercab (starting ~April 2026), Tesla Semi, Megapack 3, Optimus, next-gen Roadster, and AI infrastructure; plus a $2 billion investment in xAI (closing Q1 2026) to bolster AI capabilities.
- Other operational progress — Record energy storage deployments in Q4/full-year; FSD (Supervised) subscriber growth to ~1.1 million; safety monitors removed from limited Robotaxi rides in Austin (enabling expansion); preparations advancing for Cybercab and Semi volume production in 2026.
These announcements showcase Tesla’s aggressive pivot from legacy flagship vehicles to high-growth areas in AI, robotics, and autonomy, despite near-term automotive headwinds and elevated spending. Click onto pictures below to access Earnings Slide Deck and video. REF: SlideDeck, GeneMunster, Webcast


NOTE: Not investment/tax advice or recommendations. Investors should carefully consider the investment objectives, risks, charges, and expenses before investing. For additional information about the securities mentioned above, please visit the respective security’s investor relations page(s) for additional information. Please read all materials carefully before investing.
https://ir.tesla.com/#quarterly-disclosure
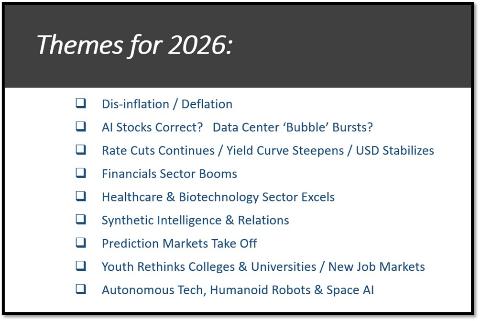
Below is a slide from my market update slide deck. Feel free to schedule a presentation for you and your audience.
4. World Watch
4A. After nearly two decades of negotiations, the European Union and India finalized a landmark free trade agreement alongside a new defense and security partnership.
The trade pact removes or sharply reduces tariffs on more than 96 % of goods over time, positioning European exporters in automobiles, industrial machinery, chemicals, pharmaceuticals, and luxury goods to gain meaningful market share in India. The agreement also improves access for services, strengthens intellectual property protections, and incorporates labor and sustainability standards, making it one of the European Union’s most comprehensive trade agreements with a major emerging economy.
For the United States, the implications are both economic and strategic. American companies risk falling behind in the Indian market as European competitors benefit from preferential access, particularly in capital goods, automobiles, and advanced manufacturing where US firms already compete but face higher tariffs. From a geopolitical perspective, the deal reinforces India’s growing role in global supply chain diversification and deepens its alignment with Western partners, while underscoring the absence of a comparable US India trade framework. Although defense and technology ties between Washington and New Delhi remain strong, the agreement increases pressure on the United States to reengage on trade initiatives in order to maintain economic influence in one of the world’s fastest growing major economies. Click onto pictures below to access videos. REF: EuropeanCommission, REUTERS, CNBC-TV18, CNBC-INTL
4B. Nipah virus is a rare but severe infection first identified in Malaysia in 1998 that spreads from animals such as fruit bats and pigs to humans and, in some cases, between people, causing symptoms that range from fever and respiratory illness to fatal brain inflammation, with mortality rates often estimated between 45% and 75%.
There are 2 confirmed cases of Nipah virus disease have been reported in the Indian state of West Bengal since late 2025 into early 2026. There is currently no approved vaccine or targeted treatment beyond supportive medical care. In early 2026, a small number of new cases were reported in India, prompting heightened health monitoring and screening across parts of Asia, although officials indicated the situation appeared contained with close contacts testing negative, underscoring that while Nipah outbreaks remain rare, they are closely watched due to their severity and epidemic potential. Click onto picture below to access video. REF: REUTERS, CDC

4C. An updated snapshot of the current global state of economy.
According to TradingEconomics as of 1/26/2026. REF: TradingEconomics
- The US economy expanded at an annualized rate of 4.4% in Q3 2025, slightly above the initial estimate of 4.3% and marking the strongest GDP growth since Q3 2023.
- Japan’s annual inflation eased to 2.1% in December 2025 from 2.9% in the prior month, the lowest since March 2022. Food inflation fell to a 13-month low (5.1% vs 6.1%), driven by the slowest rise in rice prices in 16 months.
- UK consumer price inflation rose to 3.4% in December 2025, up from November’s eight-month low of 3.2% and slightly above market expectations of 3.3%.
- South Korea’s economy contracted by 0.3% QoQ in the three months to December 2025, reversing a 1.3% expansion in Q3 and missing expectations for a 0.1% increase.
5. Quant & Technical Corner – A selection of quantitative & technical data we monitor on a regular basis to help gauge the overall financial market conditions and the investment environment.
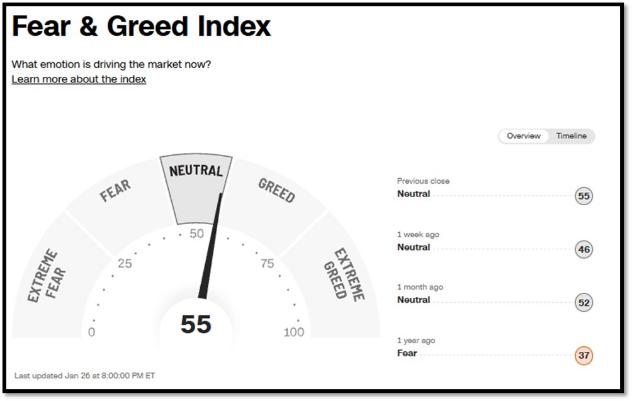
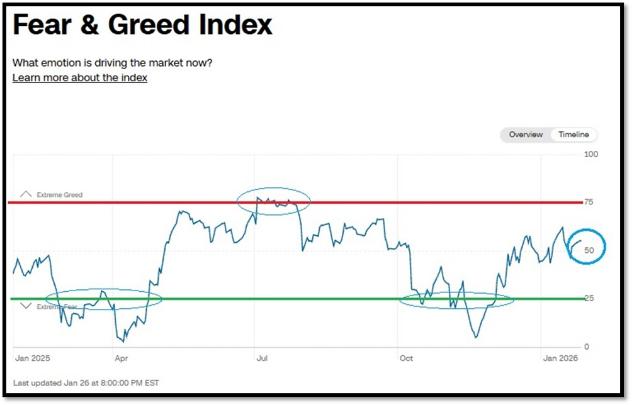
5A. Most recent read on the Fear & Greed Index with data as of 1/26/2026 – 8:00 PM-ET is 55 (Neutral). Last week’s data was 46 (Neutral) (1-100). CNNMoney’s Fear & Greed index looks at 7 indicators (Stock Price Momentum, Stock Price Strength, Stock Price Breadth, Put and Call Options, Junk Bond Demand, Market Volatility, and Safe Haven Demand). Keep in mind this is a contrarian indicator! REF: Fear&Greed via CNNMoney
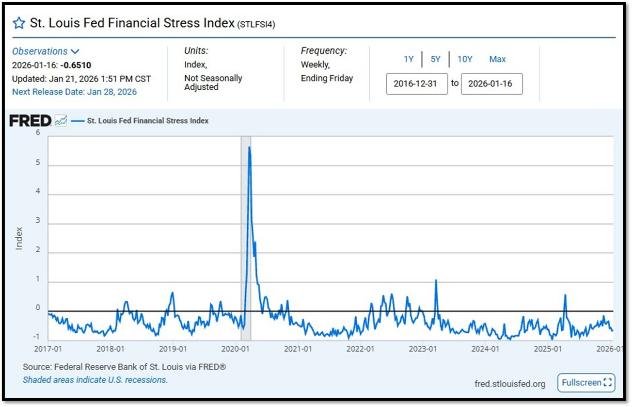
5B. St. Louis Fed Financial Stress Index’s (STLFSI4) most recent read is at –0.6510 as of January 21, 2025. Previous week’s data was -0.6644. A big spike up from previous readings reflecting the turmoil in the banking sector back in 2023. This weekly index is not seasonally adjusted. The STLFSI4 measures the degree of financial stress in the markets and is constructed from 18 weekly data series: seven interest rate series, six yield spreads and five other indicators. Each of these variables captures some aspect of financial stress. Accordingly, as the level of financial stress in the economy changes, the data series are likely to move together. REF: St. Louis Fed
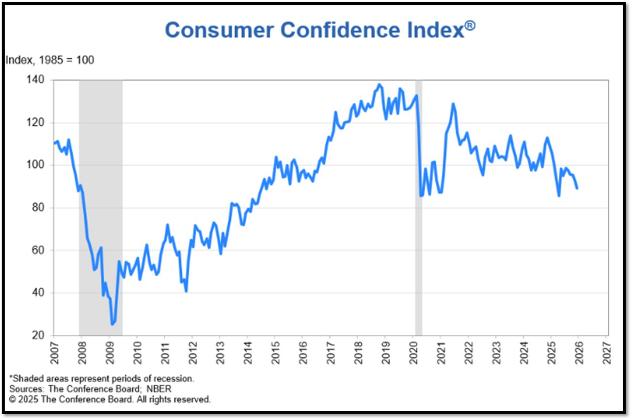
5C. “Despite an upward revision in November related to the end of the shutdown, consumer confidence fell again in December and remained well below this year’s January peak. Four of five components of the overall index fell, while one was at a level signaling notable weakness,” said Dana M Peterson, Chief Economist, The Conference Board. The Conference Board Consumer Confidence Index® declined by 3.8 points in December to 89.1 (1985=100), from 92.9 in November. REF: ConsumerConfidence
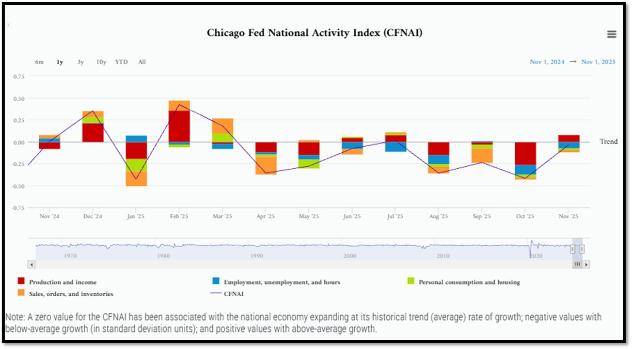
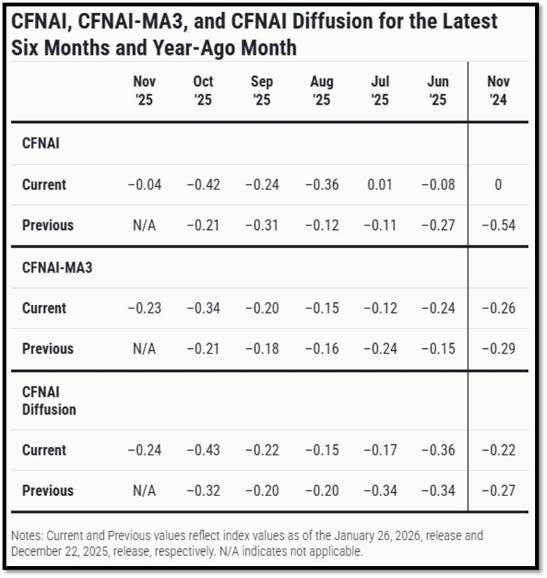
5D. The Chicago Fed National Activity Index (CFNAI) increased to –0.04 in November from –0.42 in October. Three of the four broad categories of indicators used to construct the index increased from October, but three categories made negative contributions in November. The index’s three-month moving average, CFNAI-MA3, increased to –0.23 in November from –0.34 in October. REF: ChicagoFed, November’s Report
5E. (1/23/2026) The Conference Board Leading Economic Index® (LEI) for the US declined by 0.3% in November 2025 to 97.9 (2016=100), after declining by 0.1% in October to 98.2, down from 98.3 in September. Overall, the LEI fell by 1.2% over the six months between May and November 2025, a much more moderate rate of decline than its 2.6% contraction over the previous six-month period (November 2024 to May 2025). The composite economic indexes are the key elements in an analytic system designed to signal peaks and troughs in the business cycle. The indexes are constructed to summarize and reveal common turning points in the economy in a clearer and more convincing manner than any individual component. The CEI is highly correlated with real GDP. The LEI is a predictive variable that anticipates (or “leads”) turning points in the business cycle by around 7 months. Shaded areas denote recession periods or economic contractions. The dates above the shaded areas show the chronology of peaks and troughs in the business cycle. The ten components of The Conference Board Leading Economic Index® for the U.S. include: Average weekly hours in manufacturing; Average weekly initial claims for unemployment insurance; Manufacturers’ new orders for consumer goods and materials; ISM® Index of New Orders; Manufacturers’ new orders for nondefense capital goods excluding aircraft orders; Building permits for new private housing units; S&P 500® Index of Stock Prices; Leading Credit Index™; Interest rate spread (10-year Treasury bonds less federal funds rate); Average consumer expectations for business conditions. REF: ConferenceBoard, LEI Report for November (ReceesionAlert) (Released on 12/30/2025)
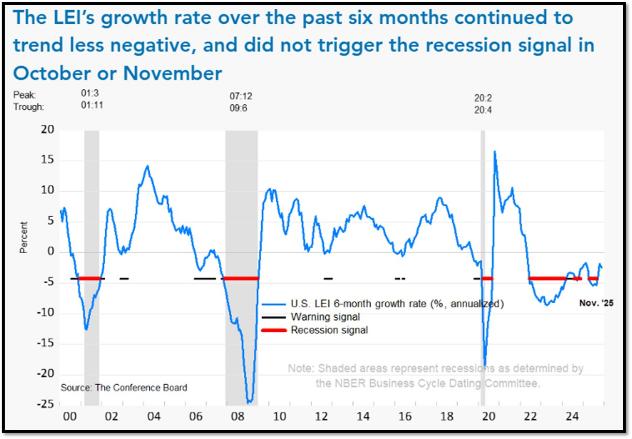
We have experienced a “rolling recession” since June 2022 and are only now emerging from it. However, authorities are not labeling it a recession due to high employment data from June 2022-2025.
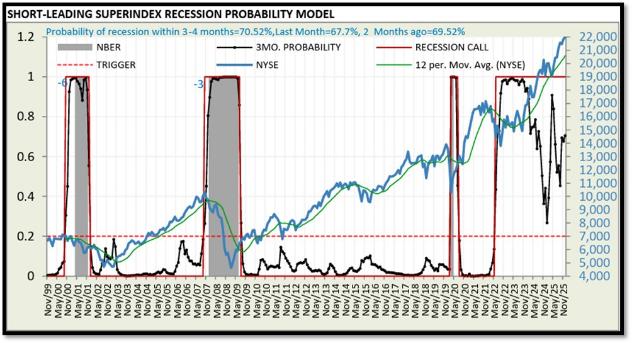
5F. Probability of U.S. falling into Recession within 3 to 4 months is currently at 70.52% (with data as of 01/14/2026 – Next Report 1/28/2026) according to RecessionAlert Research. Last release’s data was at 63.49%. This report is updated every two weeks. REF: RecessionAlertResearch
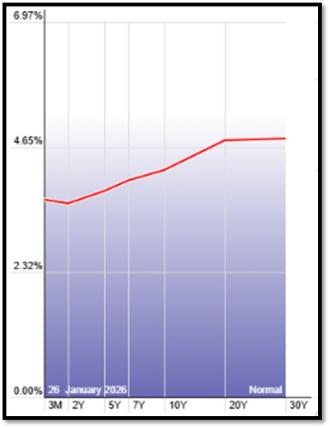
5G. Yield Curve as of 1/26/2026 is showing Normal. Spread on the 10-yr Treasury Yield (4.27%) minus yield on the 2-yr Treasury Yield (3.58%) is currently at 69bps. REF: Stockcharts The yield curve—specifically, the spread between the interest rates on the ten-year Treasury note and the three-month Treasury bill—is a valuable forecasting tool. It is simple to use and significantly outperforms other financial and macroeconomic indicators in predicting recessions two to six quarters ahead. REF: NYFED
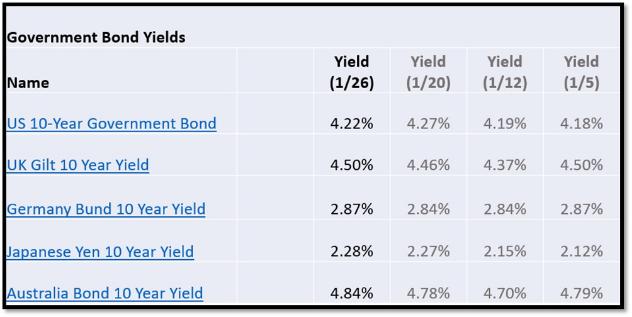
5H. Recent Yields in 10-Year Government Bonds. REF: Source is from Bloomberg.com, dated 1/26/2026, rates shown below are as of 1/26/2026, subject to change.
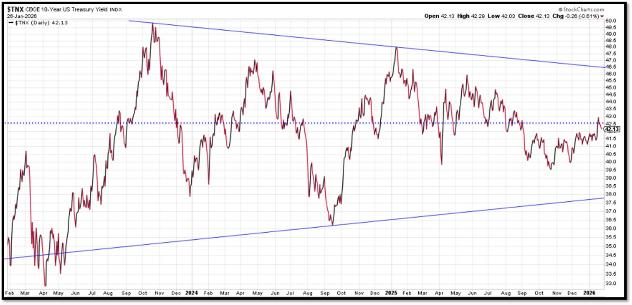
The 10-Year US Treasury Yield… The 10-Year Yield is indirectly related to inflation and prospect of the economy. I expect the 10-Year Yield to drop towards the support line. REF: StockCharts1
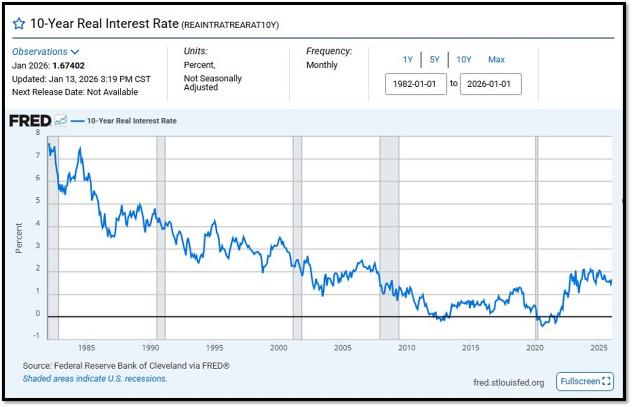
10-Year Real Interest Rate at 1.67402% as of 1/13/26. Last month’s data was 1.45392%. REF: REAINTRATREARAT10Y
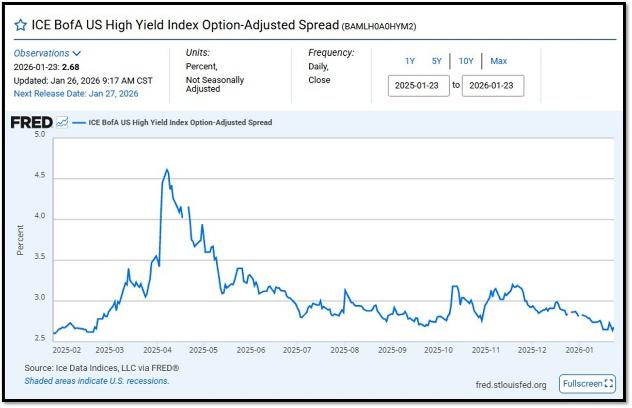
ICE BofA US High Yield Index Option-Adjusted Spread (BAMLH0A0HYM2) currently at 2.68 as of January 26, 2026. This is a key indicator of market sentiment, particularly regarding risk and economic health. At its core, the spread reflects the extra return investors demand to hold riskier corporate debt over safer government securities. High-yield bonds are issued by companies with lower credit ratings (below investment grade, like BB or lower), meaning they carry a higher chance of default. The spread compensates for this risk. When the spread is narrow—say, around 2.5% to 3%, as seen recently—it suggests investors are confident, willing to accept less extra yield because they perceive lower default risk or a strong economy. Narrow spreads often align with bullish markets, where cash is flowing, growth is steady, and fear is low. REF: FRED-BAMLH0A0HYM2
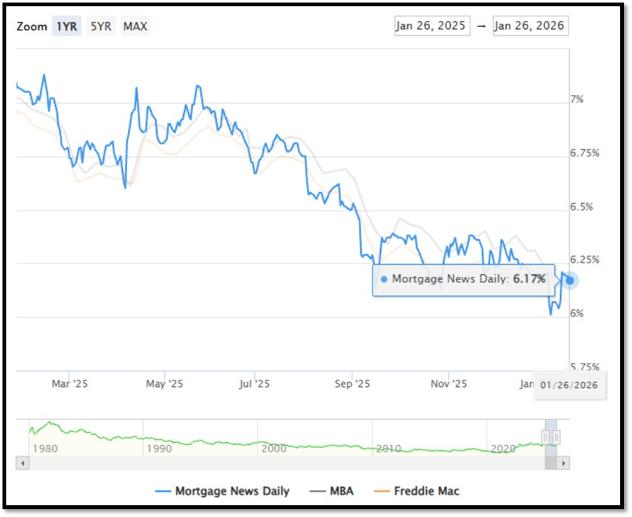
5I. (1/26/2026) Today’s National Average 30-Year Fixed Mortgage Rate is 6.17% (All Time High was 8.03% on 10/19/23). Last week’s data was 6.21%. This rate is the average 30-year fixed mortgage rates from several different surveys including Mortgage News Daily (daily index), Freddie Mac (weekly survey), Mortgage Bankers Association (weekly survey) and FHFA (monthly survey). REF: MortgageNewsDaily, Today’s Average Rate
The recent spike in the 30-year fixed-rate jumbo mortgage to 6.17%, compared to Freddie Mac’s rate at 6.09% and the Mortgage Bankers Association (MBA) rate at 6.18%, highlights key differences in the mortgage market. Jumbo mortgages, which exceed the conforming loan limits set by government agencies like Freddie Mac, typically carry higher interest rates because they are riskier for lenders. These loans are not backed by government entities, which increases the risk for lenders and, consequently, leads to higher rates. In contrast, Freddie Mac and MBA provide averages for conforming loans, which meet federal guidelines and have lower risk due to government backing, keeping their rates lower.
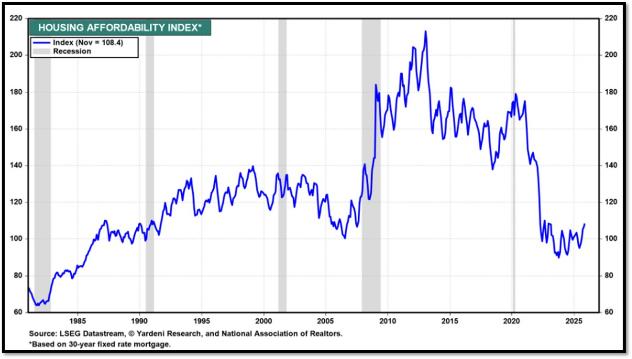
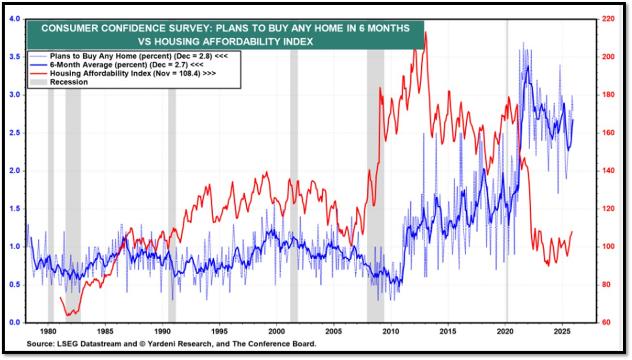
Housing Affordability Index for Nov = 108.4 // Oct = 106.2 // Sep = 104.5 // Aug = 100.5 // July = 98.8 // Jun = 94.4 // May = 97.2 // Apr = 101.0. Data provided by Yardeni Research. REF: Yardeni
5J. Velocity of M2 Money Stock (M2V) with current read at 1.406 as of (Q3-2025 updated December 23, 2025). Previous quarter’s data was 1.392. The velocity of money is the frequency at which one unit of currency is used to purchase domestically- produced goods and services within a given time period. In other words, it is the number of times one dollar is spent to buy goods and services per unit of time. If the velocity of money is increasing, then more transactions are occurring between individuals in an economy. Current Money Stock (M2) report can be viewed in the reference link. REF: St.LouisFed-M2V
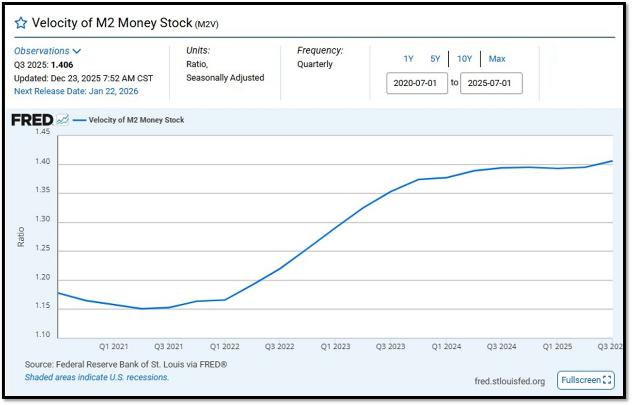
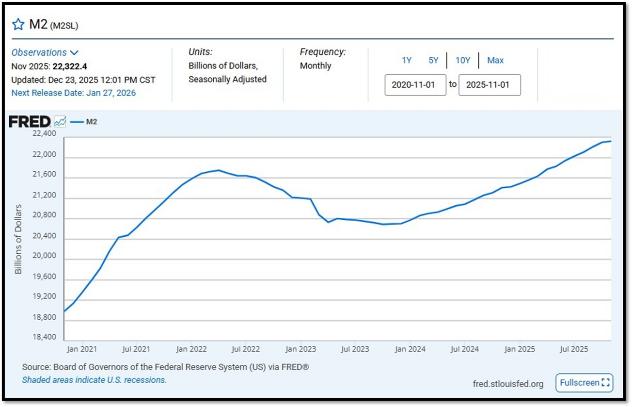
M2 consists of M1 plus (1) small-denomination time deposits (time deposits in amounts of less than $100,000) less IRA and Keogh balances at depository institutions; and (2) balances in retail MMFs less IRA and Keogh balances at MMFs. Seasonally adjusted M2 is constructed by summing savings deposits (before May 2020), small-denomination time deposits, and retail MMFs, each seasonally adjusted separately, and adding this result to seasonally adjusted M1. Board of Governors of the Federal Reserve System (US), M2 [M2SL], retrieved from FRED, Federal Reserve Bank of St. Louis; Updated on November 25, 2025. REF: St.LouisFed-M2
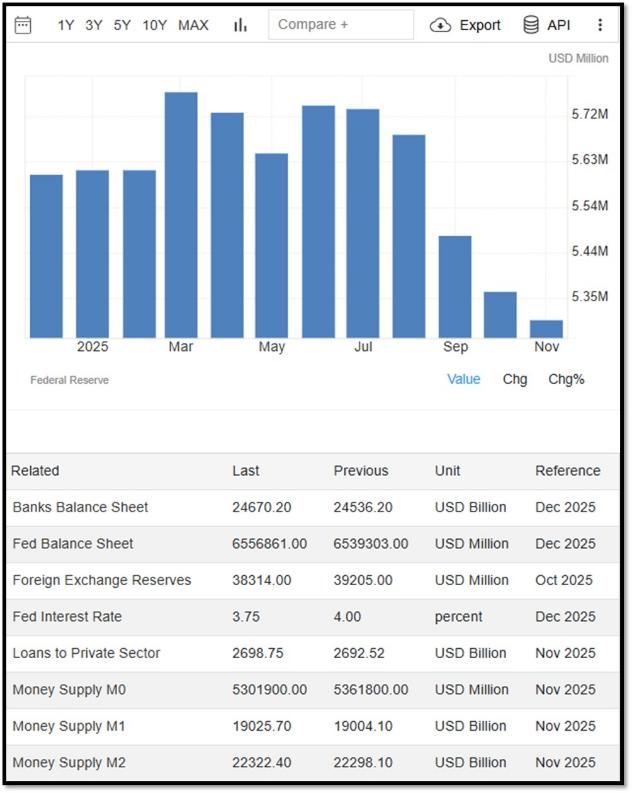
Money Supply M0 in the United States decreased to 5,301,900 USD Million in November from 5,361,800 USD Million in October of 2025. Money Supply M0 in the United States averaged 1,227,132.13 USD Million from 1959 until 2025, reaching an all-time high of 6,413,100.00 USD Million in December of 2021 and a record low of 48,400.00 USD Million in February of 1961.. REF: TradingEconomics, M0
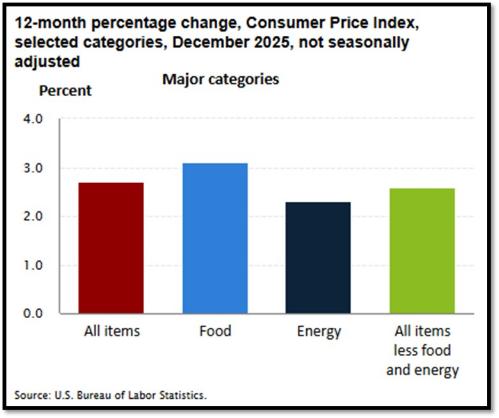
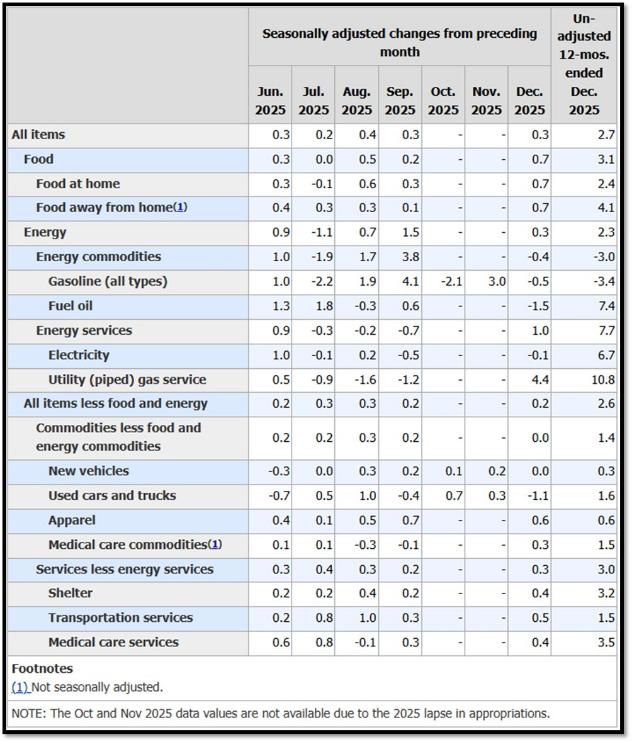
5K. In December, the Consumer Price Index for All Urban Consumers rose 0.3%, seasonally adjusted, and rose 2.7% over the last 12 months, not seasonally adjusted. The index for all items less food and energy increased 0.2% in December (SA); up 2.6% over the year (NSA). January 2026 CPI data are scheduled to be released on February 11, 2026, at 8:30 A.M. Eastern Time.. REF: BLS, BLS.GOV
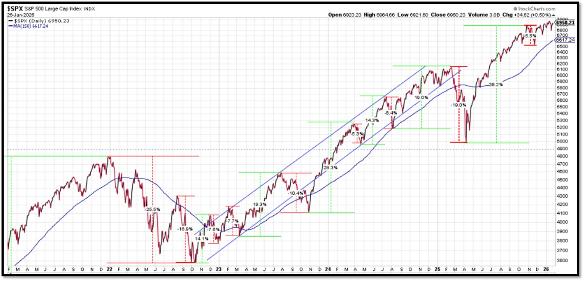
5L. Technical Analysis of the S&P500 Index. Click onto reference links below for images.
- Short-term Chart: Trend Bullish on 1/26/2026 – REF: Short-term S&P500 Chart by Marc Slavin (Click Here to Access Chart)
- Medium-term Chart: Trend Bullish on 1/26/2026 – REF: Medium-term S&P500 Chart by Marc Slavin (Click Here to Access Chart)
- Market Timing Indicators – S&P500 Index as of 1/26/2026 – REF: S&P500 Charts (7 of them) by Joanne Klein’s Top 7 (Click Here to Access Updated Charts)
- The S&P500 is sitting near all-time-high levels, rebounding from two V-shaped recoveries. REF: Stockcharts
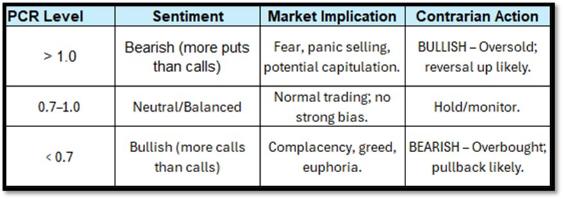
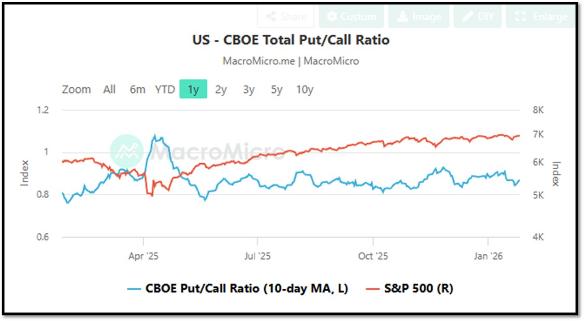
- CBOE Total Put/Call Ratio as of 1/26/2026. REF: MacroMicro
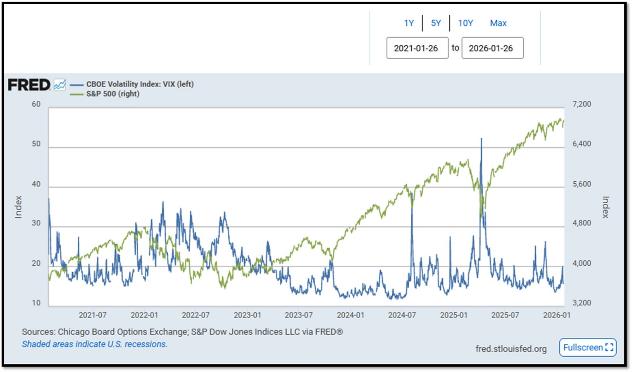
- S&P500 and CBOE Volatility Index (VIX) as of 1/26/2026. REF: FRED, Today’s Print
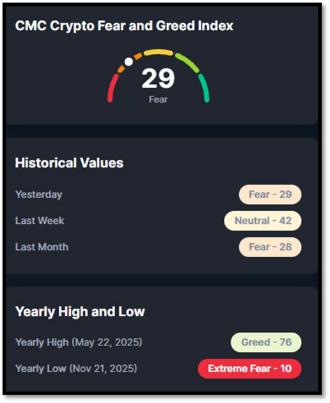
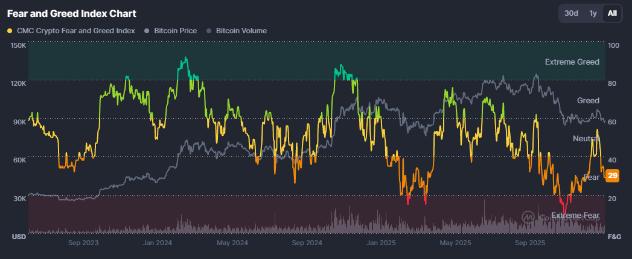
5M. Most recent read on the Crypto Fear & Greed Index with data as of 1/27/2026 is 29 (Fear). Last week’s data was 42 (Neutral) (1-100). Fear & Greed Index – A Contrarian Data. The crypto market behavior is very emotional. People tend to get greedy when the market is rising which results in FOMO (Fear of missing out). Also, people often sell their coins in irrational reaction of seeing red numbers. With the Crypto Fear and Greed Index, the data try to help save investors from their own emotional overreactions. There are two simple assumptions:
- Extreme fear can be a sign that investors are too worried. That could be a buying opportunity.
- When Investors are getting too greedy, that means the market is due for a correction.
Therefore, the program for this index analyzes the current sentiment of the Bitcoin market and crunch the numbers into a simple meter from 0 to 100. Zero means “Extreme Fear”, while 100 means “Extreme Greed”. REF: Coinmarketcap.com, Today’sReading
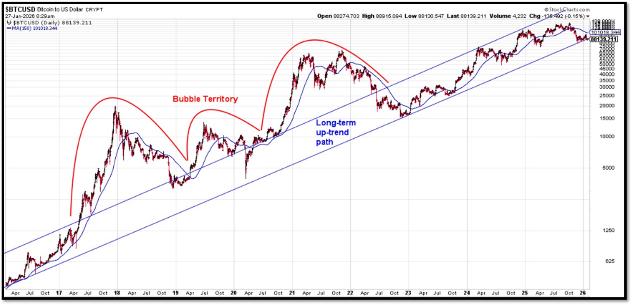
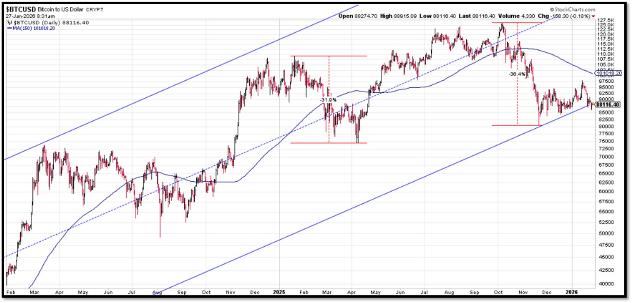
Bitcoin – 10-Year & 2-Year Charts. REF: Stockcharts10Y, Stockcharts2Y
From the desk of our Chief Investment Officer
As an investment professional with over twenty-six years of experience in the financial services industry, Andrew helps clients to protect, grow and transfer wealth during their lifetime with objective, unbiased, customized and efficient strategies.
Education, Professional Licenses Acquired & Affiliations
- Passed the Series 7, 63, 65 and 24 license examinations
- Currently holding Series 65 License
- BA in Economics – Boston University (Boston, MA) 1993
- Certificate in Commodities Trading – New York University (New York, NY) 1991
- Certificate in Financial Planning – New York University (New York, NY) April 2011
With extensive experience in the Financial Services Industry, Andrew Tang and Turner Financial Group provides disciplined wealth management with an intelligent caring approach to each and every client that compliments the Dedicated Financial offering.


Len writes much of his own content, and also shares helpful content from other trusted providers like Turner Financial Group (TFG).
The material contained herein is intended as a general market commentary, solely for informational purposes and is not intended to make an offer or solicitation for the sale or purchase of any securities. Such views are subject to change at any time without notice due to changes in market or economic conditions and may not necessarily come to pass. This information is not intended as a specific offer of investment services by Dedicated Financial and Turner Financial Group, Inc.
Dedicated Financial and Turner Financial Group, Inc., do not provide tax, legal or accounting advice. You should consult your own tax, legal and accounting advisors before engaging in any transaction.
Any hyperlinks in this document that connect to Web Sites maintained by third parties are provided for convenience only. Turner Financial Group, Inc. has not verified the accuracy of any information contained within the links and the provision of such links does not constitute a recommendation or endorsement of the company or the content by Dedicated Financial or Turner Financial Group, Inc. The prices/quotes/statistics referenced herein have been obtained from sources verified to be reliable for their accuracy or completeness and may be subject to change.
Past performance is no guarantee of future returns. Investing involves risk and possible loss of principal capital. The views and strategies described herein may not be suitable for all investors. To the extent referenced herein, real estate, hedge funds, and other private investments can present significant risks, including loss of the original amount invested. All indexes are unmanaged, and an individual cannot invest directly in an index. Index returns do not include fees or expenses.
Turner Financial Group, Inc. is an Investment Adviser registered with the United States Securities and Exchange Commission however, such registration does not imply a certain level of skill or training and no inference to the contrary should be made. Additional information about Turner Financial Group, Inc. is also available at www.adviserinfo.sec.gov. Advisory services are only offered to clients or prospective clients where Turner Financial Group, Inc. and its representatives are properly licensed or exempt from licensure. No advice may be rendered by Turner Financial Group, Inc. unless a client service agreement is in place.


