- 1. Recent economic data indicates strength, with a low unemployment rate and inflation slightly higher than desired but still subdued.
- 2. Tesla (TSLA) is a holding in many of our investment strategies, so I’d like to share my summarized notes and thoughts from their latest earnings call with CEO Elon Musk on January 30, 2025.
- **With the current macro-economic backdrop, below are areas we currently favor:
- 3. ARK Invest’s Big Ideas 2025 is available now and Cathie Wood would like to walk you through the highlights via her video shown below.
- 4. World Watch
- 5. Quant & Technical Corner
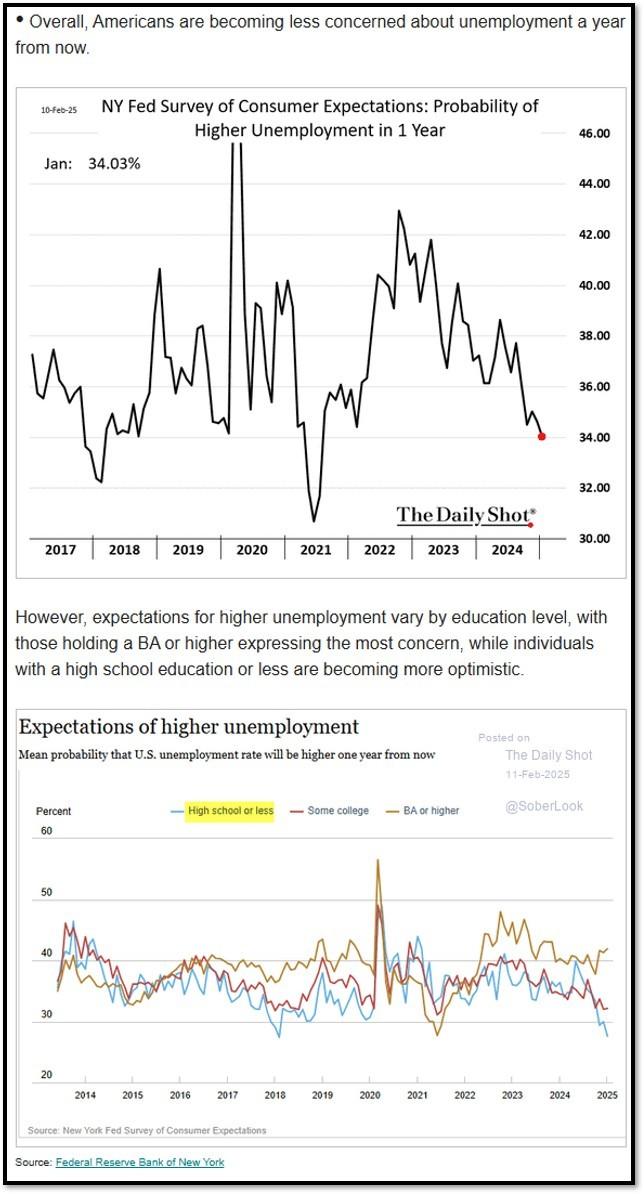
1. Recent economic data indicates strength, with a low unemployment rate and inflation slightly higher than desired but still subdued.
Notably, rent data is showing a significant decline, though it has yet to fully reflect in CPI figures. Federal Reserve Chair Jerome Powell has confirmed there is no urgency to lower interest rates, but a clear path toward a neutral interest rate of 2.5% to 3.5% bodes well for risk assets overall. Below are two charts regarding recent unemployment data. REF: DailyShot
Despite ongoing tariffs and persistent geopolitical tensions, the stock market continues to demonstrate resilience. Technical charts show that the S&P 500 remains within its uptrend. Investor sentiment remains high, helping to offset lower consumer confidence and rising inflation expectations. Additionally, we are currently experiencing a technological and innovation-driven boom, with deflation expected as a natural consequence. This is largely due to ongoing cost reductions driven by advancements in automation, artificial intelligence, and economies of scale. As efficiency improves and technological adoption accelerates, businesses can produce goods and services at lower costs, ultimately exerting downward pressure on prices across various industries.
In the short term, I expect the stock market to continue its upward trend, with intermittent periods of minor consolidations. The economy’s sustained growth and strong investor sentiment support this trajectory. Meanwhile, the bond market is expected to remain stable, underpinned by a clear path toward eventual interest rate cuts.
2. Tesla (TSLA) is a holding in many of our investment strategies, so I’d like to share my summarized notes and thoughts from their latest earnings call with CEO Elon Musk on January 30, 2025.
According to Elon, 2024 was a pivotal year for Tesla, and 2025 will be its most important year yet as the company transitions from being primarily an automaker to an AI-driven company. I believe the market is beginning to recognize the value of Optimus (Tesla’s humanoid robot) and FSD (Full Self-Driving).
Q4 earnings were down, and I see the introduction of the new Model Y as a major factor. Inventory of the older Model Y must be kept low, and Tesla is intentionally keeping the release of the new Model Y quiet. Most consumers are already aware of the upcoming model and are choosing to wait for the new release. However, the March 2025 delivery timeline for the new Model Y is impressive. Like many of Elon’s promises, it was delivered—albeit later than expected.
That said, Tesla remains the only company actively building a production line for humanoid robots. While some companies discuss their robots or the AI powering them, Tesla is doing both at the same time with real production. Optimus Version 2 is expected next year, and Elon noted that it will take several iterations for Optimus to reach peak performance. I expect to see commercial use of Optimus, then a transition to home use at a later stage.
Over the years, Tesla has become one of the greatest—if not the greatest—companies in large-scale manufacturing. This next phase of expansion will be the largest production ramp in history. Additionally, Tesla has plans to produce LFP battery cells in the U.S. at a lower cost structure than what would have been possible with pre-tariff imports from China. A patent for this new manufacturing method was filed several weeks ago, and I believe it will be a significant development. REF: Tesla
IMPORTANT NOTE: Not investment advice. Please speak to your financial professional regarding your investments and investing. Investor should consider the investment objective, risks, charges and expenses carefully before investing. For more information about the company mentioned above, please visit https://ir.tesla.com/#quarterly-disclosure.

**With the current macro-economic backdrop, below are areas we currently favor:
- Fixed Income – Short-term Corporates (Low-Beta)
- Fixed Income – Corporates High Yield as Opportunistic Allocation (Low-Beta)
- Businesses that contribute to and benefit from AI & Automation (Market-Risk)
- Financials (Market-Risk)
- Industrials (Market-Risk)
- Small Cap & Mid Cap Stocks (Market-Risk)
- Biotechnology (Market-Risk)
- Gold & Digital Asset – Bitcoin (Market-Risk/Hedge)
3. ARK Invest’s Big Ideas 2025 is available now and Cathie Wood would like to walk you through the highlights via her video shown below.
This annual publication highlights transformative technologies and their potential economic impacts. The summarized topics include:
- AI Agents – AI Coders…
- Multiomic Sequencing – Cost of curing diseases is collapsing…
- Robotaxis – Expect Cybercabs in Austin, TX by June…
- Robotics – Humanoid robots are upon us…
- Digital Assets – Bitcoin – Bull Case & Base Case…
- Accelerated Global Economic Growth…
Click onto picture below to access video. Download Big Ideas 2025 here: ark-invest.com/big-ideas-2025
4. World Watch
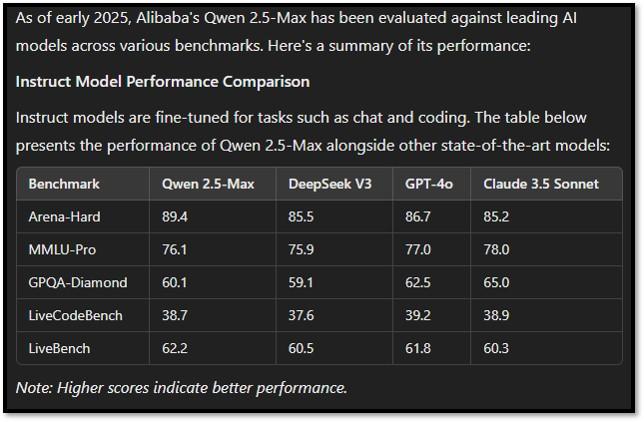
4A. Qwen: Alibaba’s Open-Source Challenger in the AI Race – Qwen, developed by Alibaba Cloud, is a cutting-edge open-source large language model (LLM) that is part of the Tongyi Qianwen AI series. Designed to compete with major models like OpenAI’s GPT-4, Meta’s LLaMA, and Google’s Gemini, Qwen 2.5 stands out for its strong multilingual capabilities, particularly in Chinese-language tasks, and its accessibility for developers.
One of Qwen’s key advantages is its open-source nature, allowing businesses and researchers to fine-tune and deploy it with greater flexibility compared to proprietary models like GPT-4. It also supports multiple model sizes (e.g., Qwen-7B, Qwen-14B), catering to different levels of computational power, making it more accessible than some high-resource-demanding models. Additionally, Qwen integrates seamlessly with Alibaba Cloud services, providing enterprise solutions across various industries. In comparison to GPT-4, Qwen is more customizable but may not yet match GPT-4’s overall reasoning and contextual understanding. Against LLaMA, Qwen offers a stronger emphasis on Chinese-language processing, giving it an edge in markets requiring deep linguistic and cultural understanding. Meanwhile, compared to Google’s Gemini, which focuses on multimodal capabilities, Qwen’s current versions are primarily text-based, though future iterations may expand on this. As the AI landscape evolves, Qwen represents a major step in China’s pursuit of AI independence, offering an open and adaptable alternative to Western models while addressing local language and market needs. Its continued development will determine its role in the global LLM ecosystem. Click onto picture below to access video. REF: AlibabaCloud, Bloomberg, Qwen
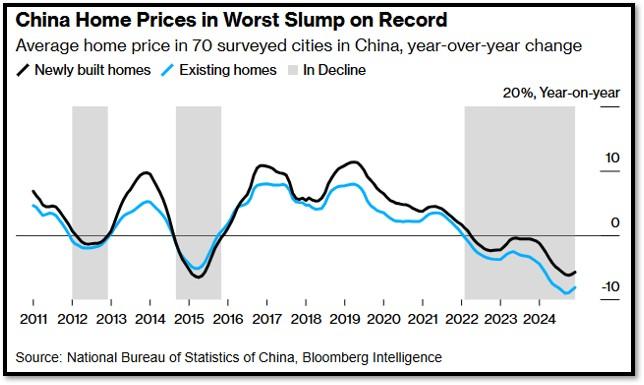
4B. China’s real estate crisis has escalated to a critical stage, forcing authorities into their first major mainland rescue efforts. The financial distress has spread beyond struggling developers to once-stable firms, signaling deep structural issues within the sector. At the heart of the crisis is the growing pressure on Chinese authorities to stabilize the housing market amid weakening investor confidence. The government’s intervention, which marks a shift from its previous hands-off approach, highlights the severity of liquidity problems faced by developers. A key example is the financial turmoil surrounding Hong Kong-based developer New World Development, whose bonds have plummeted into distress territory. This deterioration underscores broader concerns that even historically resilient firms are now vulnerable.
The crisis stems from years of over-leverage, slowing demand, and tighter regulatory measures aimed at curbing speculative borrowing. As the property sector accounts for a significant portion of China’s economy, its decline poses systemic risks, threatening banks, local governments, and consumer confidence. Without effective intervention, the crisis could deepen, leading to ripple effects in both domestic and global financial markets. Click onto picture below to access video summarizing the problem (from 2024). REF: Bloomberg

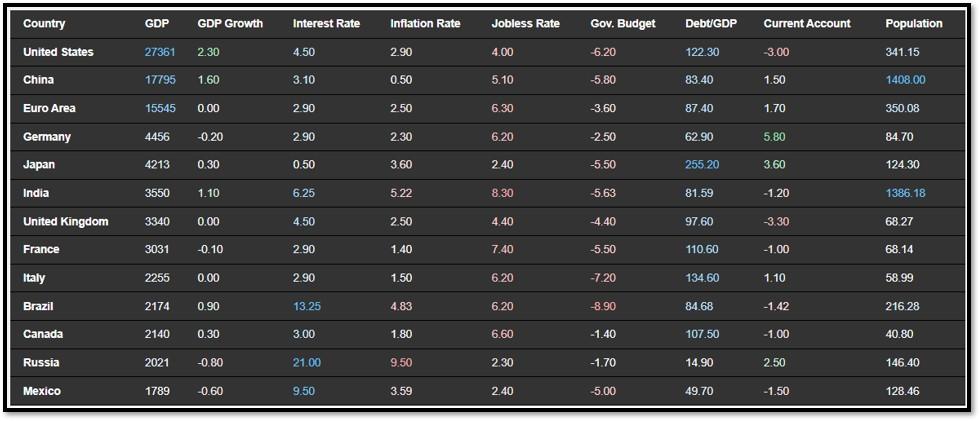
4C. Below is an updated snapshot of the current global state of economy according to TradingEconomics as of 2/10/2025. REF: TradingEconomics
- China’s annual inflation rate climbed to 0.5% in January 2025 from 0.1% in December, surpassing market expectations of 0.4%.
- The Reserve Bank of India unanimously lowered its key repo rate by 25 basis points to 6.25% during its February meeting, marking the first reduction since May 2020 and aligning with market consensus.
- The Bank of England cut its benchmark Bank Rate by 25bps to 4.5% in its February 2025 decision, as expected, to mark the third rate cut since the start of its cutting cycle in August of last year.
- The unemployment rate in Canada fell to 6.6% in January of 2025 from 6.7% in the previous month, the lowest in three months, and contrasting with market expectations that it would have risen to 6.8%.
5. Quant & Technical Corner
Below is a selection of quantitative & technical data we monitor on a regular basis to help gauge the overall financial market conditions and the investment environment.
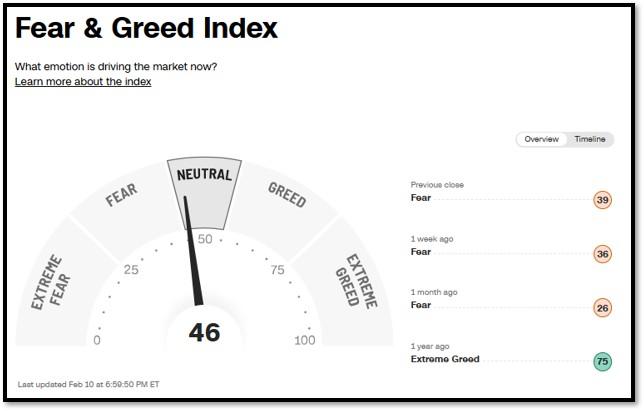
5A. Most recent read on the Fear & Greed Index with data as of 2/10/2025 – 6:59PM-ET is 46 (Neutral). Last week’s data was 36 (Fear) (1-100). CNNMoney’s Fear & Greed index looks at 7 indicators (Stock Price Momentum, Stock Price Strength, Stock Price Breadth, Put and Call Options, Junk Bond Demand, Market Volatility, and Safe Haven Demand). Keep in mind this is a contrarian indicator! REF: Fear&Greed via CNNMoney

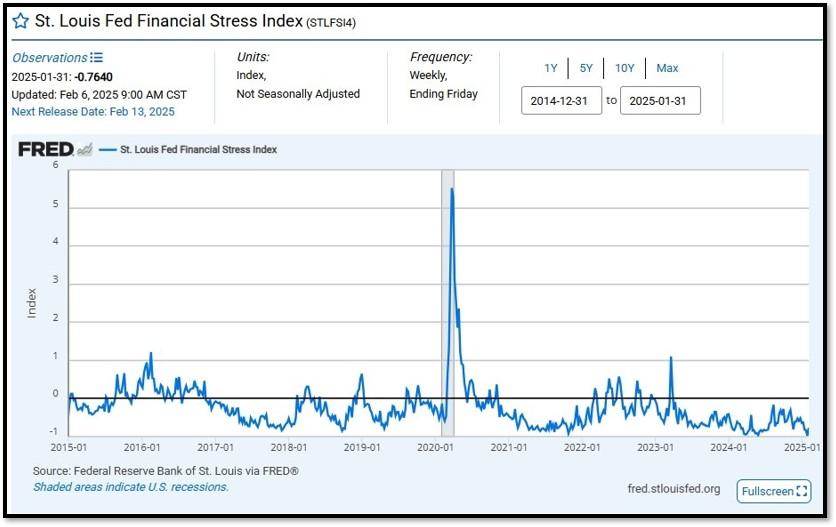
5B. St. Louis Fed Financial Stress Index’s (STLFSI4) most recent read is at –0.7640 as of February 13, 2025. A big spike up from previous readings reflecting the recent turmoil in the banking sector. Previous week’s data was -0.9762. This weekly index is not seasonally adjusted. The STLFSI4 measures the degree of financial stress in the markets and is constructed from 18 weekly data series: seven interest rate series, six yield spreads and five other indicators. Each of these variables captures some aspect of financial stress. Accordingly, as the level of financial stress in the economy changes, the data series are likely to move together. REF: St. Louis Fed
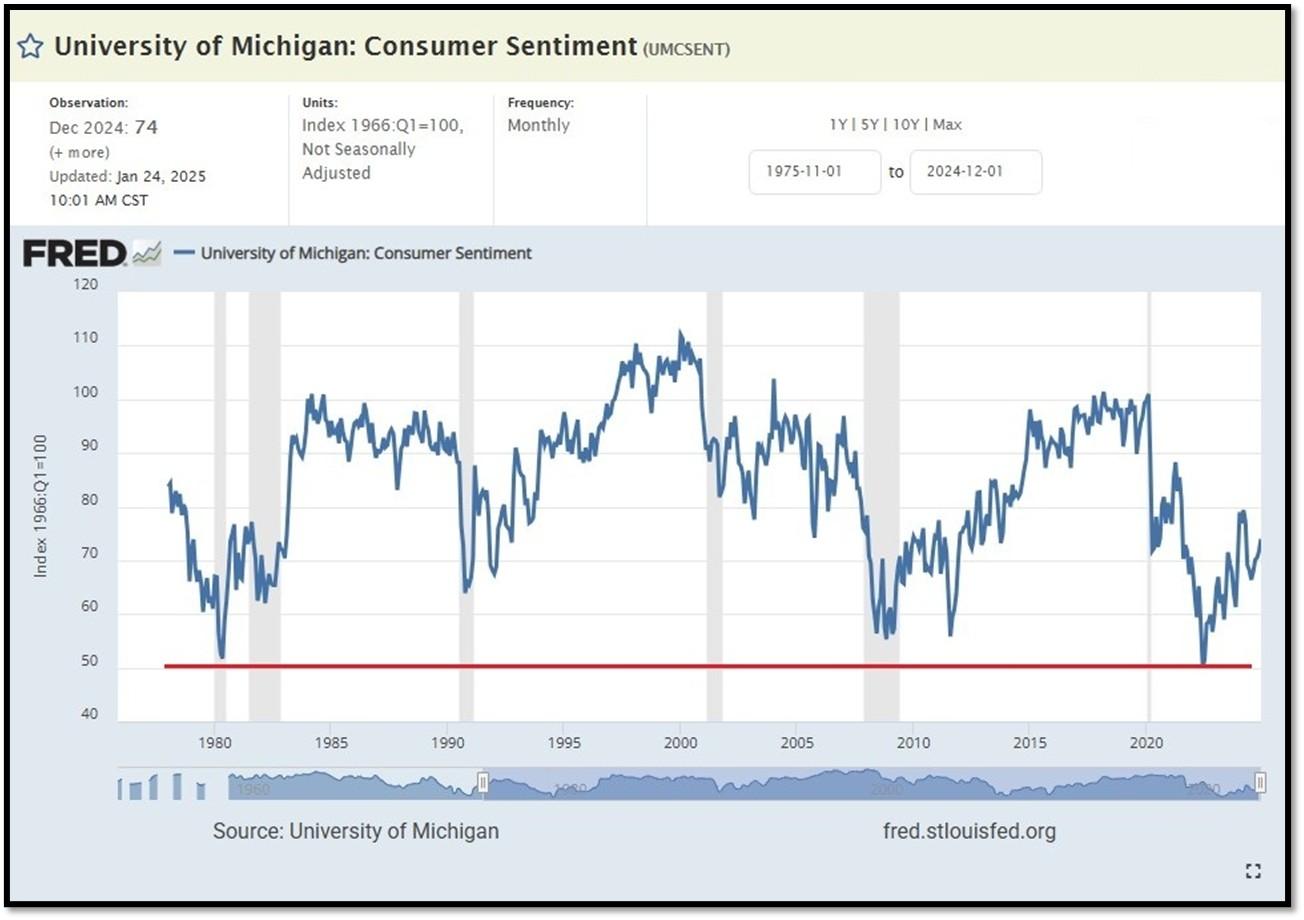
5C. University of Michigan, University of Michigan: Consumer Sentiment for September [UMCSENT] at 74, retrieved from FRED, Federal Reserve Bank of St. Louis, January 24, 2025. Back in June 2022, Consumer Sentiment hit a low point going back to April 1980. REF: UofM
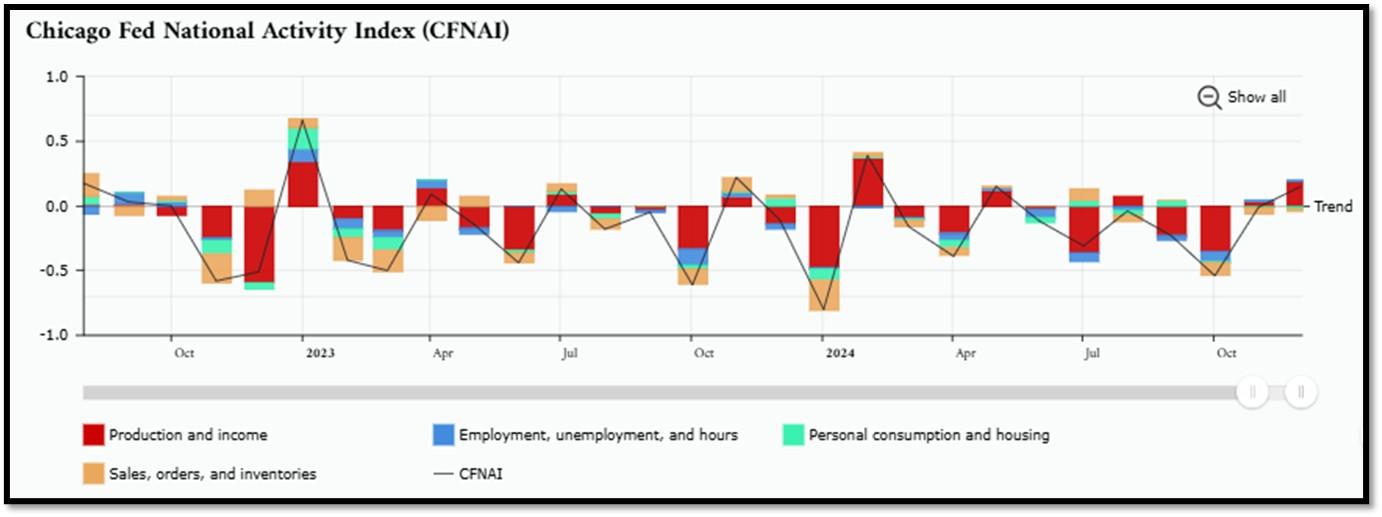
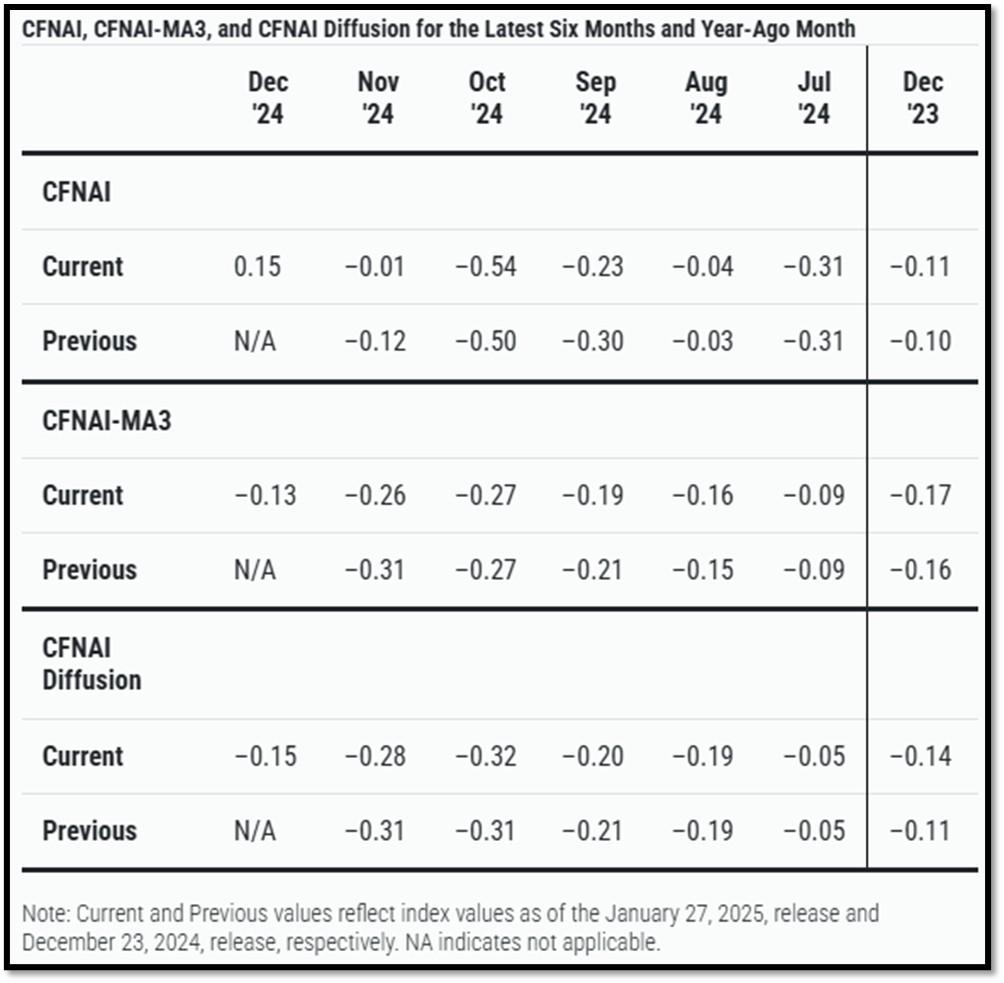
5D. The Chicago Fed National Activity Index (CFNAI) increased to +0.15 in December from –0.01 in November. Two of the four broad categories of indicators used to construct the index increased from November, and two categories made positive contributions in December. The index’s three-month moving average, CFNAI-MA3, increased to –0.13 in December from –0.26 in November. REF: ChicagoFed, December’s Report
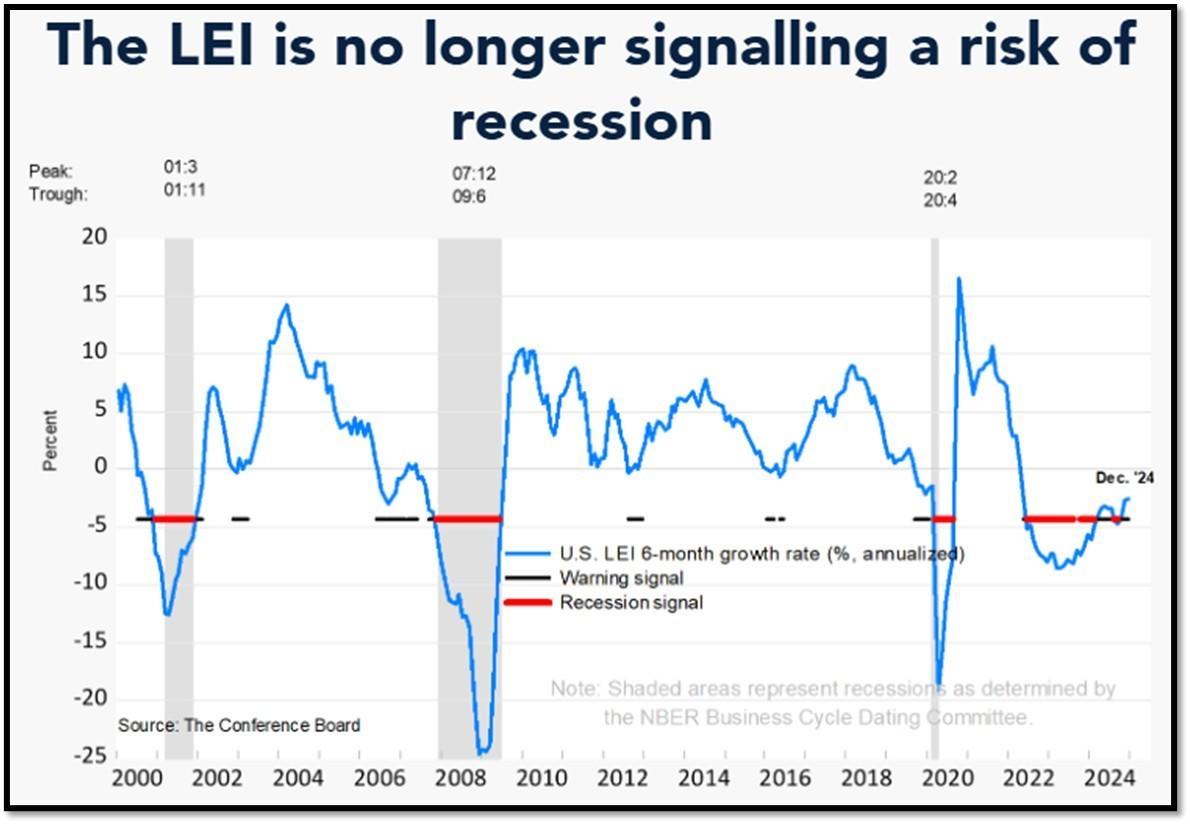
5E. (1/22/2025) The Conference Board Leading Economic Index (LEI) for the US inched down by 0.1% in December 2024 to 101.6 (2016=100), after an upwardly revised increase of 0.4% in November. The LEI declined by 1.3% over the second half of 2024, slightly less than its 1.7% decline over the first half of the last year. The composite economic indexes are the key elements in an analytic system designed to signal peaks and troughs in the business cycle. The indexes are constructed to summarize and reveal common turning points in the economy in a clearer and more convincing manner than any individual component. The CEI is highly correlated with real GDP. The LEI is a predictive variable that anticipates (or “leads”) turning points in the business cycle by around 7 months. Shaded areas denote recession periods or economic contractions. The dates above the shaded areas show the chronology of peaks and troughs in the business cycle. The ten components of The Conference Board Leading Economic Index® for the U.S. include: Average weekly hours in manufacturing; Average weekly initial claims for unemployment insurance; Manufacturers’ new orders for consumer goods and materials; ISM® Index of New Orders; Manufacturers’ new orders for nondefense capital goods excluding aircraft orders; Building permits for new private housing units; S&P 500® Index of Stock Prices; Leading Credit Index™; Interest rate spread (10-year Treasury bonds less federal funds rate); Average consumer expectations for business conditions. REF: ConferenceBoard, LEI Report for December (Released on 2/1/2025)
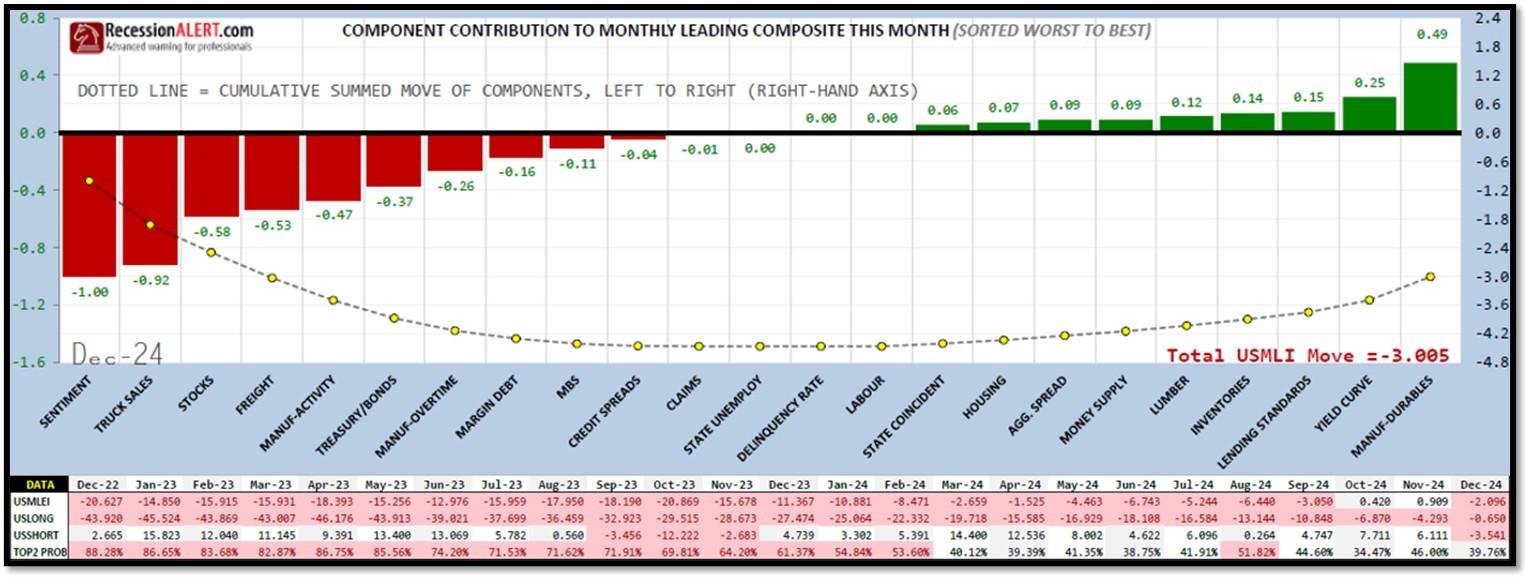
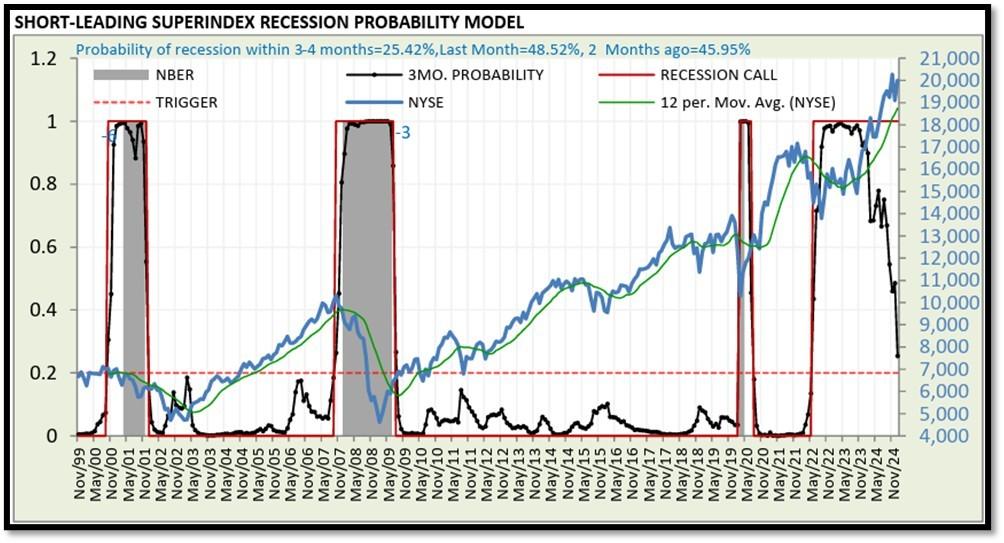
5F. Probability of U.S. falling into Recession within 3 to 4 months is currently at 25.42% (with data as of 01/26/2025 – Next Report 02/10/2025) according to RecessionAlert Research. Last release’s data was at 58.9%. This report is updated every two weeks. REF: RecessionAlertResearch
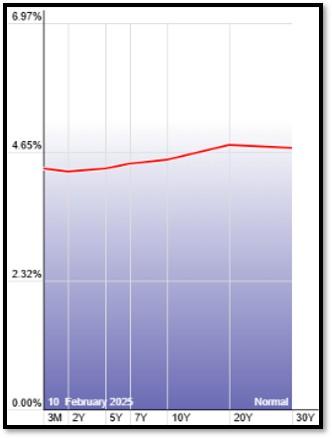
5G. Yield Curve as of 2/10/2025 is showing Normal. Spread on the 10-yr Treasury Yield (4.50%) minus yield on the 2-yr Treasury Yield (4.27%) is currently at 23 bps. REF: Stockcharts The yield curve—specifically, the spread between the interest rates on the ten-year Treasury note and the three-month Treasury bill—is a valuable forecasting tool. It is simple to use and significantly outperforms other financial and macroeconomic indicators in predicting recessions two to six quarters ahead. REF: NYFED
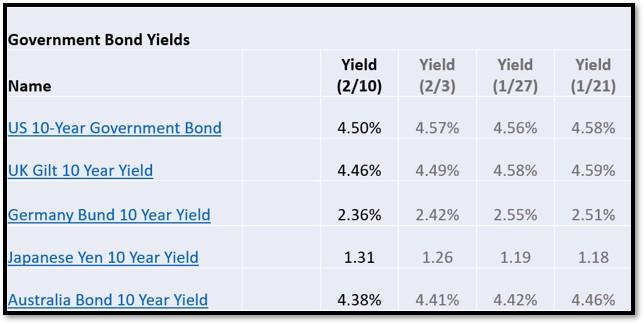
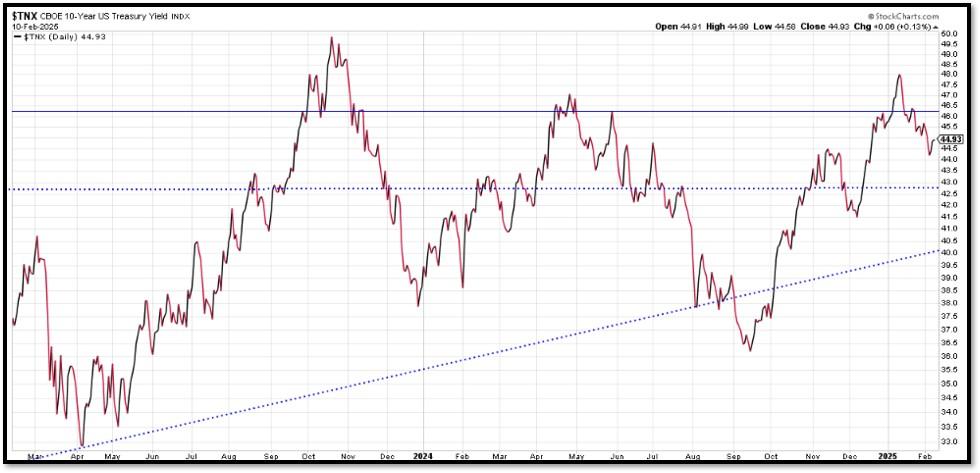
5H. Recent Yields in 10-Year Government Bonds. REF: Source is from Bloomberg.com, dated 2/10/2025, rates shown below are as of 2/10/2025, subject to change.
The 10-Year US Treasury Yield… REF: StockCharts1, StockCharts2
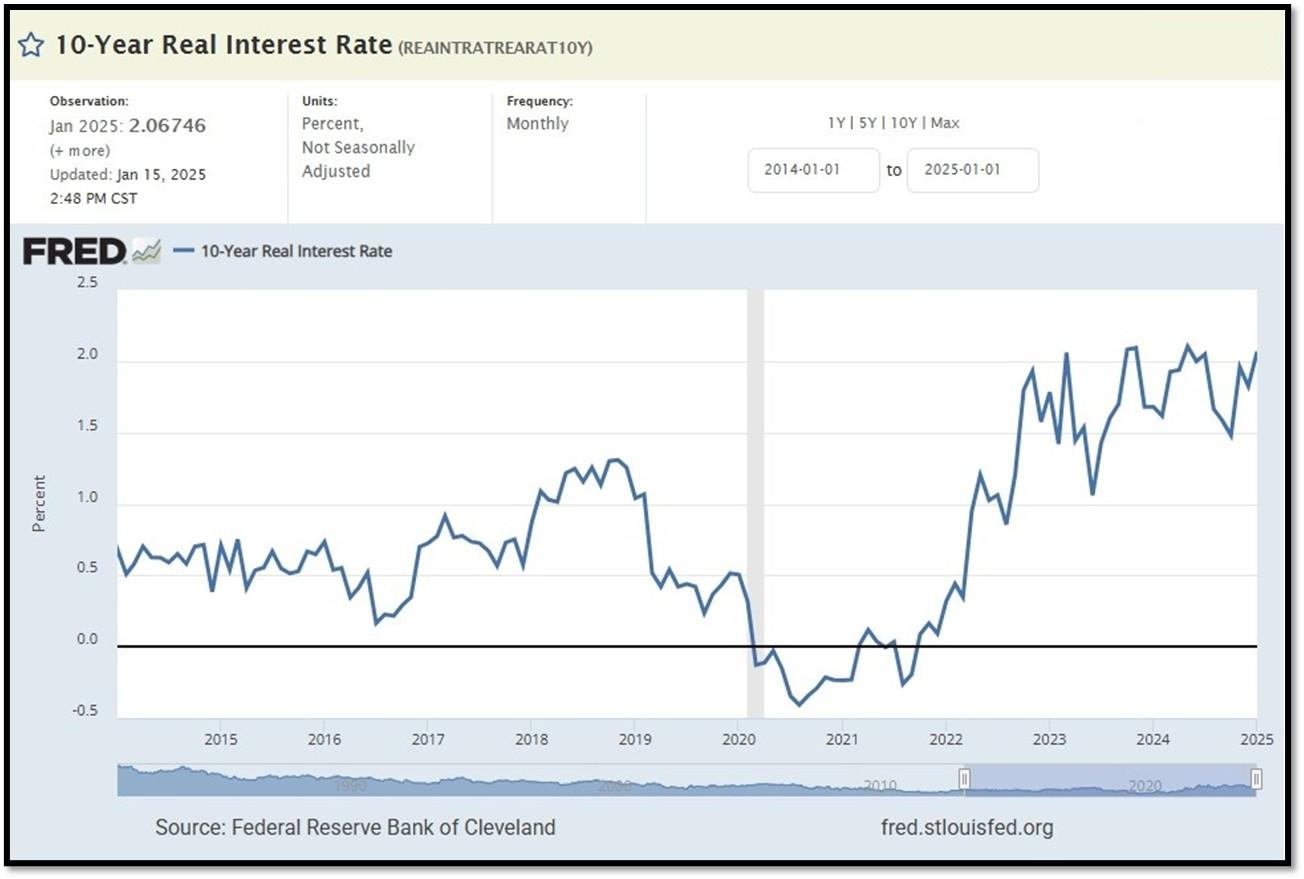
10-Year Real Interest Rate at 2.0674% as of 1/15/25. REF: REAINTRATREARAT10Y
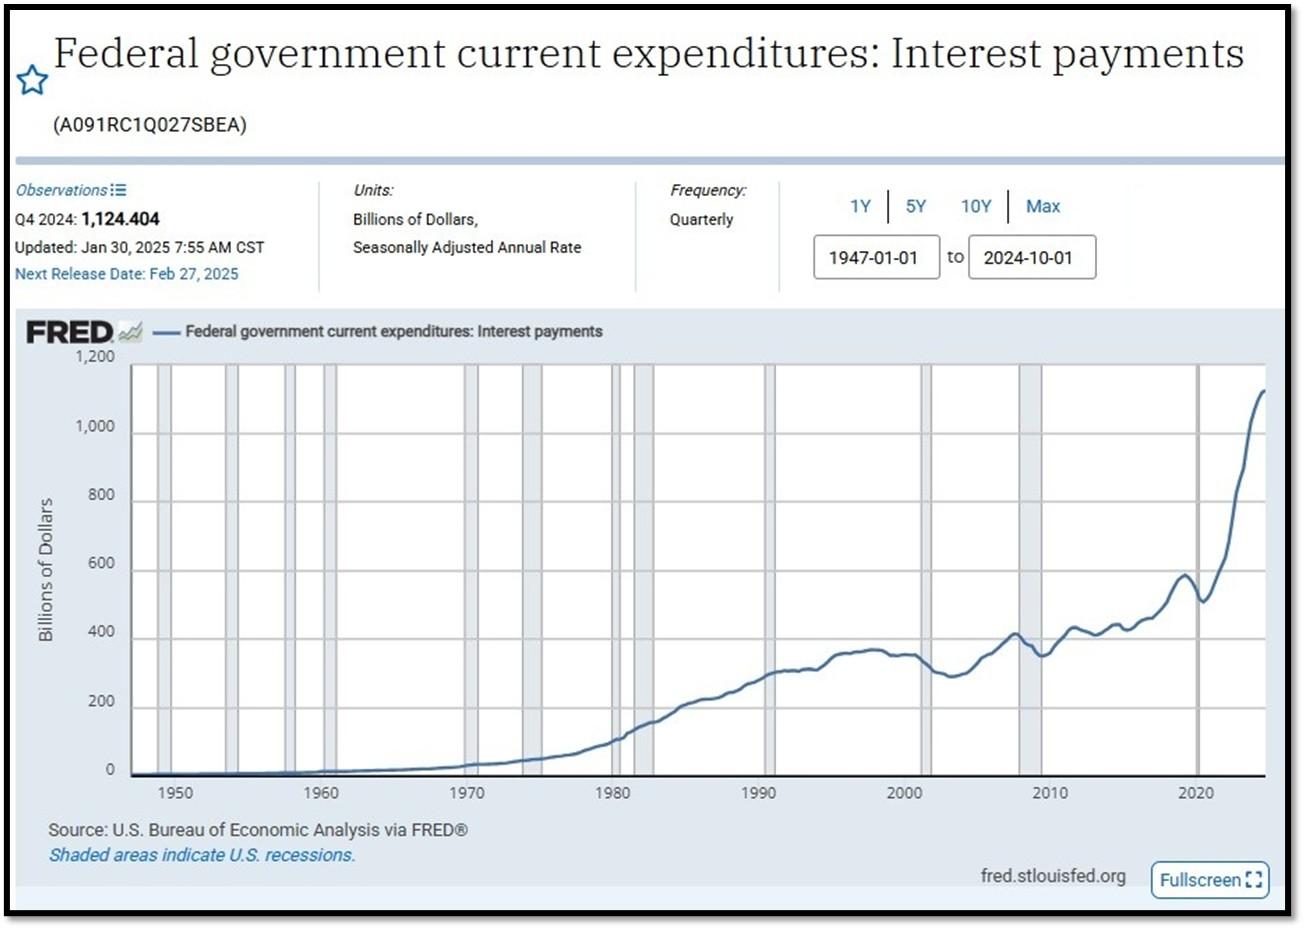
Federal government Interest Payments increased $8B+ to $1.124 Trillion as of Q4-2024. REF: FRED-A091RC1Q027SBEA
Interest payments as a percentage of GDP increased from 2.37794 in 2023 to 3.02152 as of 1/30/25. REF: FRED-FYOIGDA188S

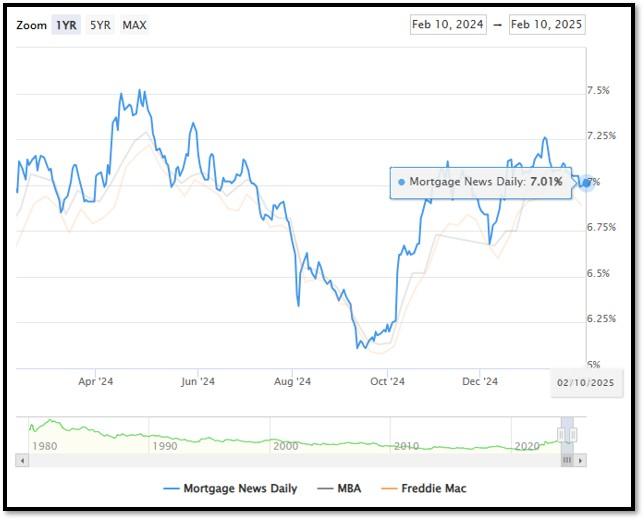
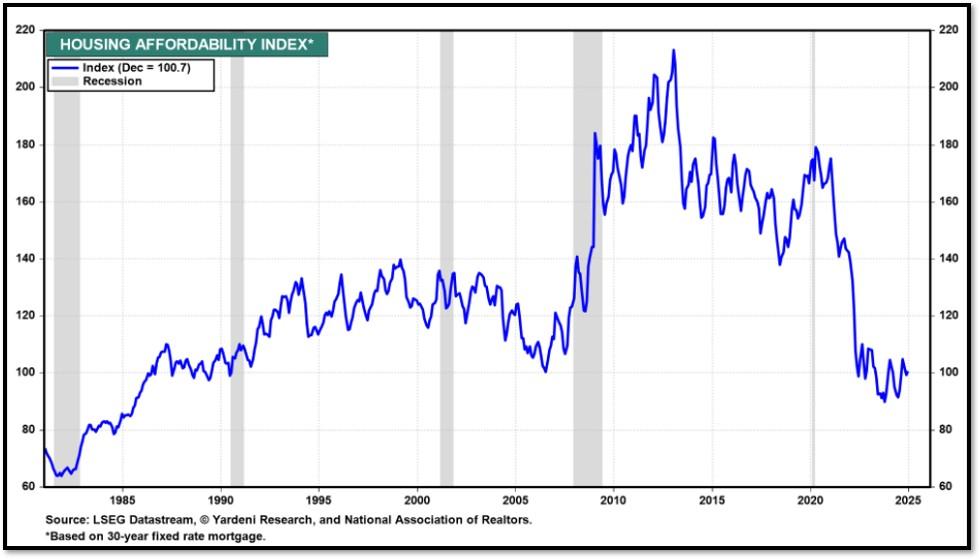
5I. (2/10/2025) Today’s National Average 30-Year Fixed Mortgage Rate is 7.01% (All Time High was 8.03% on 10/19/23). Last week’s data was 7.05%. This rate is the average 30-year fixed mortgage rates from several different surveys including Mortgage News Daily (daily index), Freddie Mac (weekly survey), Mortgage Bankers Association (weekly survey) and FHFA (monthly survey). REF: MortgageNewsDaily, Today’s Average Rate
The recent spike in the 30-year fixed-rate jumbo mortgage to 7.01%, compared to Freddie Mac’s rate at 6.89% and the Mortgage Bankers Association (MBA) rate at 7.02%, highlights key differences in the mortgage market. Jumbo mortgages, which exceed the conforming loan limits set by government agencies like Freddie Mac, typically carry higher interest rates because they are riskier for lenders. These loans are not backed by government entities, which increases the risk for lenders and, consequently, leads to higher rates. In contrast, Freddie Mac and MBA provide averages for conforming loans, which meet federal guidelines and have lower risk due to government backing, keeping their rates lower.
(2/10/25) Housing Affordability Index for Dec = 100.7 // Nov = 99 // Oct = 102.3 // Sep = 105.5 // Aug = 98.6 // July = 95 // June = 93.3 // May = 93.1 // April = 95.9 // March = 101.1 // February = 103.0. Data provided by Yardeni Research. REF: Yardeni
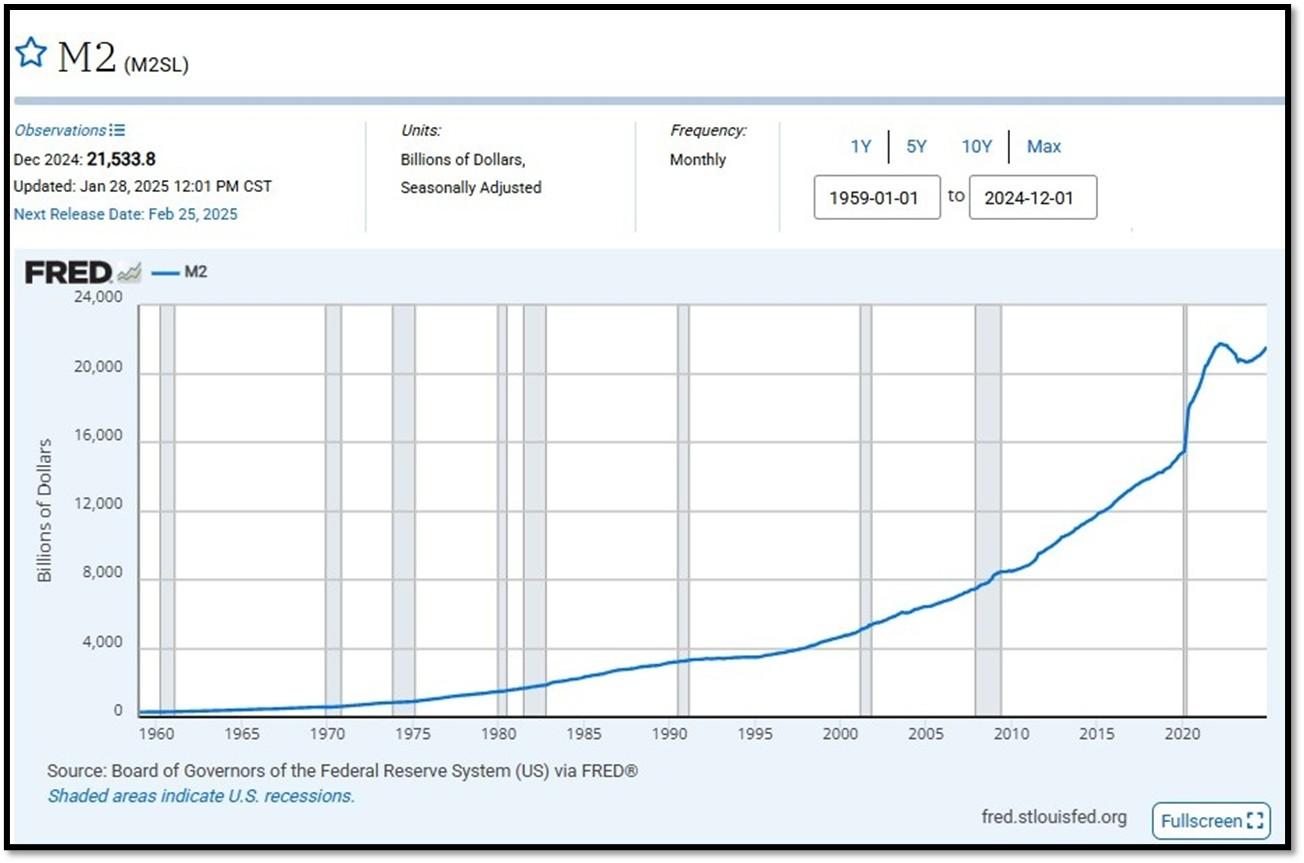
5J. Velocity of M2 Money Stock (M2V) with current read at 1.386 as of (Q4-2024 updated 1/30/2025). Previous quarter’s data was 1.390. The velocity of money is the frequency at which one unit of currency is used to purchase domestically- produced goods and services within a given time period. In other words, it is the number of times one dollar is spent to buy goods and services per unit of time. If the velocity of money is increasing, then more transactions are occurring between individuals in an economy. Current Money Stock (M2) report can be viewed in the reference link. REF: St.LouisFed-M2V

M2 consists of M1 plus (1) small-denomination time deposits (time deposits in amounts of less than $100,000) less IRA and Keogh balances at depository institutions; and (2) balances in retail MMFs less IRA and Keogh balances at MMFs. Seasonally adjusted M2 is constructed by summing savings deposits (before May 2020), small-denomination time deposits, and retail MMFs, each seasonally adjusted separately, and adding this result to seasonally adjusted M1. Board of Governors of the Federal Reserve System (US), M2 [M2SL], retrieved from FRED, Federal Reserve Bank of St. Louis; Updated on January 28, 2025. REF: St.LouisFed-M2
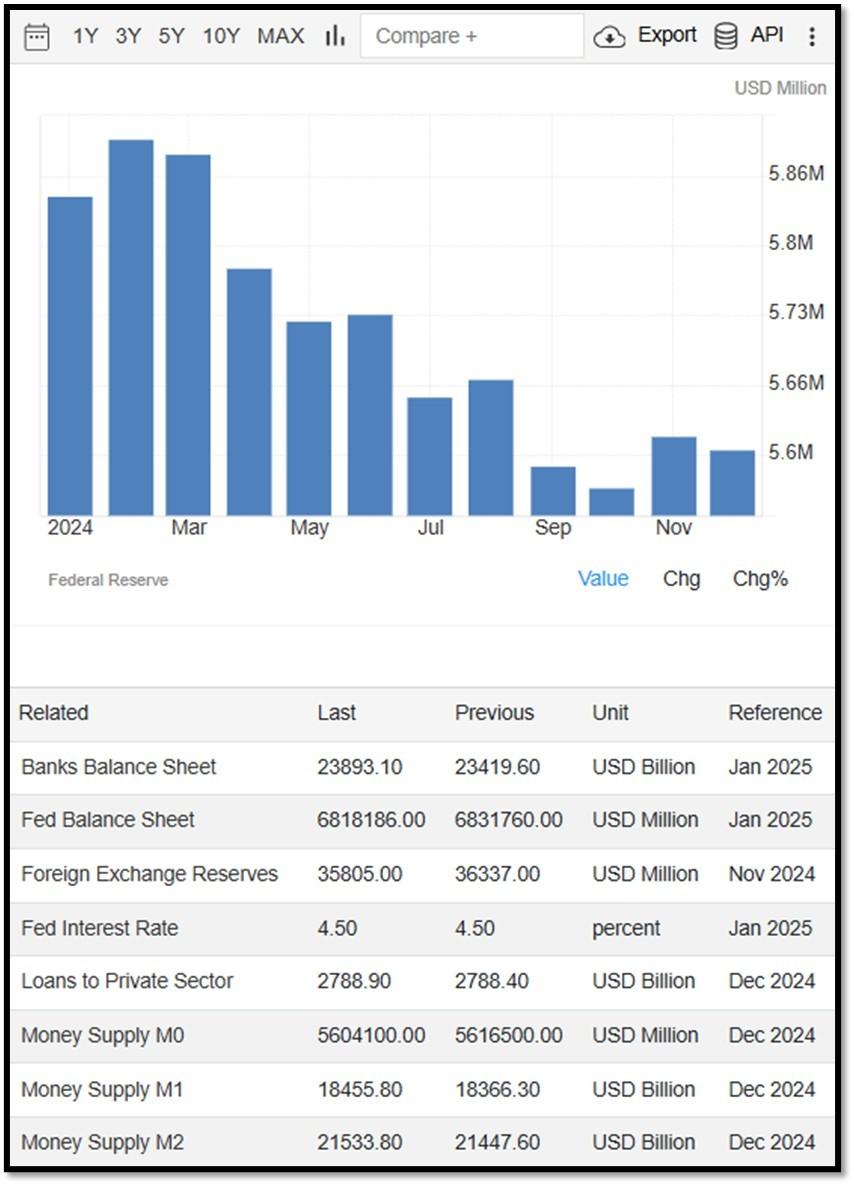
Money Supply M0 in the United States decreased to 5,604,100 USD Million in December from 5,616,500 USD Million in November of 2024. Money Supply M0 in the United States averaged 1,166,283.21 USD Million from 1959 until 2024, reaching an all-time high of 6,413,100.00 USD Million in December of 2021 and a record low of 48,400.00 USD Million in February of 1961. REF: TradingEconomics, M0
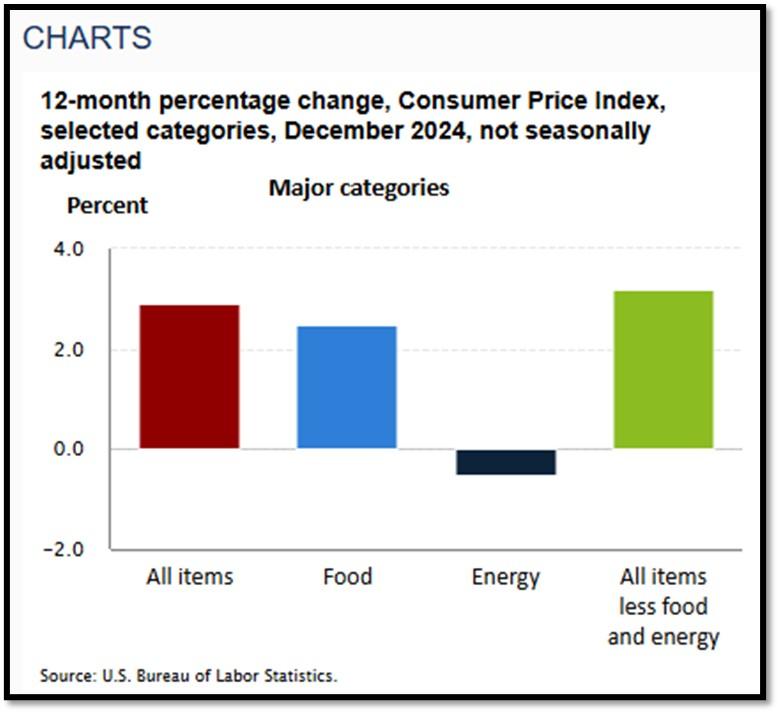
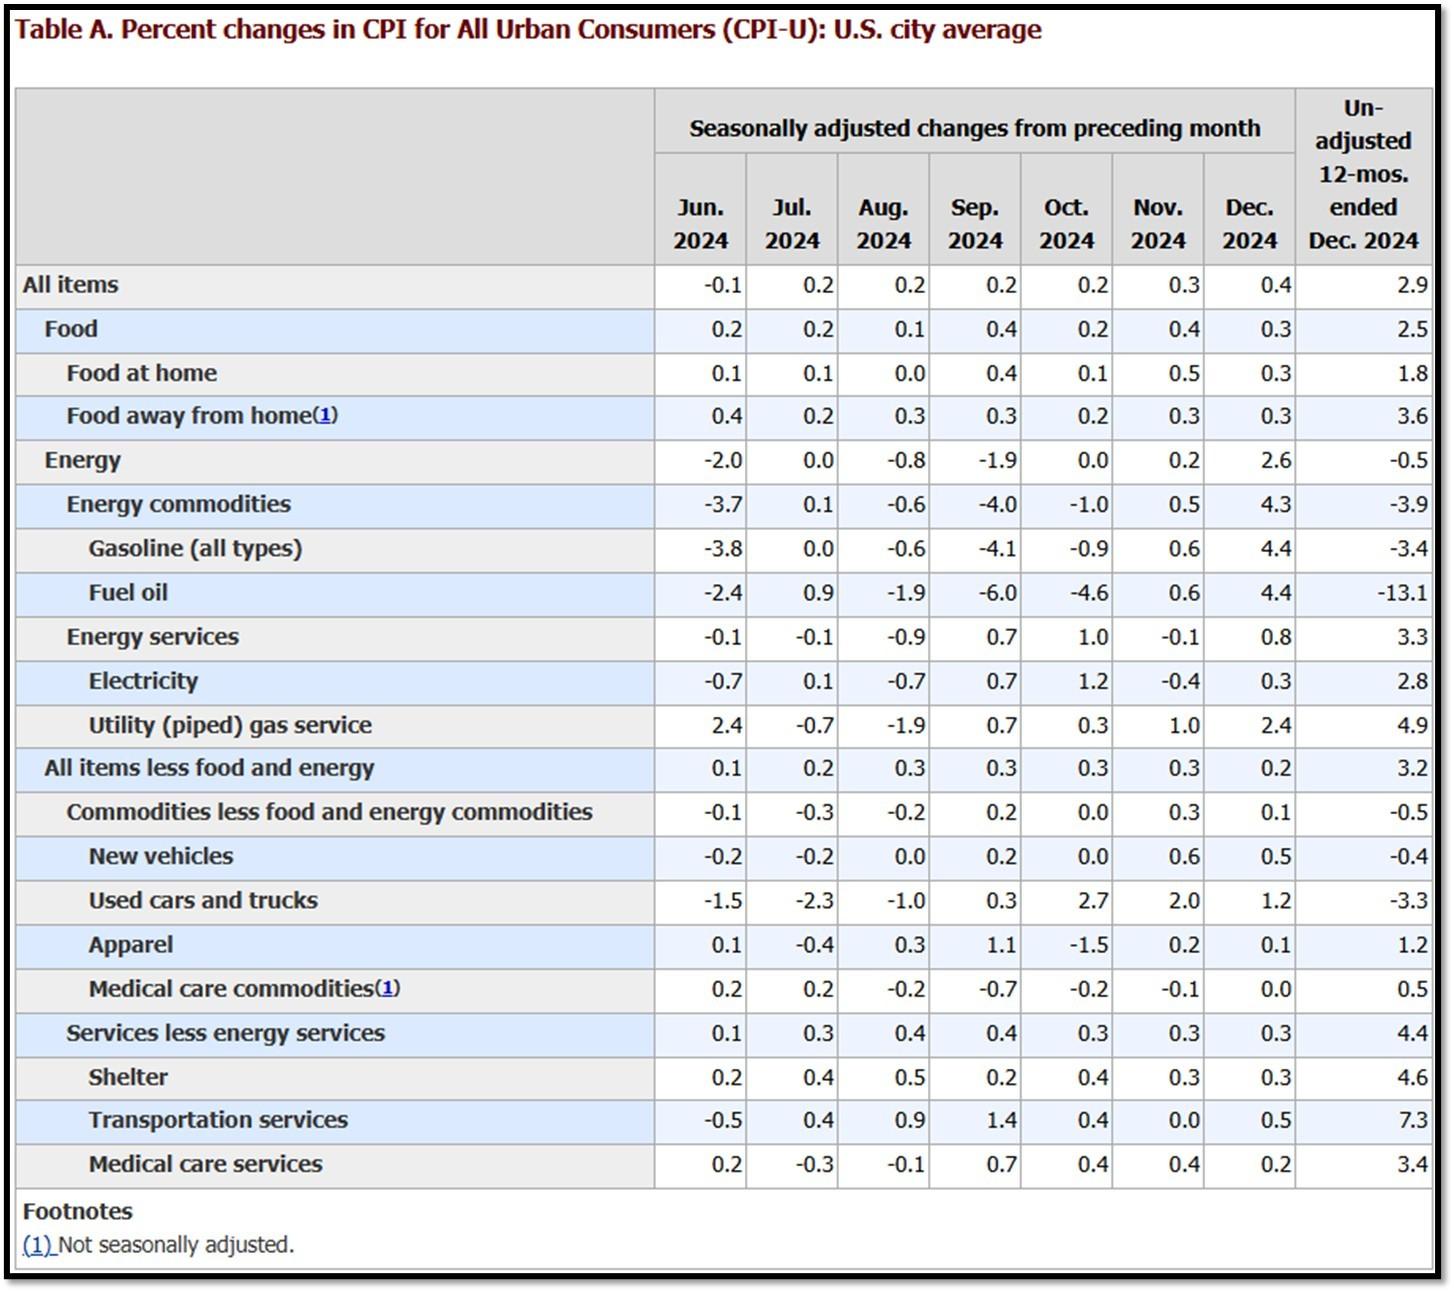
5K. In December, the Consumer Price Index for All Urban Consumers rose 0.4 percent, seasonally adjusted, and rose 2.9 percent over the last 12 months, not seasonally adjusted. The index for all items less food and energy increased 0.2 percent in December (SA); up 3.2 percent over the year (NSA). January 2025 CPI data are scheduled to be released on February 12, 2025, at 8:30AM-ET. REF: BLS, BLS.GOV
5L. Technical Analysis of the S&P500 Index. Click onto reference links below for images.
- Short-term Chart: Neutral on 2/10/2025 – REF: Short-term S&P500 Chart by Marc Slavin (Click Here to Access Chart)
- Medium-term Chart: Bullish on 2/10/2025 – REF: Medium-term S&P500 Chart by Marc Slavin (Click Here to Access Chart)
- Market Timing Indicators – S&P500 Index as of 2/10/2025 – REF: S&P500 Charts (7 of them) by Joanne Klein’s Top 7 (Click Here to Access Updated Charts)
- A well-defined uptrend channel shown in green with S&P500 still on up trend. REF: Stockcharts
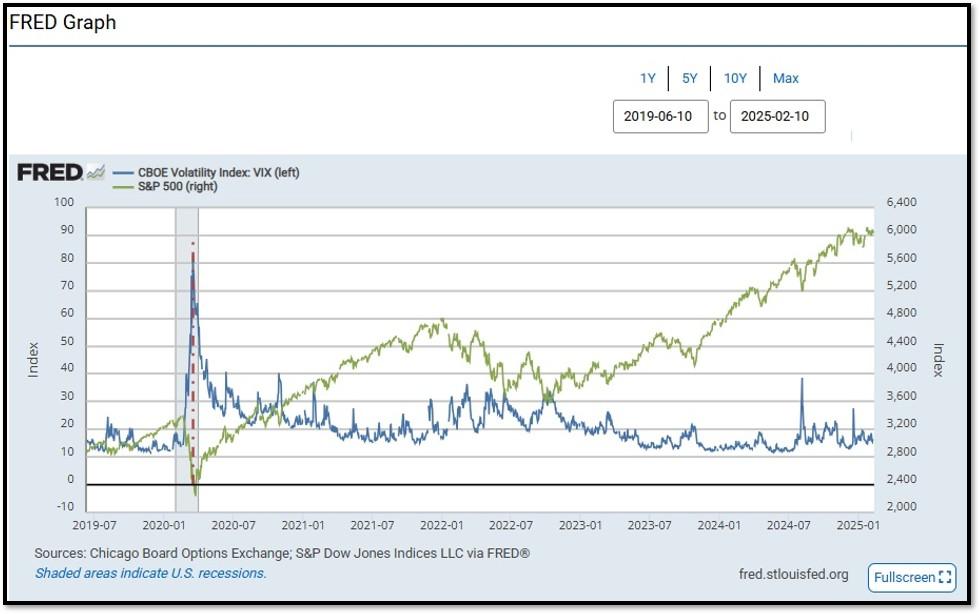
- S&P500 and CBOE Volatility Index (VIX) as of 2/10/2025. REF: FRED, Today’s Print
5M. Most recent read on the Crypto Fear & Greed Index with data as of 2/11/2025au is 47 (Neutral). Last week’s data was 72 (Greed) (1-100). Fear & Greed Index – A Contrarian Data. The crypto market behavior is very emotional. People tend to get greedy when the market is rising which results in FOMO (Fear of missing out). Also, people often sell their coins in irrational reaction of seeing red numbers. With the Crypto Fear and Greed Index, the data try to help save investors from their own emotional overreactions. There are two simple assumptions:
- Extreme fear can be a sign that investors are too worried. That could be a buying opportunity.
- When Investors are getting too greedy, that means the market is due for a correction.
Therefore, the program for this index analyzes the current sentiment of the Bitcoin market and crunch the numbers into a simple meter from 0 to 100. Zero means “Extreme Fear”, while 100 means “Extreme Greed”. REF: Alternative.me, Today’sReading
Bitcoin – 10-Year & 2-Year Charts. REF: Stockcharts10Y, Stockcharts2Y

Len writes much of his own content, and also shares helpful content from other trusted providers like Turner Financial Group (TFG).
The material contained herein is intended as a general market commentary, solely for informational purposes and is not intended to make an offer or solicitation for the sale or purchase of any securities. Such views are subject to change at any time without notice due to changes in market or economic conditions and may not necessarily come to pass. This information is not intended as a specific offer of investment services by Dedicated Financial and Turner Financial Group, Inc.
Dedicated Financial and Turner Financial Group, Inc., do not provide tax, legal or accounting advice. You should consult your own tax, legal and accounting advisors before engaging in any transaction.
Any hyperlinks in this document that connect to Web Sites maintained by third parties are provided for convenience only. Turner Financial Group, Inc. has not verified the accuracy of any information contained within the links and the provision of such links does not constitute a recommendation or endorsement of the company or the content by Dedicated Financial or Turner Financial Group, Inc. The prices/quotes/statistics referenced herein have been obtained from sources verified to be reliable for their accuracy or completeness and may be subject to change.
Past performance is no guarantee of future returns. Investing involves risk and possible loss of principal capital. The views and strategies described herein may not be suitable for all investors. To the extent referenced herein, real estate, hedge funds, and other private investments can present significant risks, including loss of the original amount invested. All indexes are unmanaged, and an individual cannot invest directly in an index. Index returns do not include fees or expenses.
Turner Financial Group, Inc. is an Investment Adviser registered with the United States Securities and Exchange Commission however, such registration does not imply a certain level of skill or training and no inference to the contrary should be made. Additional information about Turner Financial Group, Inc. is also available at www.adviserinfo.sec.gov. Advisory services are only offered to clients or prospective clients where Turner Financial Group, Inc. and its representatives are properly licensed or exempt from licensure. No advice may be rendered by Turner Financial Group, Inc. unless a client service agreement is in place.