

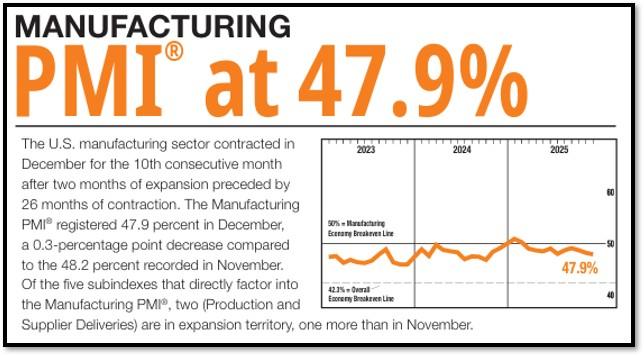
- 1. Economic data this week continues to paint a picture of a U.S. economy that is slowing but not in outright recession, with the latest data showing anemic readings in manufacturing and other cyclical indicators such as the ISM, which remain subdued.
- 2. This Week’s Main Story Focuses on American Expansionism in Venezuela. Venezuela’s economic collapse must be understood in the context of decades of severe mismanagement of the country’s natural and financial resources, particularly its oil sector.
- 3. Recent fraud headlines tied to federally funded programs have sparked renewed debate around credit integrity and the potential repricing of municipal bonds.
- 4. World Watch
- 4A. Protests in Iran have continued for several days and have turned deadly, with at least seven people reported killed amid clashes with security forces.
- 4B. Western media and many economists continue to analyze China’s economic slowdown as if it were a conventional market economy experiencing cyclical weakness.
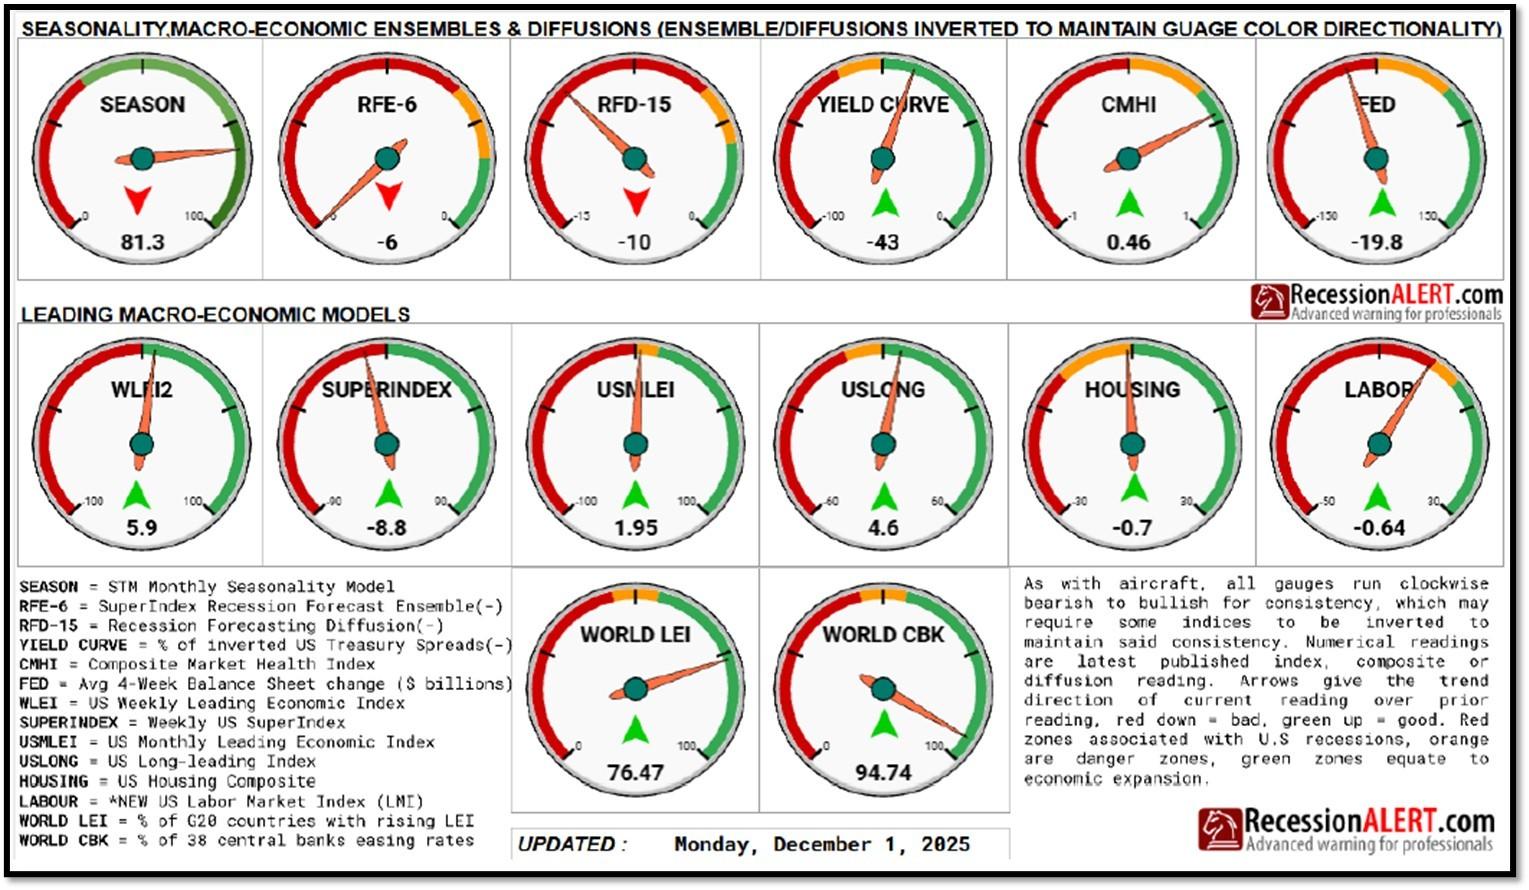
- 4C. An updated snapshot of the current global state of economy.
- 5. Quant & Technical Corner – A selection of quantitative & technical data we monitor on a regular basis to help gauge the overall financial market conditions and the investment environment.
1. Economic data this week continues to paint a picture of a U.S. economy that is slowing but not in outright recession, with the latest data showing anemic readings in manufacturing and other cyclical indicators such as the ISM, which remain subdued.
Against this backdrop, it now appears increasingly unlikely that the Federal Reserve will deliver a rate cut at its January meeting, but the persistent softening in factory activity and early signs of loosening in labor markets make a compelling case for three additional 25 basis-point cuts in 2026. My assessment is that the Fed is gradually internalizing the reality that core inflation trends are firmly under control and that longer-term disinflation, or even deflationary pressures may be emerging as structural dynamics shift. This evolving macro backdrop unfolds alongside a rich slate of major business and technology events this week, including CES 2026 in Las Vegas, Nvidia’s launch of AlphaMayo, a new autonomous-vehicle platform for OEM adoption, and Discord’s IPO filing, each of which underscores the broader interplay between innovation, productivity, and investment flows in a slowing macro environment. I will cover CES and AlphaMayo in next week. REF: Briefing, ISM-PMI
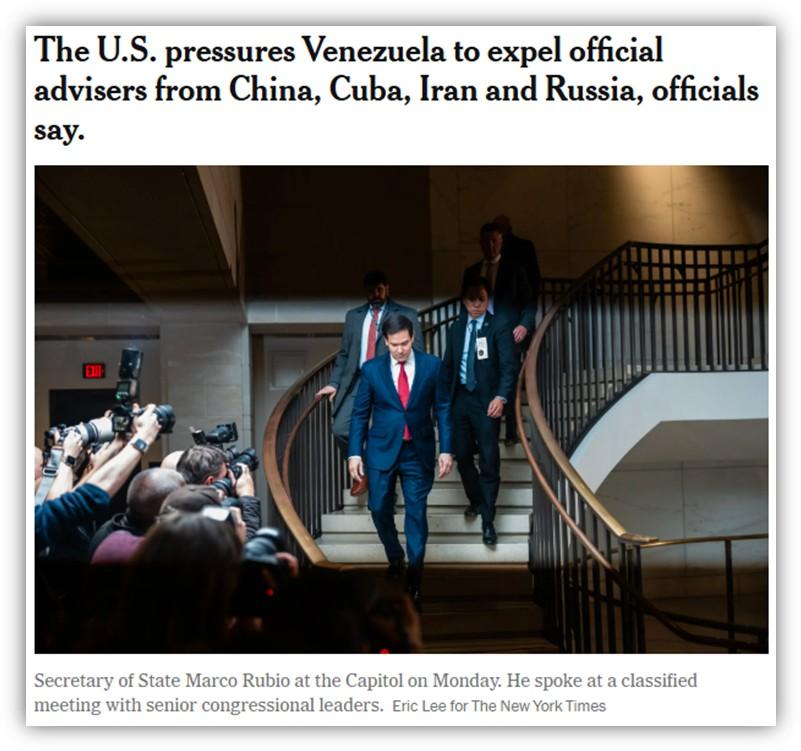
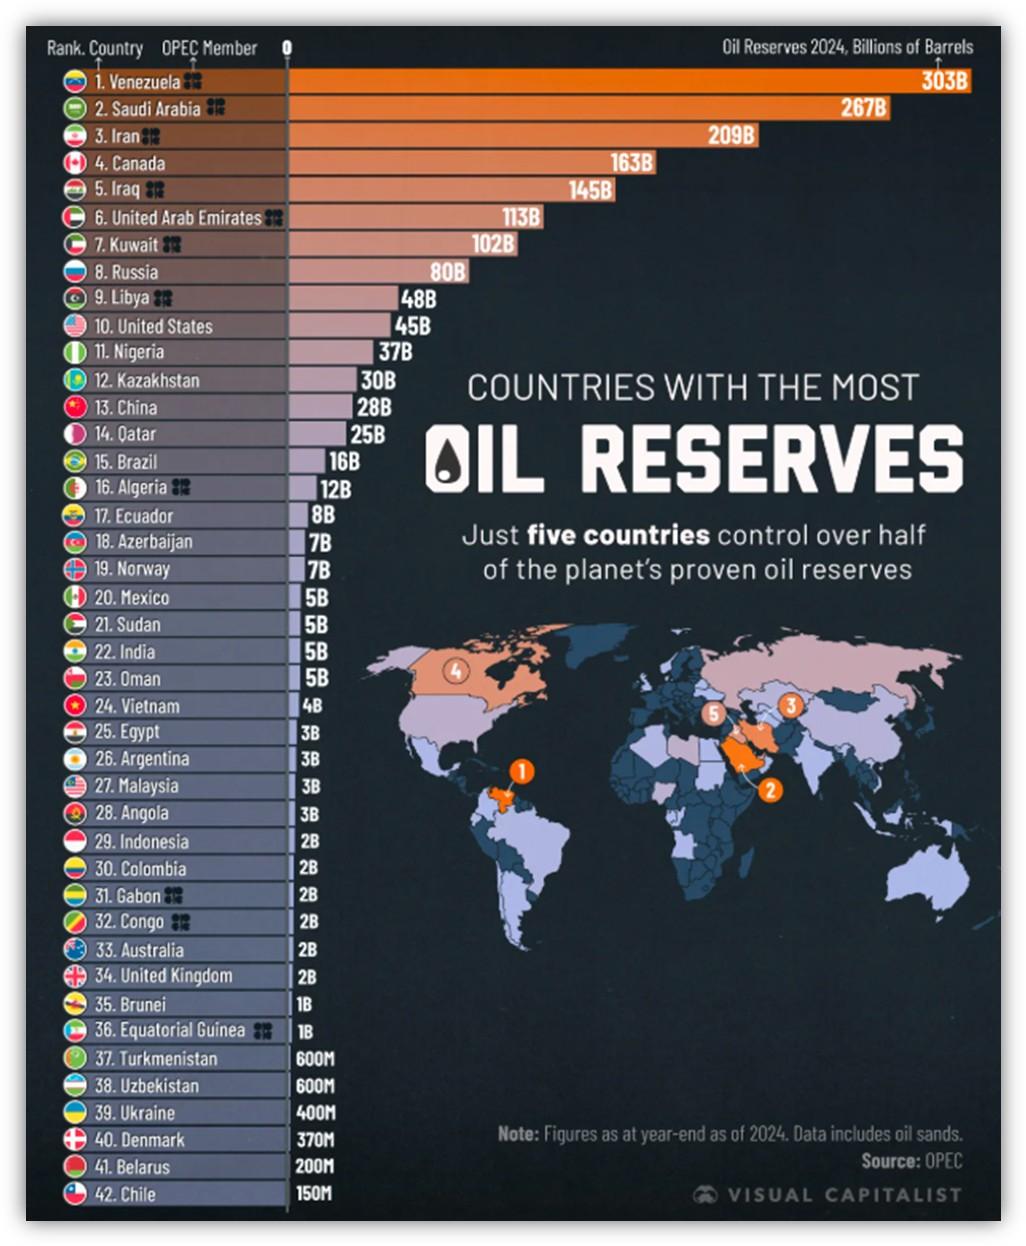
2. This Week’s Main Story Focuses on American Expansionism in Venezuela. Venezuela’s economic collapse must be understood in the context of decades of severe mismanagement of the country’s natural and financial resources, particularly its oil sector.
Despite holding the world’s largest proven crude reserves (estimated at over 300 billion barrels – see graph further below by VisualCapitalist), chronic underinvestment, politicization of state enterprises, corruption, and sanctions-driven isolation led to a historic economic contraction. As a result, more than 8 million Venezuelans fled the country, creating one of the largest migration crises in modern history. Simultaneously, the Maduro regime deepened strategic alignment with Cuba, Russia, and China, distancing Venezuela from Western nations, capital markets, and institutions. This geopolitical pivot further restricted access to investment, technology, and trade, accelerating economic deterioration and institutional decay.
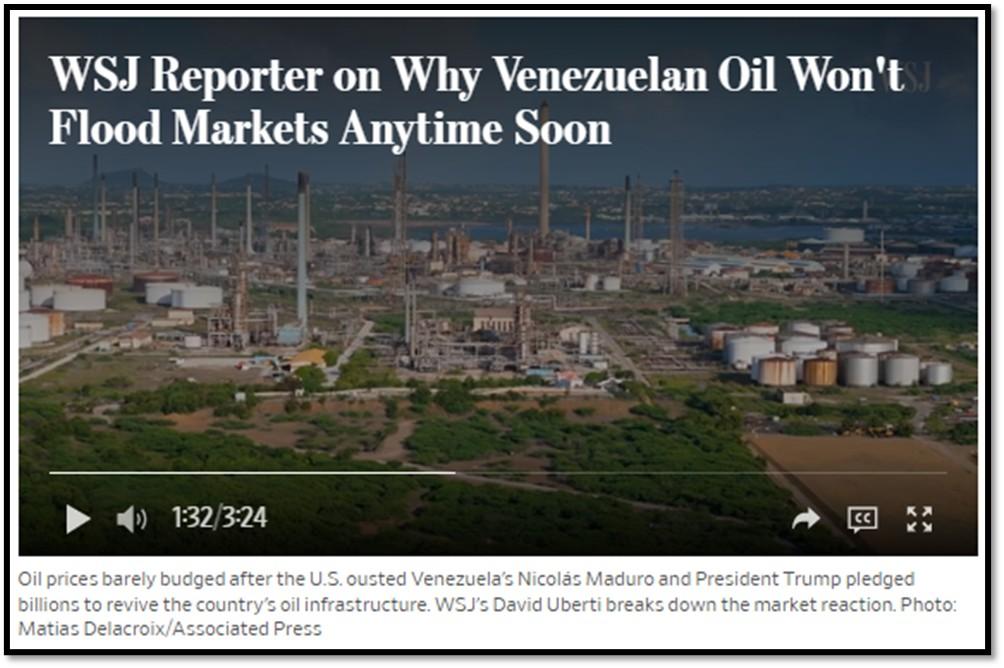
Against this backdrop, the capture of Nicolás Maduro and a U.S. effort to work with existing vice-presidential or interim leadership would primarily affect markets through expectations rather than immediate fundamentals. Financial markets would likely respond first, particularly Venezuelan sovereign and PDVSA bonds, which could reprice higher on optimism around potential debt restructuring, sanctions recalibration, and re-engagement with Western institutions. Energy equities may also benefit as investors price in the possibility (not certainty) of Venezuela eventually re-entering global oil markets. However, near-term global economic and inflation impacts would likely be limited, as Venezuela currently contributes a small share of global oil supply and lacks the infrastructure and capital needed for a rapid production recovery.
Venezuela faces extensive economic, institutional, and infrastructural repair… REF: Tradingeconomics.com
Over the medium to long term, economic outcomes would depend almost entirely on political stability, governance credibility, and policy execution. Even under a cooperative transition scenario, Venezuela faces a long rebuilding process after years of institutional erosion. For meaningful recovery to occur, several conditions would need to align:
- A credible and broadly accepted political transition
- Gradual sanctions relief tied to verifiable reforms
- Legal and regulatory clarity for foreign investment
- Large-scale capital inflows to rebuild energy and public infrastructure
If successfully executed, such a transition could improve sovereign creditworthiness, stabilize public finances, attract foreign direct investment, and potentially slow or reverse migration trends. However, transition risk remains high. Weak legitimacy, internal conflict, or policy missteps could prolong instability and delay recovery. In short, while a post-Maduro realignment toward the West carries substantial economic upside, outcomes would be driven far more by governance and reform discipline than by regime change alone. Click onto pictures below to access videos. REF: Bloomberg1, Bloomberg2, NYT, WSJ

3. Recent fraud headlines tied to federally funded programs have sparked renewed debate around credit integrity and the potential repricing of municipal bonds.
While market commentary has elevated these concerns, we believe it is critical to separate narrative-driven risk from fundamental credit reality. This paper provides a disciplined assessment of where fraud exposure truly resides, how municipal bond structures differ across issuers and revenue sources, and why active management and credit selection remain essential in the current late-cycle environment. Our objective is to address these concerns directly, clarify where risks are (and are not) present, and outline how our municipal bond allocations are positioned to remain resilient amid evolving market conditions. Click below to access the white paper.
REF: MUNICIPAL BONDS, FRAUD HEADLINES, and CREDIT REPRICING RISK (Click Here to Access the White Paper)
For those who are interested in the comments made by Chamath Palihapitiya on municipal bonds, click onto picture below to access video.

NOTE: Not investment/tax advice or recommendations. Investors should carefully consider the investment objectives, risks, charges, and expenses before investing. For additional information about the securities mentioned above, please visit the respective security’s investor relations pages for additional information. Please read all materials carefully before investing.
https://www.firsteagle.com/funds/high-yield-municipal-fund
https://www.pimco.com/us/en/investments/mutual-fund/pimco-high-yield-municipal-bond-fund/inst-usd
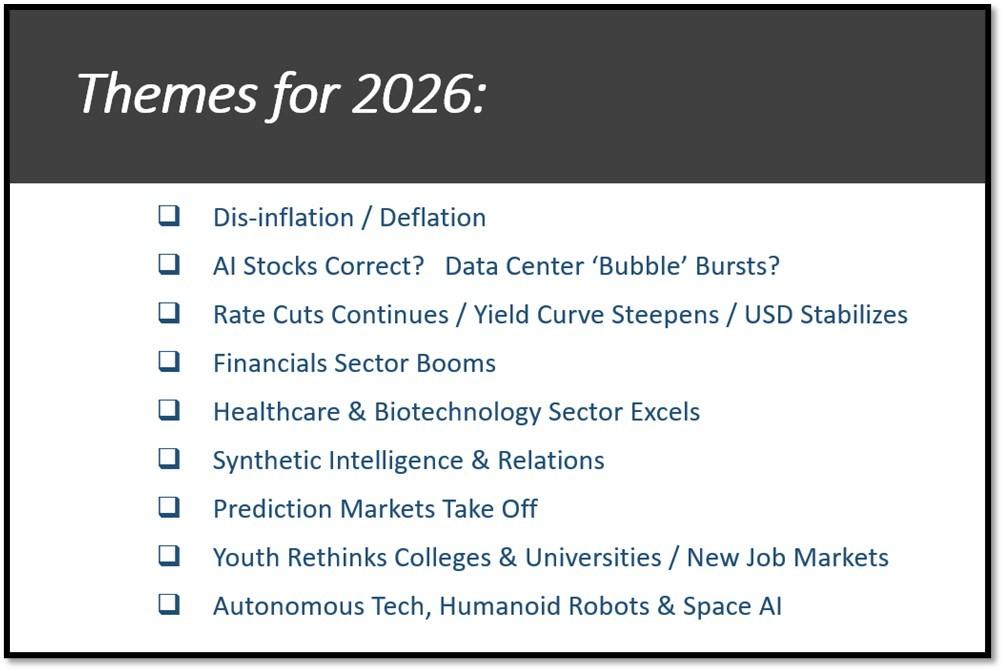
Below is a slide from my market update slide deck. Feel free to schedule a presentation for you and your audience.
4. World Watch
4A. Protests in Iran have continued for several days and have turned deadly, with at least seven people reported killed amid clashes with security forces.
The unrest highlights persistent tensions between the population and Iran’s Ayatollah-led theocratic regime, where ultimate authority rests with the Supreme Leader, Ali Khamenei. While Iran maintains elected institutions such as the presidency and parliament, real power is concentrated within unelected clerical and security bodies. Economic pressure from inflation, currency depreciation, sanctions, and limited employment opportunities (combined with social restrictions and minimal political recourse) continues to fuel recurring protest movements, particularly among younger and urban citizens. Click onto picture below to access video. REF: Bloomberg, WSJ, CNN-News18

4B. Western media and many economists continue to analyze China’s economic slowdown as if it were a conventional market economy experiencing cyclical weakness.
As Don Xiang explains, this leads to misplaced prescriptions such as stimulating domestic consumption, encouraging imports, or waiting for policy “adjustments” to restore balance. This framework fundamentally misunderstands the Chinese system. China is not attempting to normalize its economy along market lines; instead, it operates under the overriding doctrine of absolute political control by the Chinese Communist Party (CCP). Economic efficiency, consumer welfare, and price discovery are subordinate to regime security, control, and strategic autonomy. As a result, traditional demand-side fixes are largely irrelevant in a system where markets are allowed to function only insofar as they do not challenge political authority.
The video argues that this obsession with control (manifested through state sector expansion, private sector retrenchment, over-securitization, and policy rigidity) has hollowed out China’s economic vitality. Capital and resources are systematically misallocated toward inefficient state-owned enterprises, while the private sector is constrained and discouraged. This has produced chronic overcapacity, a balance-sheet recession, suppressed household income, and widening inequality. Trade surpluses are not a byproduct of competitiveness but a strategic tool to project geopolitical influence, rather than improve domestic living standards. In Don Xiang’s framing, China’s economy is not merely slowing; it is locked into a self-reinforcing, politically driven stagnation cycle where control consistently overrides market logic—setting the stage for prolonged economic underperformance and rising friction with the global economic system. Click onto picture below to access video. REF: DiggingIntoChina

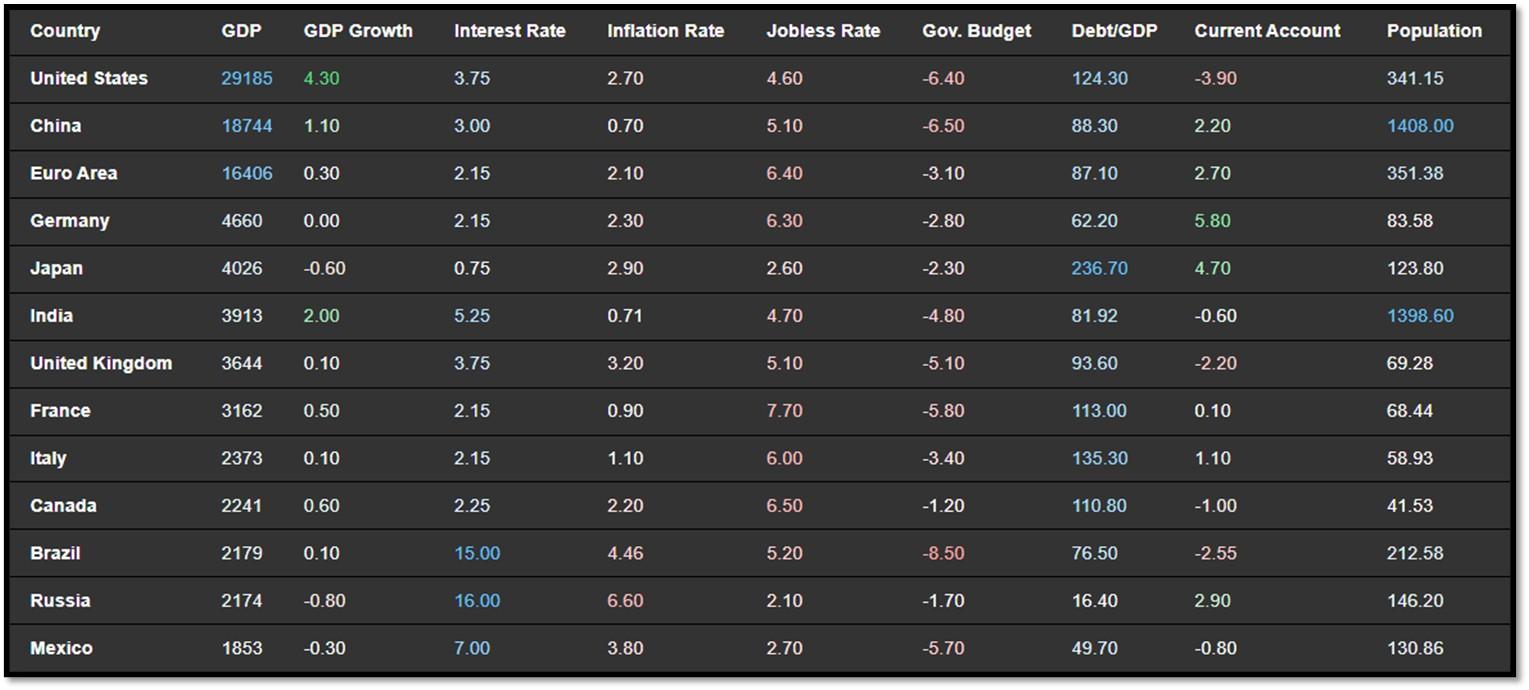
4C. An updated snapshot of the current global state of economy.
According to TradingEconomics as of 1/5/2026 (REF: TradingEconomics):
- The unemployment rate in Brazil fell to 5.2% in the moving quarter ending in November of 2025, a record low, dropping from the 5.6% in the three months to August and compared to expectations of a softer decrease to 5.4%.
- France’s annual inflation rate fell to 0.8% in December 2025, its lowest level in seven months, down from 0.9% in each of the previous two months and below expectations of 0.9%, according to preliminary estimates.
- Copper futures climbed above $6 per pound on Tuesday, hitting new record highs amid expectations of a further tightening in global supply this year.
- The annual inflation rate in the Philippines rose to 1.8% in December 2025, from a three-month low of 1.5% in the previous month, surpassing market expectations of 1.4%.
5. Quant & Technical Corner – A selection of quantitative & technical data we monitor on a regular basis to help gauge the overall financial market conditions and the investment environment.
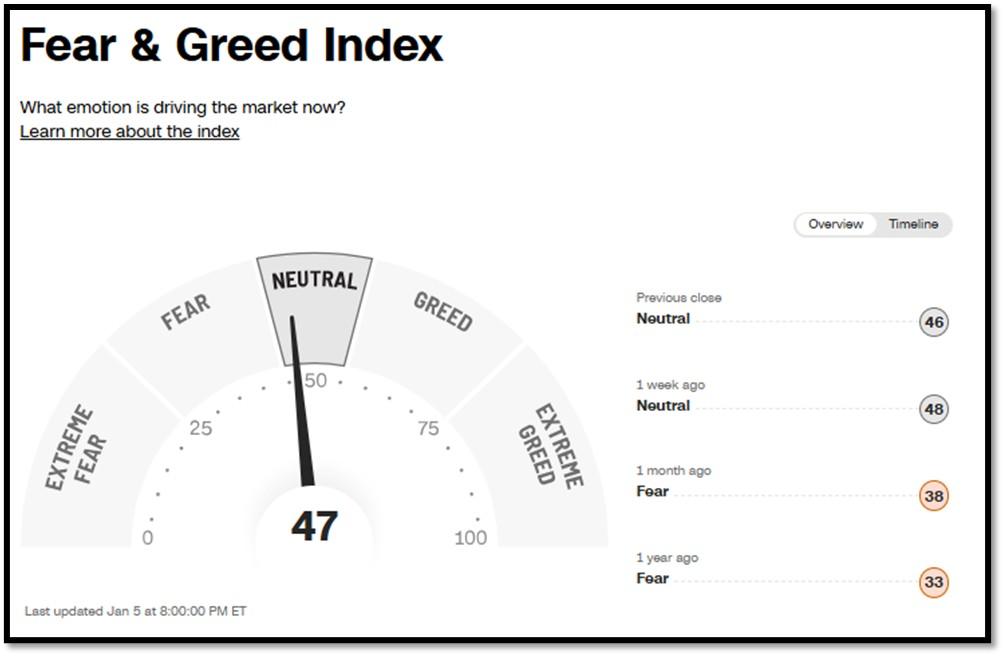
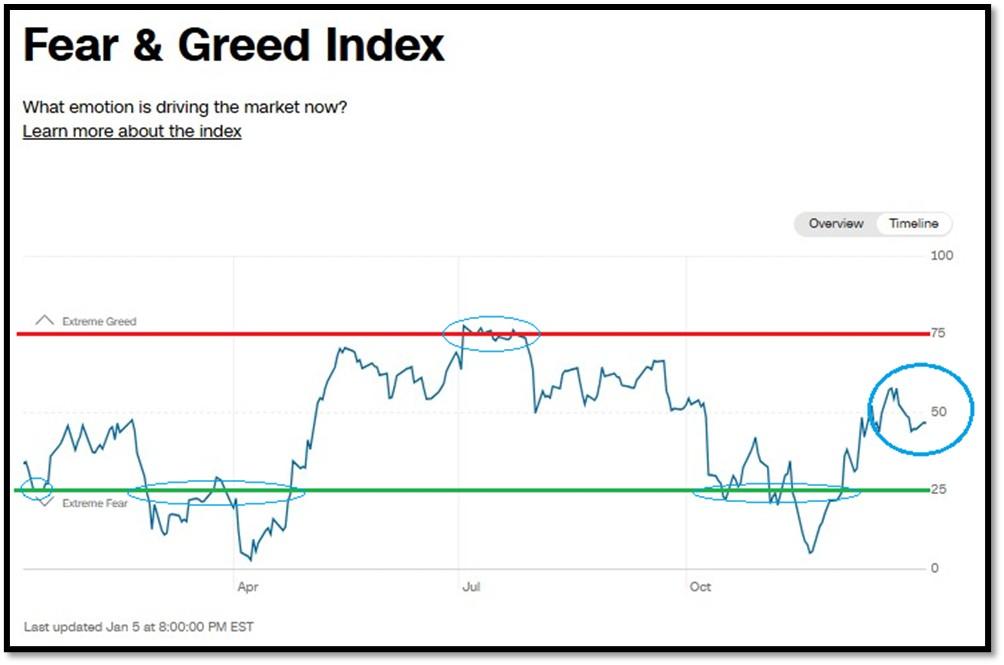
5A. Most recent read on the Fear & Greed Index with data as of 1/5/2026 – 8:00 PM-ET is 49 (Neutral). Last week’s data was 57 (Greed) (1-100). CNNMoney’s Fear & Greed index looks at 7 indicators (Stock Price Momentum, Stock Price Strength, Stock Price Breadth, Put and Call Options, Junk Bond Demand, Market Volatility, and Safe Haven Demand). Keep in mind this is a contrarian indicator! REF: Fear&Greed via CNNMoney
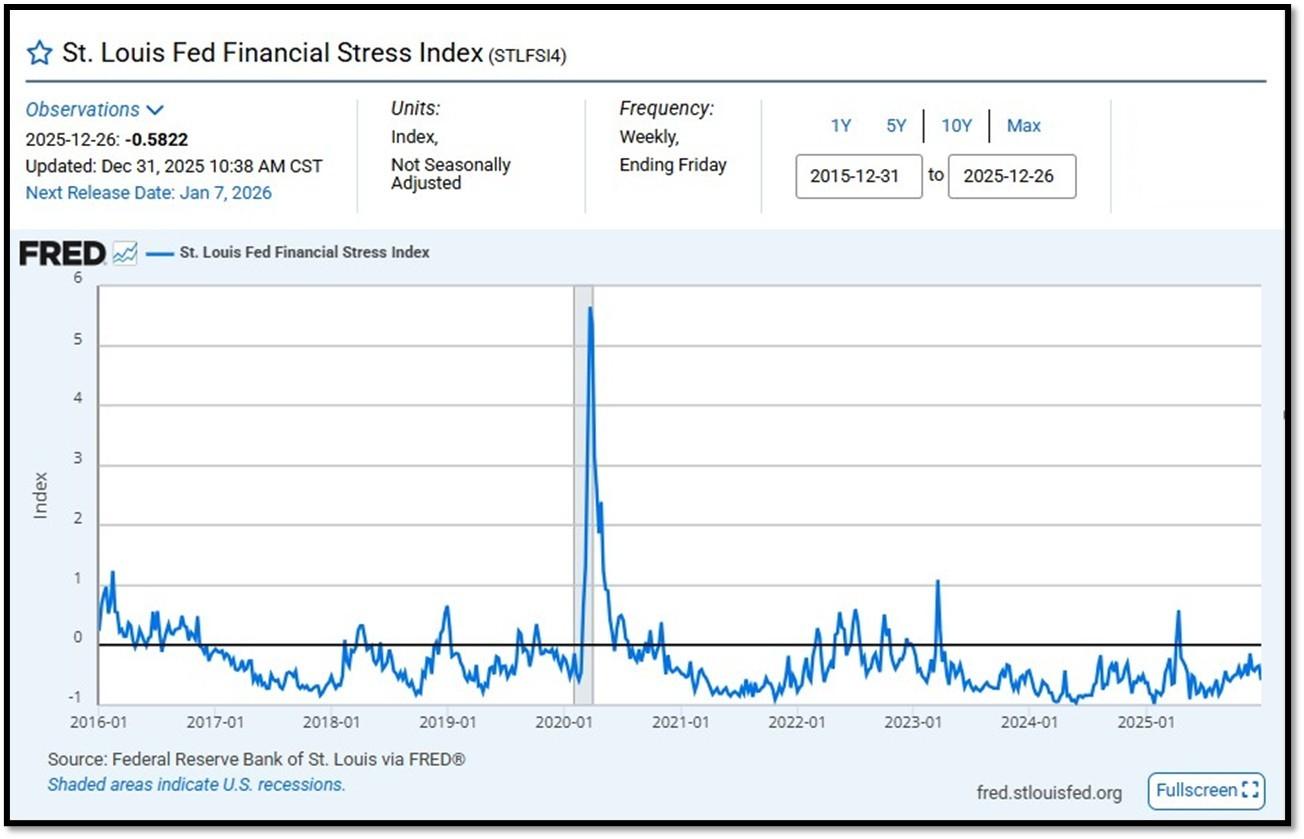
5B. St. Louis Fed Financial Stress Index’s (STLFSI4) most recent read is at –0.5822 as of December 31, 2025. Previous week’s data was -0.3420. A big spike up from previous readings reflecting the turmoil in the banking sector back in 2023. This weekly index is not seasonally adjusted. The STLFSI4 measures the degree of financial stress in the markets and is constructed from 18 weekly data series: seven interest rate series, six yield spreads and five other indicators. Each of these variables captures some aspect of financial stress. Accordingly, as the level of financial stress in the economy changes, the data series are likely to move together. REF: St. Louis Fed
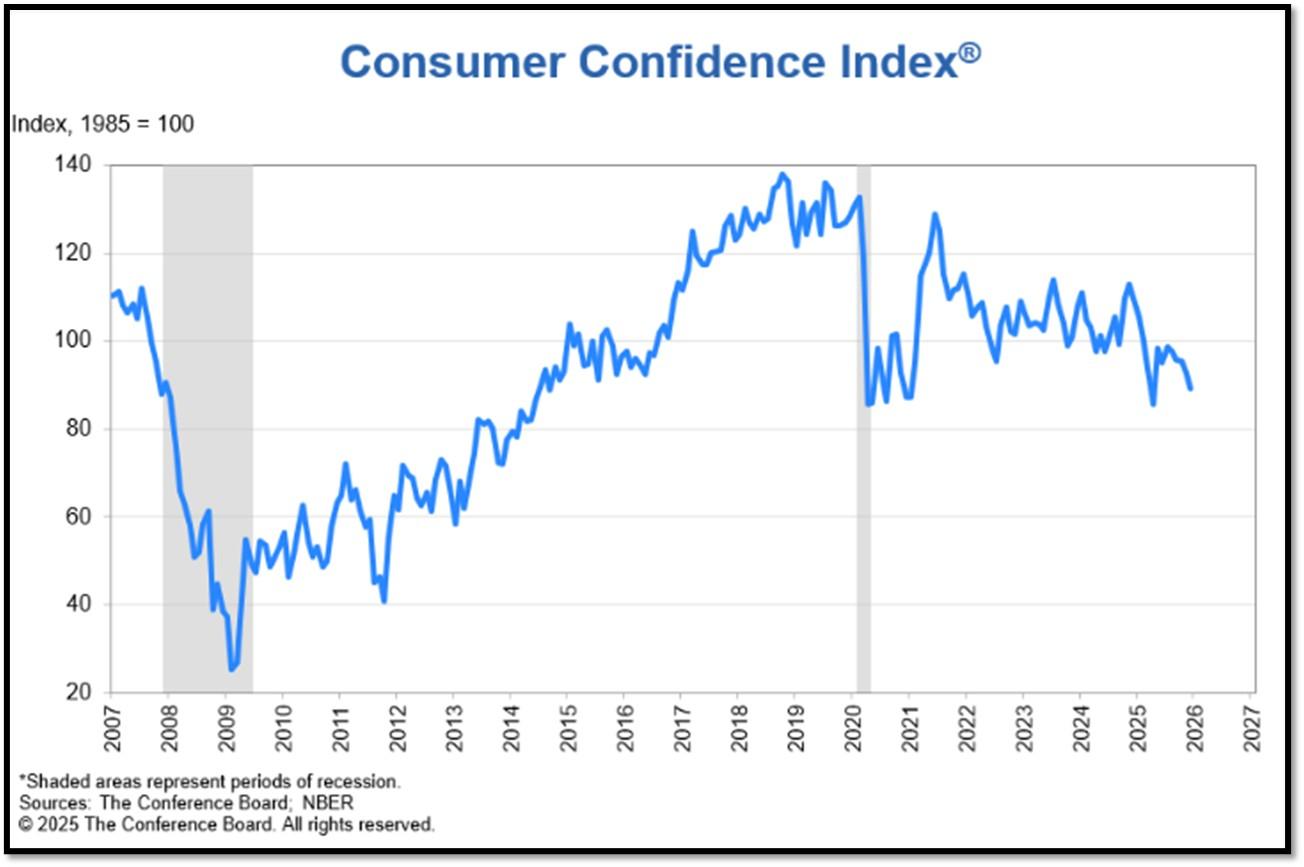
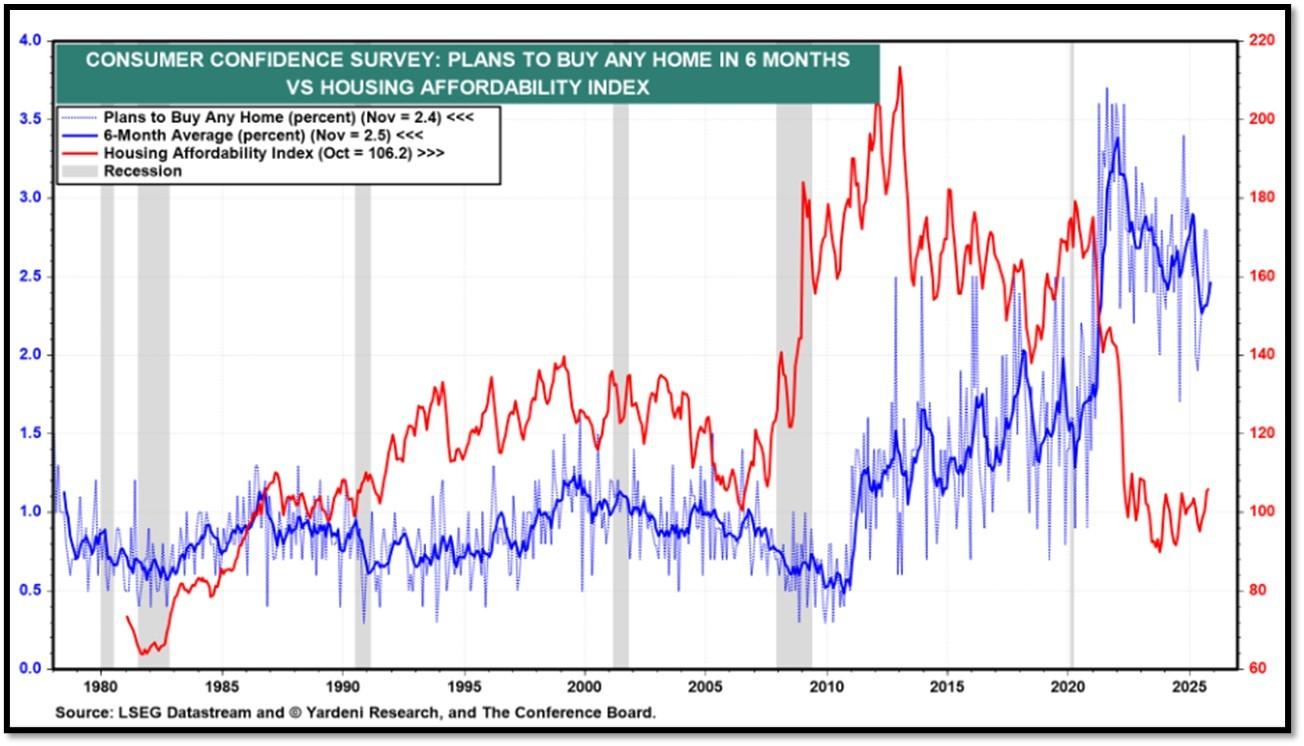
5C. “Despite an upward revision in November related to the end of the shutdown, consumer confidence fell again in December and remained well below this year’s January peak. Four of five components of the overall index fell, while one was at a level signaling notable weakness,” said Dana M Peterson, Chief Economist, The Conference Board. The Conference Board Consumer Confidence Index® declined by 3.8 points in December to 89.1 (1985=100), from 92.9 in November. REF: ConsumerConfidence
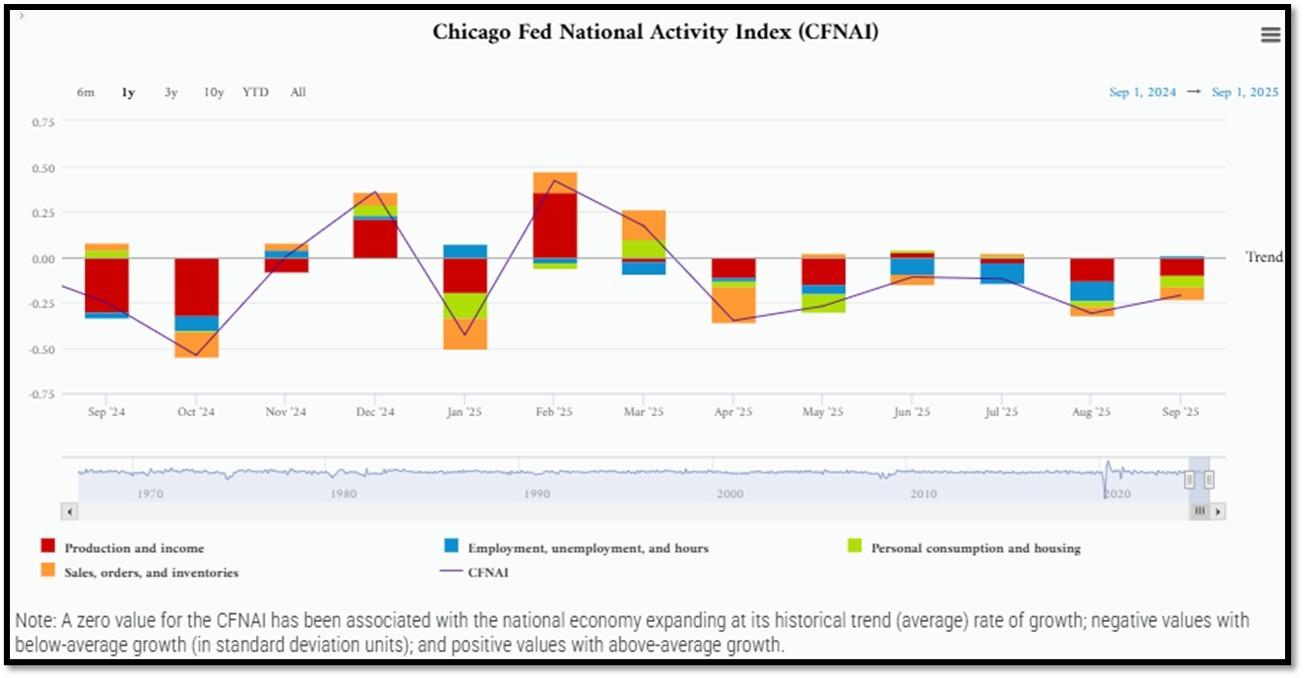
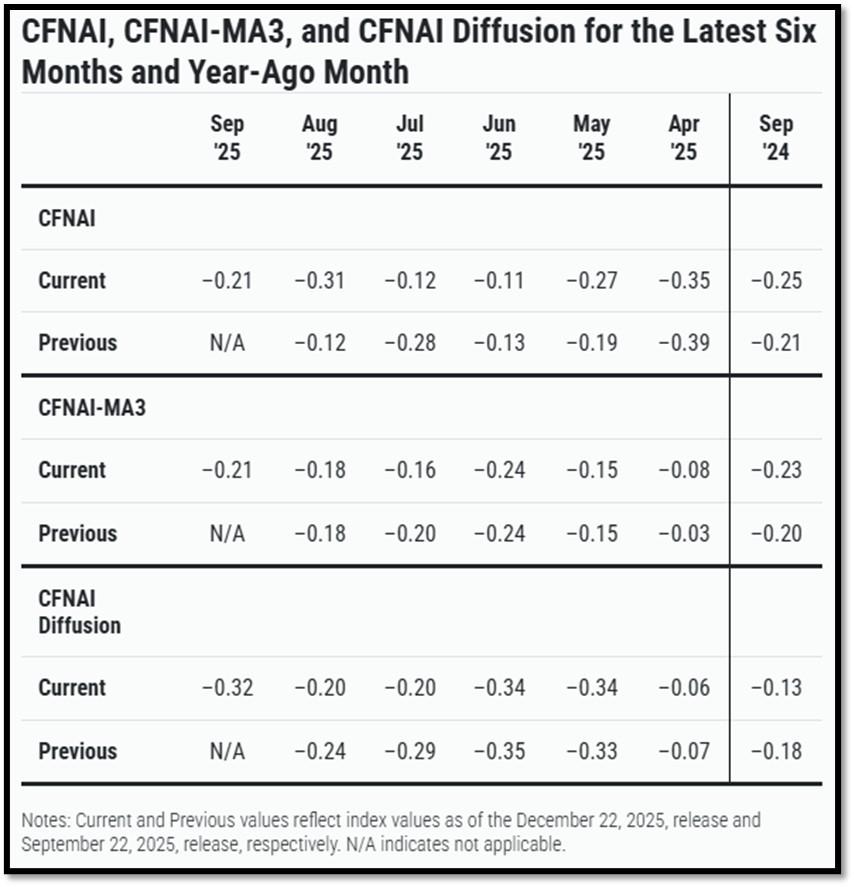
5D. The Chicago Fed National Activity Index (CFNAI) increased to –0.21 in September from –0.31 in August. Two of the four broad categories of indicators used to construct the index decreased from August, and three categories made negative contributions in September. The index’s three-month moving average, CFNAI-MA3, decreased to –0.21 in September from –0.18 in August. REF: ChicagoFed, September’s Report
5E. (12/9/2025) The Conference Board Leading Economic Index® (LEI) for the US declined by 0.3% in September 2025 to 98.3 (2016=100), after also declining by 0.3% in August (upwardly revised from an originally reported 0.5% decline). Overall, the LEI fell by 2.1% over the six months between March and September 2025, a faster rate of decline than its 1.3% contraction over the previous six-month period (September 2024 to March 2025). The composite economic indexes are the key elements in an analytic system designed to signal peaks and troughs in the business cycle. The indexes are constructed to summarize and reveal common turning points in the economy in a clearer and more convincing manner than any individual component. The CEI is highly correlated with real GDP. The LEI is a predictive variable that anticipates (or “leads”) turning points in the business cycle by around 7 months. Shaded areas denote recession periods or economic contractions. The dates above the shaded areas show the chronology of peaks and troughs in the business cycle. The ten components of The Conference Board Leading Economic Index® for the U.S. include: Average weekly hours in manufacturing; Average weekly initial claims for unemployment insurance; Manufacturers’ new orders for consumer goods and materials; ISM® Index of New Orders; Manufacturers’ new orders for nondefense capital goods excluding aircraft orders; Building permits for new private housing units; S&P 500® Index of Stock Prices; Leading Credit Index™; Interest rate spread (10-year Treasury bonds less federal funds rate); Average consumer expectations for business conditions. REF: ConferenceBoard, LEI Report for November (ReceesionAlert) (Released on 12/30/2025)
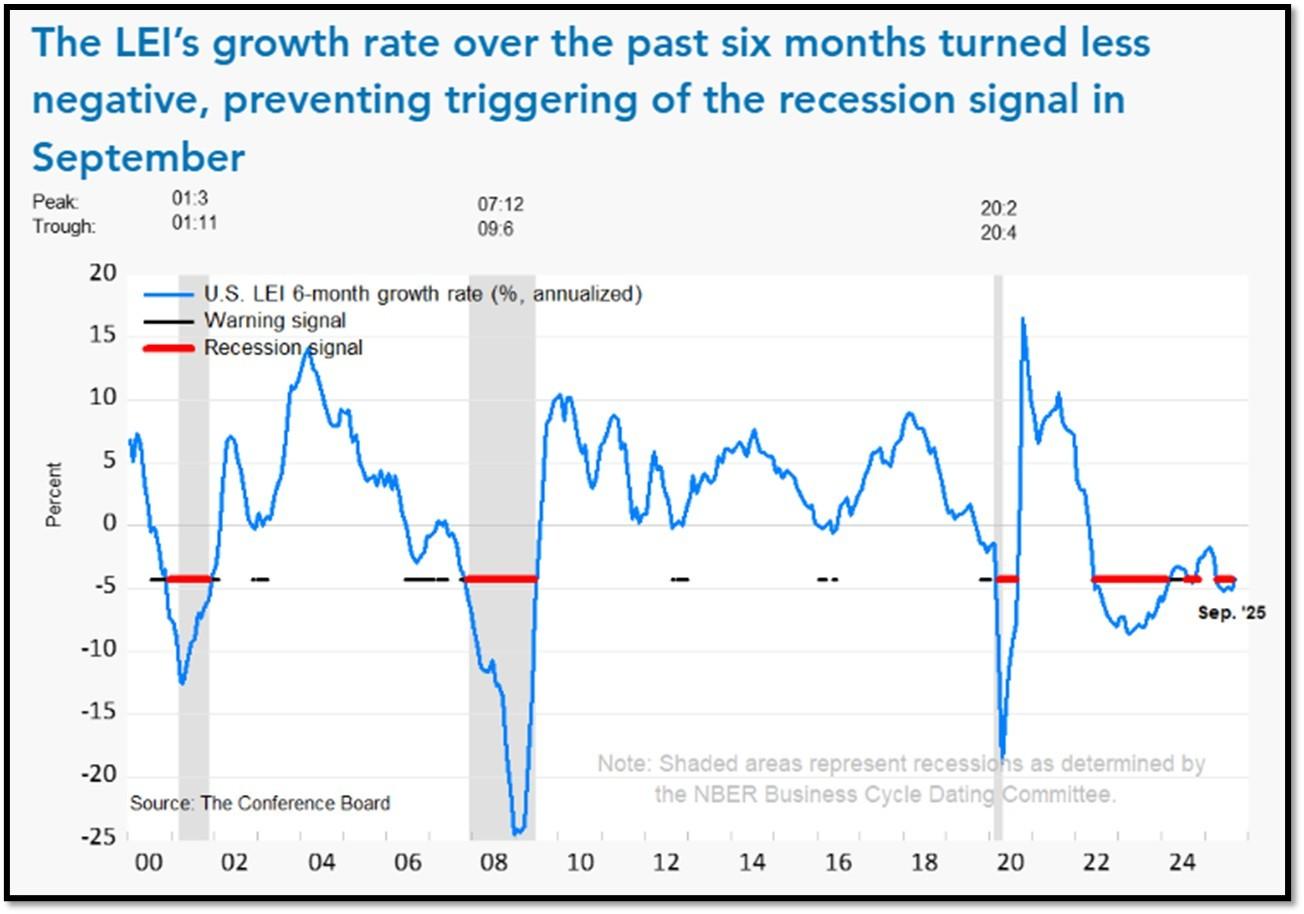
We have experienced a “rolling recession” since June 2022 and are only now emerging from it. However, authorities are not labeling it a recession due to high employment data from June 2022-2025.
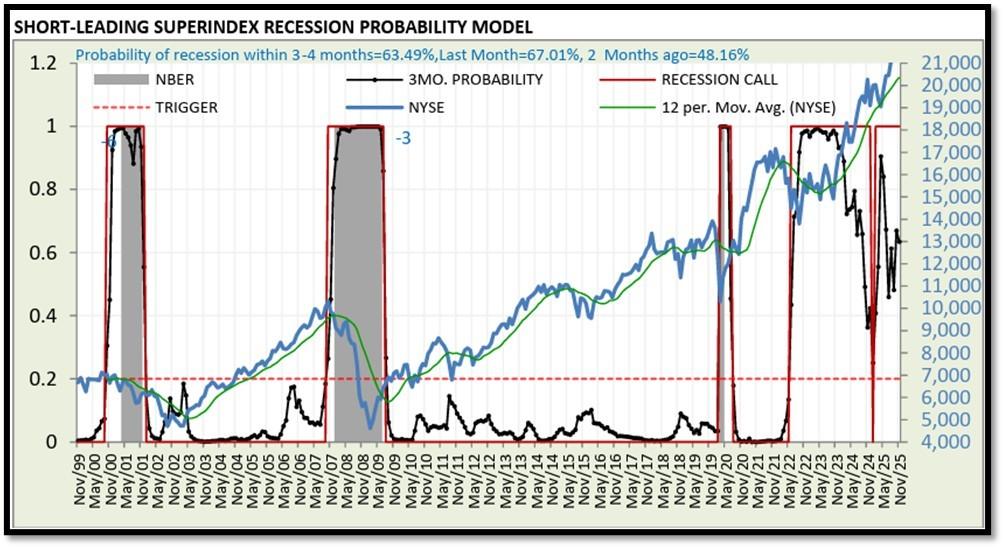
5F. Probability of U.S. falling into Recession within 3 to 4 months is currently at 63.49% (with data as of 12/01/2025 – Next Report 12/15/2025) according to RecessionAlert Research. Last release’s data was at 46.3%. This report is updated every two weeks. REF: RecessionAlertResearch
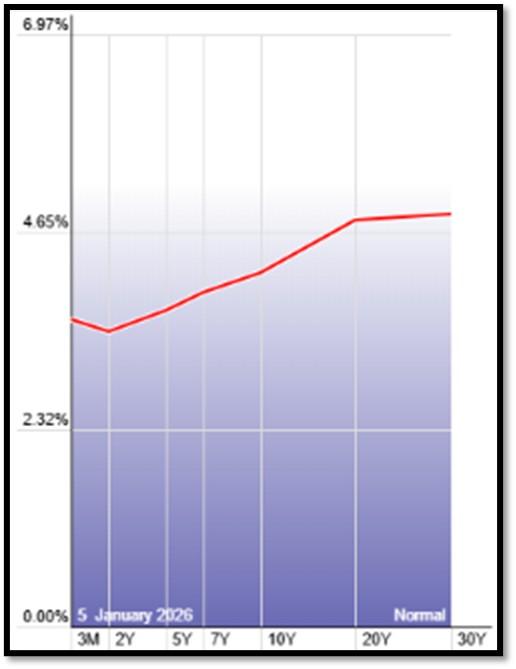
5G. Yield Curve as of 1/5/2026 is showing Normal. Spread on the 10-yr Treasury Yield (4.18%) minus yield on the 2-yr Treasury Yield (3.47%) is currently at 71bps. REF: Stockcharts The yield curve—specifically, the spread between the interest rates on the ten-year Treasury note and the three-month Treasury bill—is a valuable forecasting tool. It is simple to use and significantly outperforms other financial and macroeconomic indicators in predicting recessions two to six quarters ahead. REF: NYFED
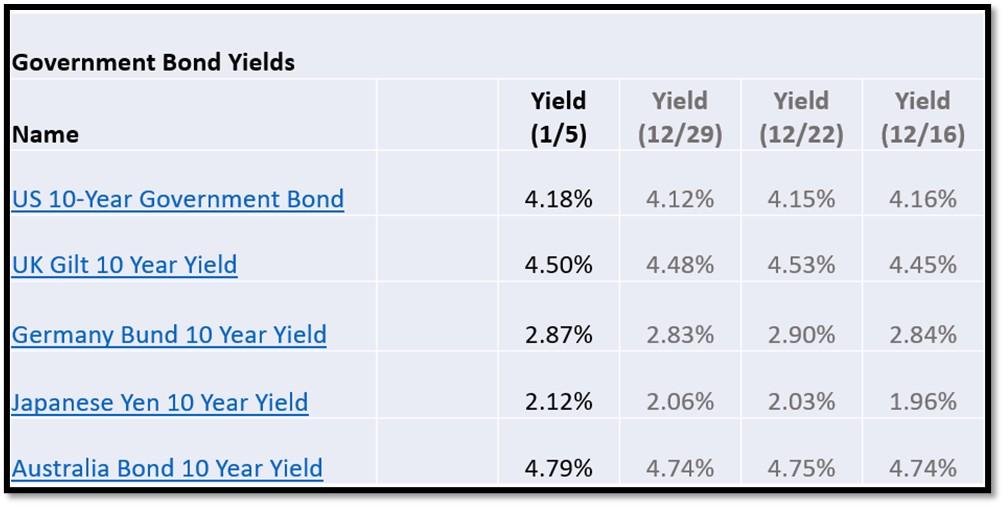
5H. Recent Yields in 10-Year Government Bonds. REF: Source is from Bloomberg.com, dated 1/5/2026, rates shown below are as of 1/5/2026, subject to change.
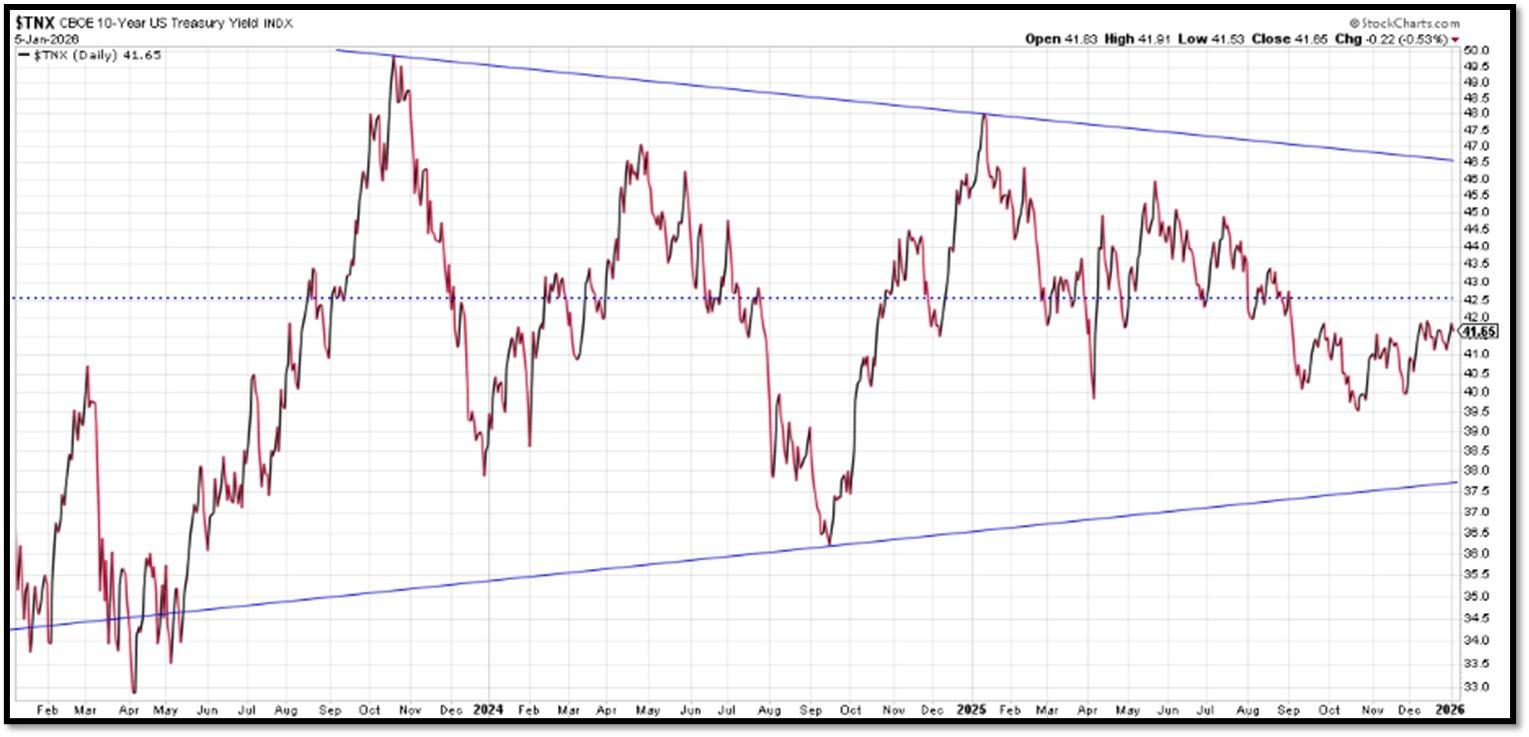
The 10-Year US Treasury Yield… The 10-Year Yield is indirectly related to inflation and prospect of the economy. I expect the 10-Year Yield to drop towards the support line. REF: StockCharts1
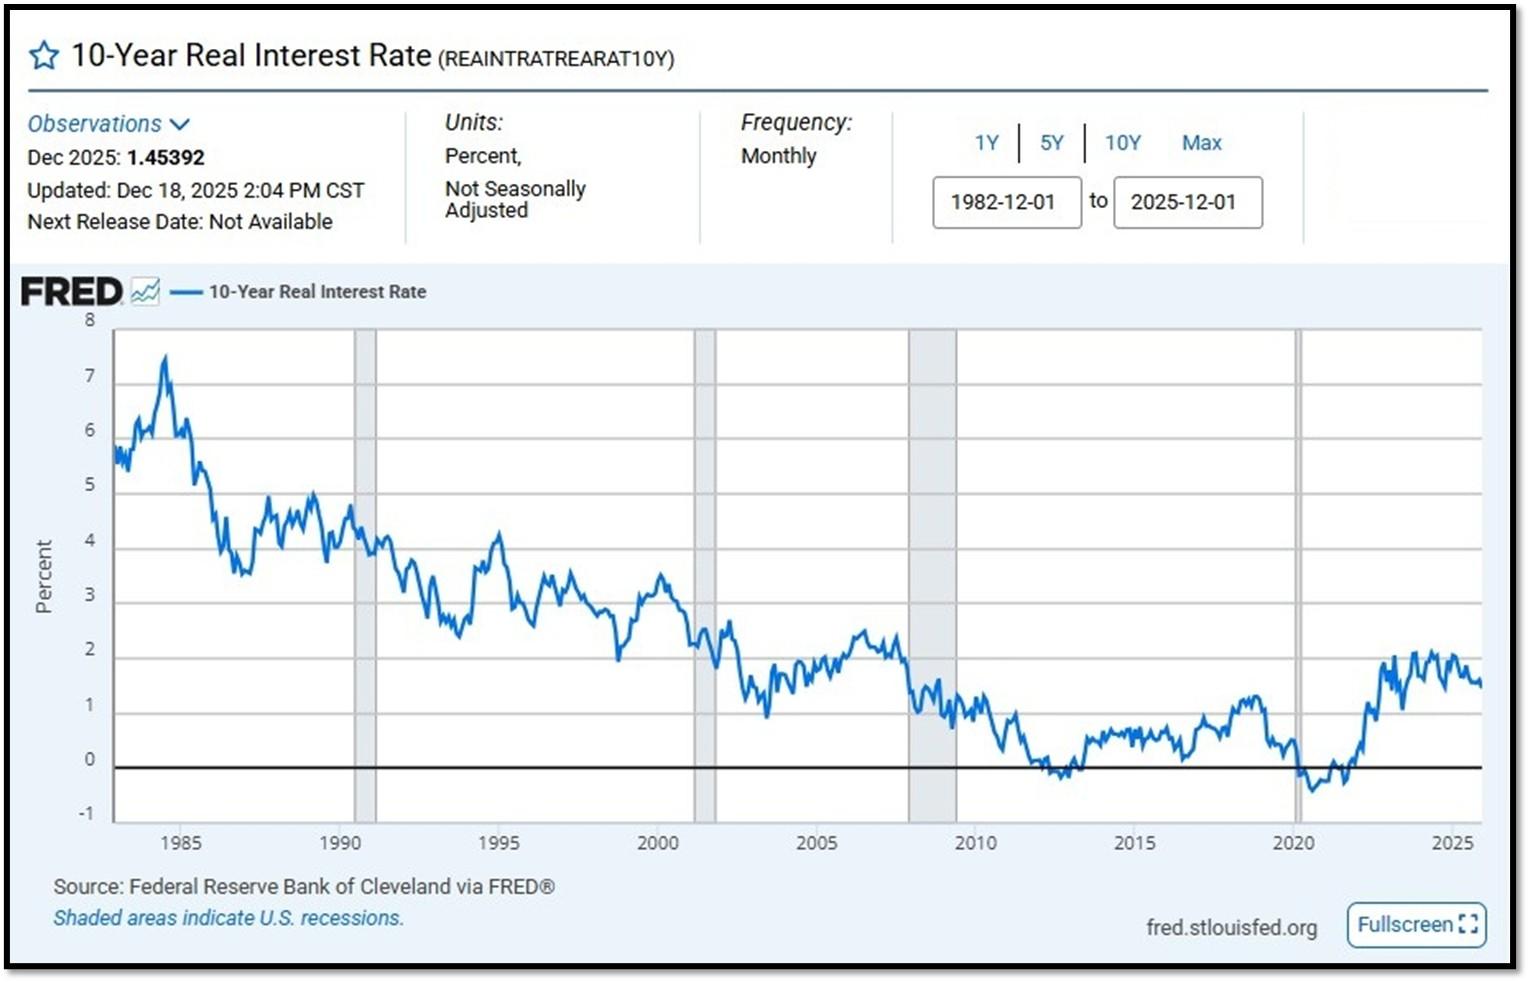
10-Year Real Interest Rate at 1.45392% as of 12/18/25. Last month’s data was 1.56911%. REF: REAINTRATREARAT10Y
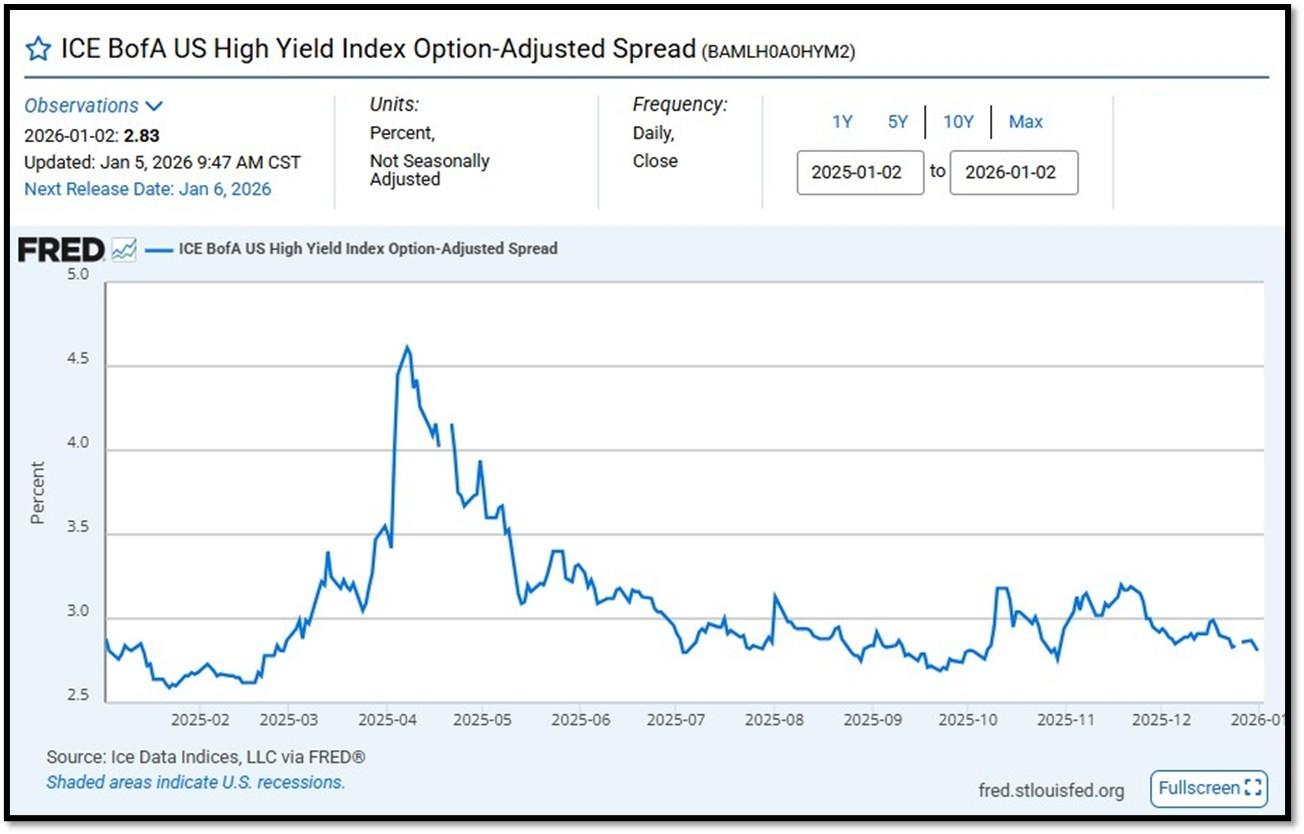
ICE BofA US High Yield Index Option-Adjusted Spread (BAMLH0A0HYM2) currently at 2.83 as of January 5, 2026. This is a key indicator of market sentiment, particularly regarding risk and economic health. At its core, the spread reflects the extra return investors demand to hold riskier corporate debt over safer government securities. High-yield bonds are issued by companies with lower credit ratings (below investment grade, like BB or lower), meaning they carry a higher chance of default. The spread compensates for this risk. When the spread is narrow—say, around 2.5% to 3%, as seen recently—it suggests investors are confident, willing to accept less extra yield because they perceive lower default risk or a strong economy. Narrow spreads often align with bullish markets, where cash is flowing, growth is steady, and fear is low. REF: FRED-BAMLH0A0HYM2
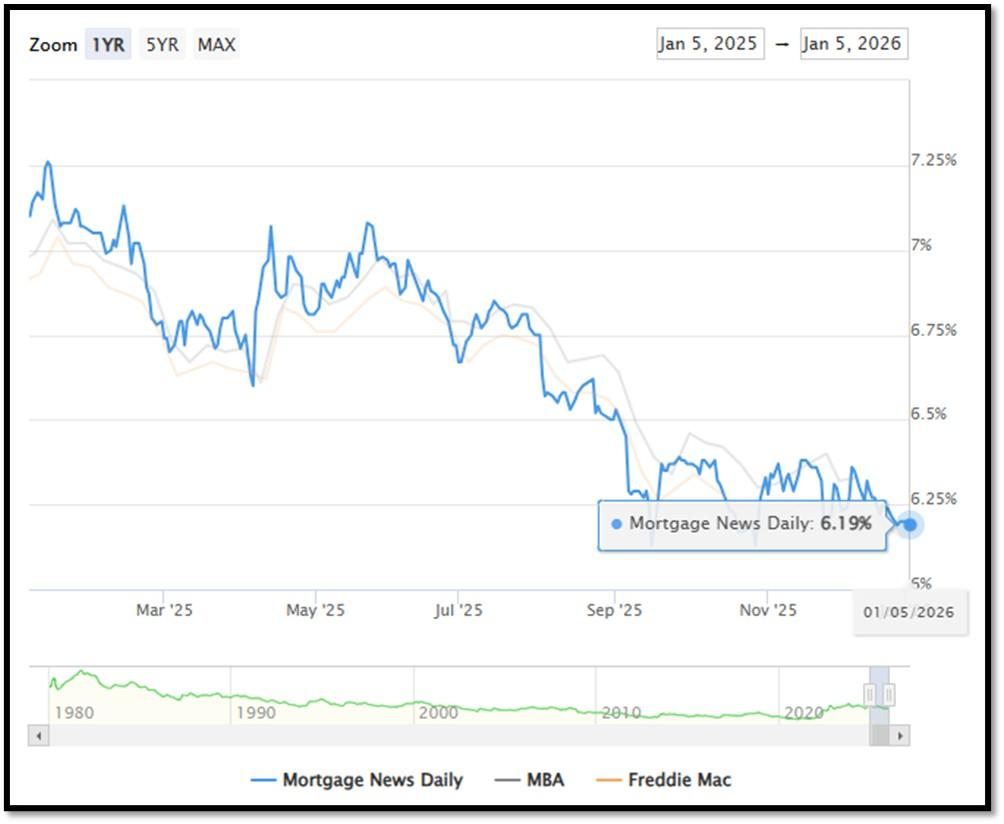
5I. (1/5/2026) Today’s National Average 30-Year Fixed Mortgage Rate is 6.19% (All Time High was 8.03% on 10/19/23). Last week’s data was 6.19%. This rate is the average 30-year fixed mortgage rates from several different surveys including Mortgage News Daily (daily index), Freddie Mac (weekly survey), Mortgage Bankers Association (weekly survey) and FHFA (monthly survey). REF: MortgageNewsDaily, Today’s Average Rate
The recent spike in the 30-year fixed-rate jumbo mortgage to 6.19%, compared to Freddie Mac’s rate at 6.15% and the Mortgage Bankers Association (MBA) rate at 6.33%, highlights key differences in the mortgage market. Jumbo mortgages, which exceed the conforming loan limits set by government agencies like Freddie Mac, typically carry higher interest rates because they are riskier for lenders. These loans are not backed by government entities, which increases the risk for lenders and, consequently, leads to higher rates. In contrast, Freddie Mac and MBA provide averages for conforming loans, which meet federal guidelines and have lower risk due to government backing, keeping their rates lower.
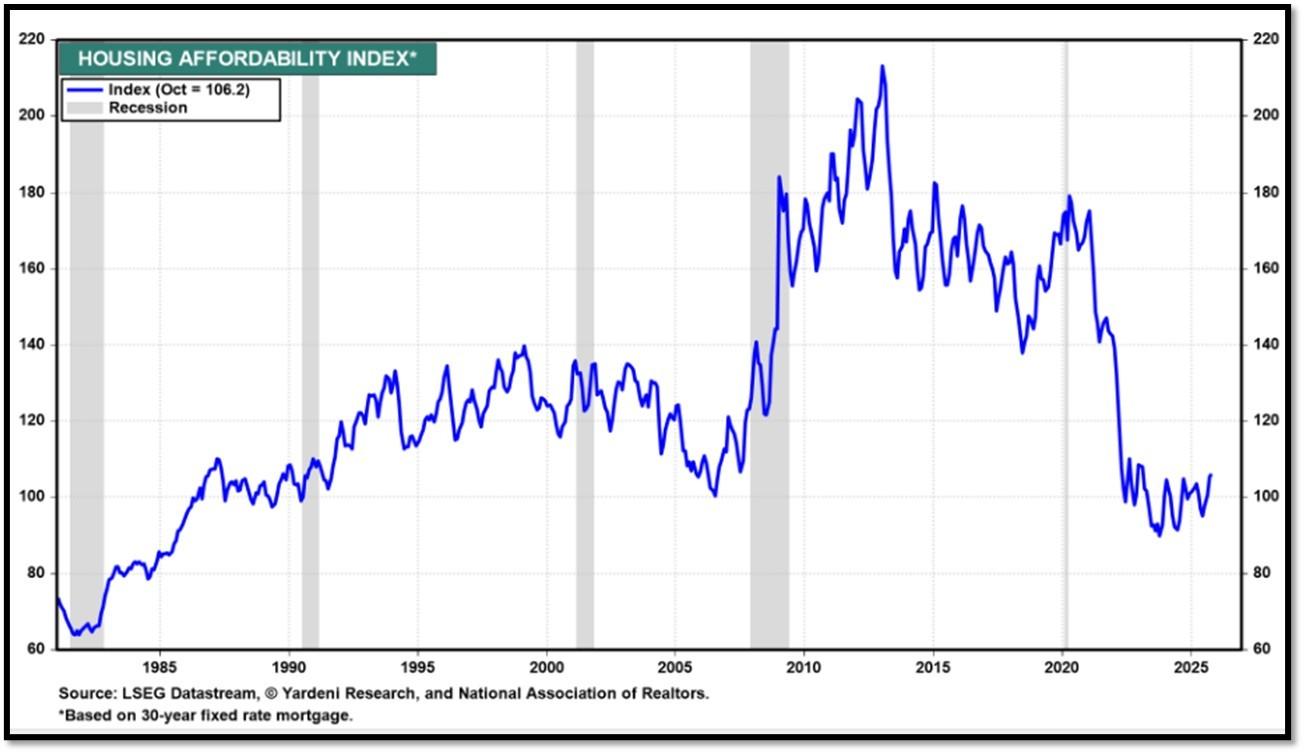
Housing Affordability Index for Oct = 106.2 // Sep = 104.5 // Aug = 100.5 // July = 98.8 // Jun = 94.4 // May = 97.2 // Apr = 101.0 // Mar = 103.2. Data provided by Yardeni Research. REF: Yardeni
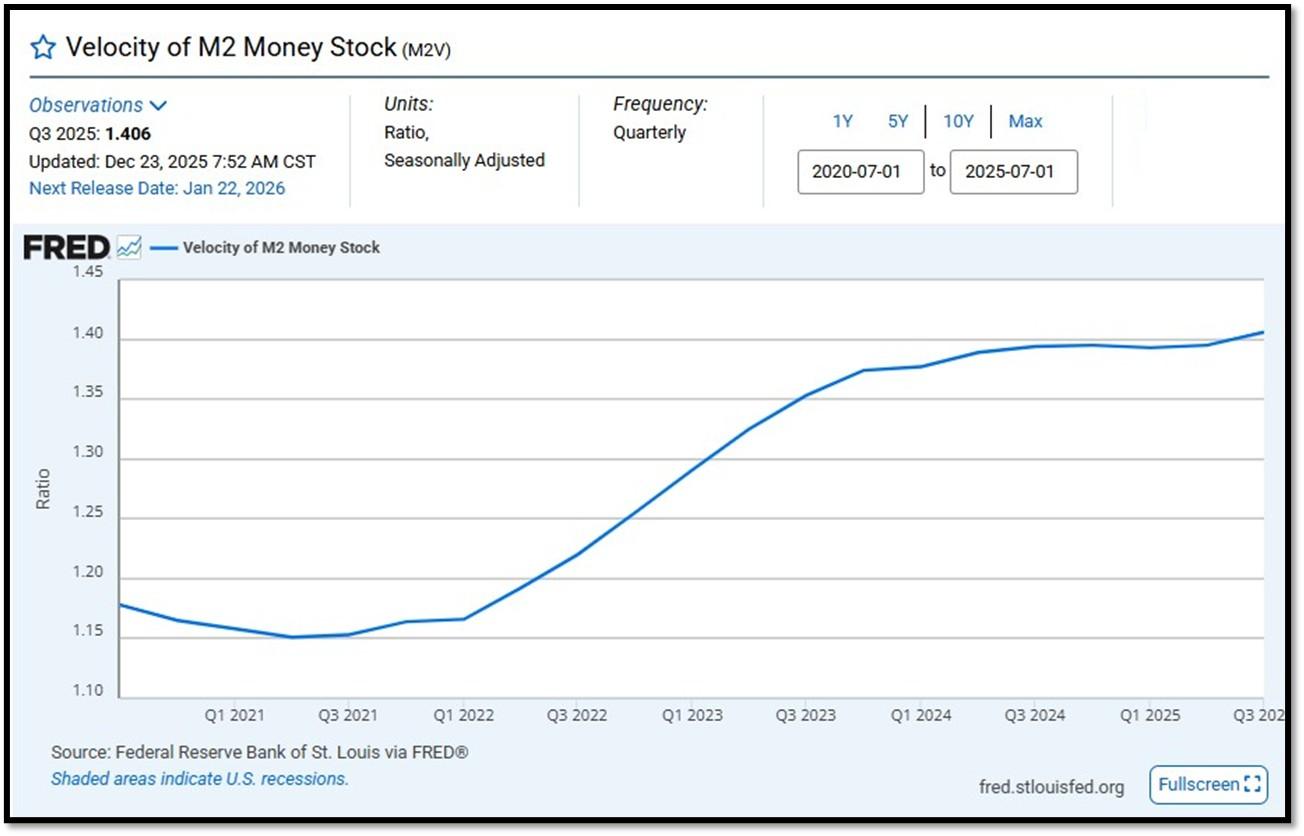
5J. Velocity of M2 Money Stock (M2V) with current read at 1.406 as of (Q3-2025 updated December 23, 2025). Previous quarter’s data was 1.392. The velocity of money is the frequency at which one unit of currency is used to purchase domestically- produced goods and services within a given time period. In other words, it is the number of times one dollar is spent to buy goods and services per unit of time. If the velocity of money is increasing, then more transactions are occurring between individuals in an economy. Current Money Stock (M2) report can be viewed in the reference link. REF: St.LouisFed-M2V
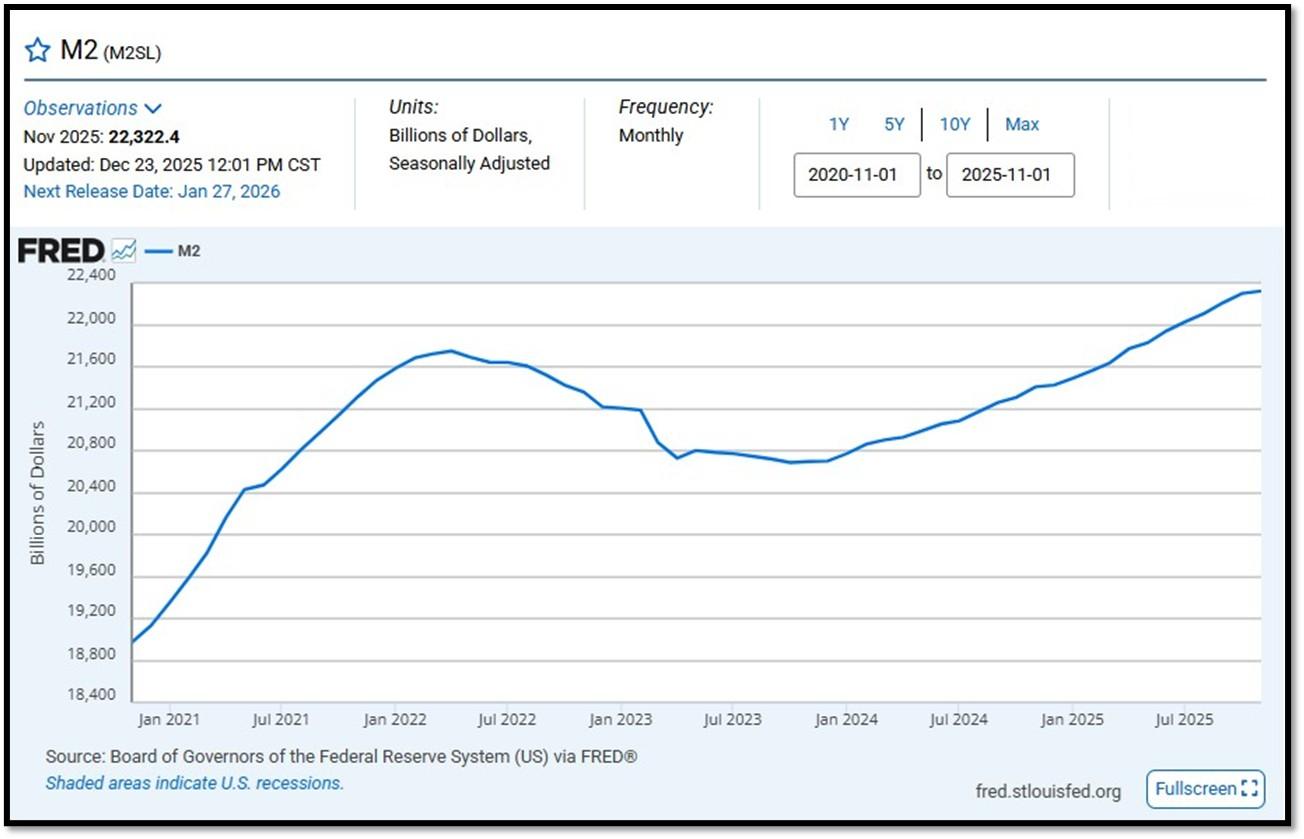
M2 consists of M1 plus (1) small-denomination time deposits (time deposits in amounts of less than $100,000) less IRA and Keogh balances at depository institutions; and (2) balances in retail MMFs less IRA and Keogh balances at MMFs. Seasonally adjusted M2 is constructed by summing savings deposits (before May 2020), small-denomination time deposits, and retail MMFs, each seasonally adjusted separately, and adding this result to seasonally adjusted M1. Board of Governors of the Federal Reserve System (US), M2 [M2SL], retrieved from FRED, Federal Reserve Bank of St. Louis; Updated on November 25, 2025. REF: St.LouisFed-M2
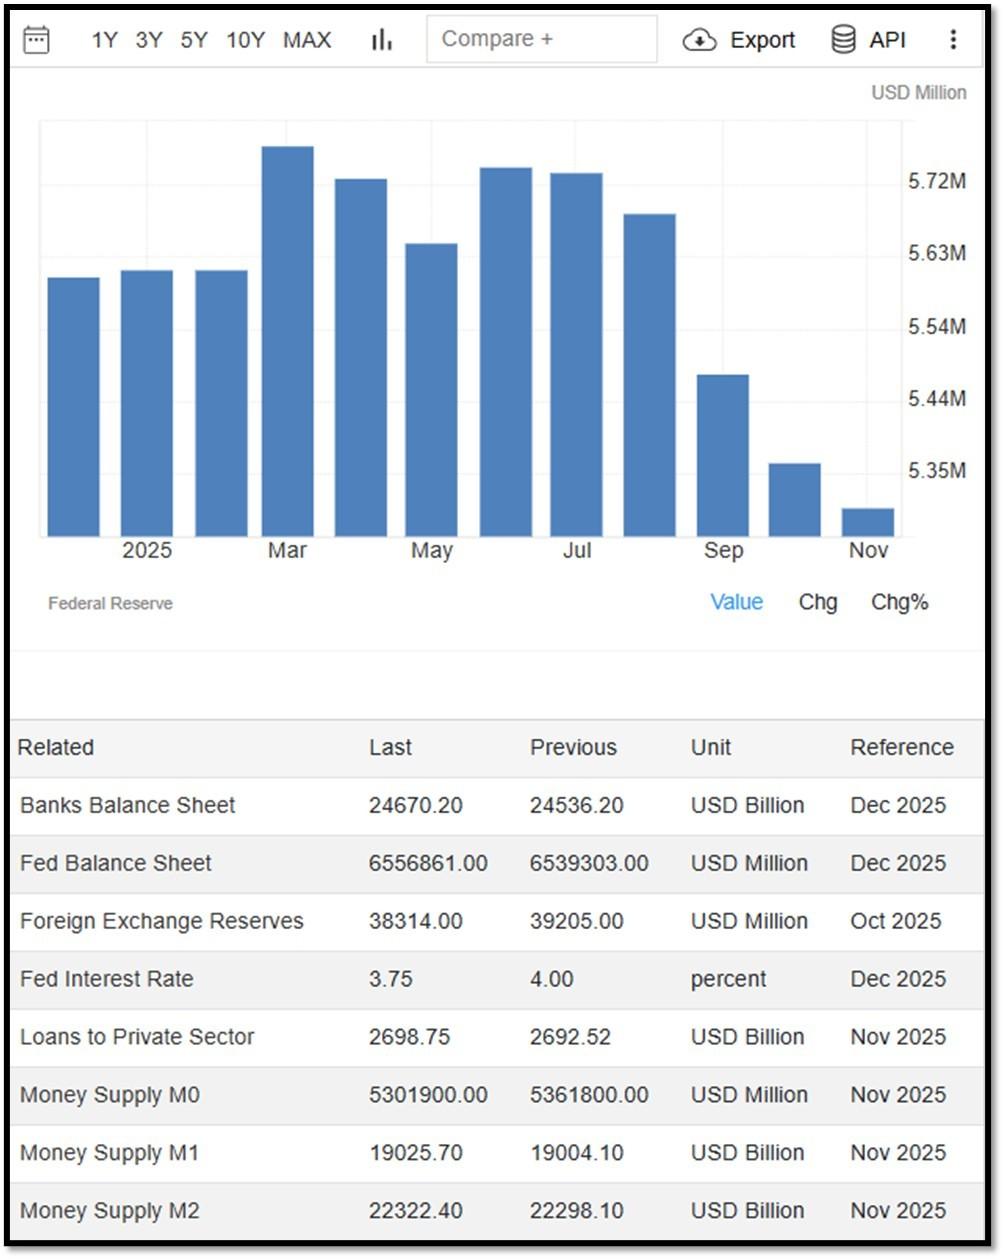
Money Supply M0 in the United States decreased to 5,301,900 USD Million in November from 5,361,800 USD Million in October of 2025. Money Supply M0 in the United States averaged 1,227,132.13 USD Million from 1959 until 2025, reaching an all-time high of 6,413,100.00 USD Million in December of 2021 and a record low of 48,400.00 USD Million in February of 1961.. REF: TradingEconomics, M0
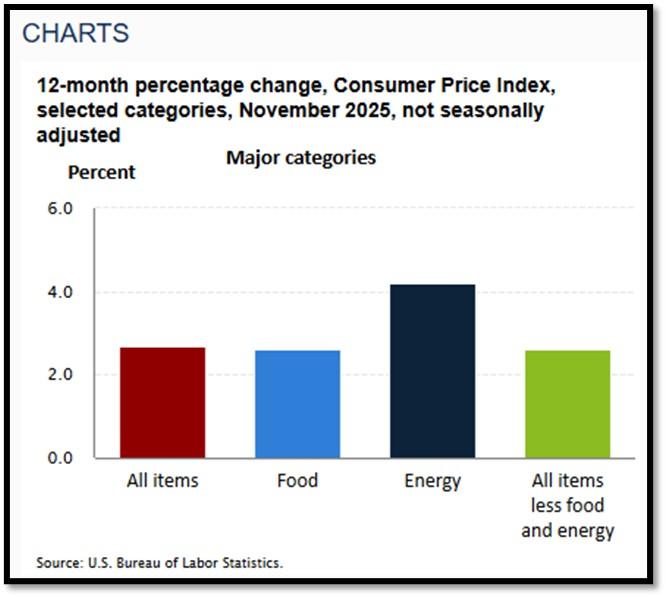
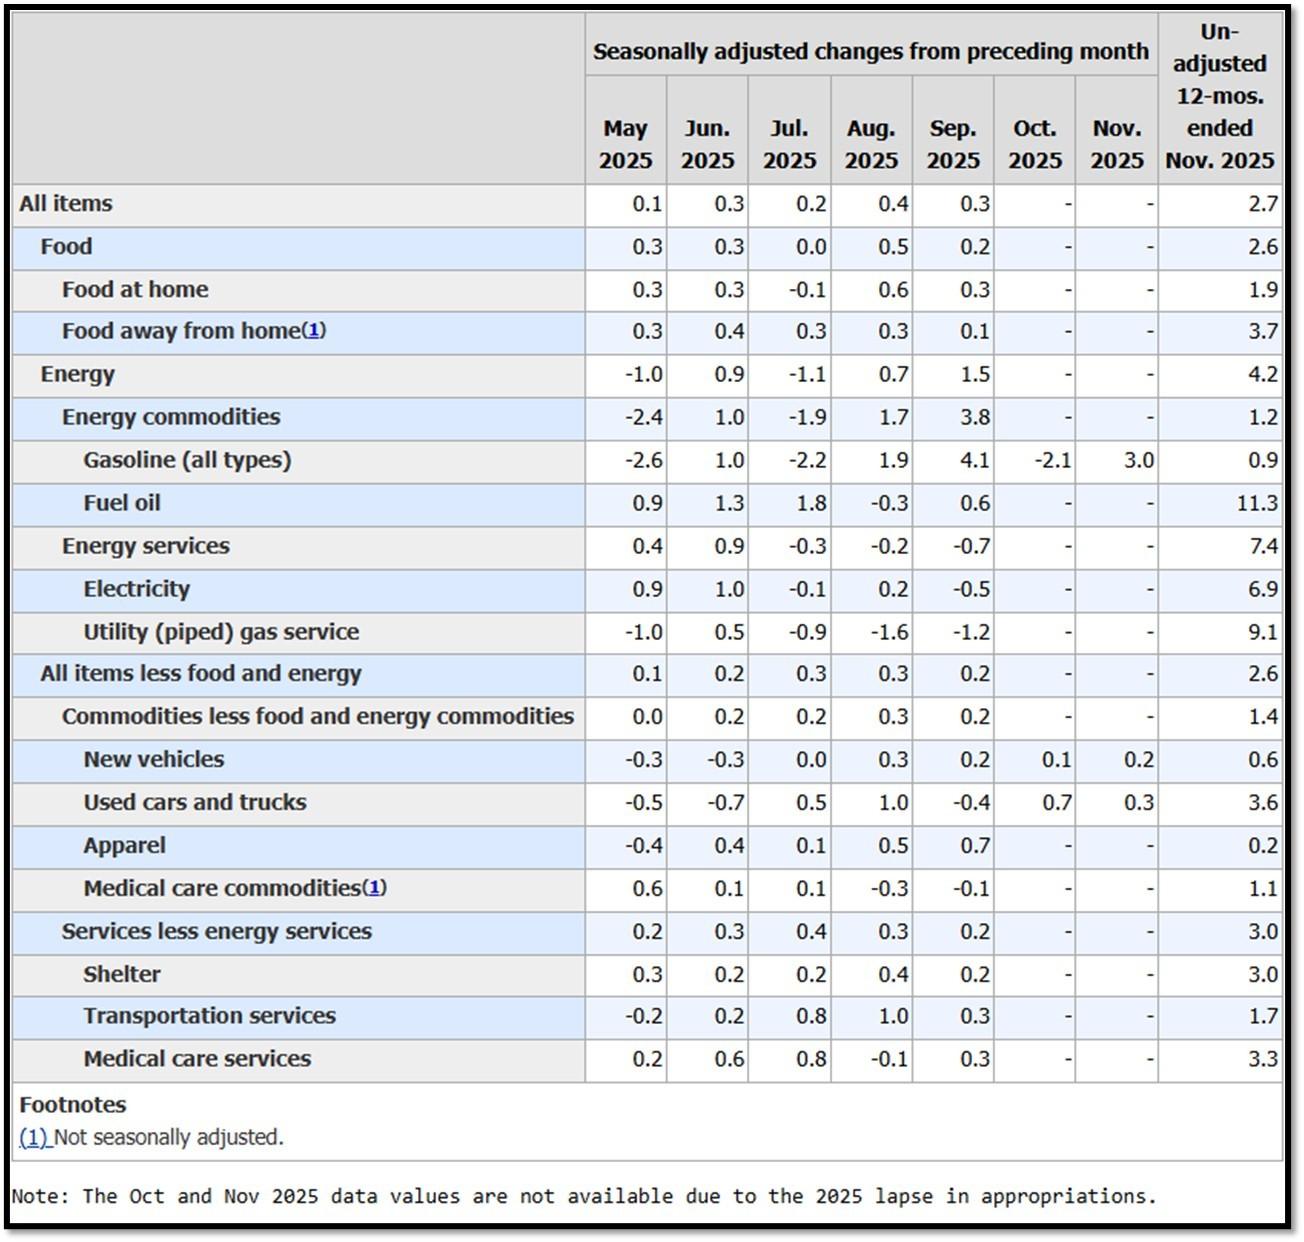
5K. In November, the Consumer Price Index for All Urban Consumers rose 2.7 percent over the last 12 months, not seasonally adjusted. The index for all items less food and energy increased 2.6 percent over the year (NSA). December 2025 CPI data are scheduled to be released on January 13, 2026, at 8:30 A.M. Eastern Time. REF: BLS, BLS.GOV
5L. Technical Analysis of the S&P500 Index. Click onto reference links below for images.
- Short-term Chart: Trend Bullish on 1/5/2026 – REF: Short-term S&P500 Chart by Marc Slavin (Click Here to Access Chart)
- Medium-term Chart: Trend Bullish on 1/5/2026 – REF: Medium-term S&P500 Chart by Marc Slavin (Click Here to Access Chart)
- Market Timing Indicators – S&P500 Index as of 1/5/2026 – REF: S&P500 Charts (7 of them) by Joanne Klein’s Top 7 (Click Here to Access Updated Charts)
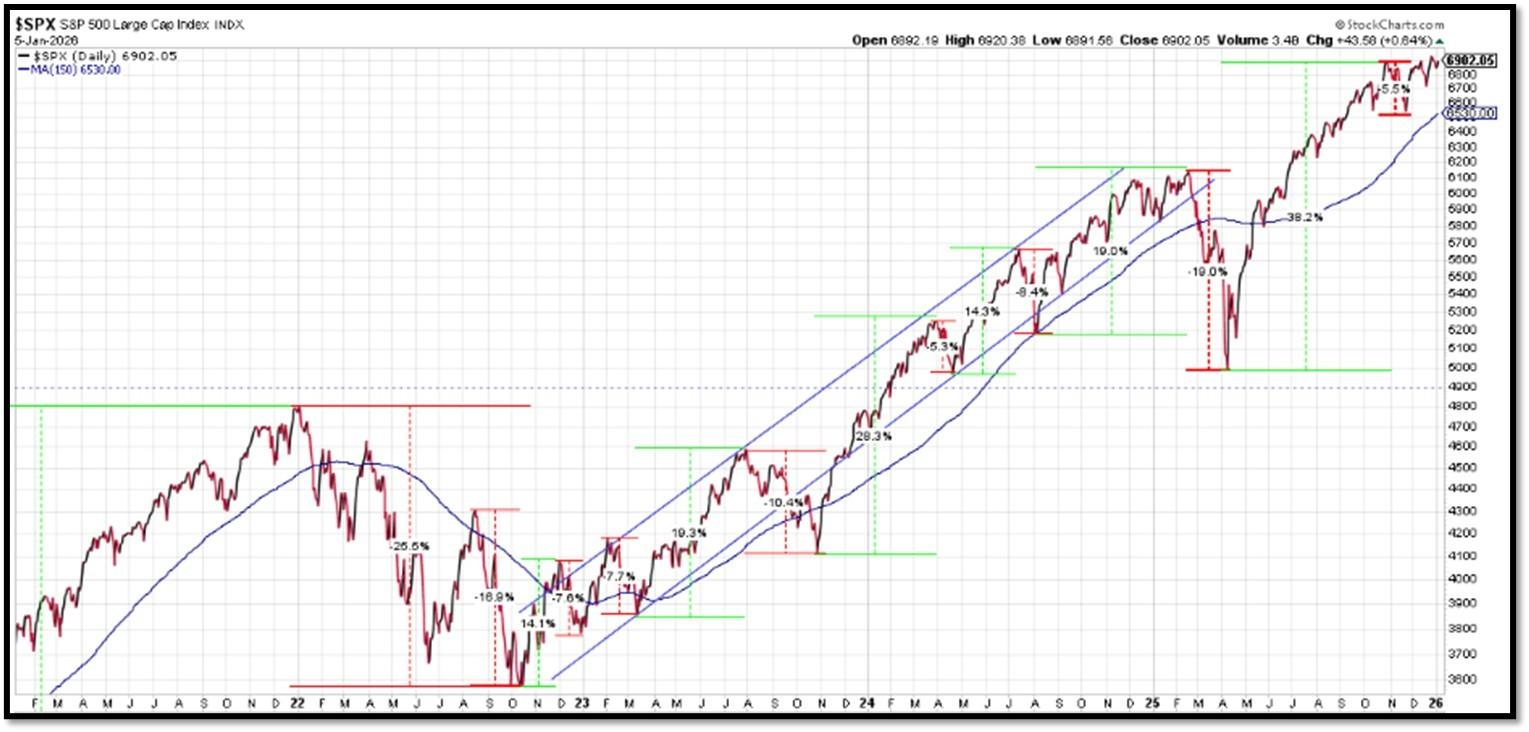
- The S&P500 is sitting near all-time-high levels, rebounding from two V-shaped recoveries. REF: Stockcharts
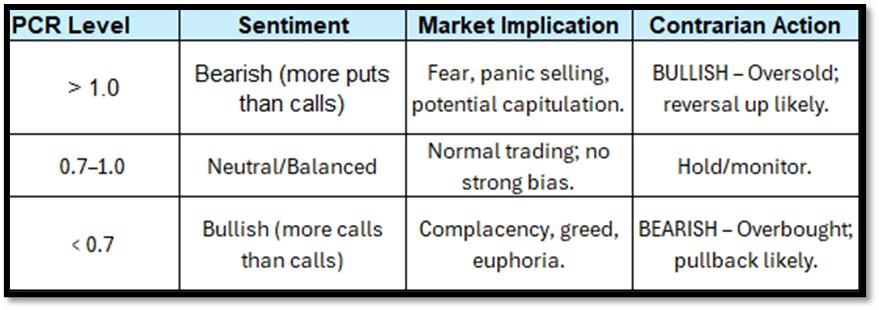
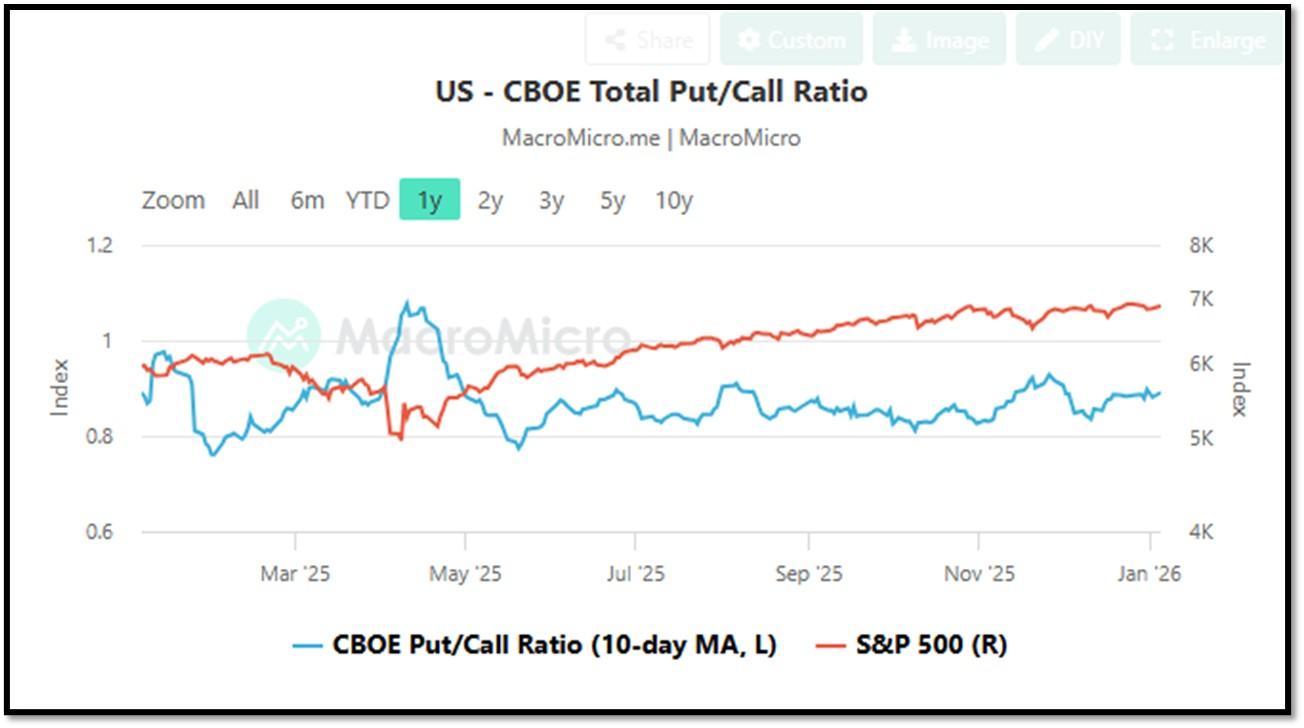
- CBOE Total Put/Call Ratio as of 1/5/2026. REF: MacroMicro
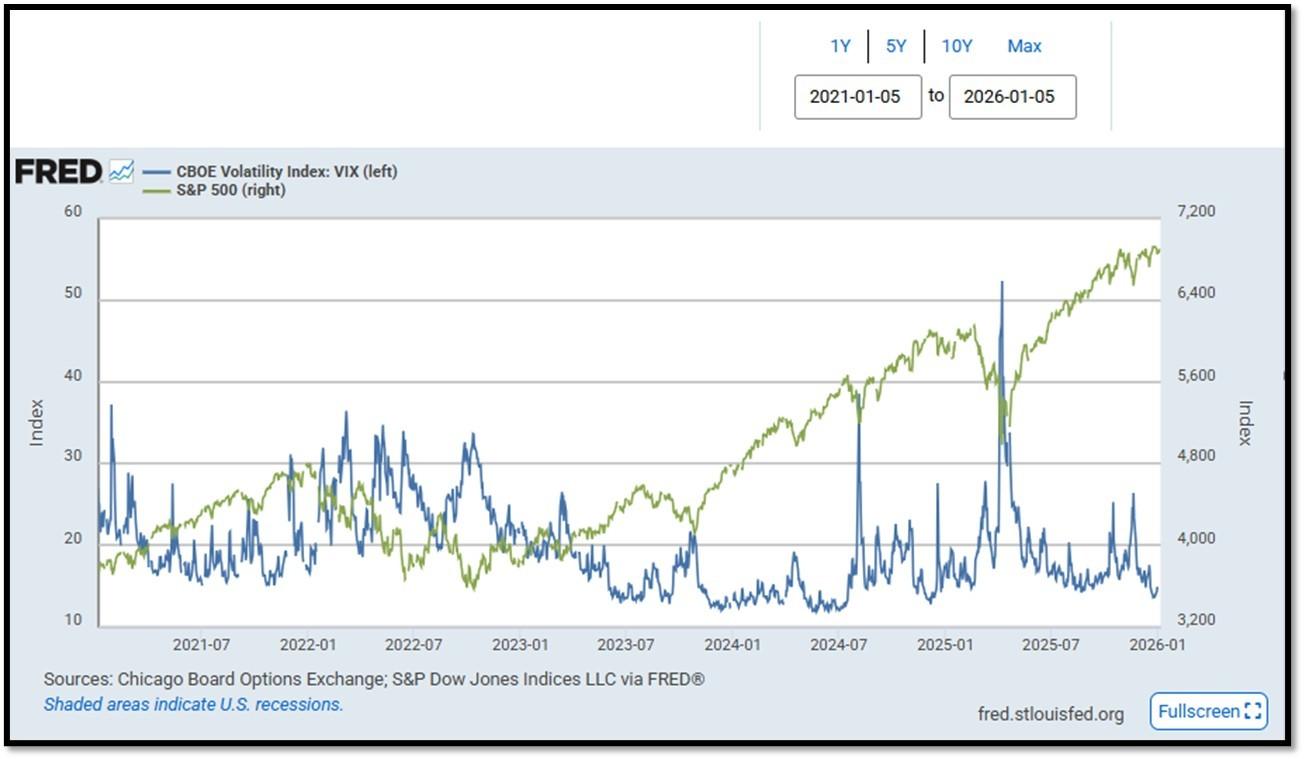
- S&P500 and CBOE Volatility Index (VIX) as of 1/5/2026. REF: FRED, Today’s Print
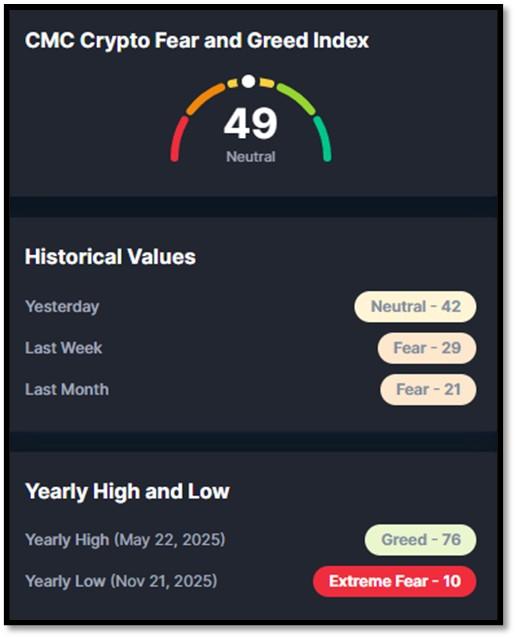
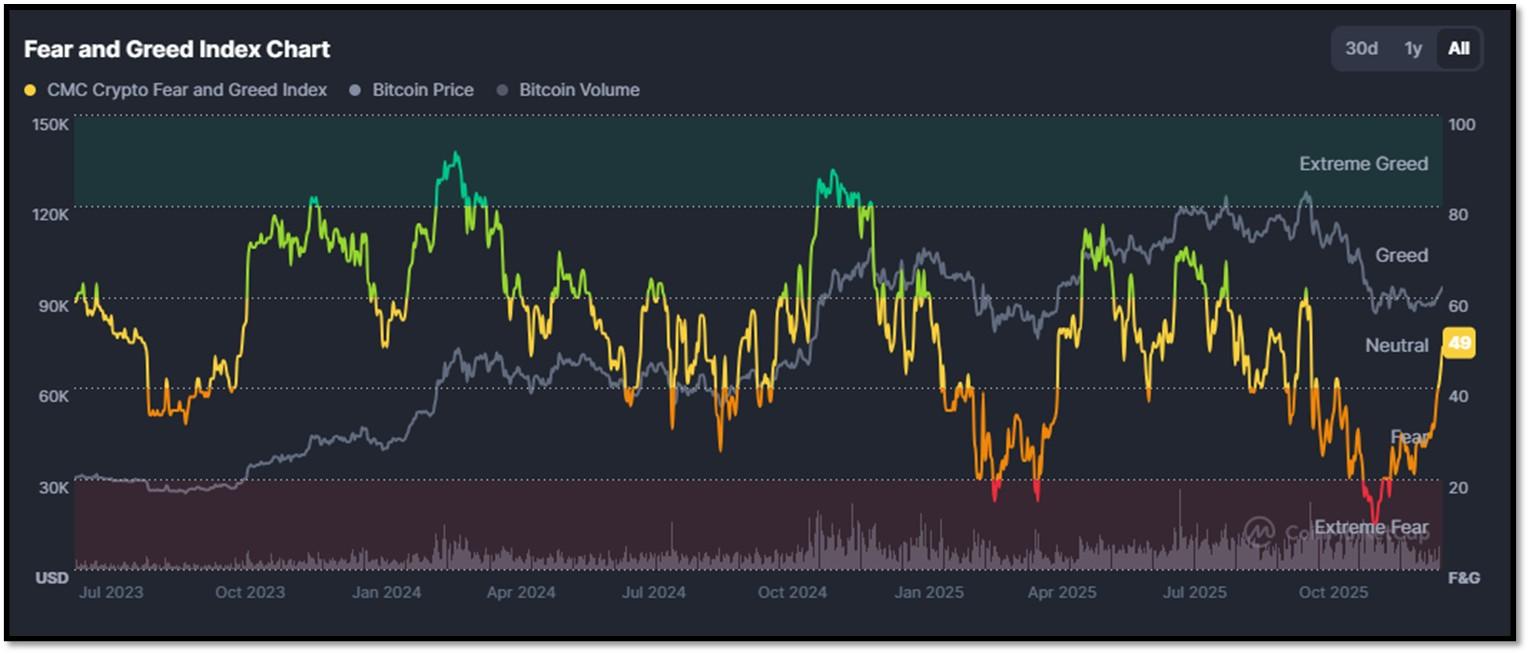
5M. Most recent read on the Crypto Fear & Greed Index with data as of 1/6/2026 is 29 (Fear). Last week’s data was 29 (Fear) (1-100). Fear & Greed Index – A Contrarian Data. The crypto market behavior is very emotional. People tend to get greedy when the market is rising which results in FOMO (Fear of missing out). Also, people often sell their coins in irrational reaction of seeing red numbers. With the Crypto Fear and Greed Index, the data try to help save investors from their own emotional overreactions. There are two simple assumptions:
- Extreme fear can be a sign that investors are too worried. That could be a buying opportunity.
- When Investors are getting too greedy, that means the market is due for a correction.
Therefore, the program for this index analyzes the current sentiment of the Bitcoin market and crunch the numbers into a simple meter from 0 to 100. Zero means “Extreme Fear”, while 100 means “Extreme Greed”. REF: Coinmarketcap.com, Today’sReading
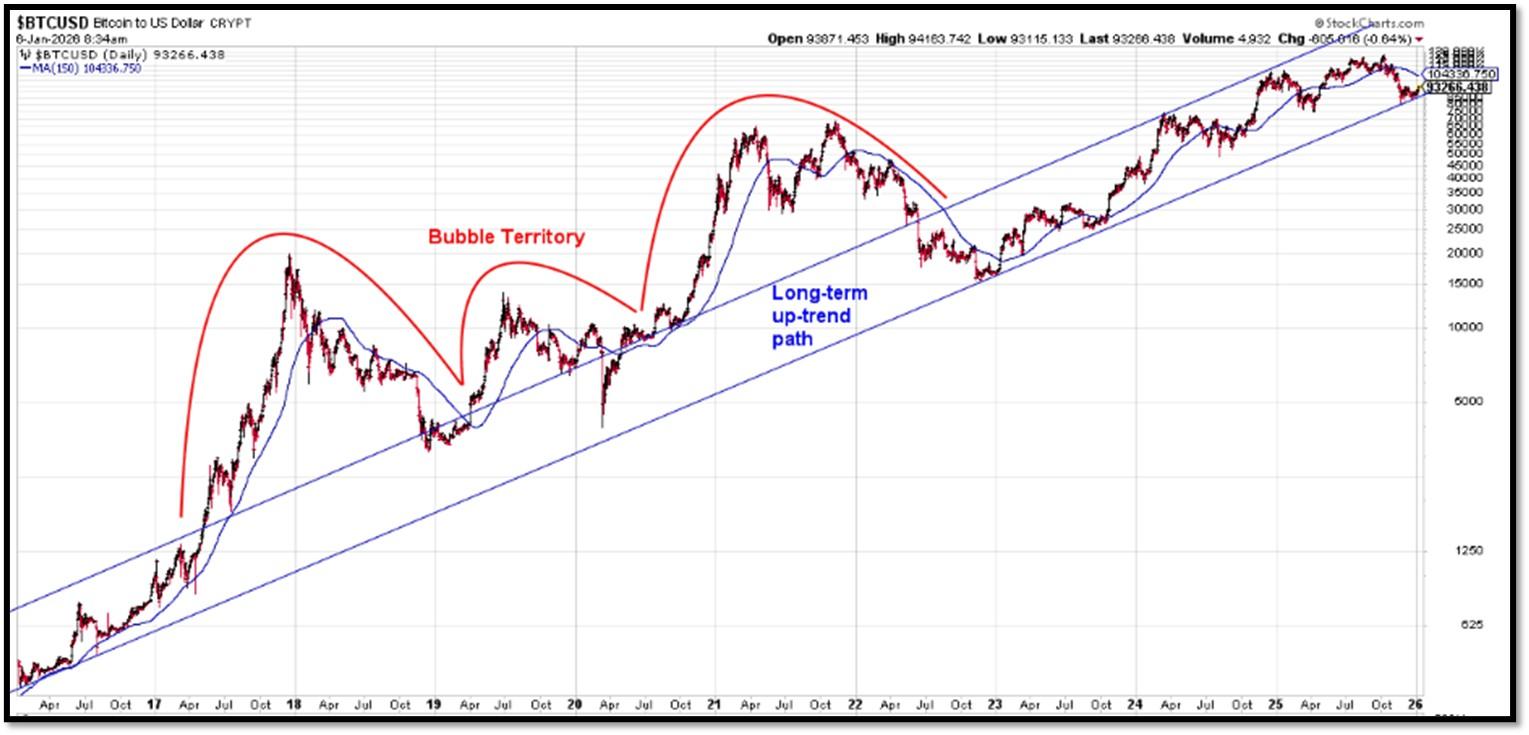
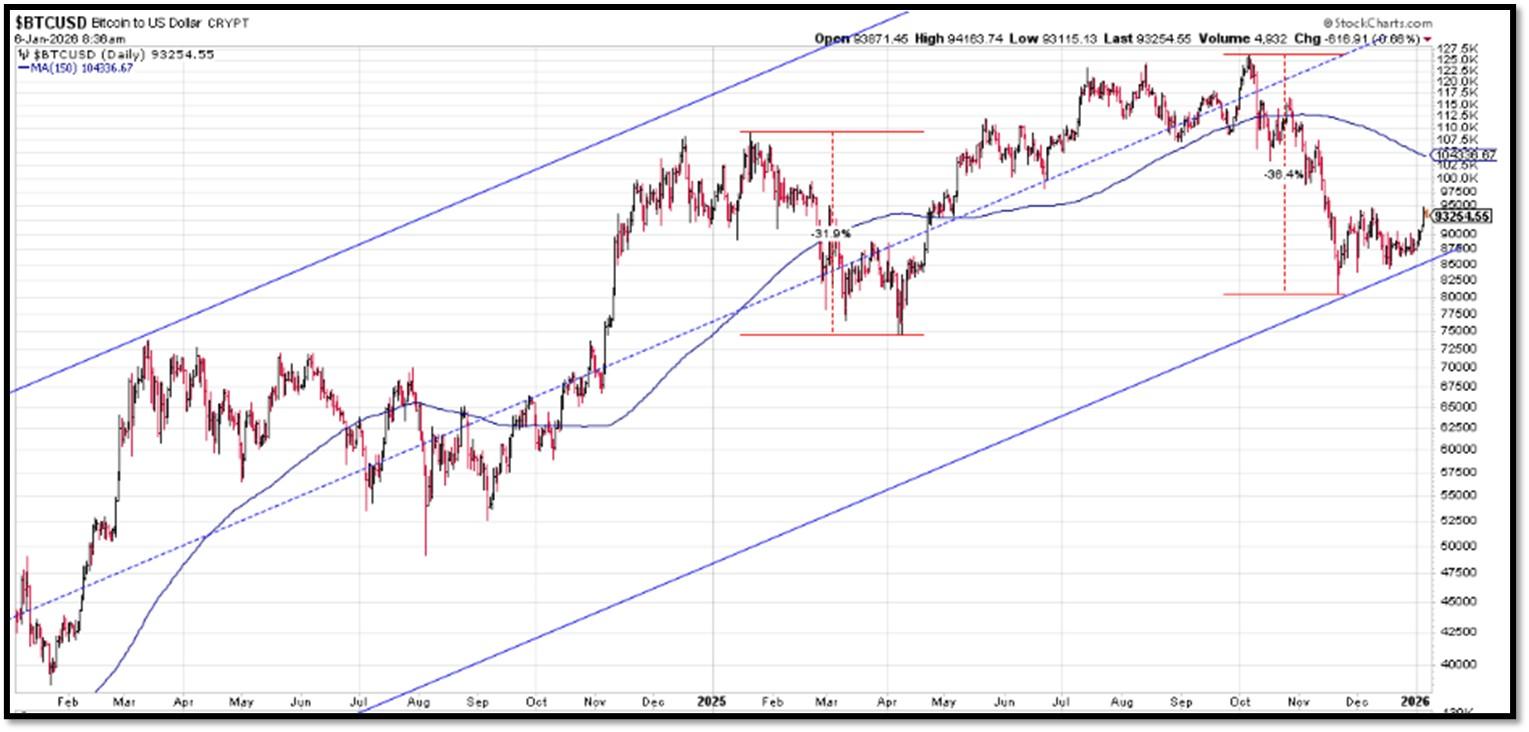
Bitcoin – 10-Year & 2-Year Charts. REF: Stockcharts10Y, Stockcharts2Y
From the desk of our Chief Investment Officer
As an investment professional with over twenty-six years of experience in the financial services industry, Andrew helps clients to protect, grow and transfer wealth during their lifetime with objective, unbiased, customized and efficient strategies.
Education, Professional Licenses Acquired & Affiliations
- Passed the Series 7, 63, 65 and 24 license examinations
- Currently holding Series 65 License
- BA in Economics – Boston University (Boston, MA) 1993
- Certificate in Commodities Trading – New York University (New York, NY) 1991
- Certificate in Financial Planning – New York University (New York, NY) April 2011
With extensive experience in the Financial Services Industry, Andrew Tang and Turner Financial Group provides disciplined wealth management with an intelligent caring approach to each and every client that compliments the Dedicated Financial offering.


Len writes much of his own content, and also shares helpful content from other trusted providers like Turner Financial Group (TFG).
The material contained herein is intended as a general market commentary, solely for informational purposes and is not intended to make an offer or solicitation for the sale or purchase of any securities. Such views are subject to change at any time without notice due to changes in market or economic conditions and may not necessarily come to pass. This information is not intended as a specific offer of investment services by Dedicated Financial and Turner Financial Group, Inc.
Dedicated Financial and Turner Financial Group, Inc., do not provide tax, legal or accounting advice. You should consult your own tax, legal and accounting advisors before engaging in any transaction.
Any hyperlinks in this document that connect to Web Sites maintained by third parties are provided for convenience only. Turner Financial Group, Inc. has not verified the accuracy of any information contained within the links and the provision of such links does not constitute a recommendation or endorsement of the company or the content by Dedicated Financial or Turner Financial Group, Inc. The prices/quotes/statistics referenced herein have been obtained from sources verified to be reliable for their accuracy or completeness and may be subject to change.
Past performance is no guarantee of future returns. Investing involves risk and possible loss of principal capital. The views and strategies described herein may not be suitable for all investors. To the extent referenced herein, real estate, hedge funds, and other private investments can present significant risks, including loss of the original amount invested. All indexes are unmanaged, and an individual cannot invest directly in an index. Index returns do not include fees or expenses.
Turner Financial Group, Inc. is an Investment Adviser registered with the United States Securities and Exchange Commission however, such registration does not imply a certain level of skill or training and no inference to the contrary should be made. Additional information about Turner Financial Group, Inc. is also available at www.adviserinfo.sec.gov. Advisory services are only offered to clients or prospective clients where Turner Financial Group, Inc. and its representatives are properly licensed or exempt from licensure. No advice may be rendered by Turner Financial Group, Inc. unless a client service agreement is in place.


