- 1. Global markets are laser-focused on two key monetary events today, March 19, 2025: the Bank of Japan’s (BoJ) interest rate decision and the FOMC meeting.
- 2. ”Androids have arrived! No mom, not the mobile phone operating system… Real androids, like a clone human.” A Breakthrough in Human-Like Robotics –
- 3. NVIDIA’s GPU Technology Conference (GTC) is a premier event that brings together developers, researchers, and industry leaders to explore advancements in artificial intelligence (AI), high-performance computing, and graphics processing.
- *With the current macro-economic backdrop, below are areas we currently favor:
- 4. World Watch
- 4A. Mark Carney, a former central banker with no elected experience, became Canada’s 24th Prime Minister on March 14, 2025, replacing Justin Trudeau after a decisive Liberal leadership win.
- 4B. China is racing ahead of the U.S. in nuclear fusion development, driven by massive investments and rapid construction, as CNBC reports.
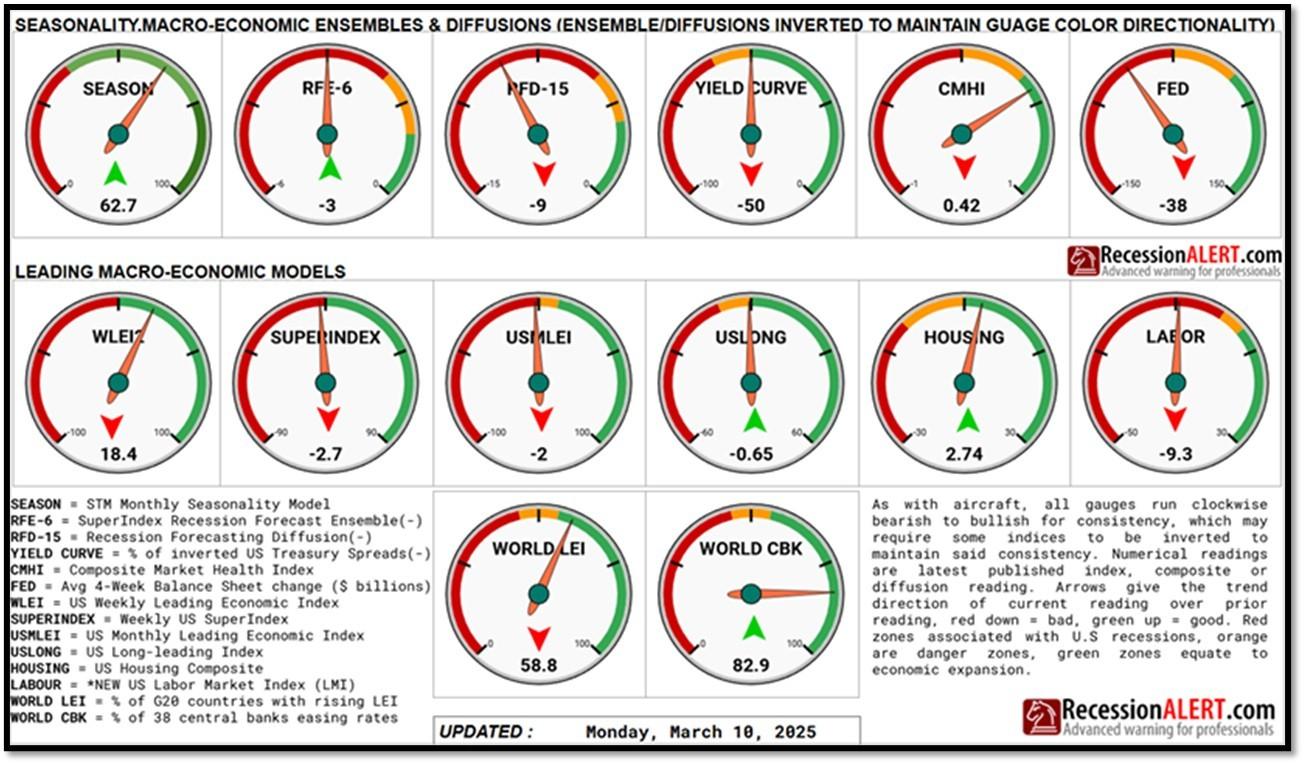
- 4C. An updated snapshot of the current global state of economy according to TradingEconomics as of 3/17/2025. REF: TradingEconomics
- 5. Quant & Technical Corner
1. Global markets are laser-focused on two key monetary events today, March 19, 2025: the Bank of Japan’s (BoJ) interest rate decision and the FOMC meeting.
The BoJ, with rates at 0.5%—the highest since 2008—may hike by 25 basis points to tame 3.0% inflation, though Governor Ueda’s comments will signal if Japan’s export-reliant economy can handle more tightening amid U.S. tariff threats. Across the Pacific, the FOMC is expected to keep rates at 4.25%-4.50%, balancing 2% inflation, a strong job market, and trade uncertainties, with Powell’s presser and the “dot plot” likely to clarify if late-2025 cuts remain on track.
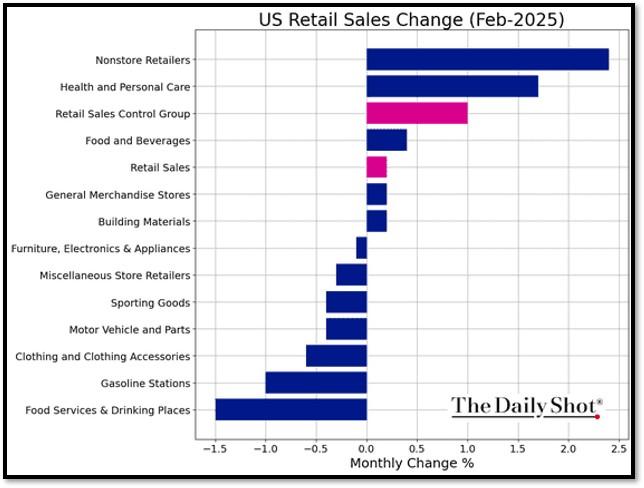
This week’s U.S. data offers context: February retail sales rose 0.6%, topping forecasts but cooling from holiday peaks, while housing starts edged up 0.8% to 1.35 million units and permits fell 1.6%, reflecting caution amid high rates. These mixed signals give the Fed pause, while Japan’s BoJ navigates its own path—both decisions poised to sway global growth, currencies, and markets in 2025. REF: DailyShot
2. ”Androids have arrived! No mom, not the mobile phone operating system… Real androids, like a clone human.” A Breakthrough in Human-Like Robotics –
Clone Alpha, developed by Clone Robotics, is a cutting-edge humanoid robot designed to closely replicate human movement and anatomy. Unlike traditional robots,it utilizes Myofiber technology, a water-powered artificial muscle system that enables natural flexibility and strength. This innovation marks a significant step toward more lifelike robotics, with potential applications across various industries.
Clone Alpha’s design mimics the human musculoskeletal system, featuring 206 bone analogs and water-powered artificial muscles that contract similarly to human muscle fibers. Its sensory system, powered by NVIDIA’s Jetson Thor AI, integrates depth cameras and pressure sensors to allow adaptive, real-time movement. Additionally, its 500-watt hydraulic system functions like a cardiovascular network, efficiently circulating fluid to power muscle contractions.
Clone Robotics began its journey in 2021, first developing robotic hands before progressing to a full humanoid form. By 2024, Clone Alpha was unveiled, showcasing remarkably human-like dexterity and responsiveness. The company plans to release 279 limited-edition units in 2025, signaling its readiness for real-world deployment. As humanoid robotics advance, Clone Alpha’s biomechanical precision and AI-driven adaptability could redefine automation in fields like manufacturing, healthcare, and personal assistance. Clone Alpha represents a breakthrough in robotics, bridging the gap between human capability and machine efficiency. With ongoing development, it has the potential to reshape industries and everyday life, bringing humanoid robots closer to practical use than ever before. You can pre-order one sometime this year. Click onto pictures below to access videos. REF: CloneRobotics, ScienceDirect, ScientificReport


3. NVIDIA’s GPU Technology Conference (GTC) is a premier event that brings together developers, researchers, and industry leaders to explore advancements in artificial intelligence (AI), high-performance computing, and graphics processing.
Held semi-annually, GTC serves as a platform for NVIDIA to showcase its latest innovations and collaborations, influencing various sectors globally.
At GTC 2025 in San Jose, CEO Jensen Huang unveiled significant developments shaping the future of AI and computing. Key announcements included the introduction of the Blackwell Ultra GPU, slated for release later this year, and the Vera Rubin AI superchip platform, expected in the second half of 2026, with an enhanced version, Vera Rubin Ultra, following in 2027. These advancements aim to meet the escalating demands of AI applications. Additionally, NVIDIA presented “Blue,” a robot developed in collaboration with Disney Research and Google DeepMind, showcasing advancements in robotics and a new physics engine named Newton. The company also introduced NVIDIA Dynamo, an open-source inference software system designed to scale AI models efficiently, and announced a partnership with General Motors to integrate custom AI systems into next-generation vehicles. Despite these groundbreaking developments, NVIDIA’s stock experienced a 3% decline during the presentation, reflecting broader market dynamics and investor sentiment. Click onto picture below to access video by CNET. REF: NVDA, CNET

*With the current macro-economic backdrop, below are areas we currently favor:
- Fixed Income – Short-term Corporates (Low-Beta)
- Fixed Income – Corporates High Yield as Opportunistic Allocation (Low-Beta)
- Businesses that contribute to and benefit from AI & Automation (Market-Risk)
- Communications (Market-Risk)
- Cyber-Security (Market-Risk)
- Financials (Market-Risk)
- Small Cap & Mid Cap Stocks (Market-Risk)
- Biotechnology (Market-Risk)
- Gold & Digital Asset – Bitcoin (Market-Risk/Hedge)
- Upgrading Non-US Equities (Market-Risk)
4. World Watch
4A. Mark Carney, a former central banker with no elected experience, became Canada’s 24th Prime Minister on March 14, 2025, replacing Justin Trudeau after a decisive Liberal leadership win.
Facing a U.S. trade war under Trump’s 25% tariffs, Carney’s financial expertise could stabilize Canada’s economy, evident in his swift moves to cut the carbon tax and streamline the cabinet. However, his unelected rise risks democratic backlash, potentially boosting Conservative rival Pierre Poilievre’s campaign in a looming snap election.
Carney’s retaliatory tariff stance and planned European outreach aim to counter U.S. pressure and diversify alliances, critical as Canada teeters on recession. While his globalist credentials may strengthen international ties, they could also alienate voters skeptical of his elite background, setting the stage for a contentious election by October 20—or sooner—where his economic savvy will be tested against his political inexperience. Click onto picture below to access video. REF: WSJ

4B. China is racing ahead of the U.S. in nuclear fusion development, driven by massive investments and rapid construction, as CNBC reports.
With AI power demands soaring, China’s $1.5 billion annual spending—double the U.S.’s $800 million—funds projects like the giant Mianyang laser-fusion facility and the $700 million CRAFT campus, leveraging its command economy for speed and scale. The U.S., once a fusion pioneer, is lagging due to outdated infrastructure and slower funding. While American startups like Helion target commercial fusion by 2028 with $8 billion in private investment, China’s ability to replicate designs and build efficiently could see it dominate a $1 trillion market by 2050, especially as AI-driven energy needs escalate. Click onto 2 pictures below to access videos. REF: CNBC, USDOE, TWI-UK

|
Feature |
Nuclear Fission |
Nuclear Fusion |
|
Definition |
Splitting of a heavy atomic nucleus into smaller nuclei, releasing energy. |
Combining two light atomic nuclei to form a heavier nucleus, releasing energy. |
|
Fuel Used |
Typically, Uranium-235 or Plutonium-239. |
Typically Hydrogen isotopes (Deuterium and Tritium). |
|
Energy Output |
Produces a significant amount of energy but less than fusion. |
Produces much more energy than fission. |
|
Reaction Conditions |
Can be sustained at room temperature under controlled conditions. |
Requires extremely high temperature and pressure (millions of degrees). |
|
Byproducts |
Produces radioactive waste, which needs long-term management. |
Produces minimal radioactive waste, mostly harmless helium. |
|
Safety Risks |
Risk of nuclear meltdowns (e.g., Chernobyl, Fukushima) and radioactive contamination. |
No meltdown risk, but requires extreme containment due to high temperatures. |
|
Usage |
Used in nuclear power plants and atomic bombs. |
Currently under research for energy production; powers the Sun and hydrogen bombs. |
|
Sustainability |
Limited fuel supply and radioactive waste pose long-term challenges. |
More sustainable, as hydrogen fuel (from water) is abundant. |
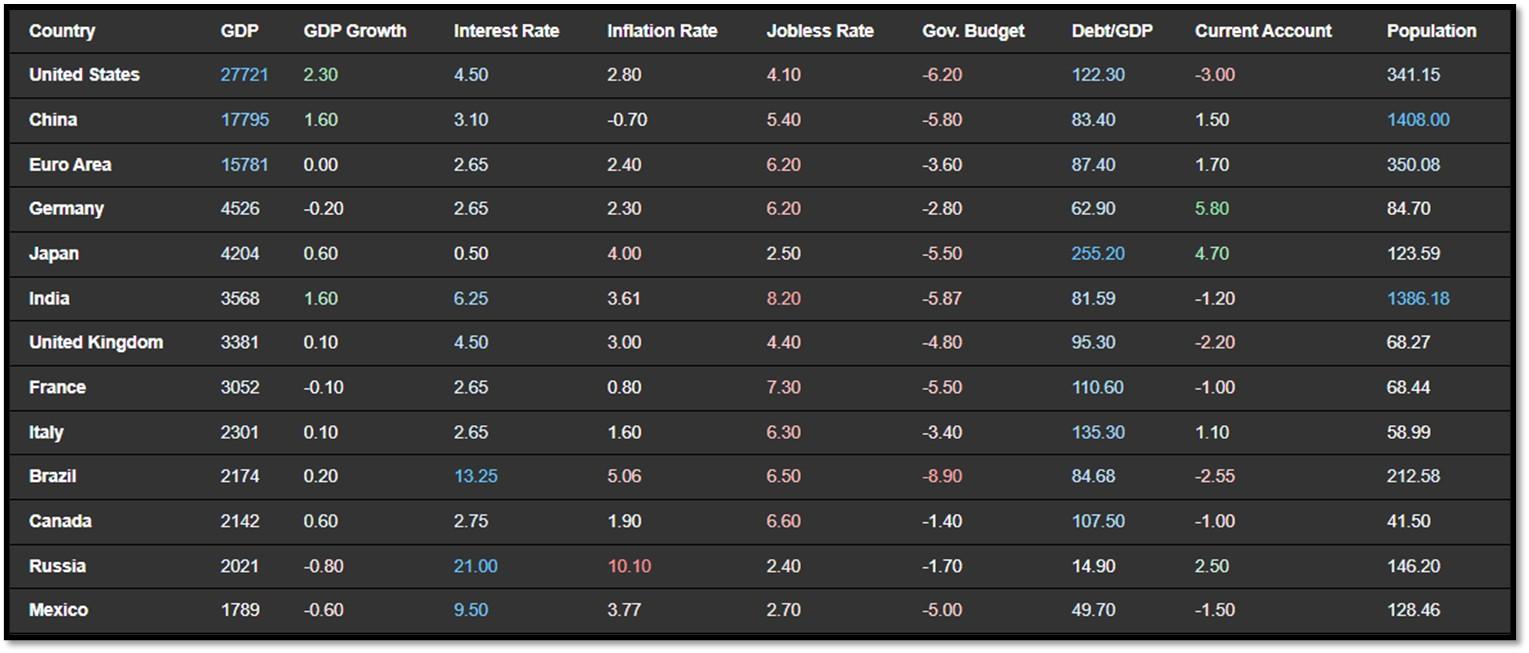
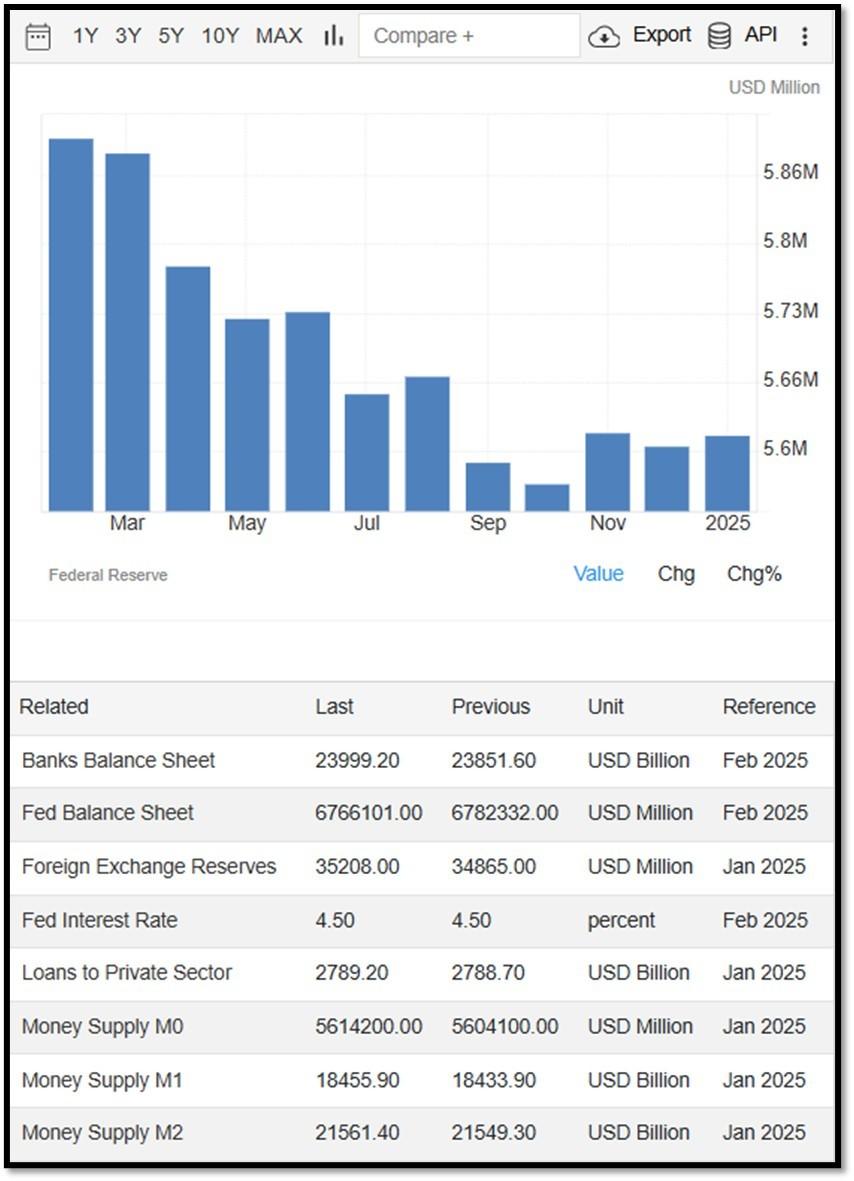
4C. An updated snapshot of the current global state of economy according to TradingEconomics as of 3/17/2025. REF: TradingEconomics
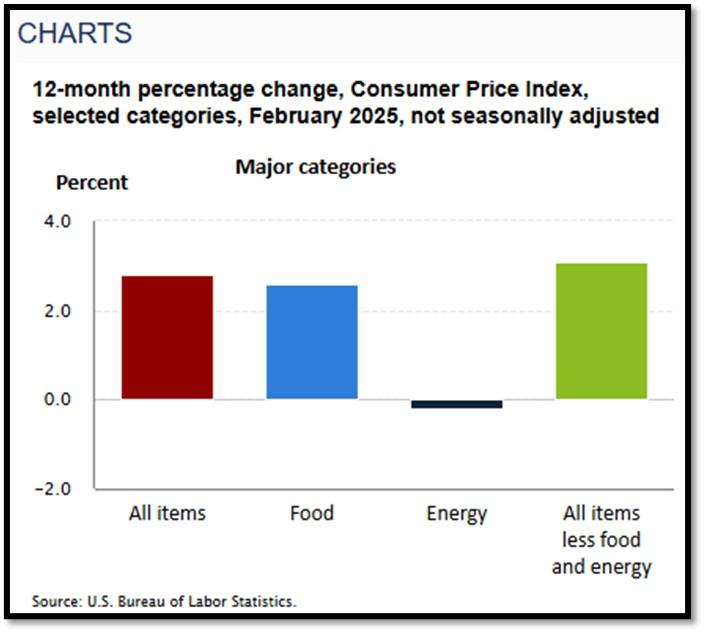
- The annual inflation rate in the US eased to 2.8% in February 2025 from 3% in January, below forecasts of 2.9%. Energy costs declined 0.2% year-on-year, following a 1% rise in January which was the first increase in six months.
- China’s surveyed unemployment rate edged higher to 5.4% in February 2025 from 5.2% in the previous month, compared to market expectations of 5.1%.
- Japan’s GDP grew by 0.6% qoq in Q4 2024, below the flash estimate of 0.7% but higher than an upwardly revised 0.4% expansion in Q3, marking the third consecutive quarter of growth.
- The gross domestic product in India expanded 1.6% quarter-on-quarter in the three months to December 2024, accelerating from a 1.4% growth in the previous period, marking the fastest economic expansion in three quarters, according to OECD.
5. Quant & Technical Corner
Below is a selection of quantitative & technical data we monitor on a regular basis to help gauge the overall financial market conditions and the investment environment.
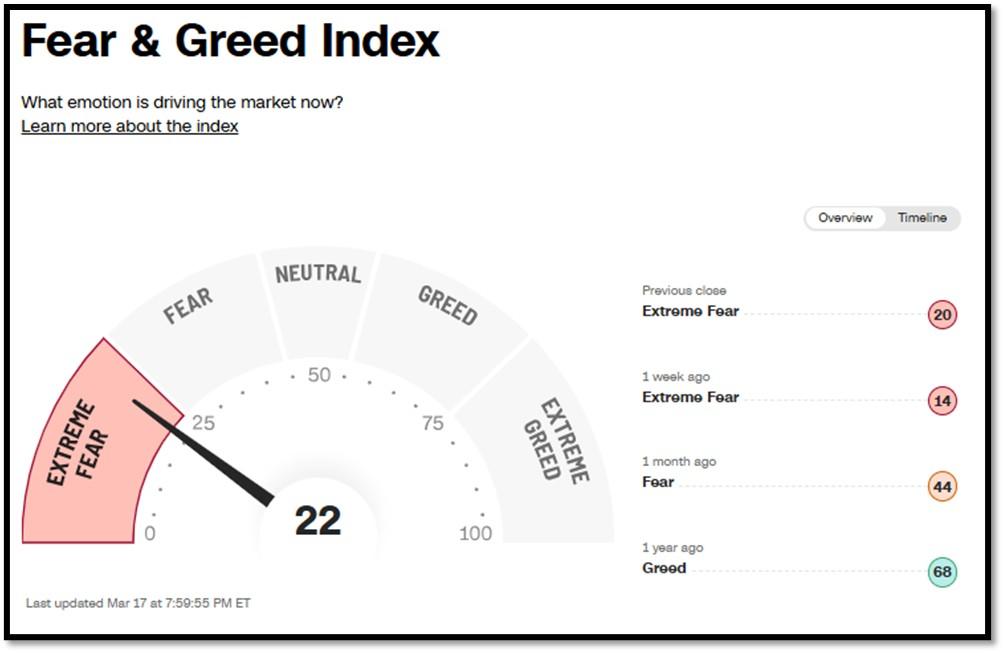
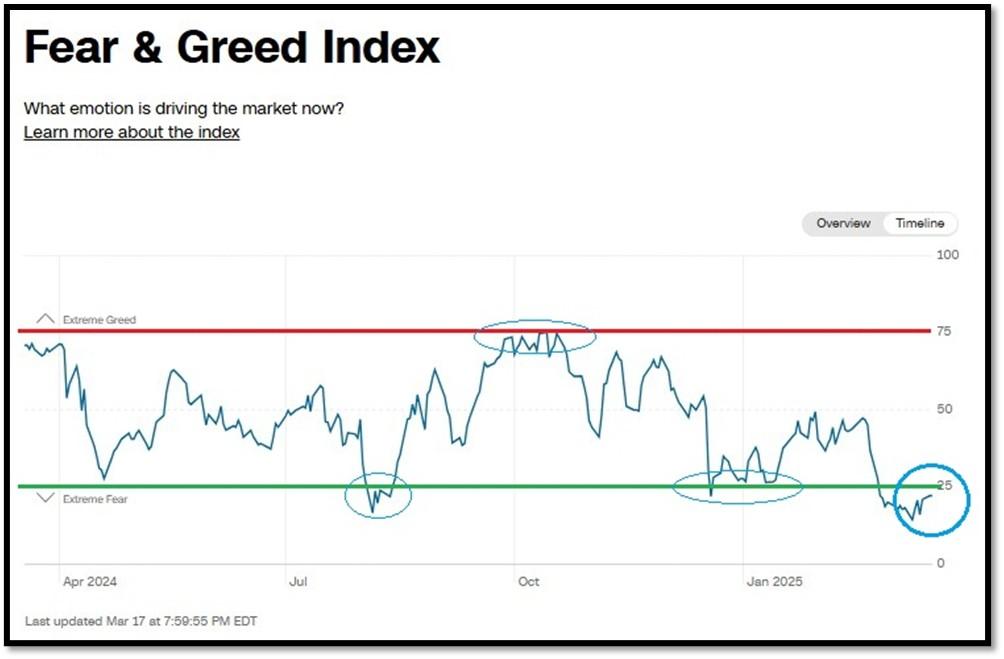
5A. Most recent read on the Fear & Greed Index with data as of 3/17/2025 – 7:59PM-ET is 22 (Extreme Fear). Last week’s data was 14 (Extreme Fear) (1-100). CNNMoney’s Fear & Greed index looks at 7 indicators (Stock Price Momentum, Stock Price Strength, Stock Price Breadth, Put and Call Options, Junk Bond Demand, Market Volatility, and Safe Haven Demand). Keep in mind this is a contrarian indicator! REF: Fear&Greed via CNNMoney
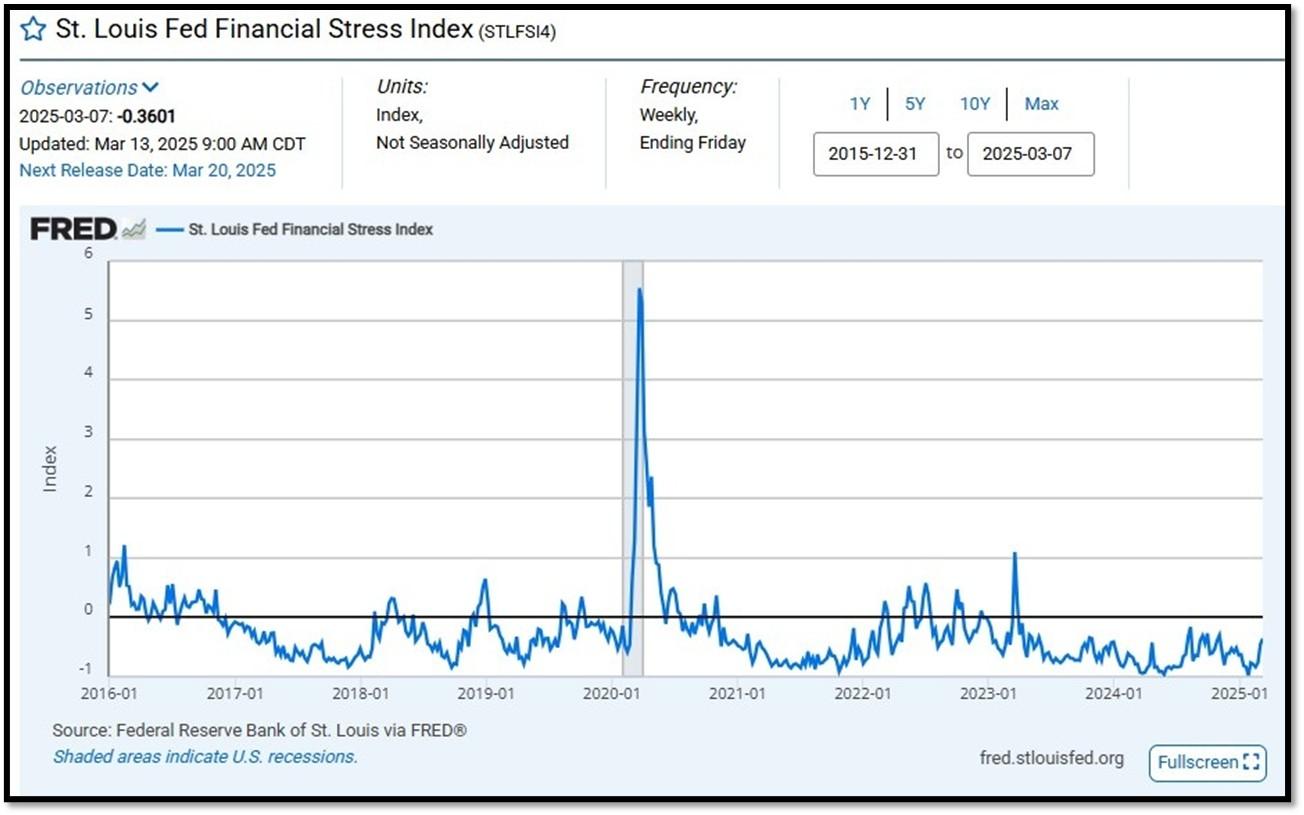
5B. St. Louis Fed Financial Stress Index’s (STLFSI4) most recent read is at –0.3601 as of March 13, 2025. Previous week’s data was -0.4518. A big spike up from previous readings reflecting the turmoil in the banking sector back in 2023. This weekly index is not seasonally adjusted. The STLFSI4 measures the degree of financial stress in the markets and is constructed from 18 weekly data series: seven interest rate series, six yield spreads and five other indicators. Each of these variables captures some aspect of financial stress. Accordingly, as the level of financial stress in the economy changes, the data series are likely to move together. REF: St. Louis Fed
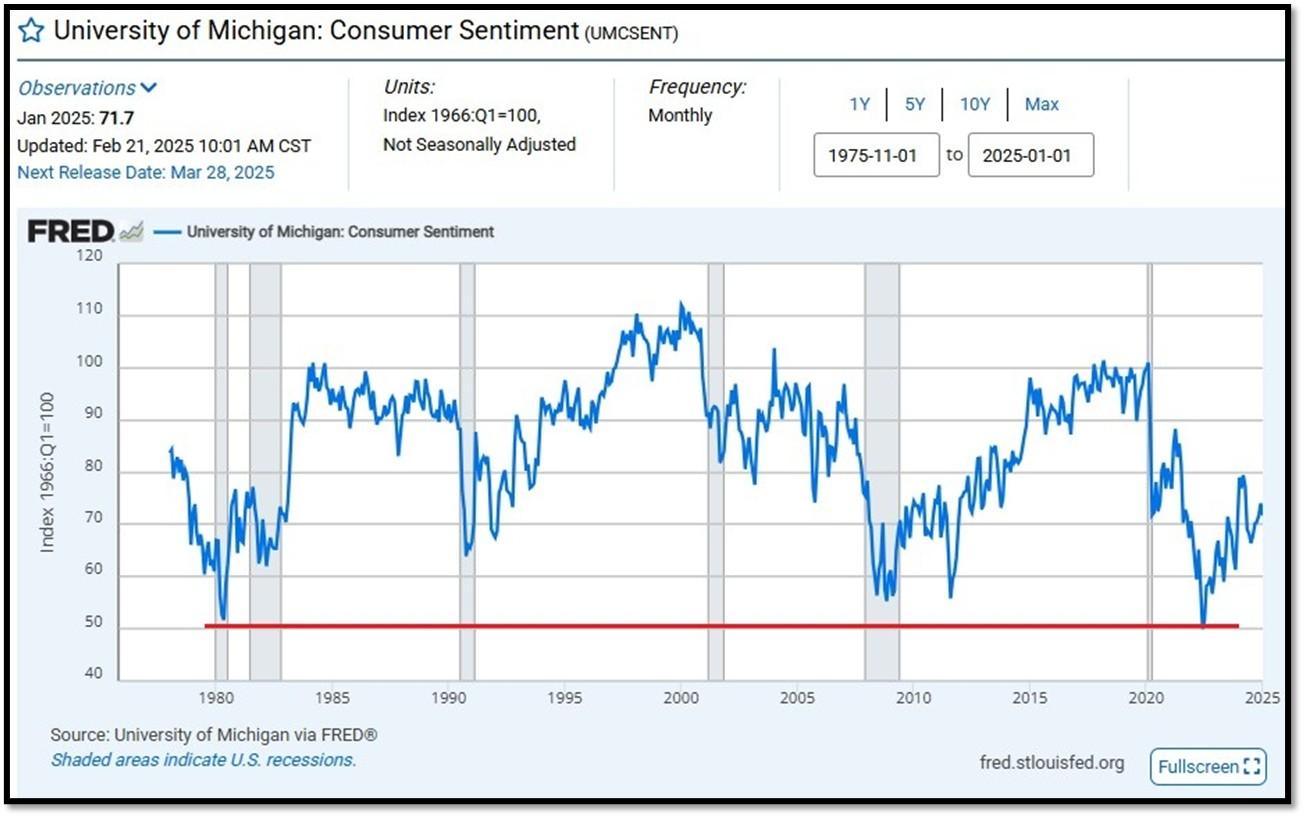
5C. University of Michigan, University of Michigan: Consumer Sentiment for January [UMCSENT] at 71.7, retrieved from FRED, Federal Reserve Bank of St. Louis, February 21, 2025. Back in June 2022, Consumer Sentiment hit a low point going back to April 1980. REF: UofM
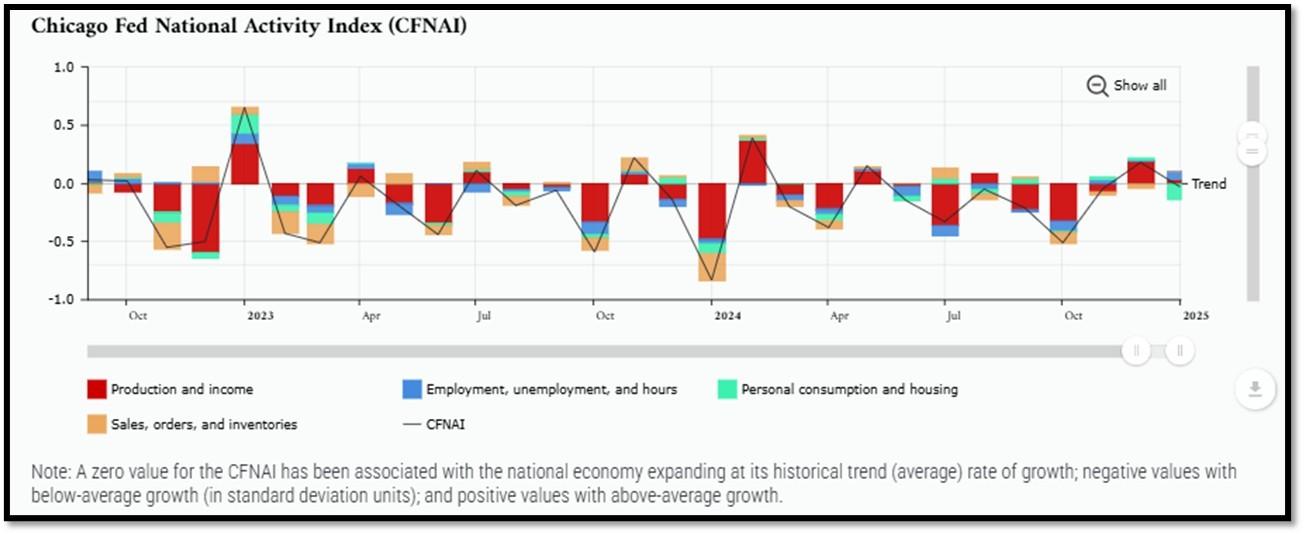
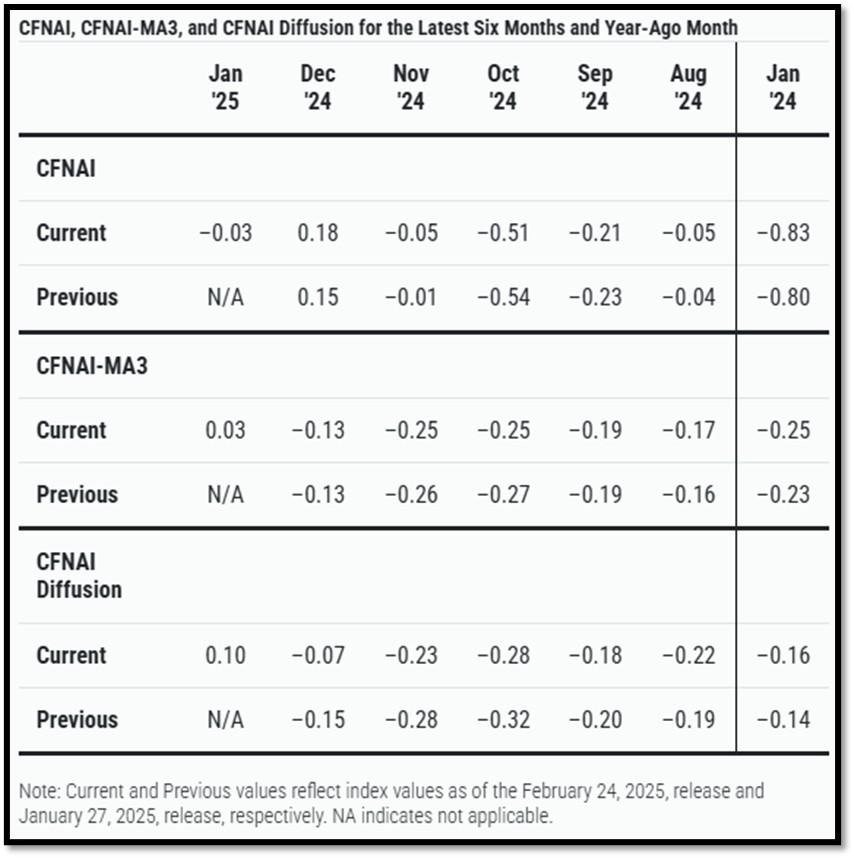
5D. The Chicago Fed National Activity Index (CFNAI) decreased to –0.03 in January from +0.18 in December. Two of the four broad categories of indicators used to construct the index decreased from December, and one category made a negative contribution in January. The index’s three-month moving average, CFNAI-MA3, increased to +0.03 in January from –0.13 in December. REF: ChicagoFed, January’s Report
5E. (2/20/2025) The Conference Board Leading Economic Index (LEI) for the US fell by 0.3% in January 2025 to 101.5 (2016=100), after a 0.1% increase in December 2024 (upwardly revised from an initially estimated decline of 0.1%). Overall, the LEI recorded a 0.9% decline in the six-month period ending January 2025, much less than its 1.7% decline over the previous six months. The composite economic indexes are the key elements in an analytic system designed to signal peaks and troughs in the business cycle. The indexes are constructed to summarize and reveal common turning points in the economy in a clearer and more convincing manner than any individual component. The CEI is highly correlated with real GDP. The LEI is a predictive variable that anticipates (or “leads”) turning points in the business cycle by around 7 months. Shaded areas denote recession periods or economic contractions. The dates above the shaded areas show the chronology of peaks and troughs in the business cycle. The ten components of The Conference Board Leading Economic Index® for the U.S. include: Average weekly hours in manufacturing; Average weekly initial claims for unemployment insurance; Manufacturers’ new orders for consumer goods and materials; ISM® Index of New Orders; Manufacturers’ new orders for nondefense capital goods excluding aircraft orders; Building permits for new private housing units; S&P 500® Index of Stock Prices; Leading Credit Index™; Interest rate spread (10-year Treasury bonds less federal funds rate); Average consumer expectations for business conditions. REF: ConferenceBoard, LEI Report for January (Released on 3/2/2025)
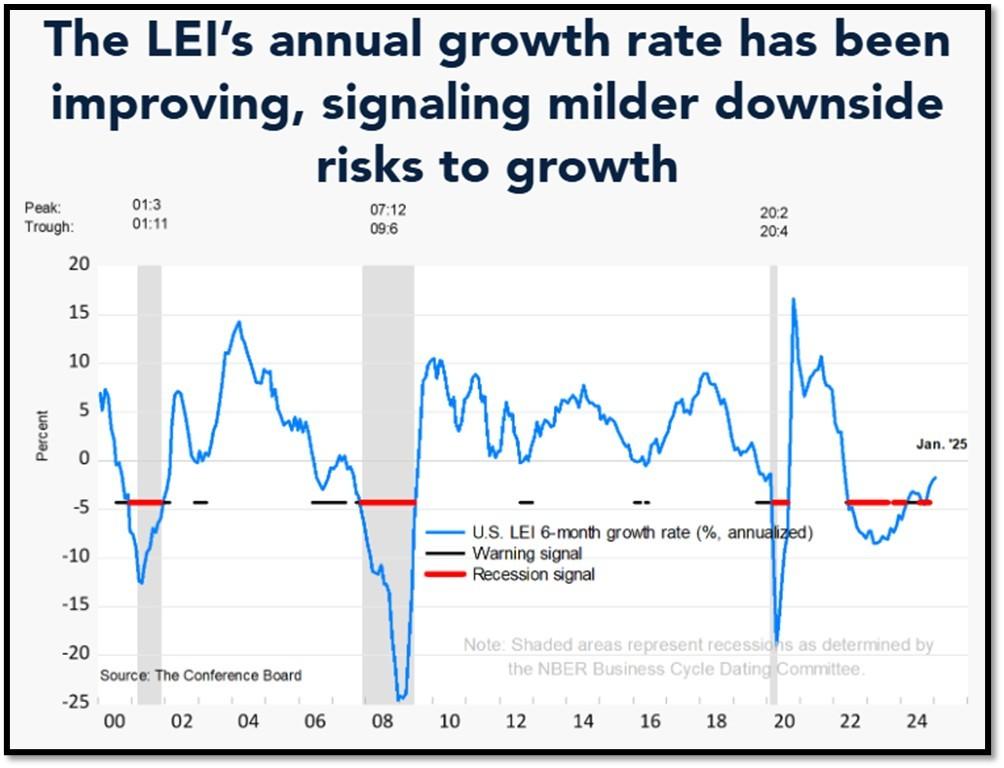
We have experienced a “rolling recession” since June 2022 and are only now emerging from it. However, authorities are not labeling it a recession due to high employment data.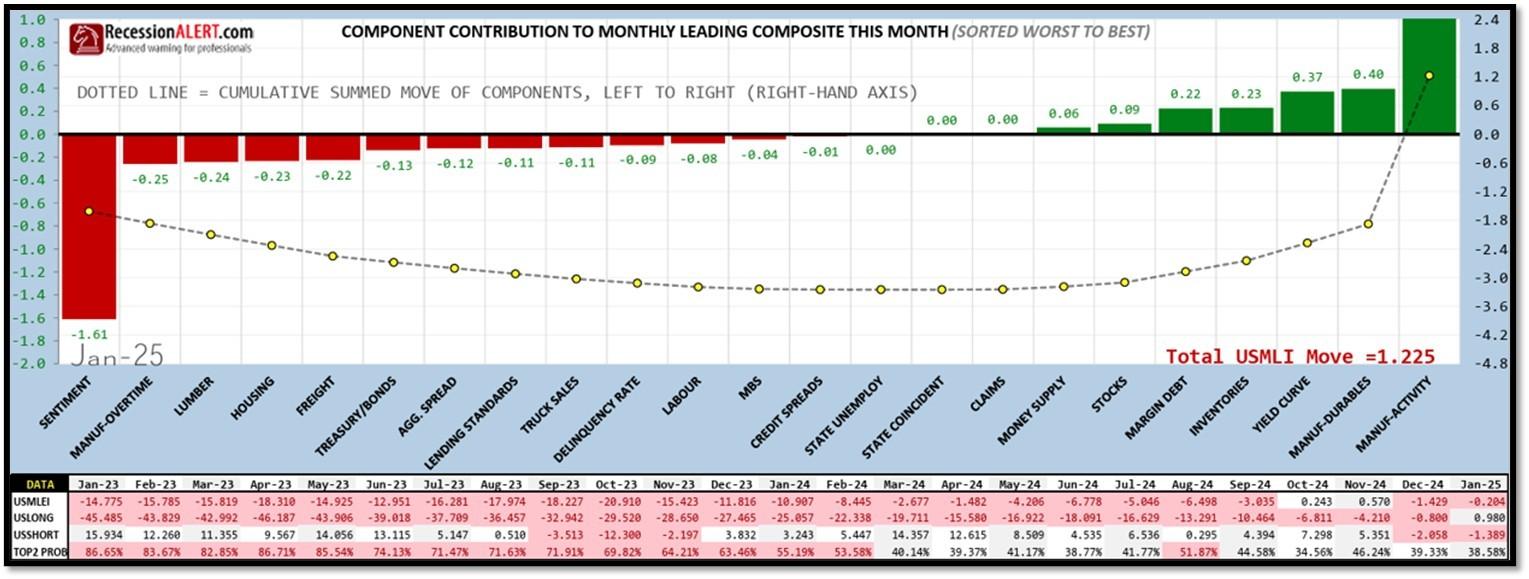
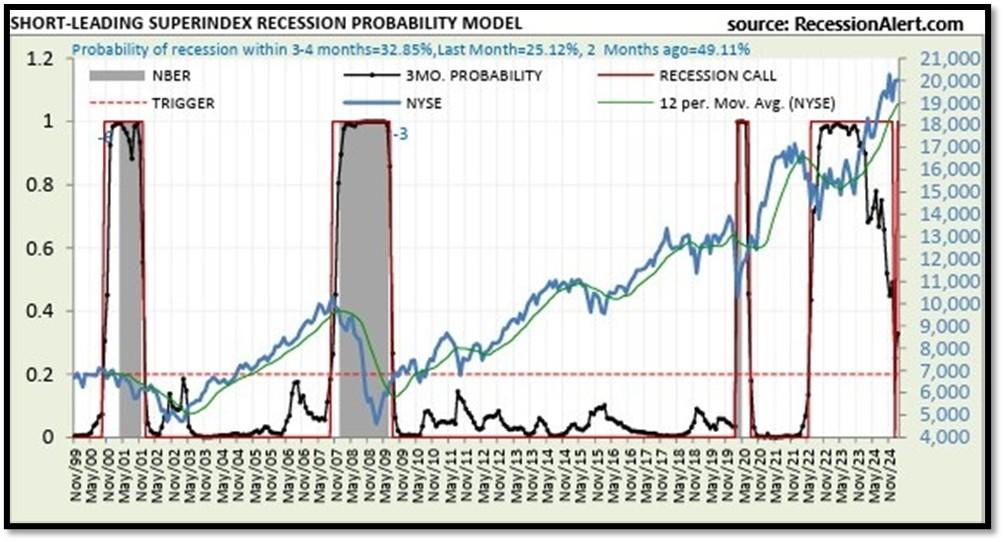
5F. Probability of U.S. falling into Recession within 3 to 4 months is currently at 32.85% (with data as of 03/10/2025 – Next Report 03/24/2025) according to RecessionAlert Research. Last release’s data was at 27.33%. This report is updated every two weeks. REF: RecessionAlertResearch
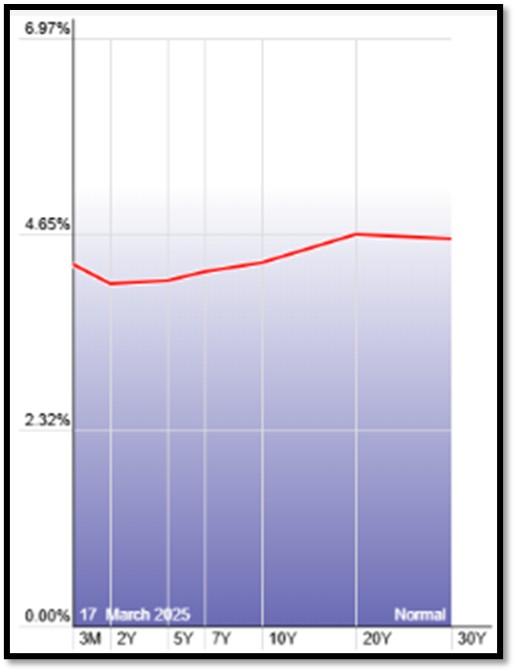
5G. Yield Curve as of 3/17/2025 is showing Normal. Spread on the 10-yr Treasury Yield (4.29%) minus yield on the 2-yr Treasury Yield (4.03%) is currently at 26 bps. REF: Stockcharts The yield curve—specifically, the spread between the interest rates on the ten-year Treasury note and the three-month Treasury bill—is a valuable forecasting tool. It is simple to use and significantly outperforms other financial and macroeconomic indicators in predicting recessions two to six quarters ahead. REF: NYFED
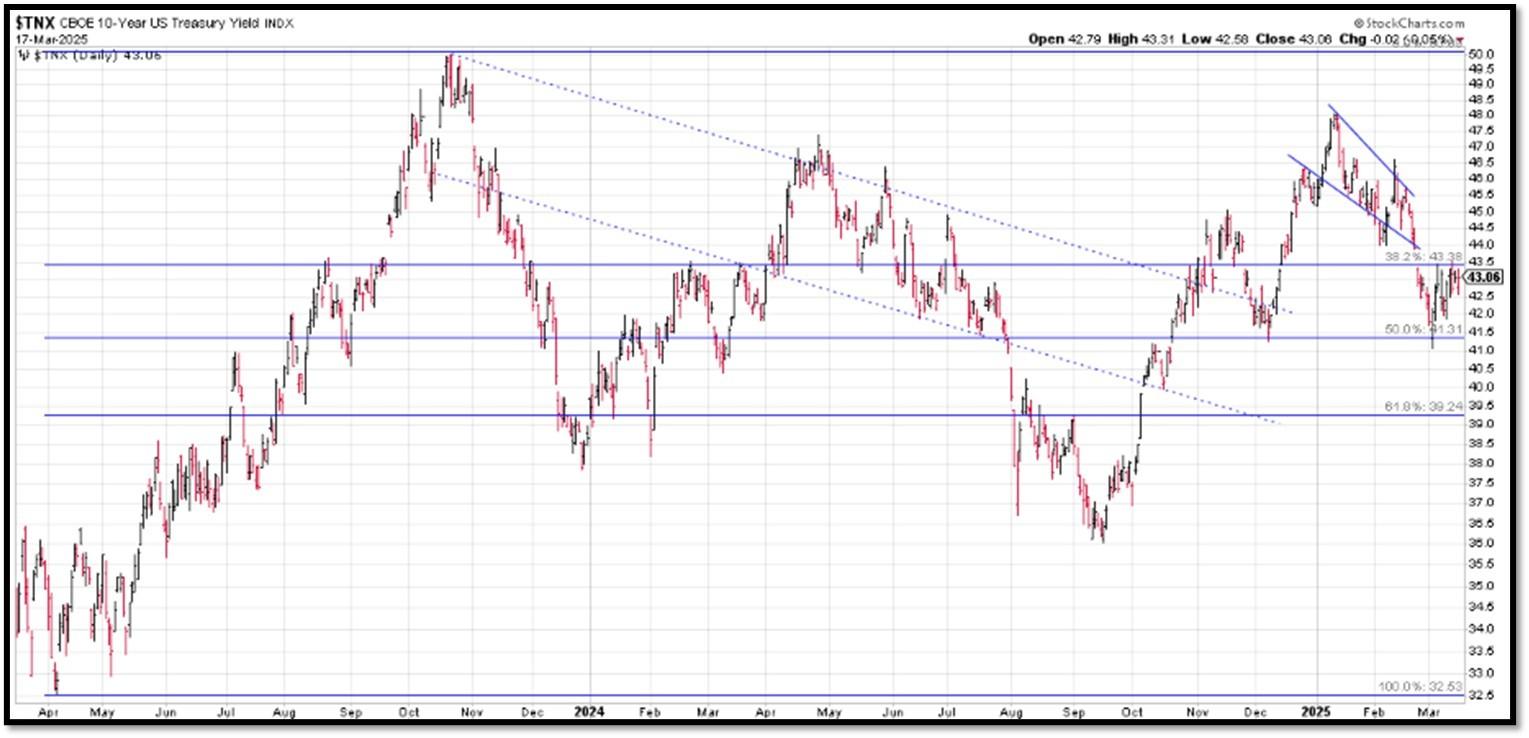
5H. Recent Yields in 10-Year Government Bonds. REF: Source is from Bloomberg.com, dated 3/17/2025, rates shown below are as of 3/17/2025, subject to change.
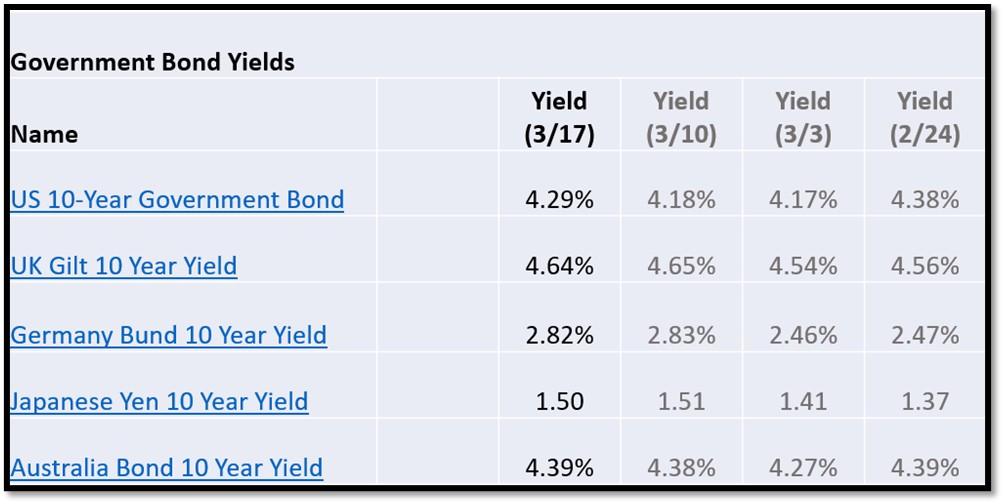
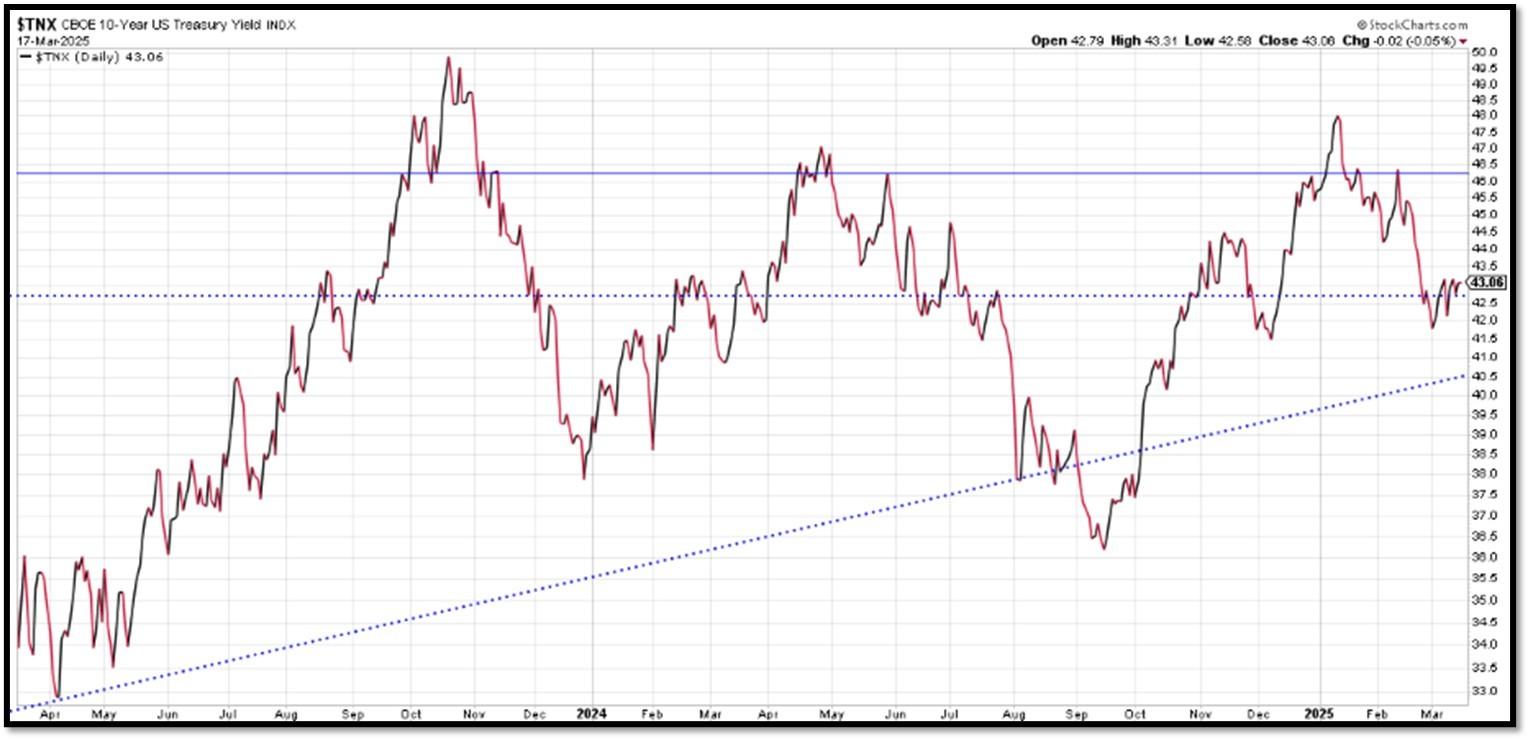
The 10-Year US Treasury Yield… The 10-Year Yield is indirectly related to inflation. I expect the 10-Year Yield to drop further as dis-inflation kicks in. REF: StockCharts1, StockCharts2
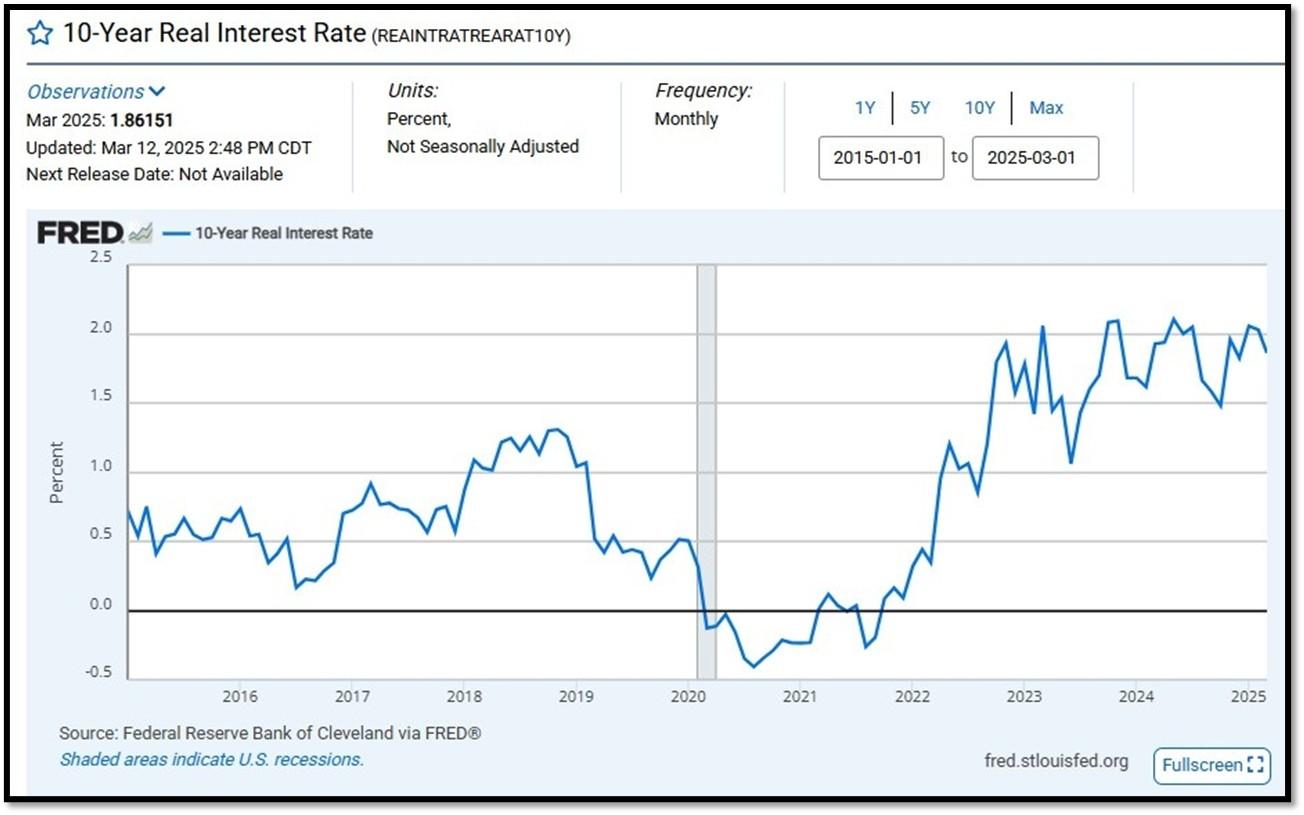
10-Year Real Interest Rate at 1.86151% as of 3/12/25. Last month’s data was 2.03128%. REF: REAINTRATREARAT10Y
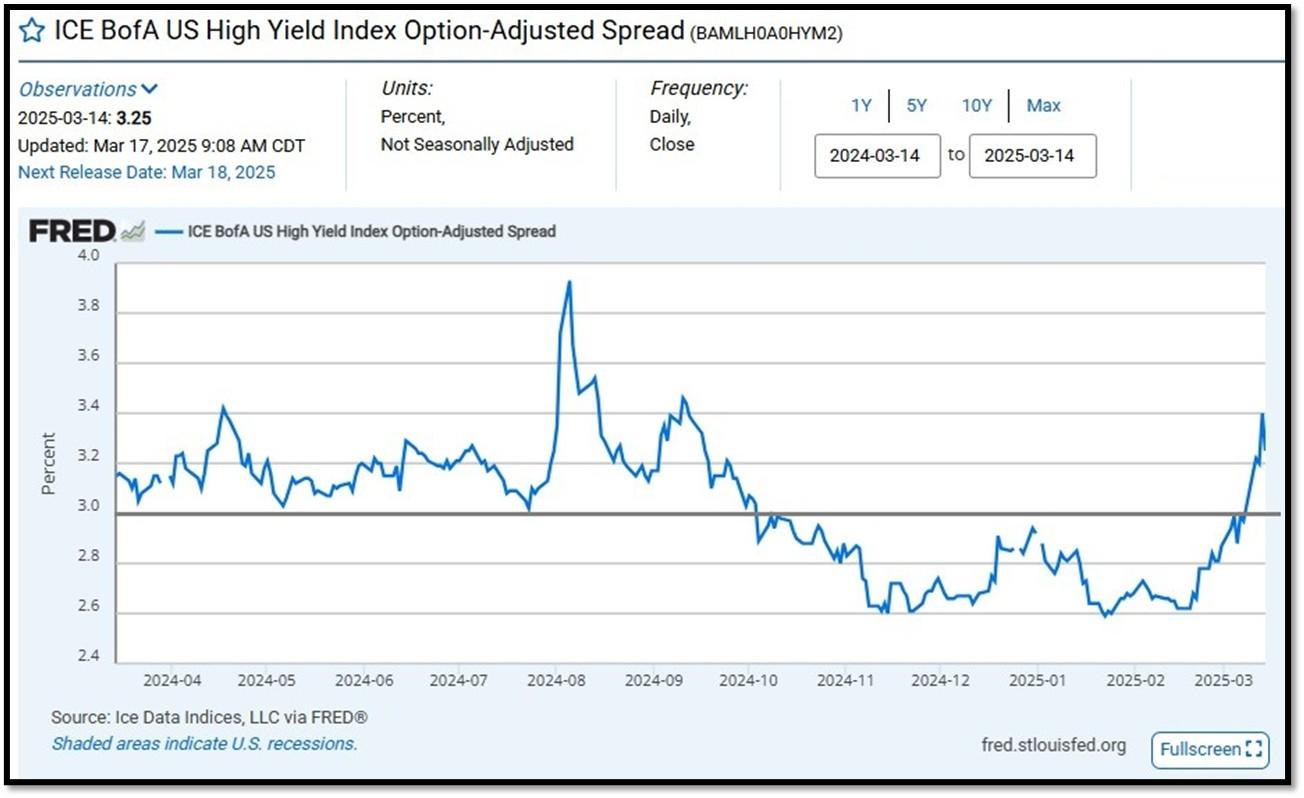
ICE BofA US High Yield Index Option-Adjusted Spread (BAMLH0A0HYM2) currently at 3.25 as of March 17, 2025. This is a key indicator of market sentiment, particularly regarding risk and economic health. At its core, the spread reflects the extra return investors demand to hold riskier corporate debt over safer government securities. High-yield bonds are issued by companies with lower credit ratings (below investment grade, like BB or lower), meaning they carry a higher chance of default. The spread compensates for this risk. When the spread is narrow—say, around 2.5% to 3%, as seen recently—it suggests investors are confident, willing to accept less extra yield because they perceive lower default risk or a strong economy. Narrow spreads often align with bullish markets, where cash is flowing, growth is steady, and fear is low. REF: FRED-BAMLH0A0HYM2
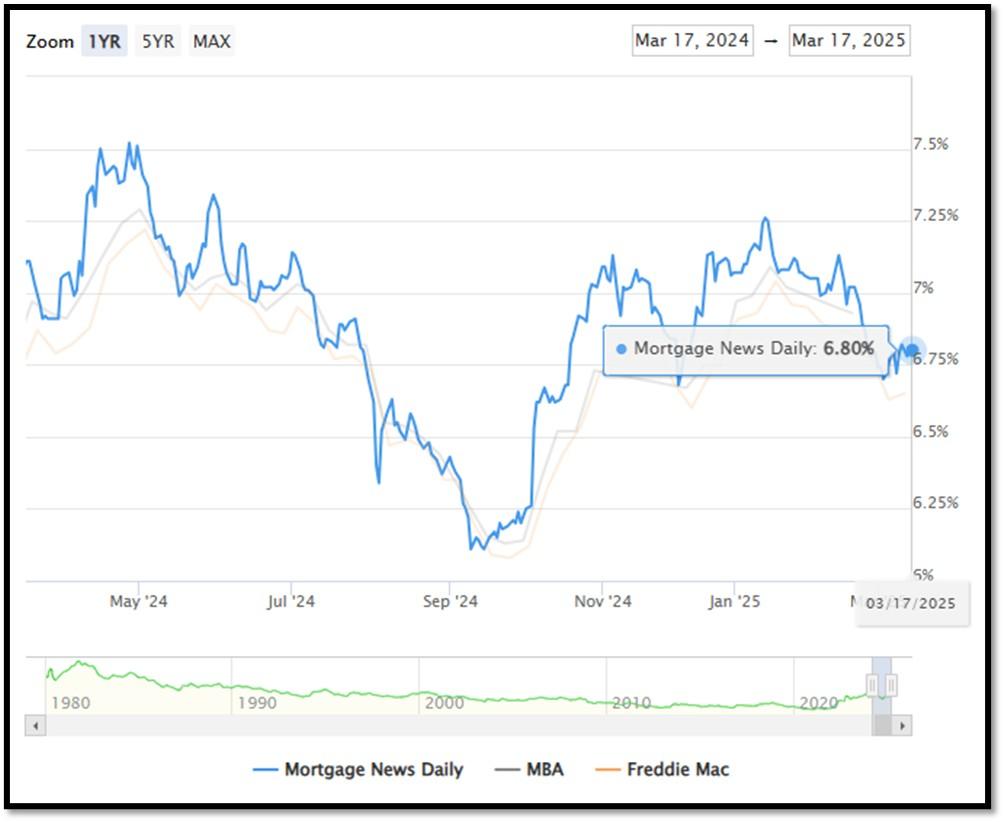
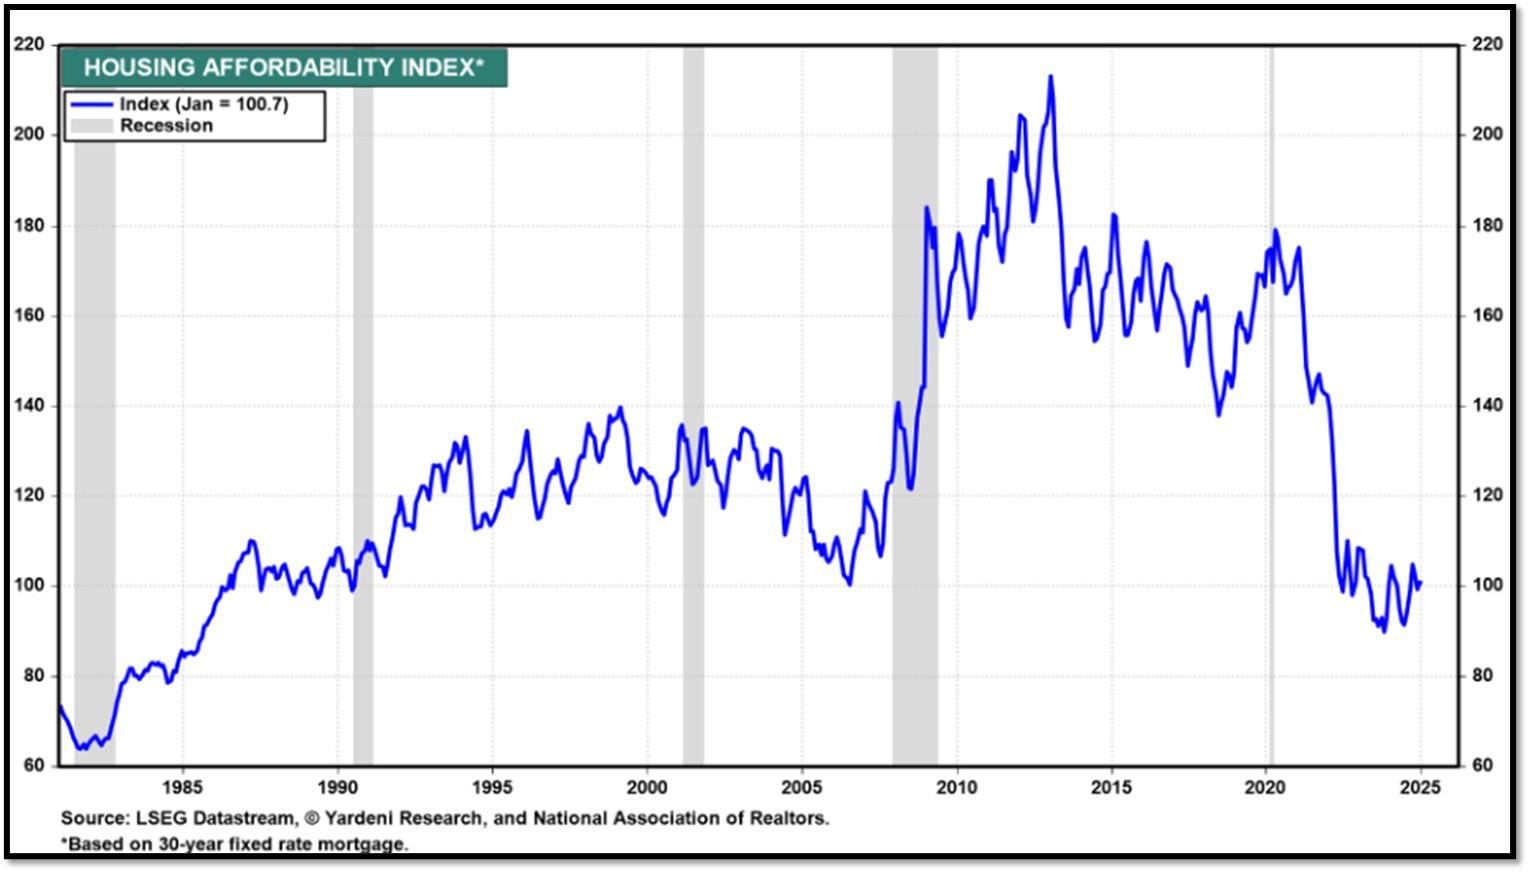
5I. (3/17/2025) Today’s National Average 30-Year Fixed Mortgage Rate is 6.80% (All Time High was 8.03% on 10/19/23). Last week’s data was 6.72%. This rate is the average 30-year fixed mortgage rates from several different surveys including Mortgage News Daily (daily index), Freddie Mac (weekly survey), Mortgage Bankers Association (weekly survey) and FHFA (monthly survey). REF: MortgageNewsDaily, Today’s Average Rate
The recent spike in the 30-year fixed-rate jumbo mortgage to 6.80%, compared to Freddie Mac’s rate at 6.65% and the Mortgage Bankers Association (MBA) rate at 6.93%, highlights key differences in the mortgage market. Jumbo mortgages, which exceed the conforming loan limits set by government agencies like Freddie Mac, typically carry higher interest rates because they are riskier for lenders. These loans are not backed by government entities, which increases the risk for lenders and, consequently, leads to higher rates. In contrast, Freddie Mac and MBA provide averages for conforming loans, which meet federal guidelines and have lower risk due to government backing, keeping their rates lower.
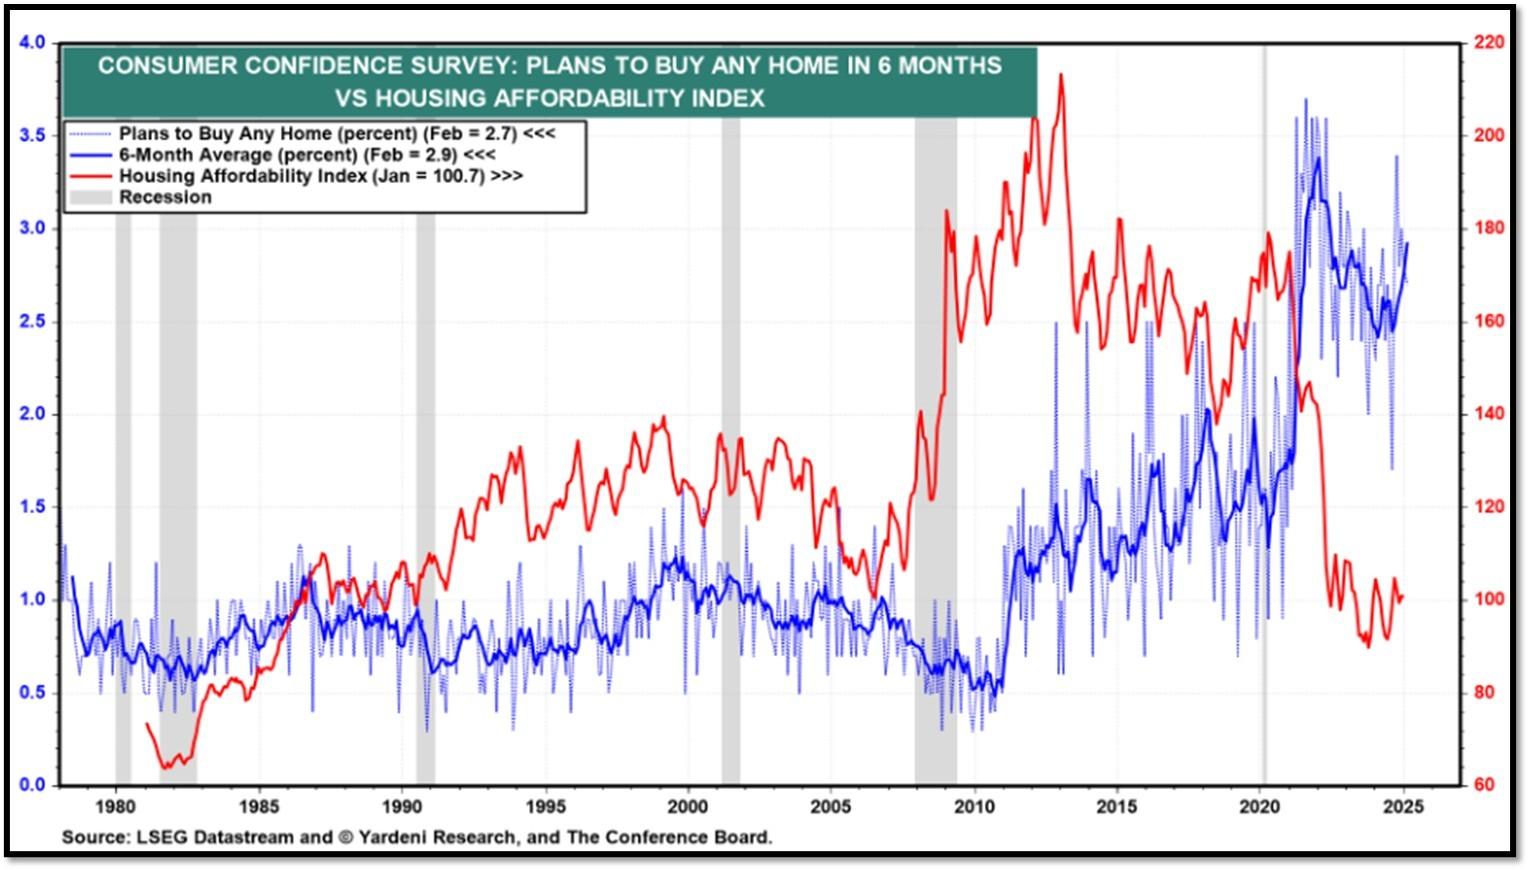
(3/17/25) Housing Affordability Index for Jan = 100.7 // Dec = 100.7 // Nov = 99 // Oct = 102.3 // Sep = 105.5 // Aug = 98.6. Data provided by Yardeni Research. REF: Yardeni
5J. Velocity of M2 Money Stock (M2V) with current read at 1.386 as of (Q4-2024 updated 2/27/2025). Previous quarter’s data was 1.390. The velocity of money is the frequency at which one unit of currency is used to purchase domestically- produced goods and services within a given time period. In other words, it is the number of times one dollar is spent to buy goods and services per unit of time. If the velocity of money is increasing, then more transactions are occurring between individuals in an economy. Current Money Stock (M2) report can be viewed in the reference link. REF: St.LouisFed-M2V
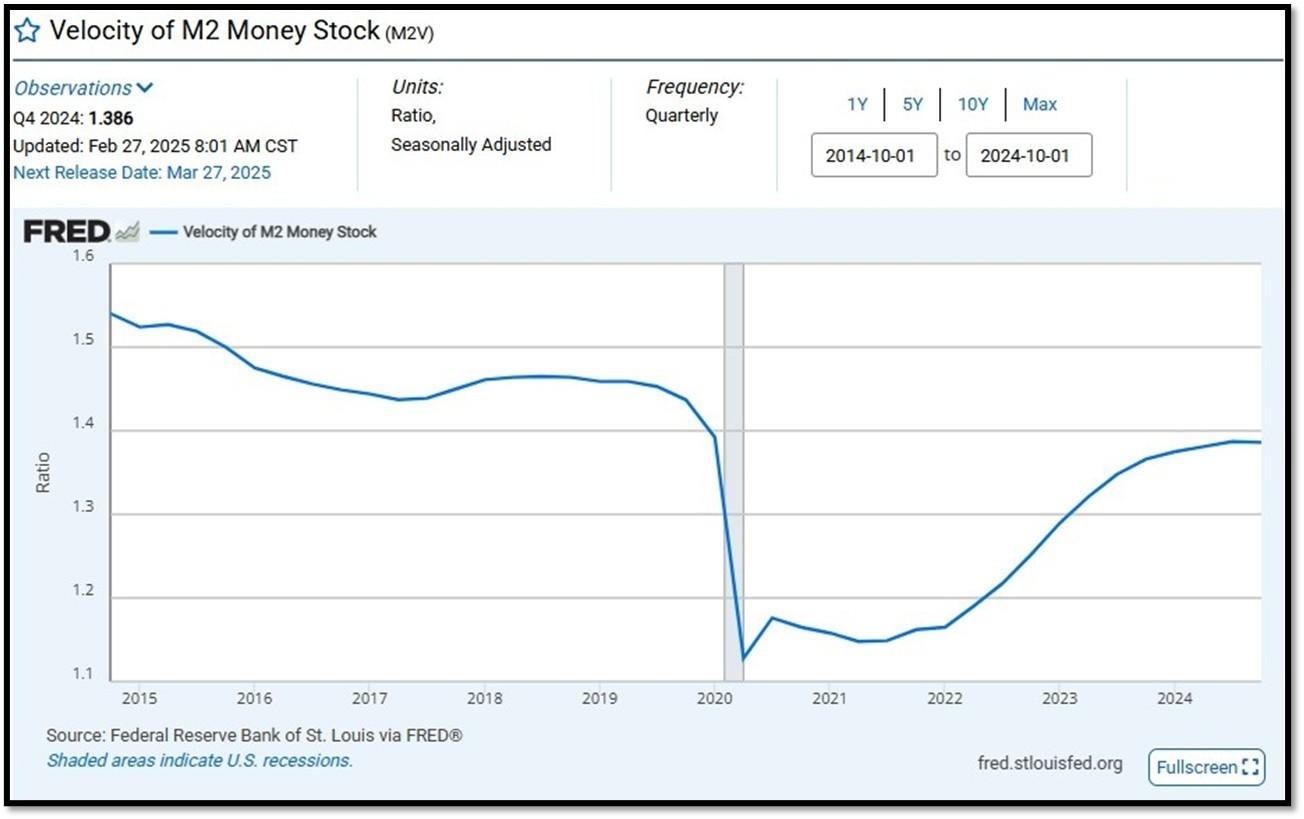
M2 consists of M1 plus (1) small-denomination time deposits (time deposits in amounts of less than $100,000) less IRA and Keogh balances at depository institutions; and (2) balances in retail MMFs less IRA and Keogh balances at MMFs. Seasonally adjusted M2 is constructed by summing savings deposits (before May 2020), small-denomination time deposits, and retail MMFs, each seasonally adjusted separately, and adding this result to seasonally adjusted M1. Board of Governors of the Federal Reserve System (US), M2 [M2SL], retrieved from FRED, Federal Reserve Bank of St. Louis; Updated on February 25, 2025. REF: St.LouisFed-M2
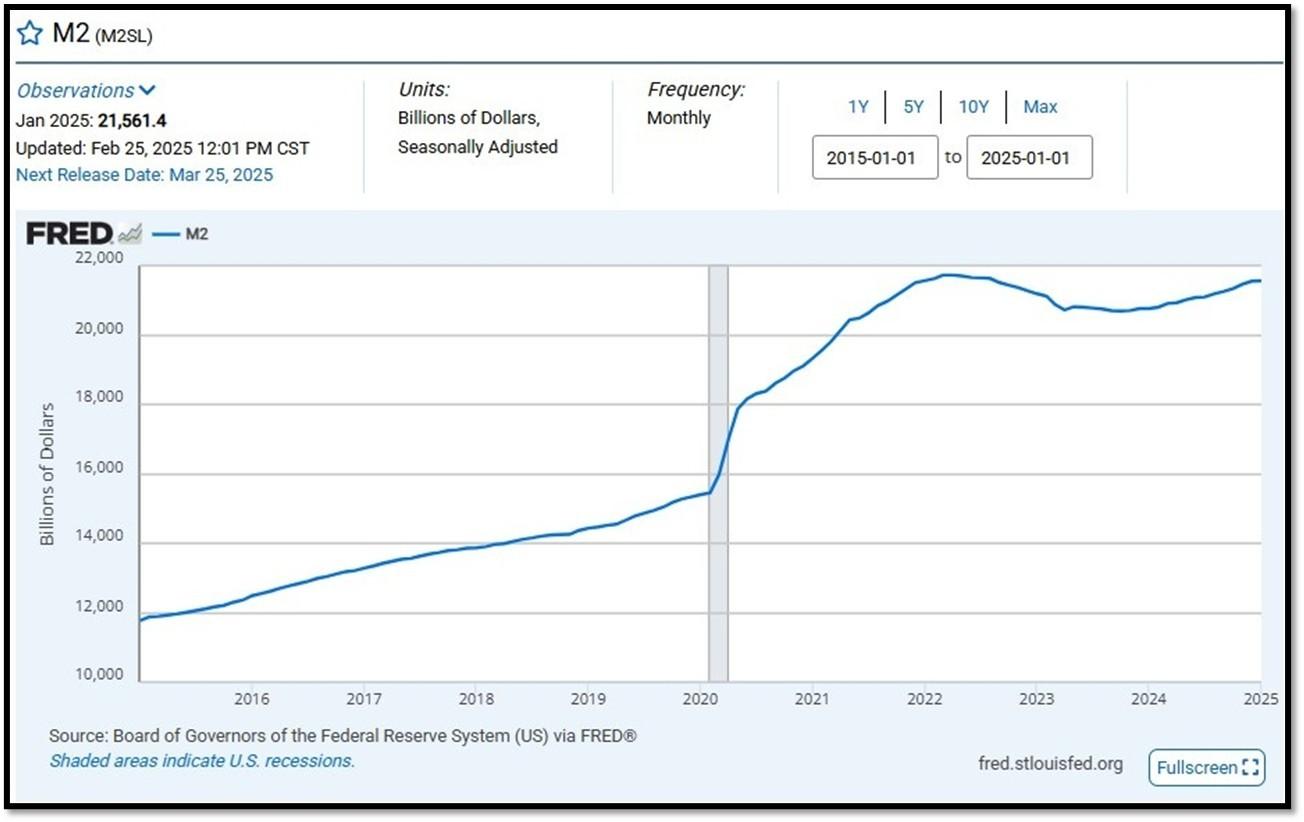
Money Supply M0 in the United States increased to 5,614,200 USD Million in January from 5,604,100 USD Million in December of 2024. Money Supply M0 in the United States averaged 1,171,888.65 USD Million from 1959 until 2025, reaching an all-time high of 6,413,100.00 USD Million in December of 2021 and a record low of 48,400.00 USD Million in February of 1961. REF: TradingEconomics, M0
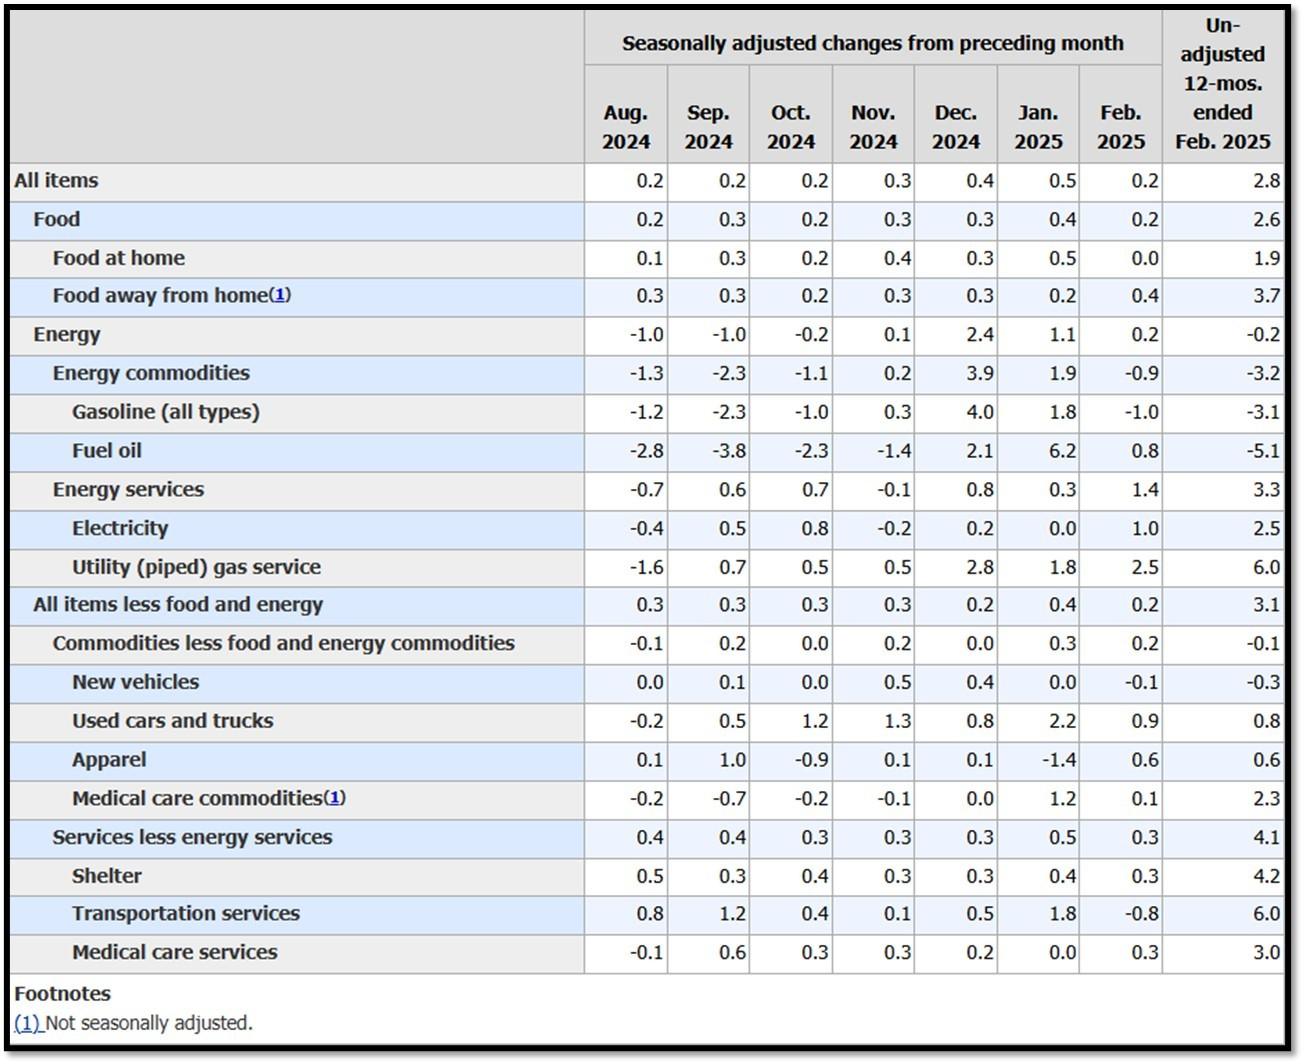
5K. In February, the Consumer Price Index for All Urban Consumers rose 0.2 percent, seasonally adjusted, and rose 2.8 percent over the last 12 months, not seasonally adjusted. The index for all items less food and energy increased 0.2 percent in February (SA); up 3.1 percent over the year (NSA). March 2025 CPI data are scheduled to be released on April 10, 2025, at 8:30AM-ET. REF: BLS, BLS.GOV
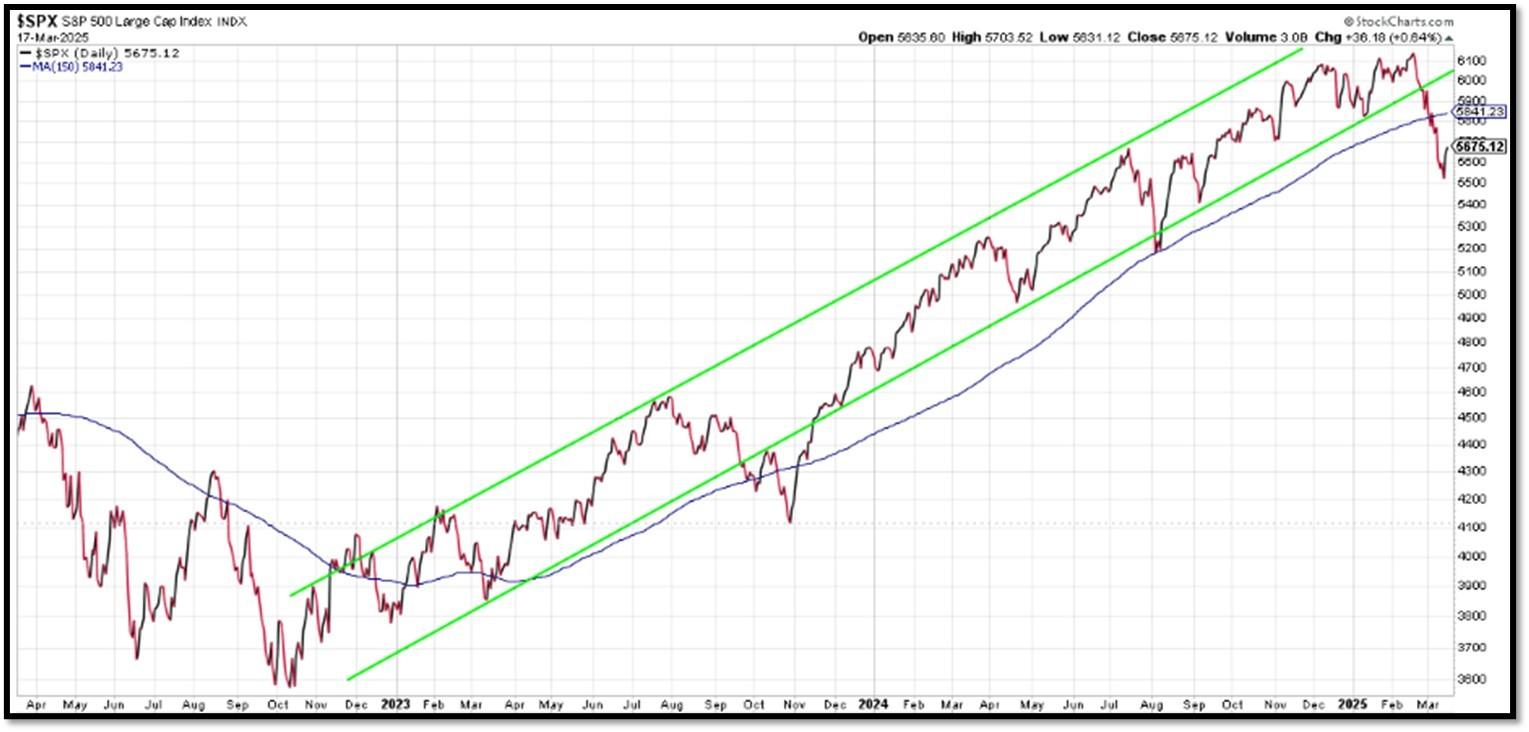
5L. Technical Analysis of the S&P500 Index. Click onto reference links below for images.
- Short-term Chart: Trend Neutral to Bearish on 3/17/2025 – REF: Short-term S&P500 Chart by Marc Slavin (Click Here to Access Chart)
- Medium-term Chart: Trend Less Bullish on 3/17/2025 – REF: Medium-term S&P500 Chart by Marc Slavin (Click Here to Access Chart)
- Market Timing Indicators – S&P500 Index as of 3/17/2025 – REF: S&P500 Charts (7 of them) by Joanne Klein’s Top 7 (Click Here to Access Updated Charts)
- A well-defined uptrend channel shown in green with S&P500 still on up trend. REF: Stockcharts
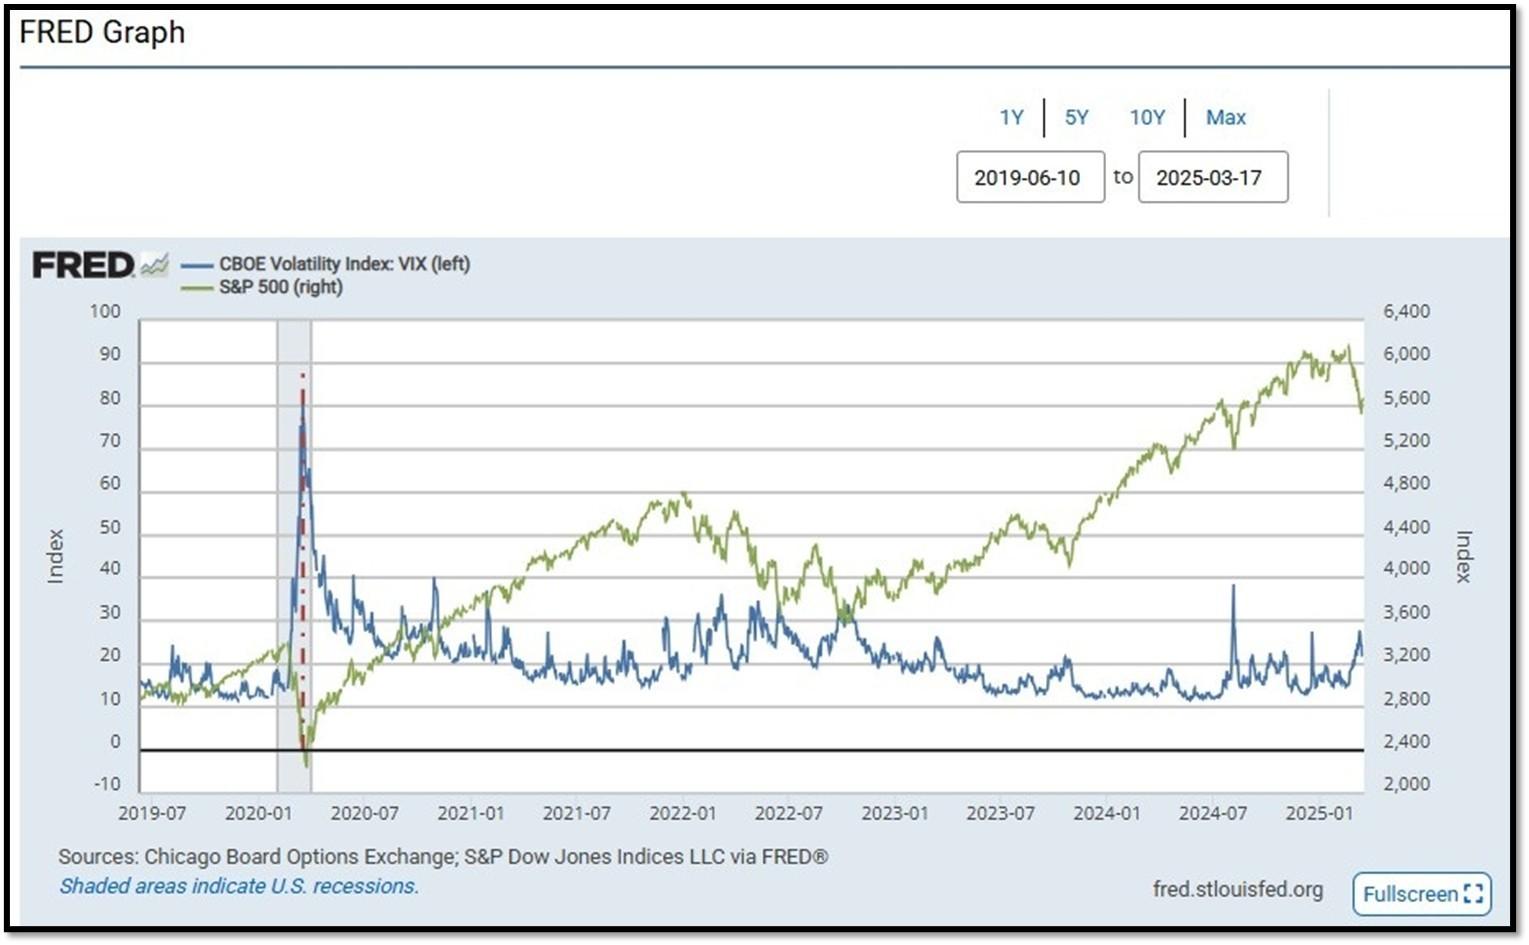
- S&P500 and CBOE Volatility Index (VIX) as of 3/17/2025. REF: FRED, Today’s Print
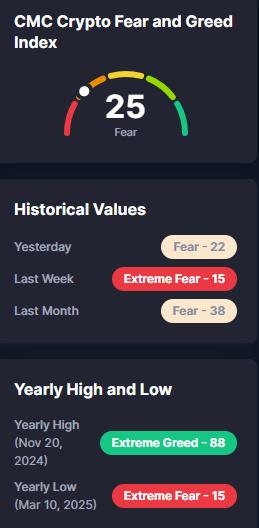
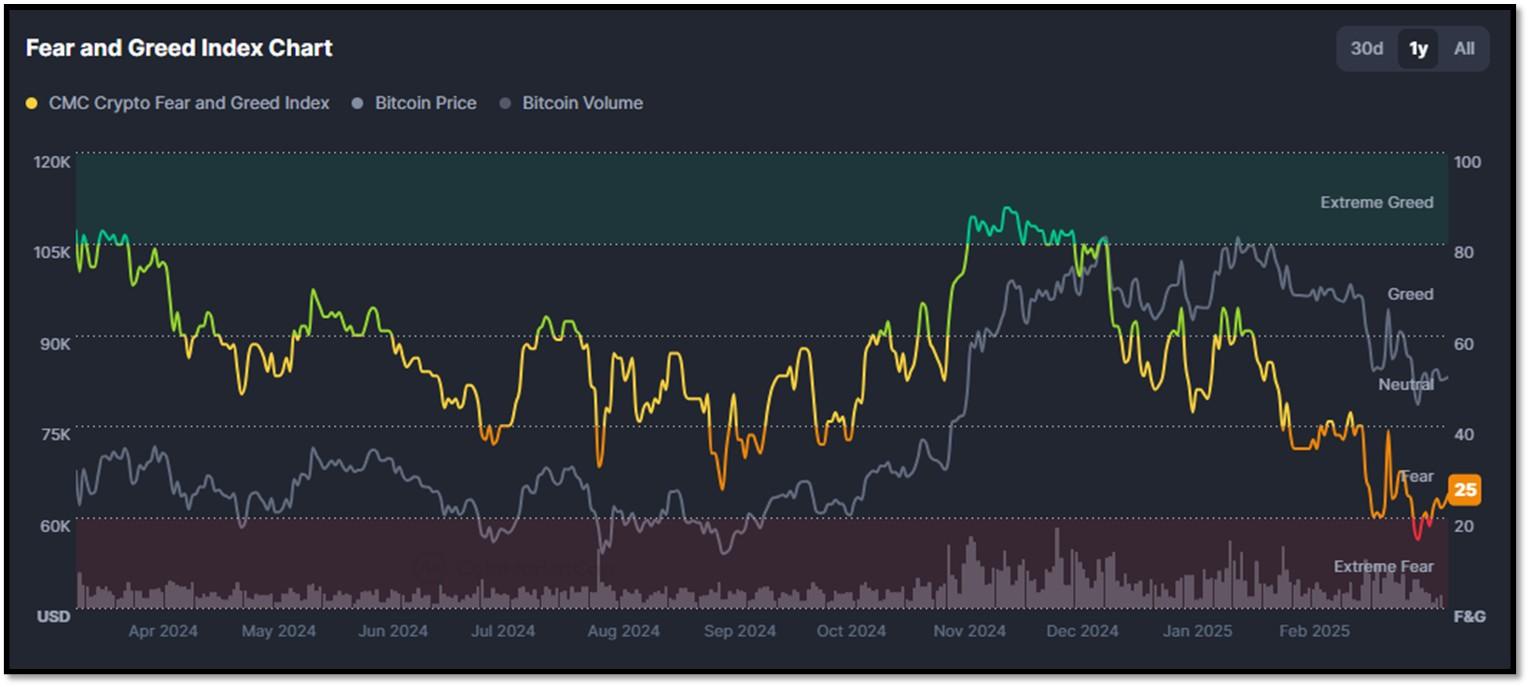
5M. Most recent read on the Crypto Fear & Greed Index with data as of 3/17/2025 is 25 (Fear). Last week’s data was 15 (Extreme Fear) (1-100). Fear & Greed Index – A Contrarian Data. The crypto market behavior is very emotional. People tend to get greedy when the market is rising which results in FOMO (Fear of missing out). Also, people often sell their coins in irrational reaction of seeing red numbers. With the Crypto Fear and Greed Index, the data try to help save investors from their own emotional overreactions. There are two simple assumptions:
- Extreme fear can be a sign that investors are too worried. That could be a buying opportunity.
- When Investors are getting too greedy, that means the market is due for a correction.
Therefore, the program for this index analyzes the current sentiment of the Bitcoin market and crunch the numbers into a simple meter from 0 to 100. Zero means “Extreme Fear”, while 100 means “Extreme Greed”. REF: Coinmarketcap.com, Today’sReading
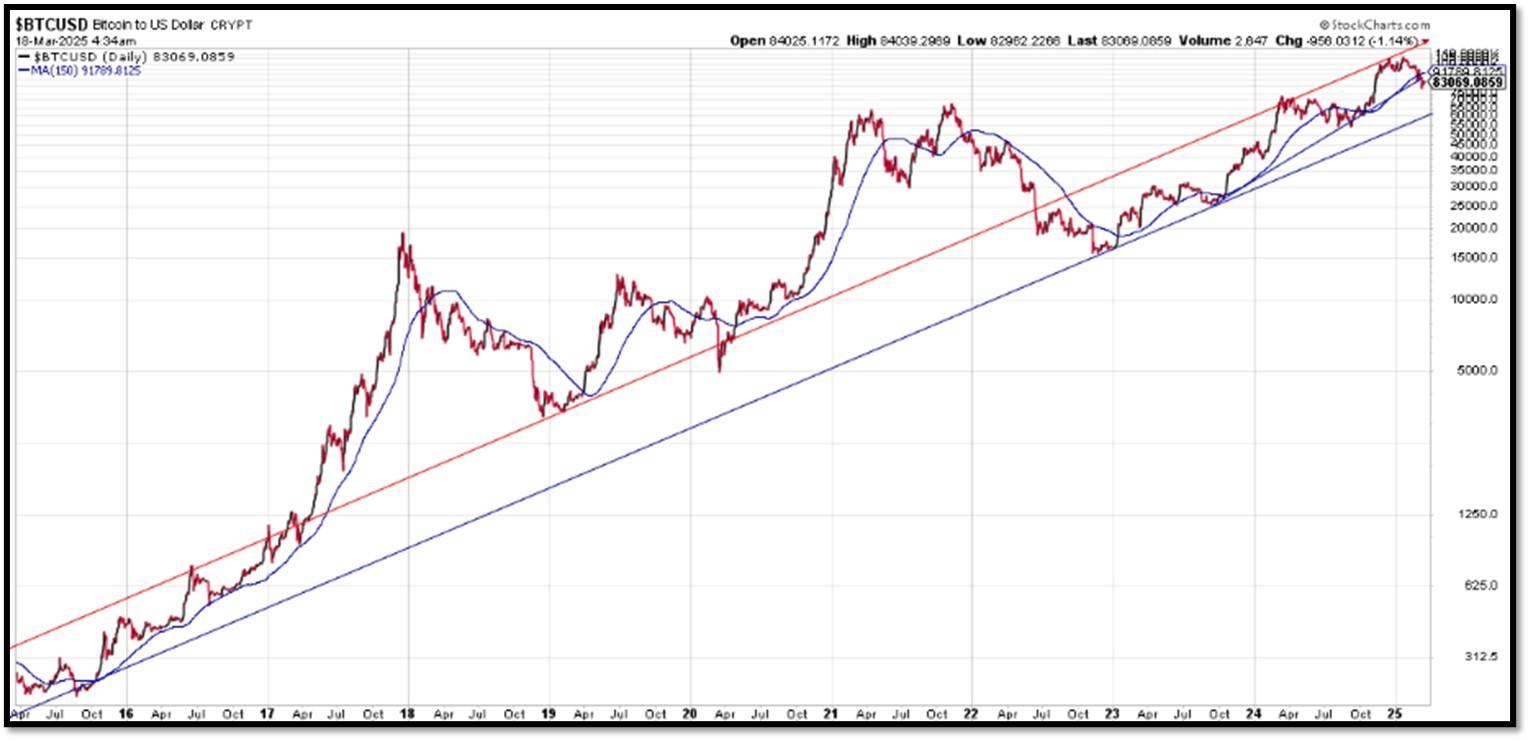
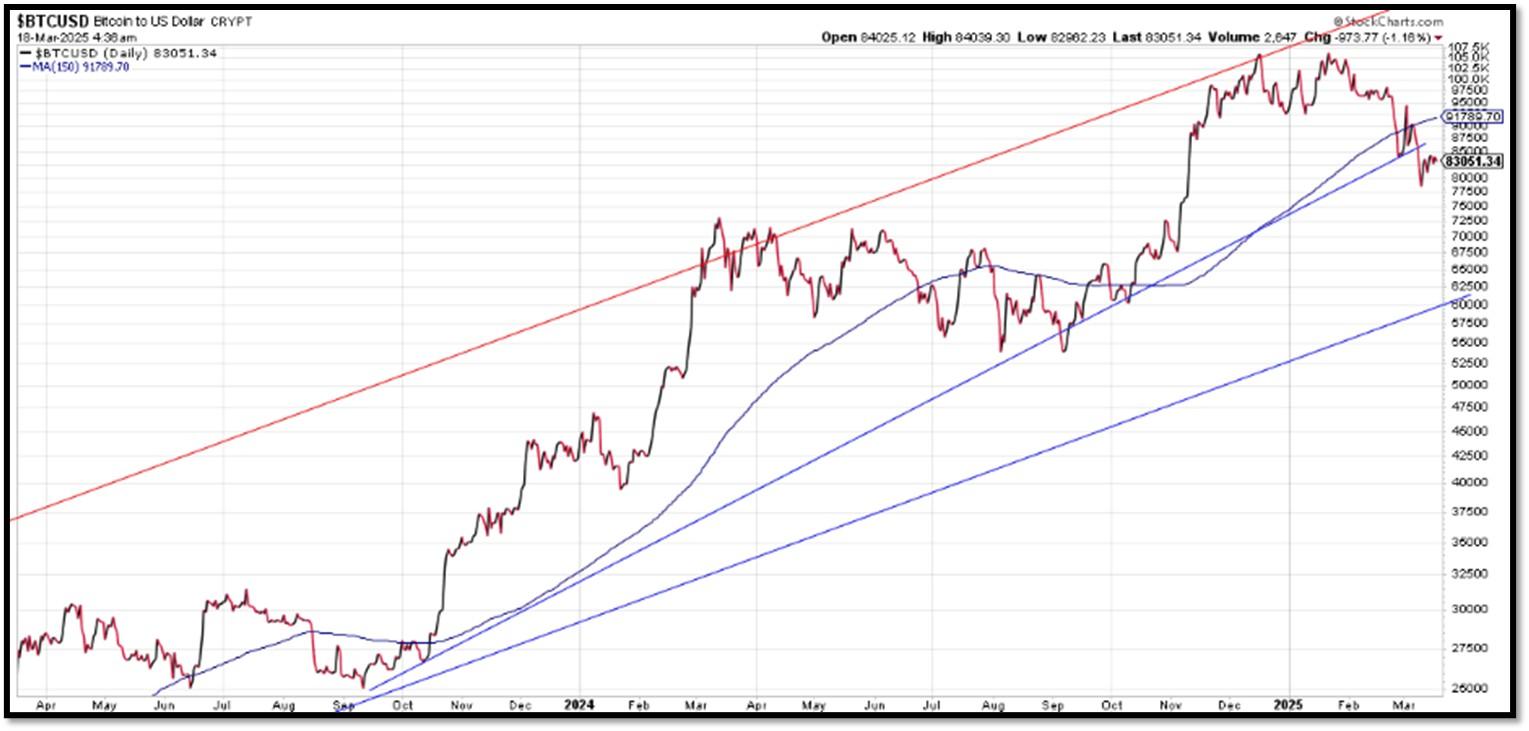
Bitcoin – 10-Year & 2-Year Charts. REF: Stockcharts10Y, Stockcharts2Y

Len writes much of his own content, and also shares helpful content from other trusted providers like Turner Financial Group (TFG).
The material contained herein is intended as a general market commentary, solely for informational purposes and is not intended to make an offer or solicitation for the sale or purchase of any securities. Such views are subject to change at any time without notice due to changes in market or economic conditions and may not necessarily come to pass. This information is not intended as a specific offer of investment services by Dedicated Financial and Turner Financial Group, Inc.
Dedicated Financial and Turner Financial Group, Inc., do not provide tax, legal or accounting advice. You should consult your own tax, legal and accounting advisors before engaging in any transaction.
Any hyperlinks in this document that connect to Web Sites maintained by third parties are provided for convenience only. Turner Financial Group, Inc. has not verified the accuracy of any information contained within the links and the provision of such links does not constitute a recommendation or endorsement of the company or the content by Dedicated Financial or Turner Financial Group, Inc. The prices/quotes/statistics referenced herein have been obtained from sources verified to be reliable for their accuracy or completeness and may be subject to change.
Past performance is no guarantee of future returns. Investing involves risk and possible loss of principal capital. The views and strategies described herein may not be suitable for all investors. To the extent referenced herein, real estate, hedge funds, and other private investments can present significant risks, including loss of the original amount invested. All indexes are unmanaged, and an individual cannot invest directly in an index. Index returns do not include fees or expenses.
Turner Financial Group, Inc. is an Investment Adviser registered with the United States Securities and Exchange Commission however, such registration does not imply a certain level of skill or training and no inference to the contrary should be made. Additional information about Turner Financial Group, Inc. is also available at www.adviserinfo.sec.gov. Advisory services are only offered to clients or prospective clients where Turner Financial Group, Inc. and its representatives are properly licensed or exempt from licensure. No advice may be rendered by Turner Financial Group, Inc. unless a client service agreement is in place.