

- 1. The past seven days have delivered a turbulent and emotional stretch for financial markets. Stocks experienced a fierce pullback as investors rushed to interpret every headline as a signal of deeper trouble.
- 2. Main story this week focuses on the debate over ‘AI Bubble’ – The Debate Over Oracle and Meta’s Earnings.
- 3. Revisiting municipal bonds. Municipal bond funds present a compelling opportunity in today’s market environment for income strategies.
- 4. World Watch
- 4A. At the US-Saudi Investment Forum, Elon Musk, Jensen Huang, and Minister Abdullah A. Alswaha outlined a shared vision for the future of artificial intelligence, advanced computing, and global digital infrastructure.
- 4B. While higher prices in the US are stickier than expected; prices in China are falling.
- 4C. An updated snapshot of the current global state of economy
- 5. Quant & Technical Corner – a selection of quantitative & technical data we monitor on a regular basis to help gauge the overall financial market conditions and the investment environment.
1. The past seven days have delivered a turbulent and emotional stretch for financial markets. Stocks experienced a fierce pullback as investors rushed to interpret every headline as a signal of deeper trouble.
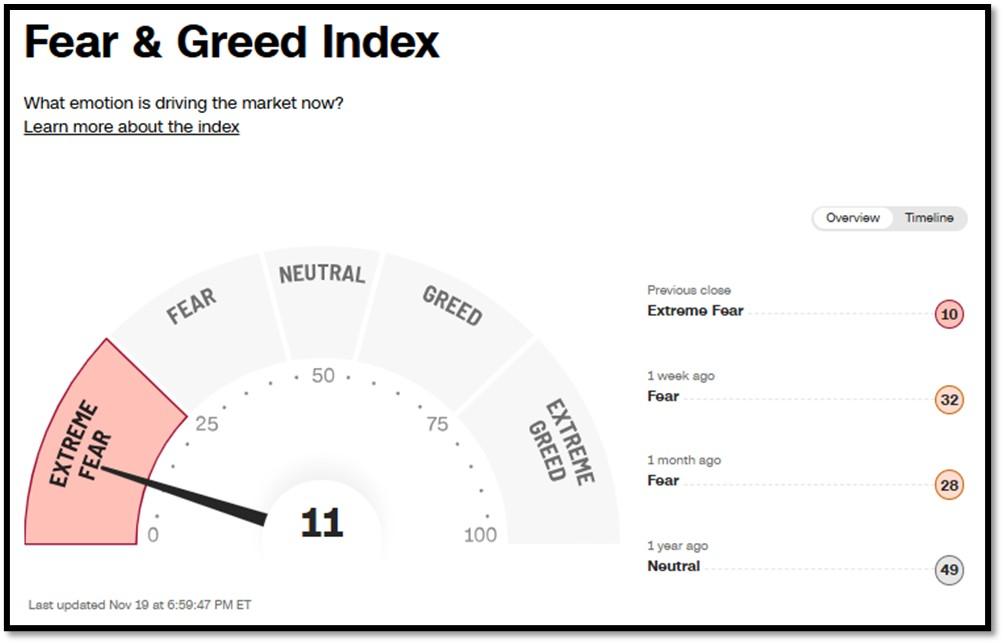
Sentiment collapsed to unusually depressed levels, with the Fear and Greed Index dropping to an extreme oversold reading of 11 out of 100 (See item 5a below). The last time we saw sentiment this washed out was when President Trump stunned global markets with his call for reciprocal tariffs, an event that triggered a brief but dramatic wave of uncertainty. This week, the center of concern shifted toward the idea that the artificial intelligence boom may be nearing an end. Oh contraire! That narrative gained additional attention after several well-known investors, including Softbank and Peter Thiel, sold portions of their Nvidia holdings to raise cash for other ventures. These actions fueled speculation that the market is approaching a late-stage environment. Even the resurfacing of Michael Burry’s incorrect math, which contributed to the downfall of his fund, added to a broader sense of fear that investors may be missing something structural (See main story below). However, the current picture is far more nuanced. The recent pullback appears driven by position unwinding, algorithmic selling, and temporary exhaustion within the most crowded trades, rather than a fundamental breakdown of the powerful innovation trends driving the modern economy. The suggestion that the artificial intelligence cycle is suddenly over does not align with the overwhelming evidence of continued investment, ongoing demand for compute power, and the rapid acceleration of real-world adoption. See item 4A below and listen to Jensen Huang of Nvidia.
2. Main story this week focuses on the debate over ‘AI Bubble’ – The Debate Over Oracle and Meta’s Earnings.
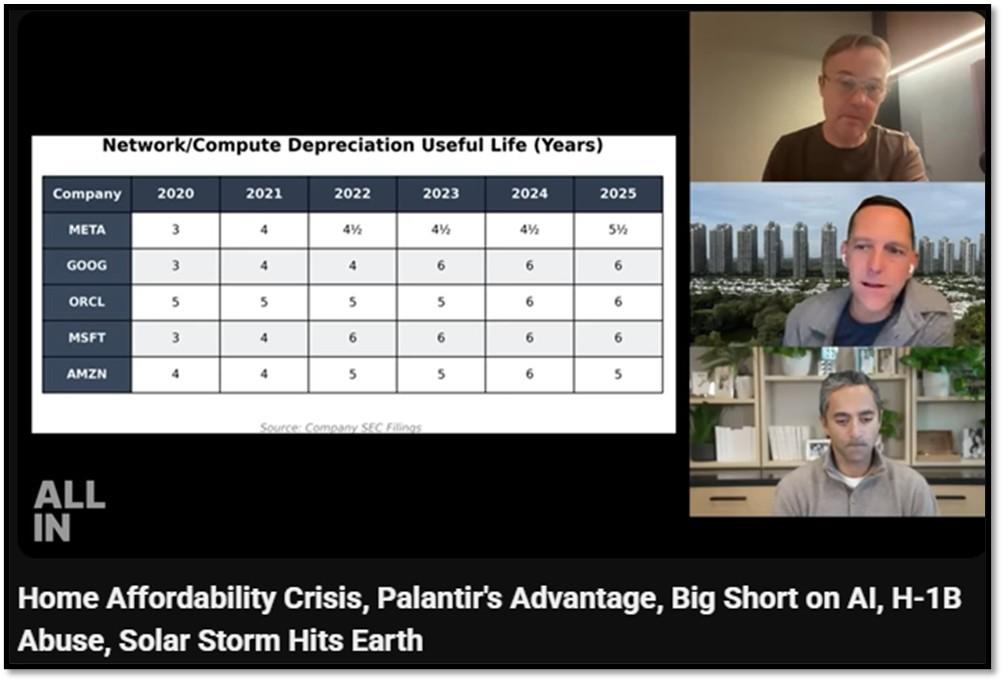
Michael Burry, the investor renowned for predicting the 2008 financial crisis, accused Oracle and Meta Platforms (formerly Facebook) of “cooking their books” by inflating earnings through questionable accounting practices. Burry argued that Oracle was prematurely recognizing revenue from long-term contracts, while Meta’s reported profitability was artificially boosted, possibly by capitalizing costs related to its metaverse investments. He suggested these tactics misled investors about the companies’ true financial health. As a result of his increasingly bearish outlook, Burry ultimately decided to close his hedge fund, citing frustrations with the market and his inability to find opportunities that matched his investment philosophy.
David Albert Friedberg, an angel investor, entrepreneur, and a co-host of the All-In Podcast, pushed back on Burry’s accusations. He argued that both companies were following standard and widely accepted accounting practices, particularly Meta’s handling of long-duration R&D investments and Oracle’s revenue recognition for multi-year enterprise software contracts. Friedberg also emphasized that today’s technology environment is fundamentally different, pointing out that “the chips are now utilized 100%,” meaning that the way current-generation chips are deployed and monetized is far more efficient and productive than in previous cycles. In his view, Burry’s critique missed the technological context and underestimated how these companies are executing long-term growth strategies within the realities of modern compute economics. Click onto pictures below to access videos. REF: Forbes, All-In,

3. Revisiting municipal bonds. Municipal bond funds present a compelling opportunity in today’s market environment for income strategies.
With interest rates stabilizing and the Federal Reserve signaling a path toward eventual easing, muni funds stand to benefit from both attractive tax-free income and potential price appreciation as yields decline. Credit fundamentals across municipalities remain generally strong, supported by resilient tax receipts and disciplined post-pandemic budgeting, which has kept default risk relatively low compared to corporate credit. Meanwhile, current spreads and tax-equivalent yields are unusually favorable for high-income investors seeking defensive positioning without sacrificing return potential. As capital rotates out of cash and short-term instruments, municipal bond funds offer a timely combination of income, quality, and upside potential in a shifting rate landscape.
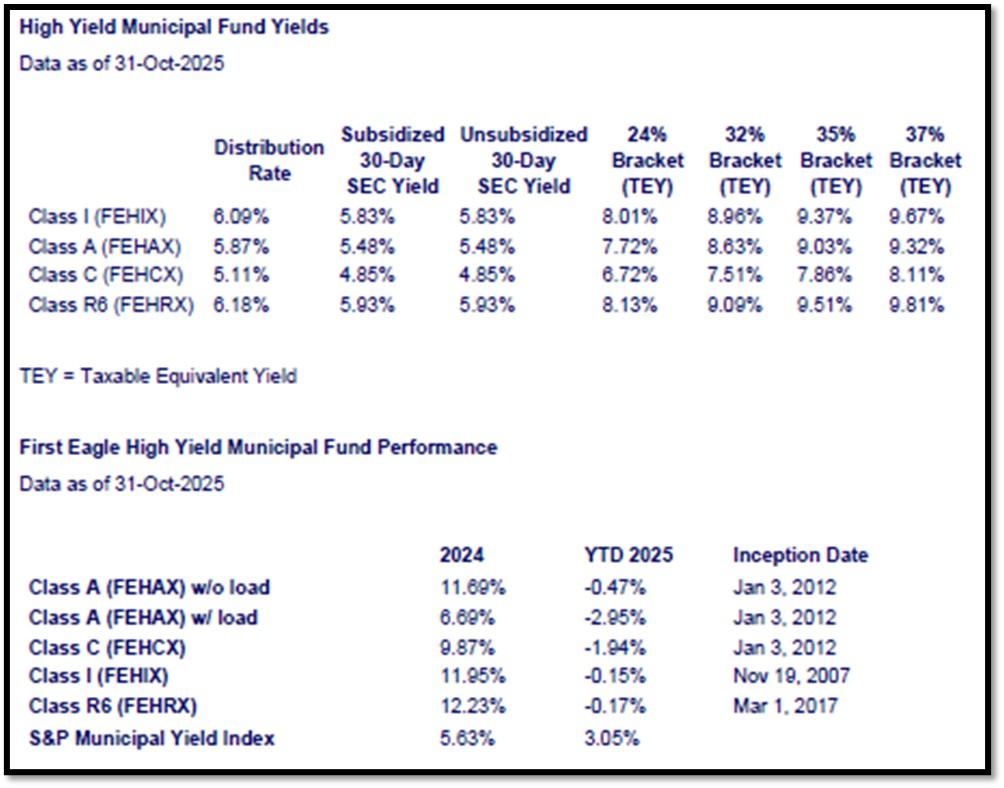
In our municipal bond models, we continue to use the First Eagle High Yield Municipal Fund Institutional Share Class (FEHIX) as a core holding, and its performance has exceeded expectations in the current market environment. The fund has delivered strong income generation, with recent distributions coming in above 6% federally tax-free, making it a highly effective component of our tax-efficient income strategy. With the expectation of further interest rate cuts, the FEHIX portfolio is well-positioned to appreciate as rates decline. Below is a handy table showing Distribution Rate and Taxable Equivalent Yields. REF: FEHIX Update, FEHIX_Website
NOTE: Not investment advice or recommendations. Investors should carefully consider the investment objectives, risks, charges, and expenses before investing. For additional information about the securities mentioned above, please visit the respective fund’s documents pages for the fund’s prospectus. Please read all materials carefully before investing.
https://www.firsteagle.com/funds/high-yield-municipal-fund?t=FEHIX
With the current macro-economic backdrop, below are areas we currently favor:
- Fixed Income – (Corporates & Muni) High Yield as Opportunistic Allocation (Low-Beta)
- Fixed Income – Short-term Corporates & Muni (Low-Beta)
- Businesses that contribute to and benefit from AI & Automation (Market-Risk)
- Neo-Cloud Computing (Market-Risk)
- Fintech & Financials (Market-Risk)
- Digital Asset – Bitcoin (Market-Risk/Hedge)
- India (Market-Risk)
- Cyber-Security & Software (Market-Risk)
- Quantum Computing (Market-Risk)
4. World Watch
4A. At the US-Saudi Investment Forum, Elon Musk, Jensen Huang, and Minister Abdullah A. Alswaha outlined a shared vision for the future of artificial intelligence, advanced computing, and global digital infrastructure.
Musk argued that rapid progress in robotics and artificial intelligence may eventually lessen society’s reliance on traditional work and currency, while Huang emphasized that artificial intelligence will transform every industry through major productivity gains. Minister Alswaha framed these ideas within Saudi Arabia’s national strategy, highlighting the Kingdom’s drive to become a global center for compute and innovation. Together, the speakers signaled expanding collaboration between U.S. technology leaders and Saudi-backed initiatives, especially in building large scale data centers and next generation artificial intelligence ecosystems, suggesting a redefinition of the global technological landscape. Below are the main points and highlights. Click onto picture further below to access video. REF: SkyNews, Forum, Bloomberg
- Elon Musk predicted that advanced artificial intelligence and robotics may eventually make traditional work and money less central.
- Jensen Huang noted that artificial intelligence will reshape nearly every job and industry by increasing productivity and transforming business models.
- Minister Abdullah A. Alswaha emphasized Saudi Arabia’s ambition to become a global leader in digital innovation and advanced compute.
- X-ai will be building a 500MW datacenter with Saudi Arabia in partnership with Nvidia.
- The discussion pointed to a shift in global technological leadership driven by a partnership between American innovation and Saudi investment.

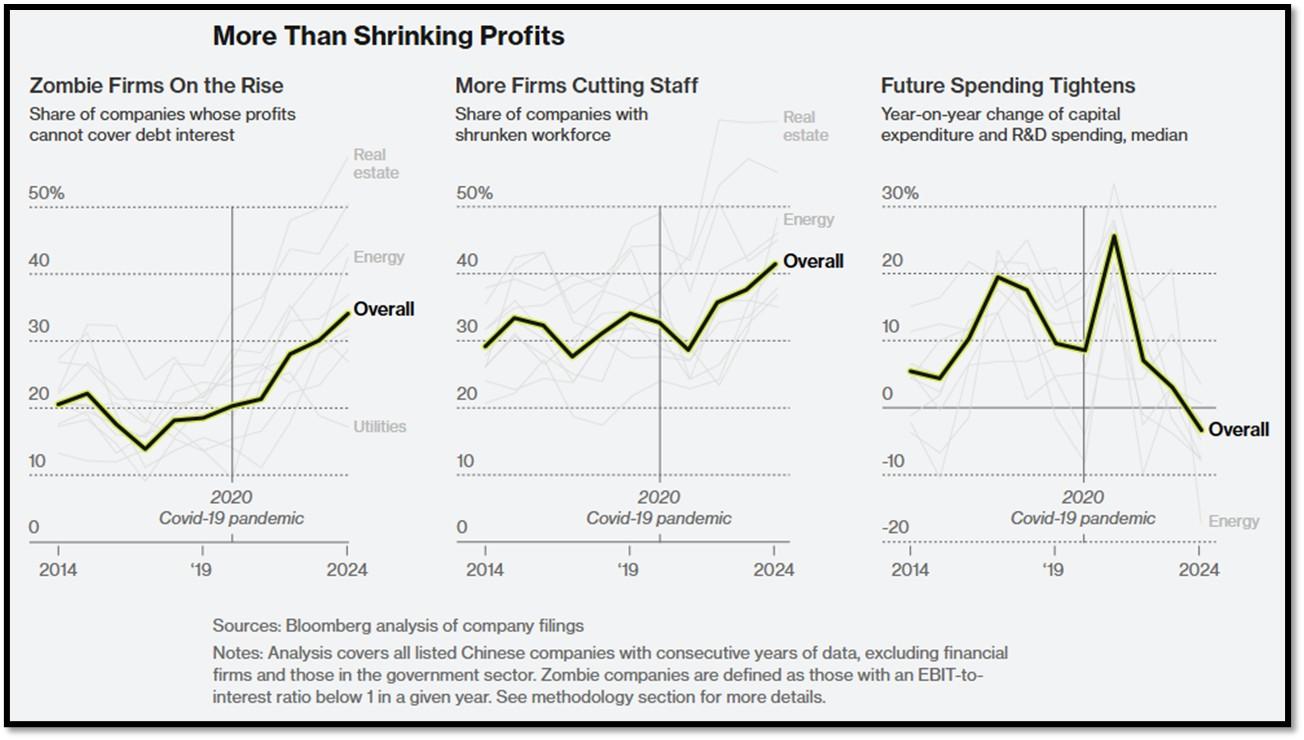
4B. While higher prices in the US are stickier than expected; prices in China are falling.
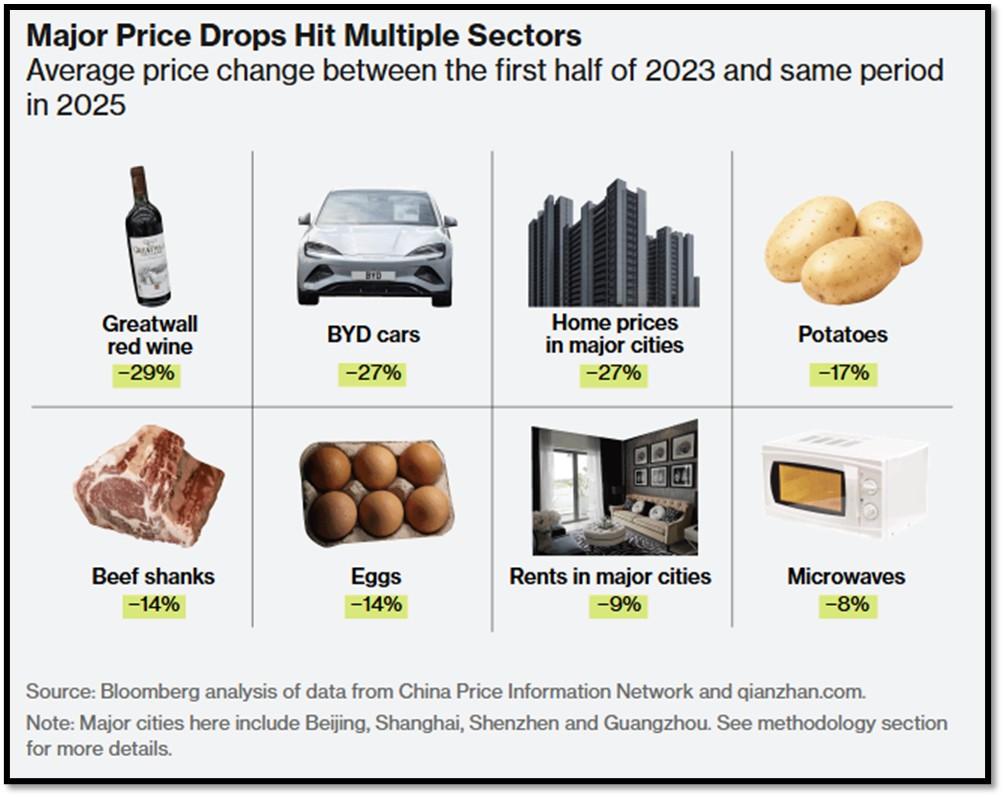
Bloomberg’s piece titled The True Cost of China’s Falling Prices reveals that the decline in prices across China is far more severe than official statistics suggest. By examining 67 commonly purchased items across 36 major cities, Bloomberg found that most goods have become cheaper over the past two years, while corporate losses and financially distressed companies have climbed to the highest level in 25 years. This is not a simple case of gentle deflation. Instead, it reflects a weakening economy where too much supply meets falling demand, creating a downward cycle that affects workers, consumers, and businesses at the same time.
The broader consequences reach far beyond China. As Chinese companies cut prices to survive, profit margins shrink, investment slows, and the economic cycle becomes even more constrained. Because many Chinese exporters compete worldwide, the wave of falling prices in China can reduce pricing power and profitability for companies in other countries as well. For investors and policymakers, the message is clear. What looks like a friendly drop in consumer prices is actually a sign of deeper structural weakness in the second largest economy in the world. REF: Bloomberg
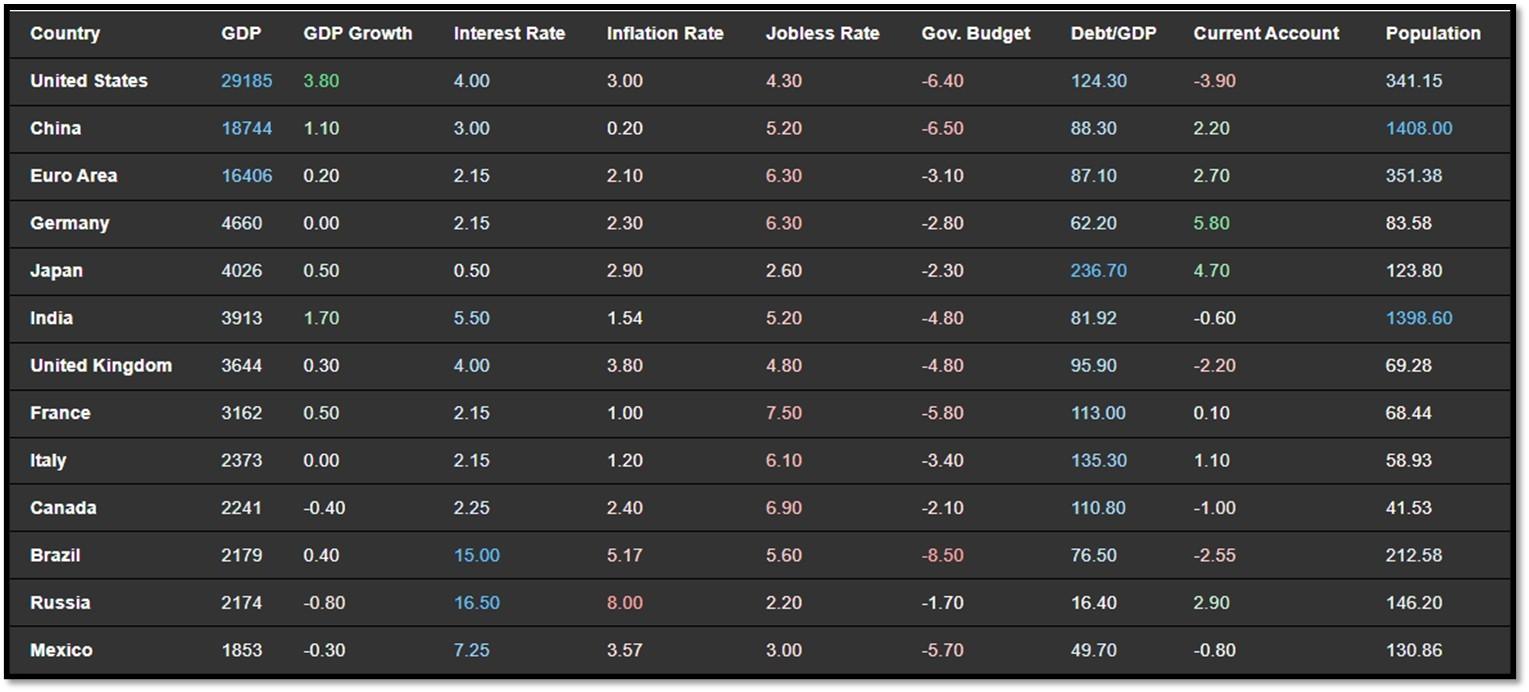
4C. An updated snapshot of the current global state of economy
According to TradingEconomics as of 11/17/2025 (REF: TradingEconomics) :
- China’s surveyed urban unemployment rate fell to 5.1% in October 2025, missing market expectations that it would hold steady at September’s 5.2%.
- Japan’s GDP contracted 0.4% qoq in Q3 2025, reversing an upwardly revised 0.6% growth in Q2 but performing slightly better than market expectations of a 0.6% decline, preliminary data showed.
- The consumer price inflation rate in India fell to 0.25% in October of 2025 from the downwardly revised 1.44% in the previous month, the lowest on record, and well below the market consensus of a softer slowdown to 0.48%.
- The UK economy expanded by just 0.1% in Q3 2025, easing from 0.3% growth in Q2 and falling short of market expectations of 0.2%, according to preliminary estimates.
5. Quant & Technical Corner – a selection of quantitative & technical data we monitor on a regular basis to help gauge the overall financial market conditions and the investment environment.
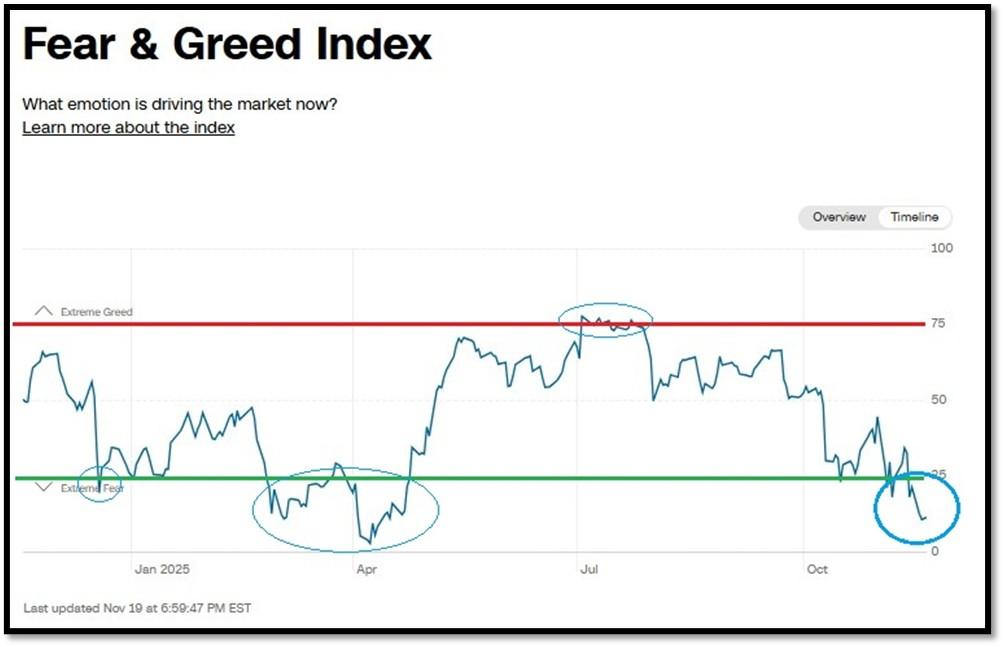
5A. Most recent read on the Fear & Greed Index with data as of 11/19/2025 – 6:59 PM-ET is 11 (Extreme Fear). Last week’s data was 32 (Fear) (1-100). CNNMoney’s Fear & Greed index looks at 7 indicators (Stock Price Momentum, Stock Price Strength, Stock Price Breadth, Put and Call Options, Junk Bond Demand, Market Volatility, and Safe Haven Demand). Keep in mind this is a contrarian indicator! REF: Fear&Greed via CNNMoney
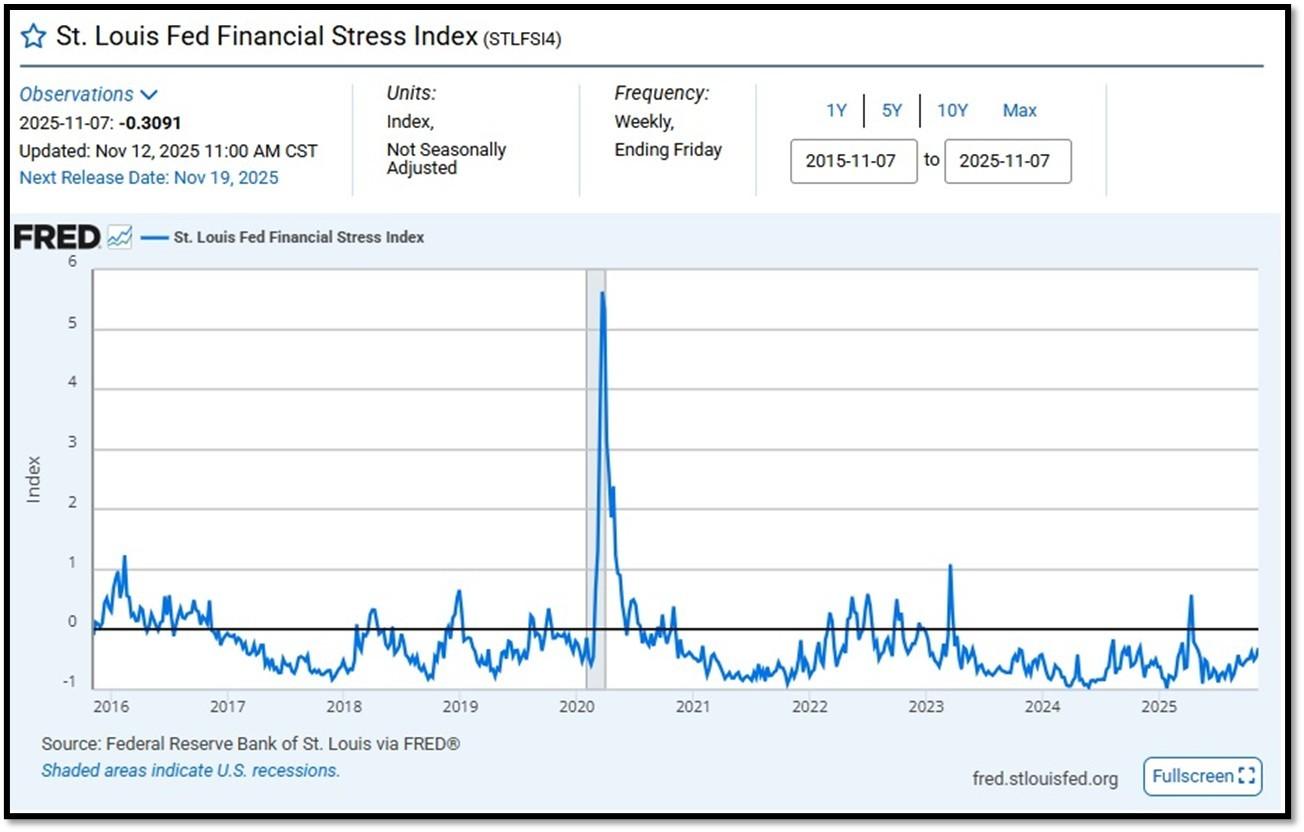
5B. St. Louis Fed Financial Stress Index’s (STLFSI4) most recent read is at –0.3091 as of November 12, 2025. Previous week’s data was -0.5404. A big spike up from previous readings reflecting the turmoil in the banking sector back in 2023. This weekly index is not seasonally adjusted. The STLFSI4 measures the degree of financial stress in the markets and is constructed from 18 weekly data series: seven interest rate series, six yield spreads and five other indicators. Each of these variables captures some aspect of financial stress. Accordingly, as the level of financial stress in the economy changes, the data series are likely to move together. REF: St. Louis Fed
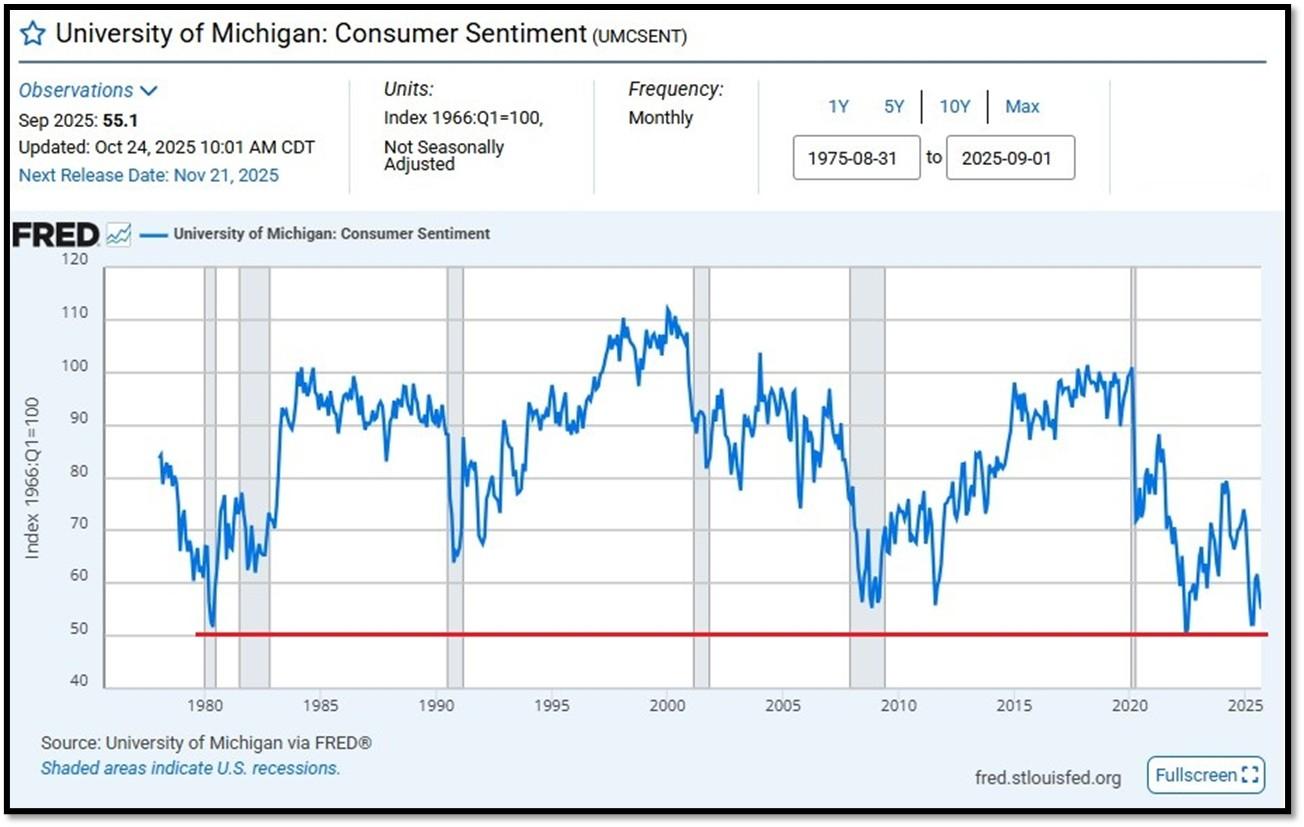
5C. University of Michigan, University of Michigan: Consumer Sentiment [UMCSEMT] for September at 55.1, retrieved from FRED, Federal Reserve Bank of St. Louis, October 24, 2025. Back in June 2022, Consumer Sentiment hit a low point going back to April 1980. REF: UofM
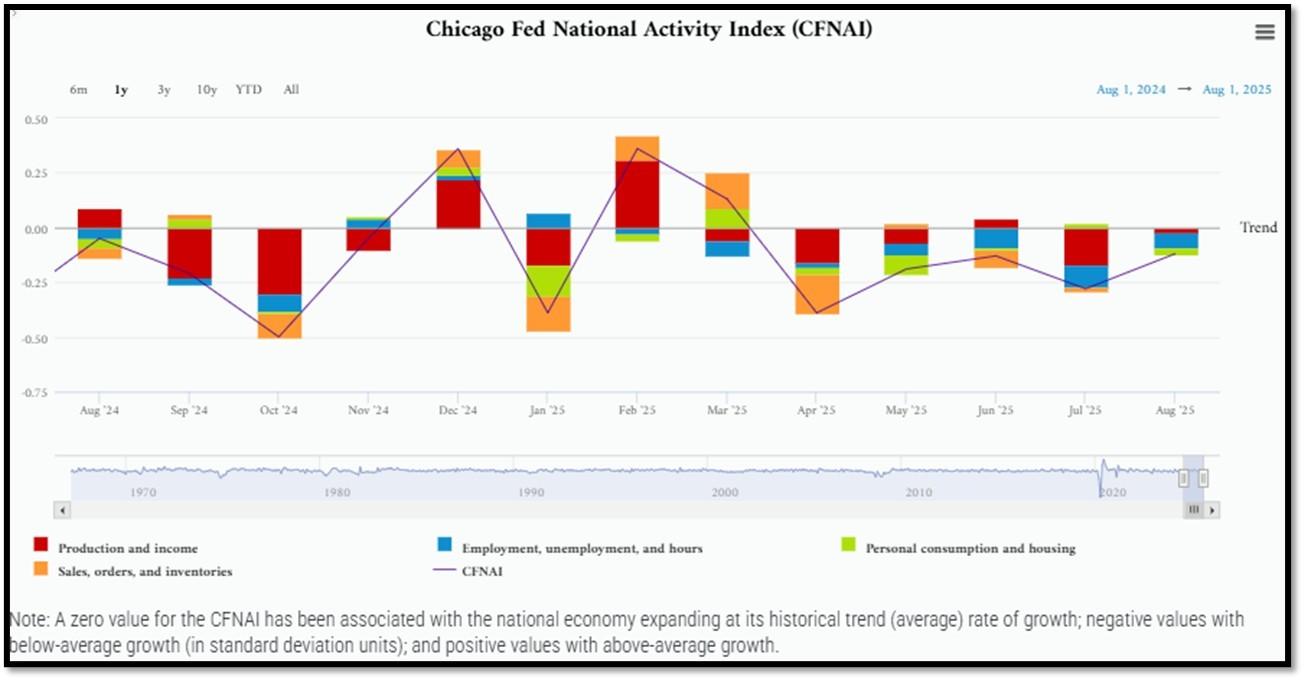
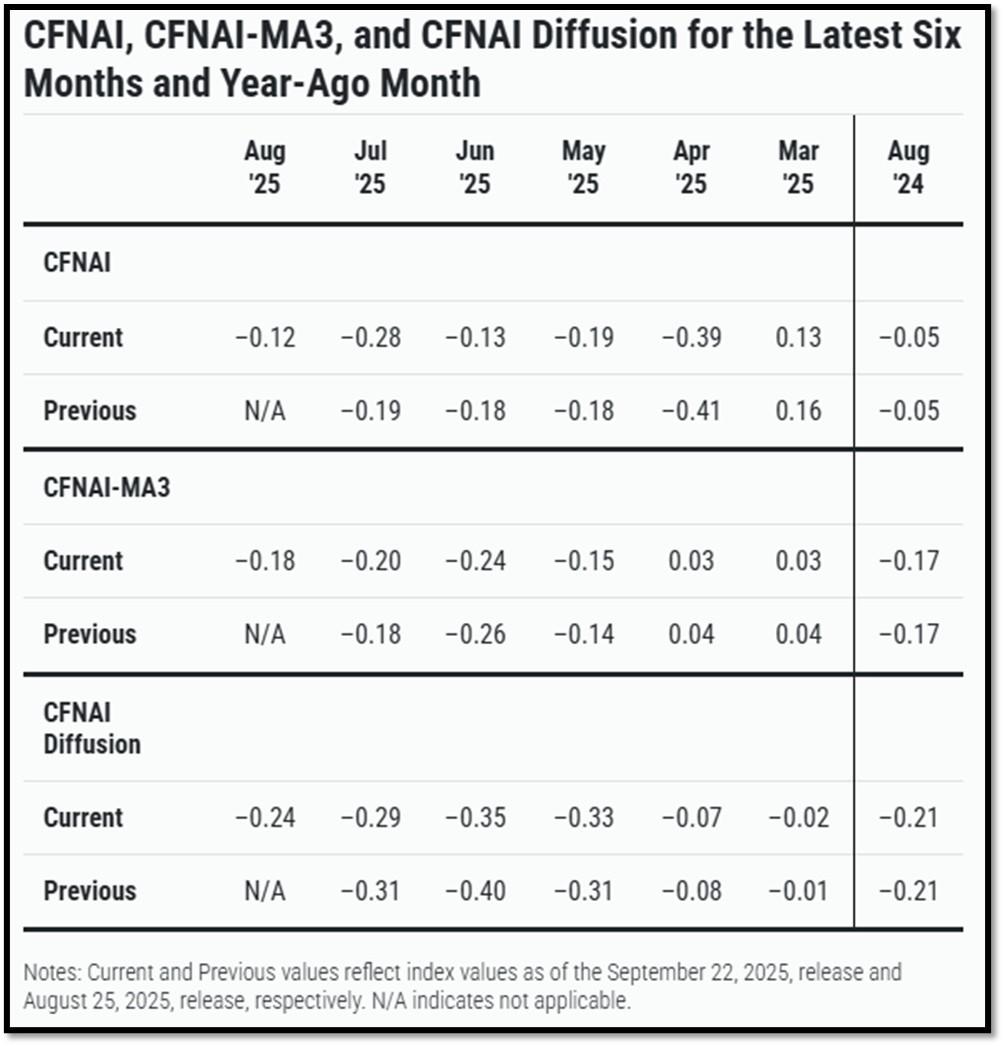
5D. The Chicago Fed National Activity Index (CFNAI) increased to –0.12 in August from –0.28 in July. Three of the four broad categories of indicators used to construct the index increased from July, but three categories made negative contributions in August. The index’s three-month moving average, CFNAI-MA3, increased to –0.18 in August from –0.20 in July. REF: ChicagoFed, August’s Report
5E. (9/18/2025) The Conference Board Leading Economic Index (LEI) for the US declined by 0.5% in August 2025 to 98.4 (2016=100), after a small 0.1% increase in July (upwardly revised from an originally reported 0.1% decline). The LEI fell by 2.8% over the six months between February and August 2025, a faster rate of decline than its 0.9% contraction over the previous six-month period (August 2024 to February 2025). The composite economic indexes are the key elements in an analytic system designed to signal peaks and troughs in the business cycle. The indexes are constructed to summarize and reveal common turning points in the economy in a clearer and more convincing manner than any individual component. The CEI is highly correlated with real GDP. The LEI is a predictive variable that anticipates (or “leads”) turning points in the business cycle by around 7 months. Shaded areas denote recession periods or economic contractions. The dates above the shaded areas show the chronology of peaks and troughs in the business cycle. The ten components of The Conference Board Leading Economic Index® for the U.S. include: Average weekly hours in manufacturing; Average weekly initial claims for unemployment insurance; Manufacturers’ new orders for consumer goods and materials; ISM® Index of New Orders; Manufacturers’ new orders for nondefense capital goods excluding aircraft orders; Building permits for new private housing units; S&P 500® Index of Stock Prices; Leading Credit Index™; Interest rate spread (10-year Treasury bonds less federal funds rate); Average consumer expectations for business conditions. REF: ConferenceBoard, LEI Report for August (ReceesionAlert) (Released on 9/30/2025)
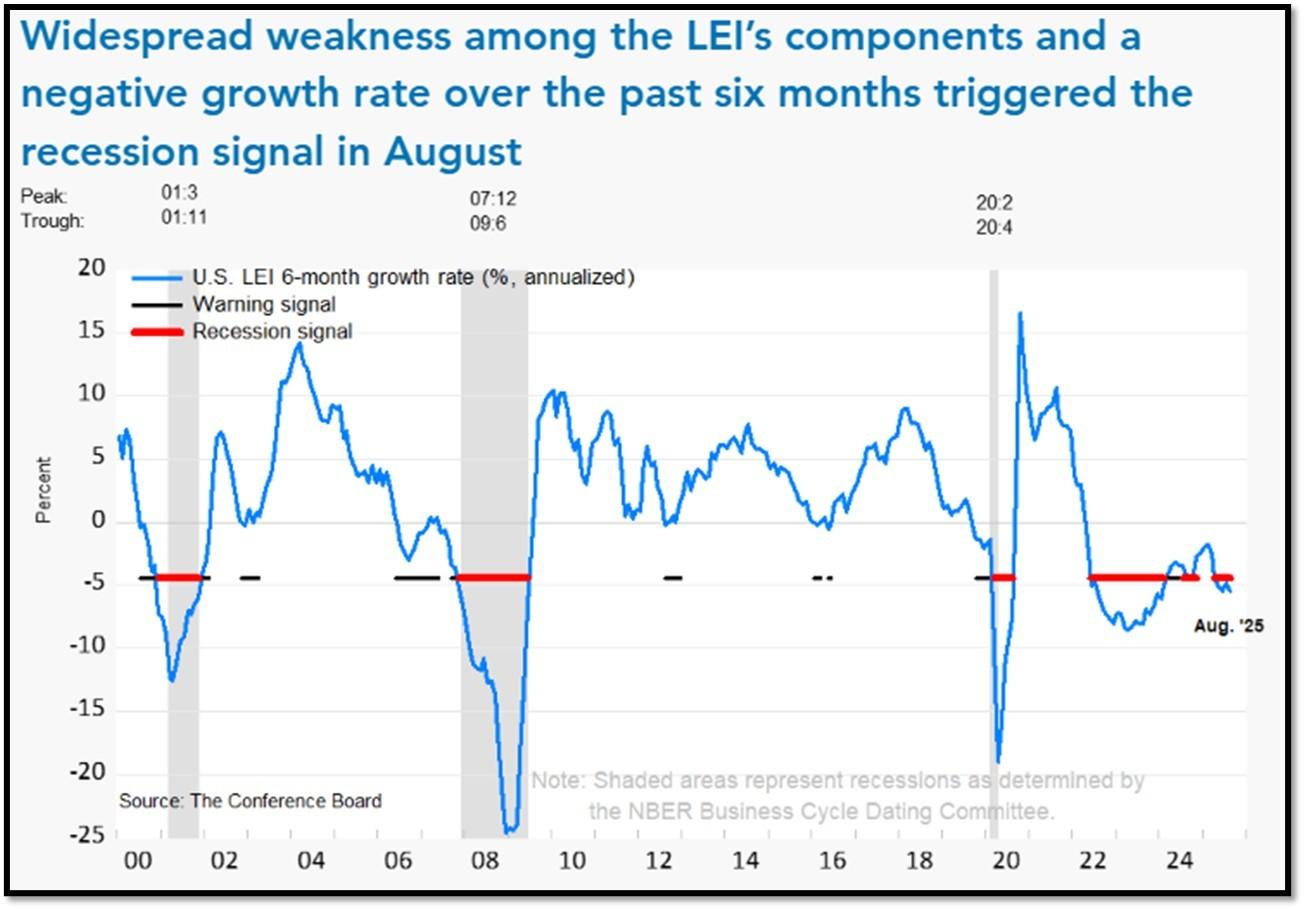
We have experienced a “rolling recession” since June 2022 and are only now emerging from it. However, authorities are not labeling it a recession due to high employment data from June 2022-2025.
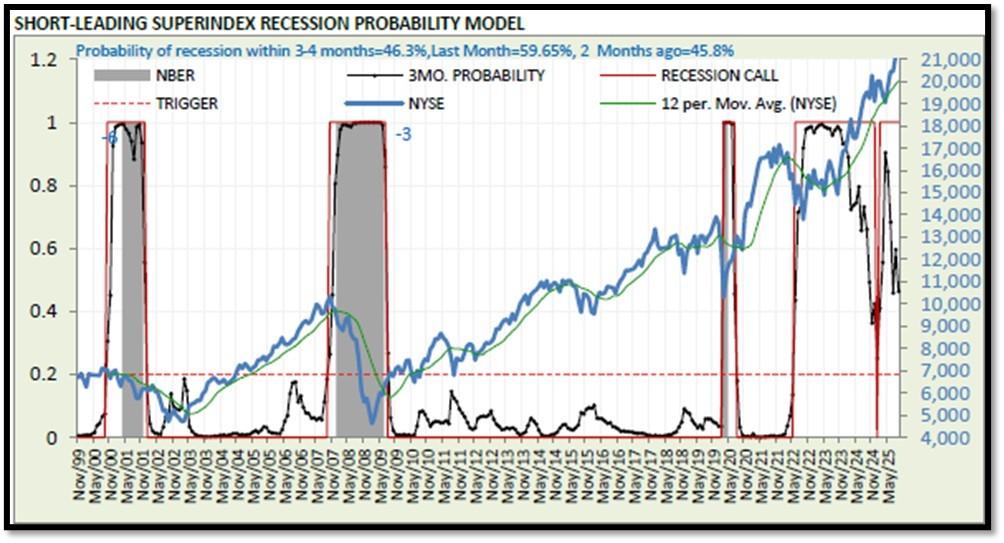
5F. Probability of U.S. falling into Recession within 3 to 4 months is currently at 46.3% (with data as of 09/28/2025 – Next Report 10/12/2025) according to RecessionAlert Research. Last release’s data was at 59.51%. This report is updated every two weeks. REF: RecessionAlertResearch
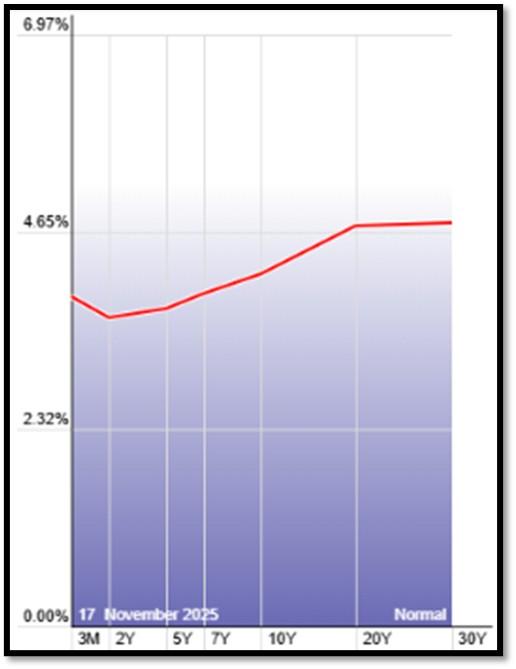
5G. Yield Curve as of 11/17/2025 is showing Normal. Spread on the 10-yr Treasury Yield (4.11%) minus yield on the 2-yr Treasury Yield (3.57%) is currently at 54bps as of 11/17/25. REF: Stockcharts The yield curve—specifically, the spread between the interest rates on the ten-year Treasury note and the three-month Treasury bill—is a valuable forecasting tool. It is simple to use and significantly outperforms other financial and macroeconomic indicators in predicting recessions two to six quarters ahead. REF: NYFED
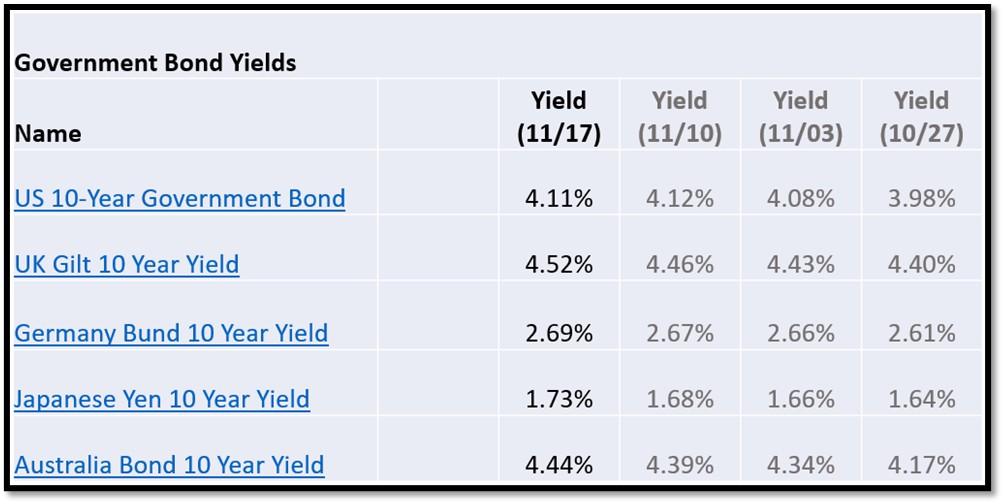
5H. Recent Yields in 10-Year Government Bonds. REF: Source is from Bloomberg.com, dated 11/17/2025, rates shown below are as of 11/17/2025, subject to change.
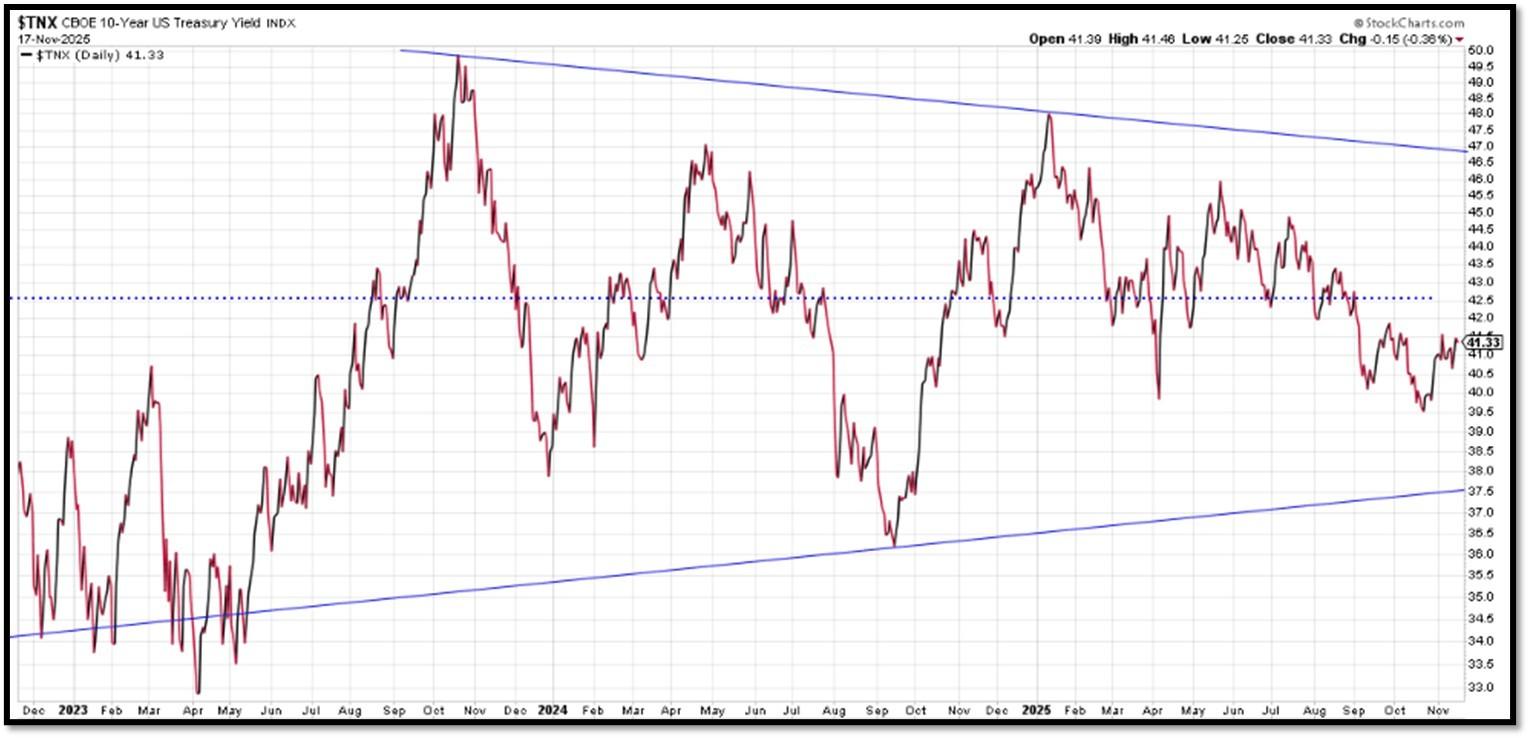
The 10-Year US Treasury Yield… The 10-Year Yield is indirectly related to inflation and prospect of the economy. I expect the 10-Year Yield to drop towards the support line. REF: StockCharts1
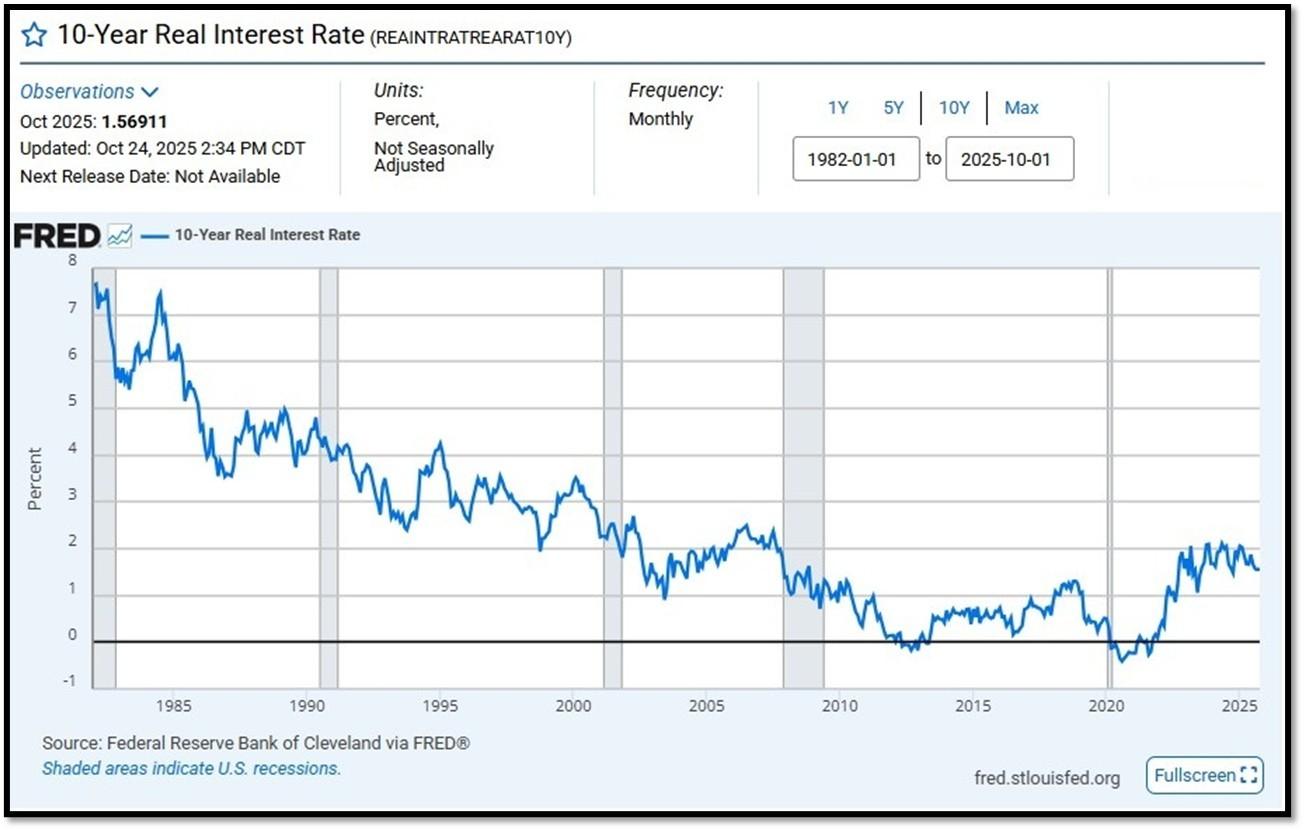
10-Year Real Interest Rate at 1.56911% as of 10/24/25. Last month’s data was 1.56046%. REF: REAINTRATREARAT10Y
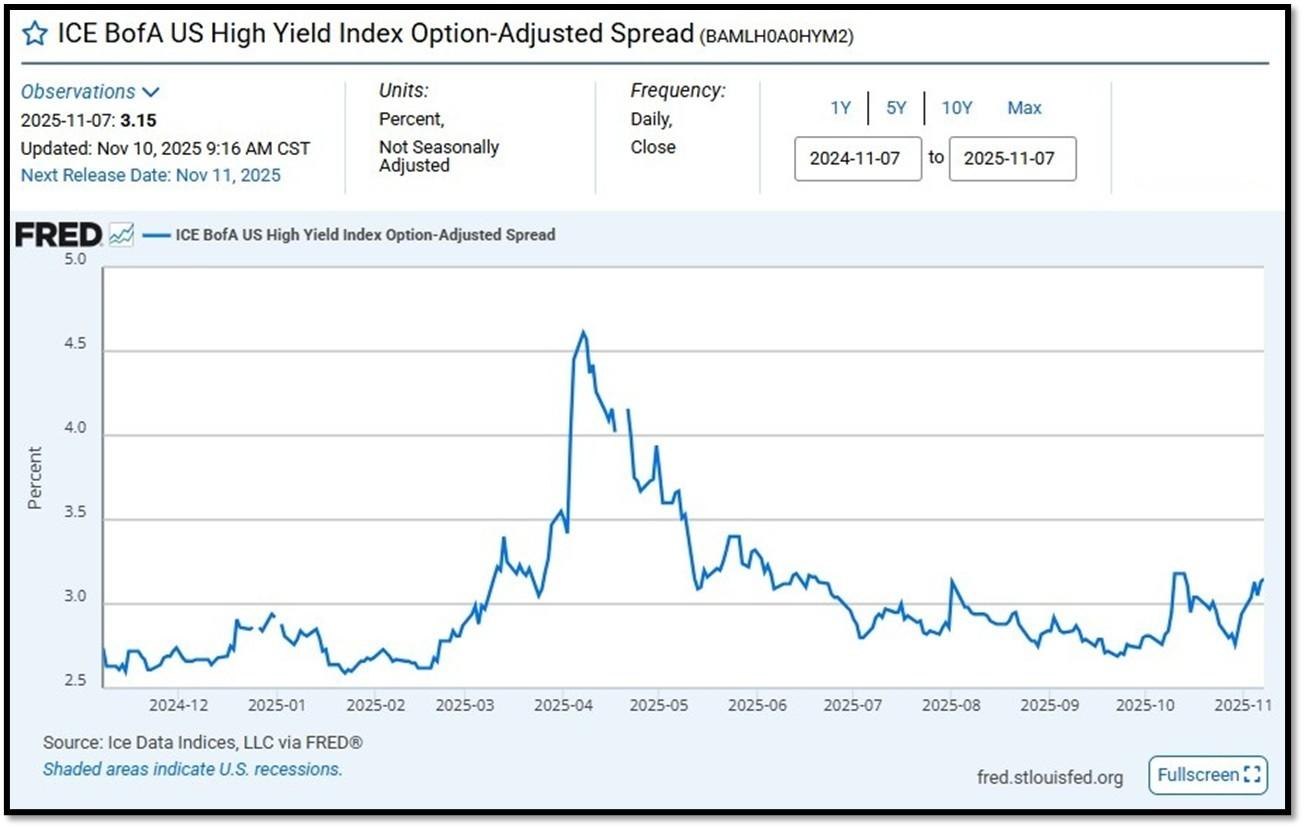
ICE BofA US High Yield Index Option-Adjusted Spread (BAMLH0A0HYM2) currently at 3.07 as of November 17, 2025. This is a key indicator of market sentiment, particularly regarding risk and economic health. At its core, the spread reflects the extra return investors demand to hold riskier corporate debt over safer government securities. High-yield bonds are issued by companies with lower credit ratings (below investment grade, like BB or lower), meaning they carry a higher chance of default. The spread compensates for this risk. When the spread is narrow—say, around 2.5% to 3%, as seen recently—it suggests investors are confident, willing to accept less extra yield because they perceive lower default risk or a strong economy. Narrow spreads often align with bullish markets, where cash is flowing, growth is steady, and fear is low. REF: FRED-BAMLH0A0HYM2
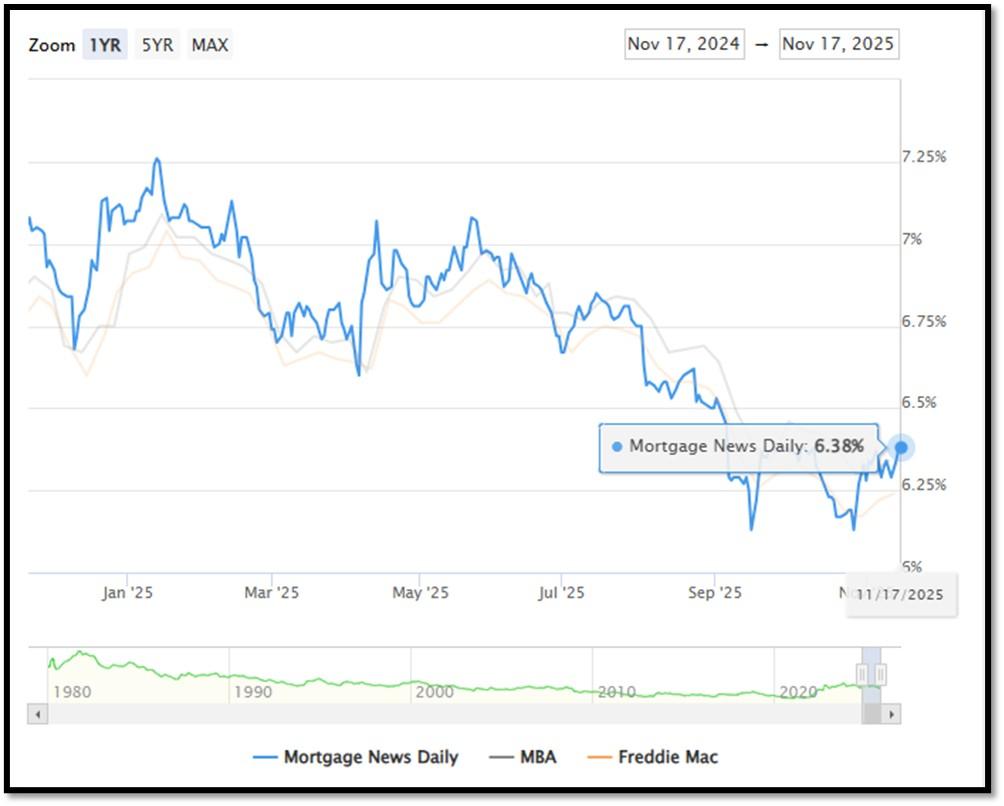
5I. (11/17/2025) Today’s National Average 30-Year Fixed Mortgage Rate is 6.38% (All Time High was 8.03% on 10/19/23). Last week’s data was 6.34%. This rate is the average 30-year fixed mortgage rates from several different surveys including Mortgage News Daily (daily index), Freddie Mac (weekly survey), Mortgage Bankers Association (weekly survey) and FHFA (monthly survey). REF: MortgageNewsDaily, Today’s Average Rate
The recent spike in the 30-year fixed-rate jumbo mortgage to 6.38%, compared to Freddie Mac’s rate at 6.24% and the Mortgage Bankers Association (MBA) rate at 6.34%, highlights key differences in the mortgage market. Jumbo mortgages, which exceed the conforming loan limits set by government agencies like Freddie Mac, typically carry higher interest rates because they are riskier for lenders. These loans are not backed by government entities, which increases the risk for lenders and, consequently, leads to higher rates. In contrast, Freddie Mac and MBA provide averages for conforming loans, which meet federal guidelines and have lower risk due to government backing, keeping their rates lower.
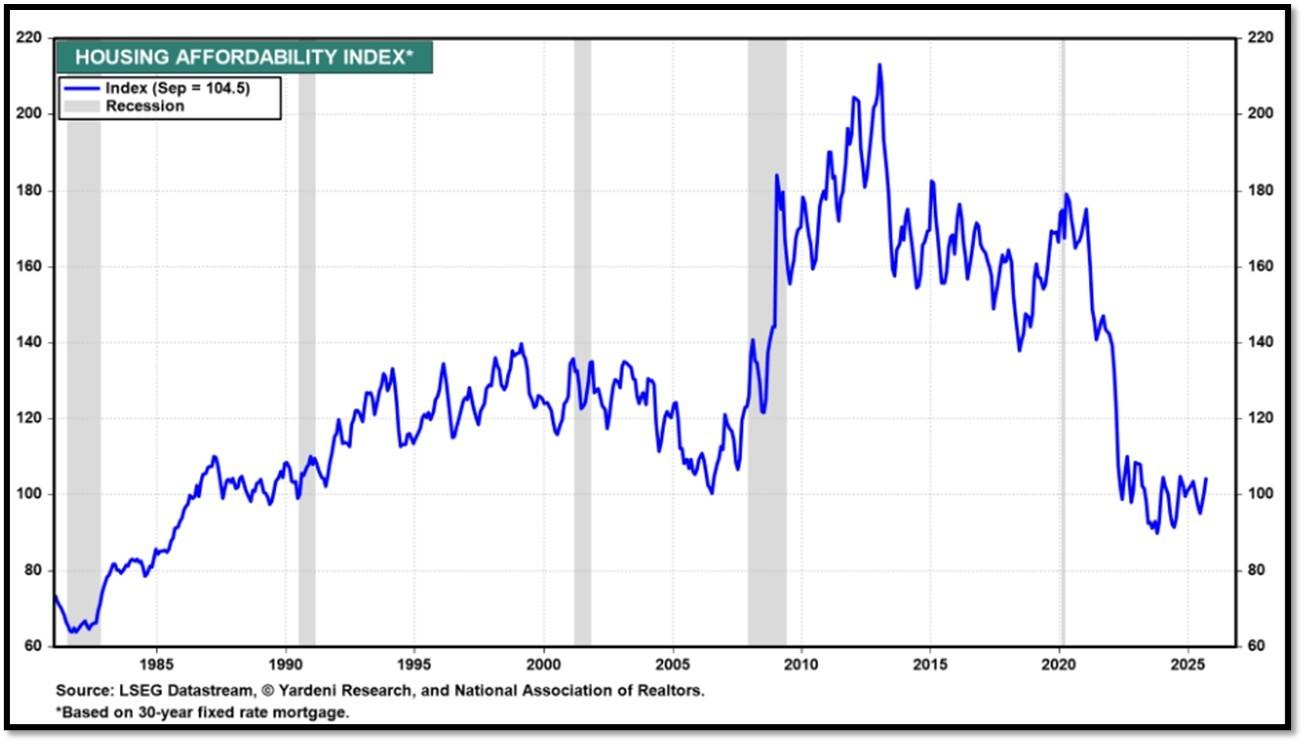
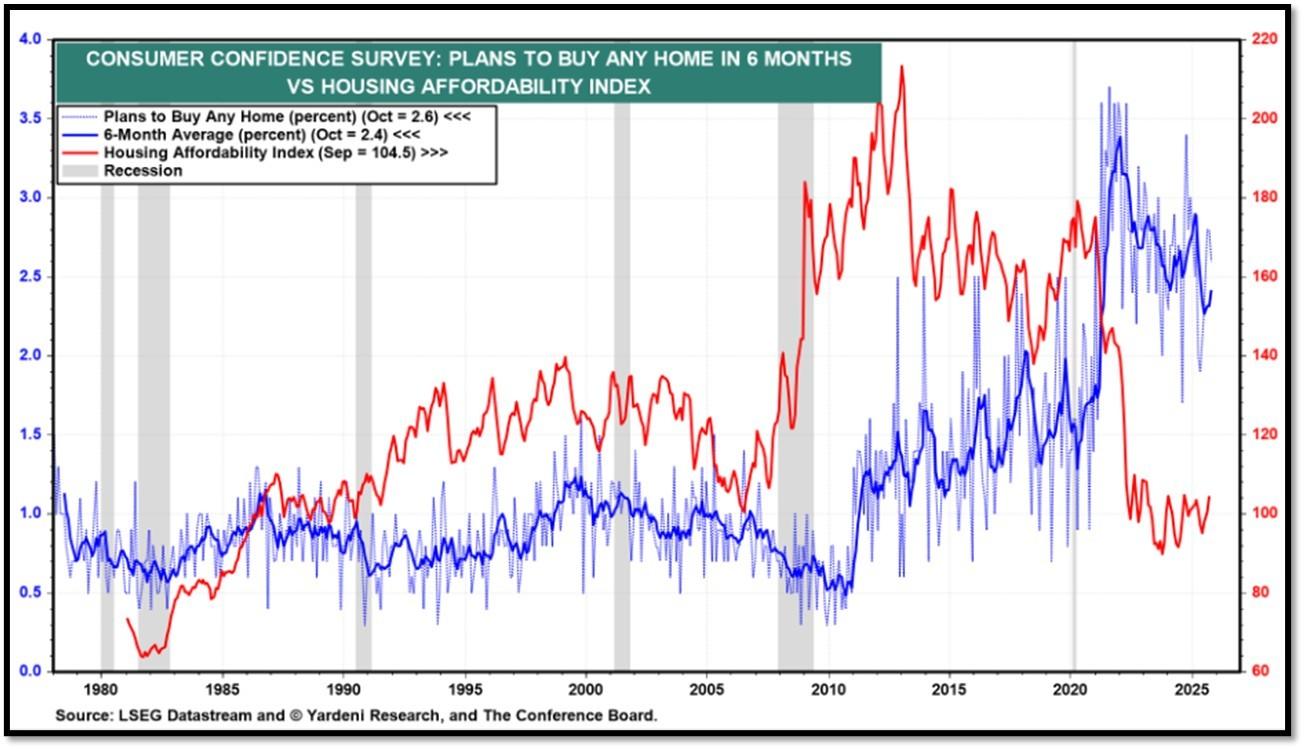
Housing Affordability Index for Sep = 104.5 // Aug = 100.5 // July = 98.8 // Jun = 94.4 // May = 97.2 // Apr = 101.0 // Mar = 103.2 // Feb = 102.2. Data provided by Yardeni Research. REF: Yardeni
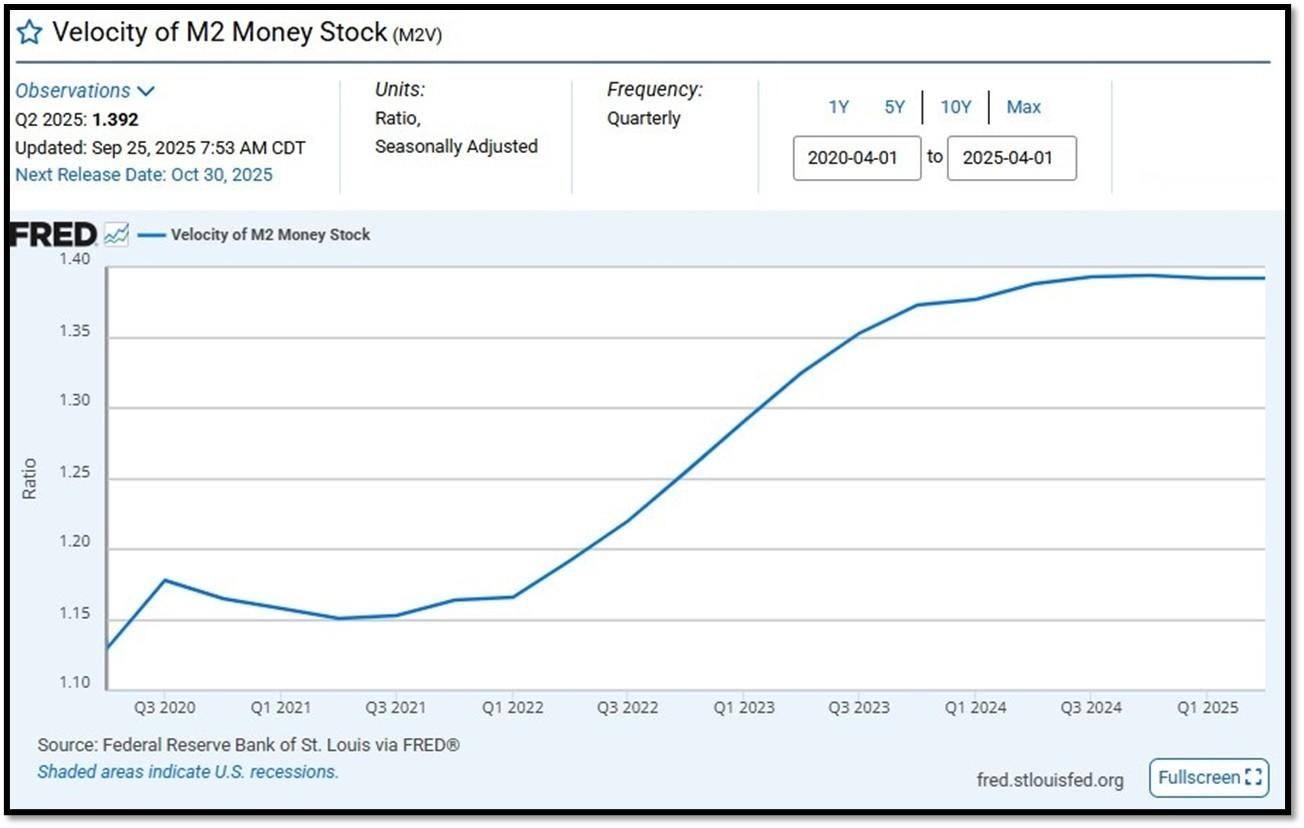
5J. Velocity of M2 Money Stock (M2V) with current read at 1.392 as of (Q2-2025 updated September 25, 2025). Previous quarter’s data was 1.386. The velocity of money is the frequency at which one unit of currency is used to purchase domestically- produced goods and services within a given time period. In other words, it is the number of times one dollar is spent to buy goods and services per unit of time. If the velocity of money is increasing, then more transactions are occurring between individuals in an economy. Current Money Stock (M2) report can be viewed in the reference link. REF: St.LouisFed-M2V
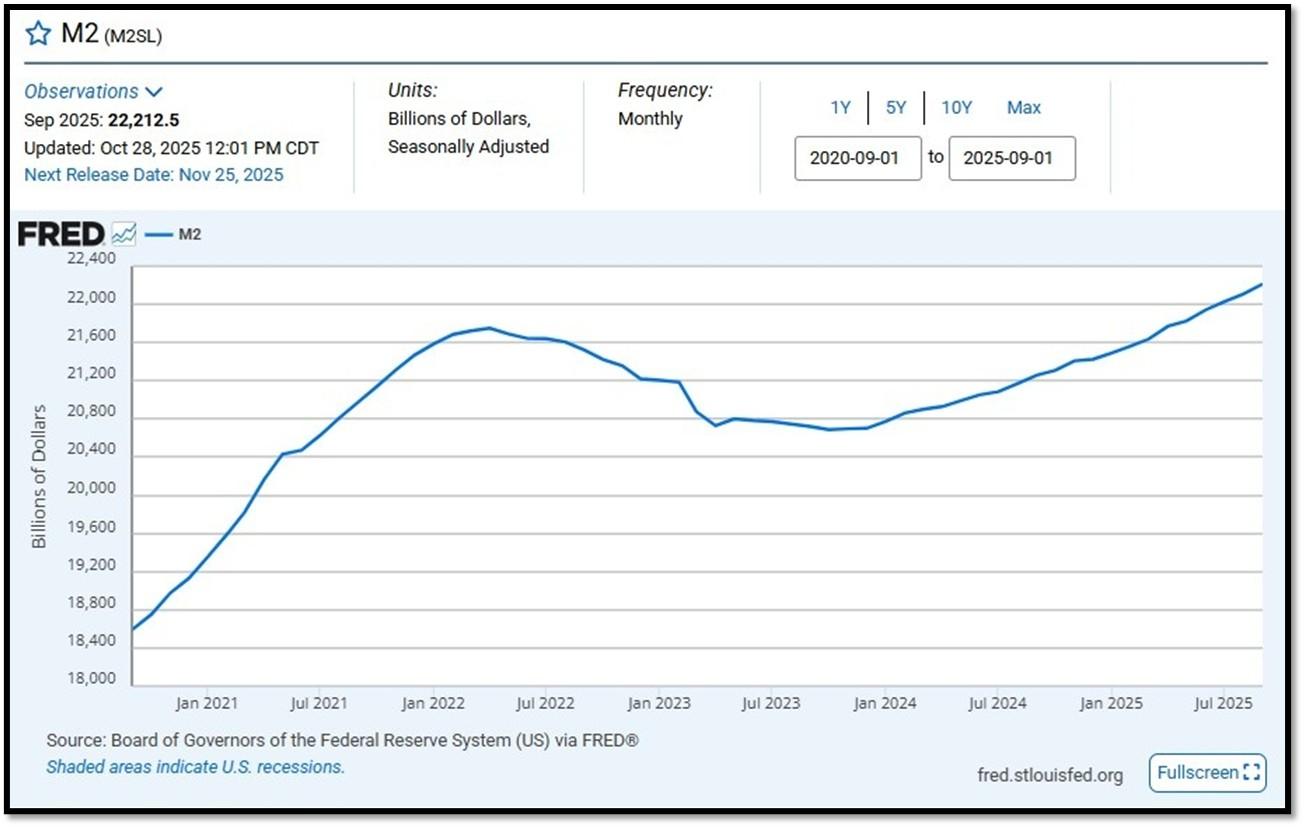
M2 consists of M1 plus (1) small-denomination time deposits (time deposits in amounts of less than $100,000) less IRA and Keogh balances at depository institutions; and (2) balances in retail MMFs less IRA and Keogh balances at MMFs. Seasonally adjusted M2 is constructed by summing savings deposits (before May 2020), small-denomination time deposits, and retail MMFs, each seasonally adjusted separately, and adding this result to seasonally adjusted M1. Board of Governors of the Federal Reserve System (US), M2 [M2SL], retrieved from FRED, Federal Reserve Bank of St. Louis; Updated on October 28, 2025. REF: St.LouisFed-M2
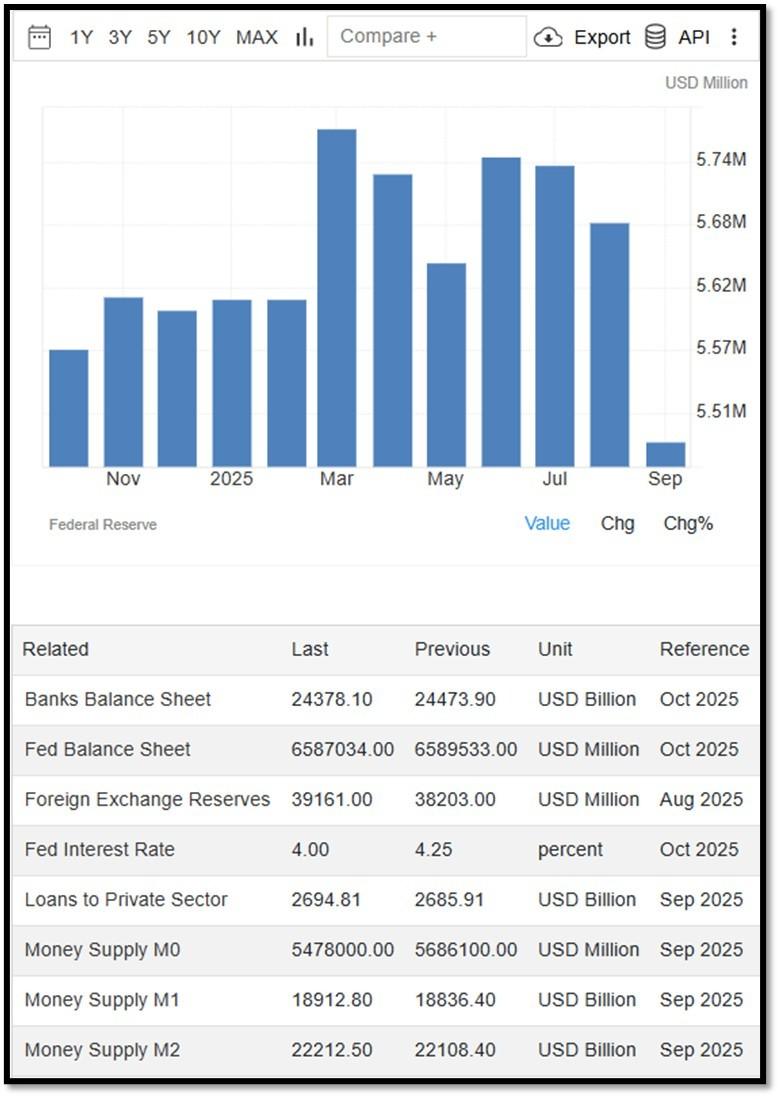
Money Supply M0 in the United States decreased to 5,478,000 USD Million in September from 5,686,100 USD Million in August of 2025. Money Supply M0 in the United States averaged 1,216,883.40 USD Million from 1959 until 2025, reaching an all time high of 6,413,100.00 USD Million in December of 2021 and a record low of 48,400.00 USD Million in February of 1961. REF: TradingEconomics, M0
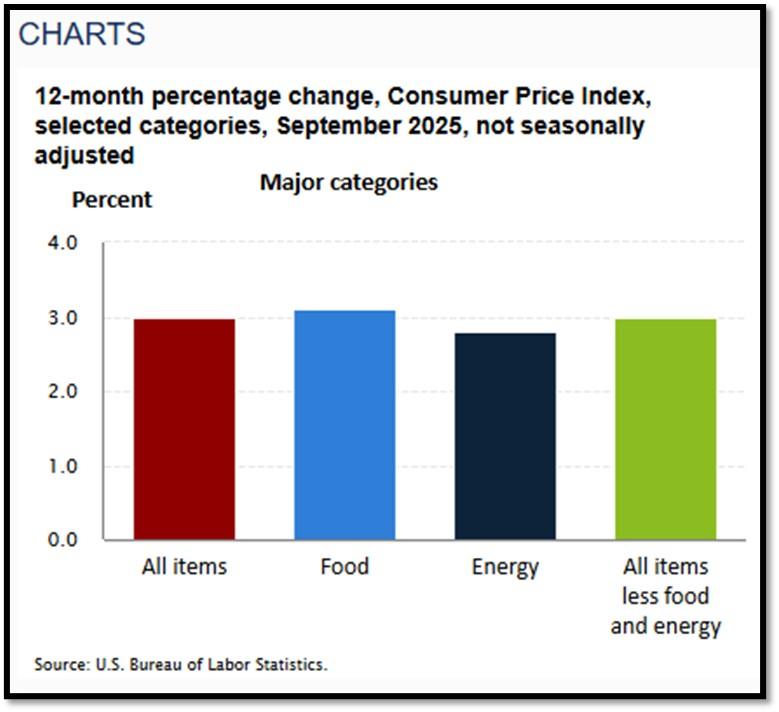
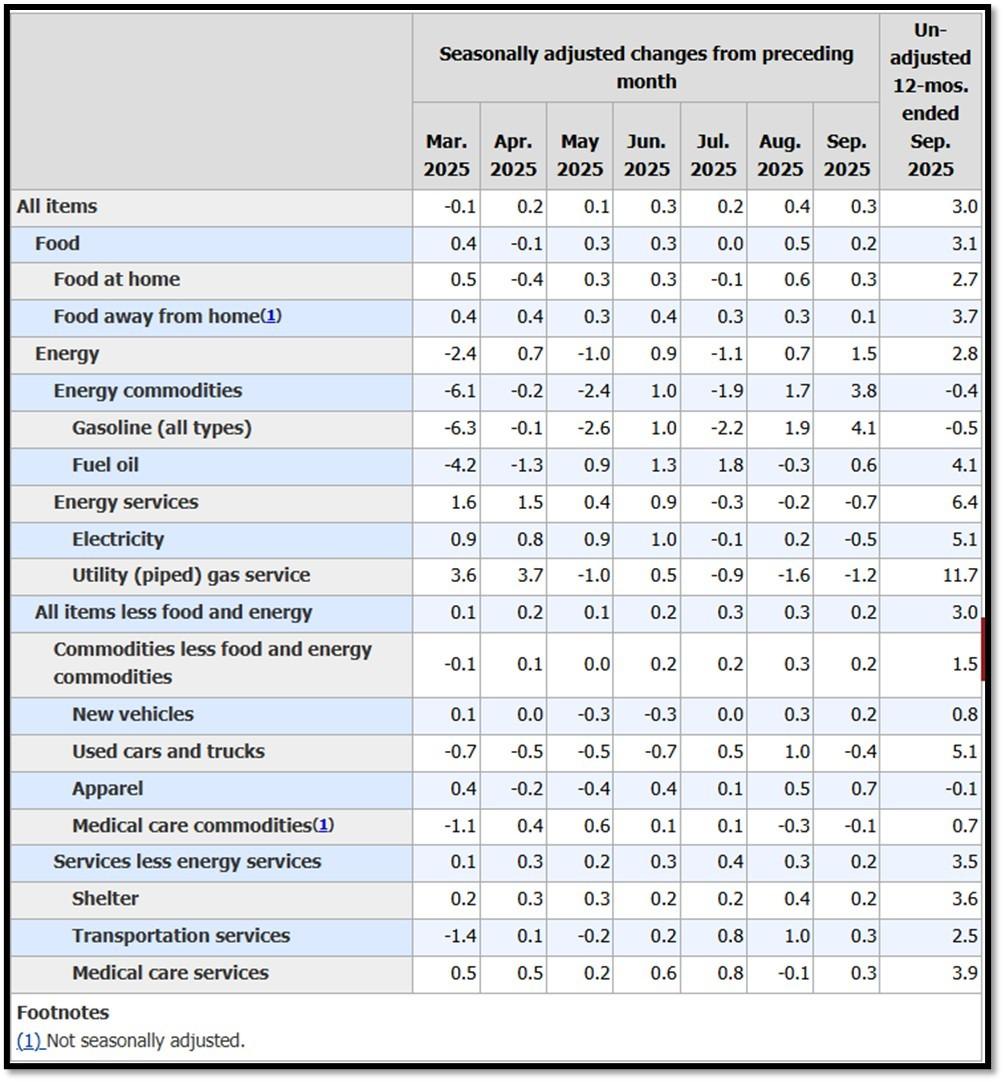
5K. In September, the Consumer Price Index for All Urban Consumers rose 0.3 percent, seasonally adjusted, and rose 3.0 percent over the last 12 months, not seasonally adjusted. The index for all items less food and energy increased 0.2 percent in September (SA); up 3.0 percent over the year (NSA). No announcement was made on October 2025’s CPI data. REF: BLS, BLS.GOV
5L. Technical Analysis of the S&P500 Index. Click onto reference links below for images.
- Short-term Chart: Trend Less Bullish on 11/17/2025 – REF: Short-term S&P500 Chart by Marc Slavin (Click Here to Access Chart)
- Medium-term Chart: Trend Bullish on 11/17/2025 – REF: Medium-term S&P500 Chart by Marc Slavin (Click Here to Access Chart)
- Market Timing Indicators – S&P500 Index as of 11/17/2025 – REF: S&P500 Charts (7 of them) by Joanne Klein’s Top 7 (Click Here to Access Updated Charts)
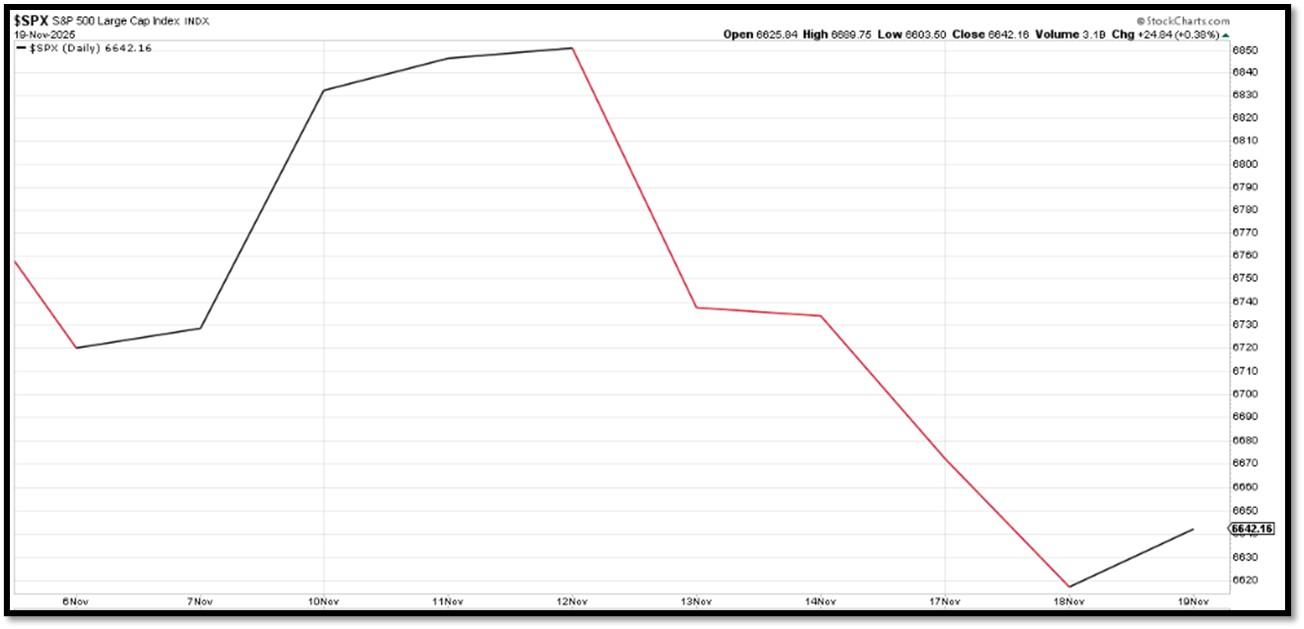
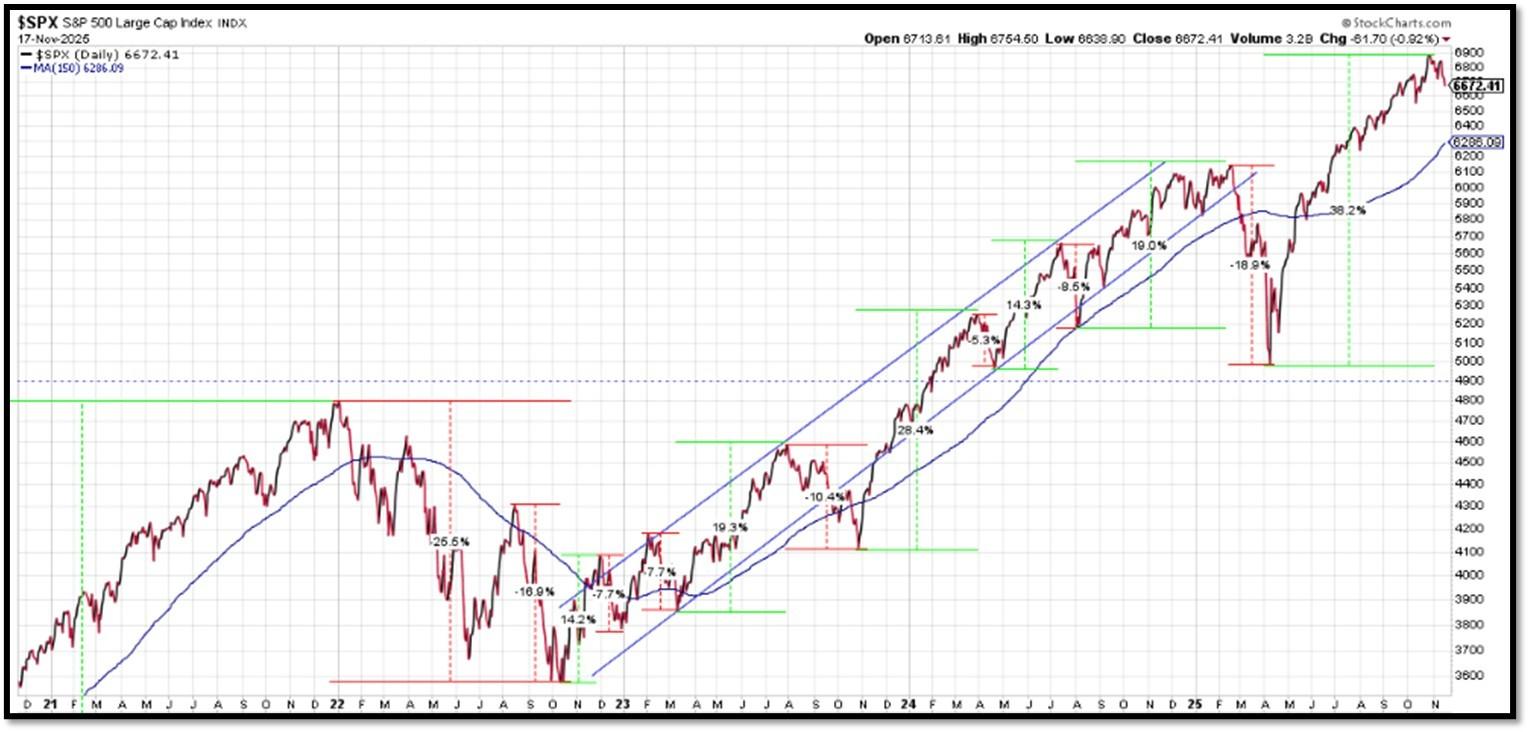
- The S&P500 is hitting all-time-high, rebounding from a V-shaped recovery to all-time high. REF: Stockcharts
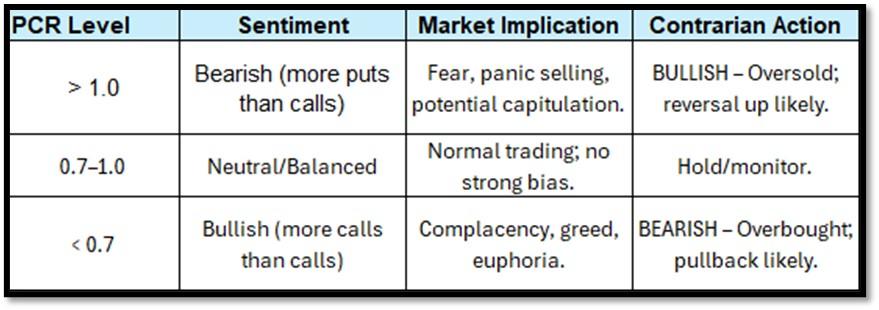
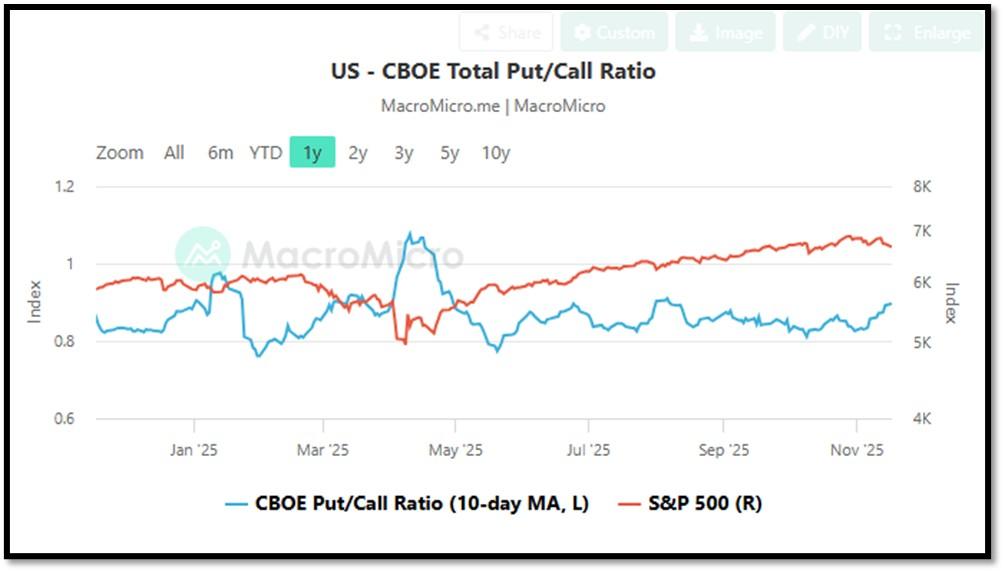
- CBOE Total Put/Call Ratio as of 11/17/2025. REF: MacroMicro
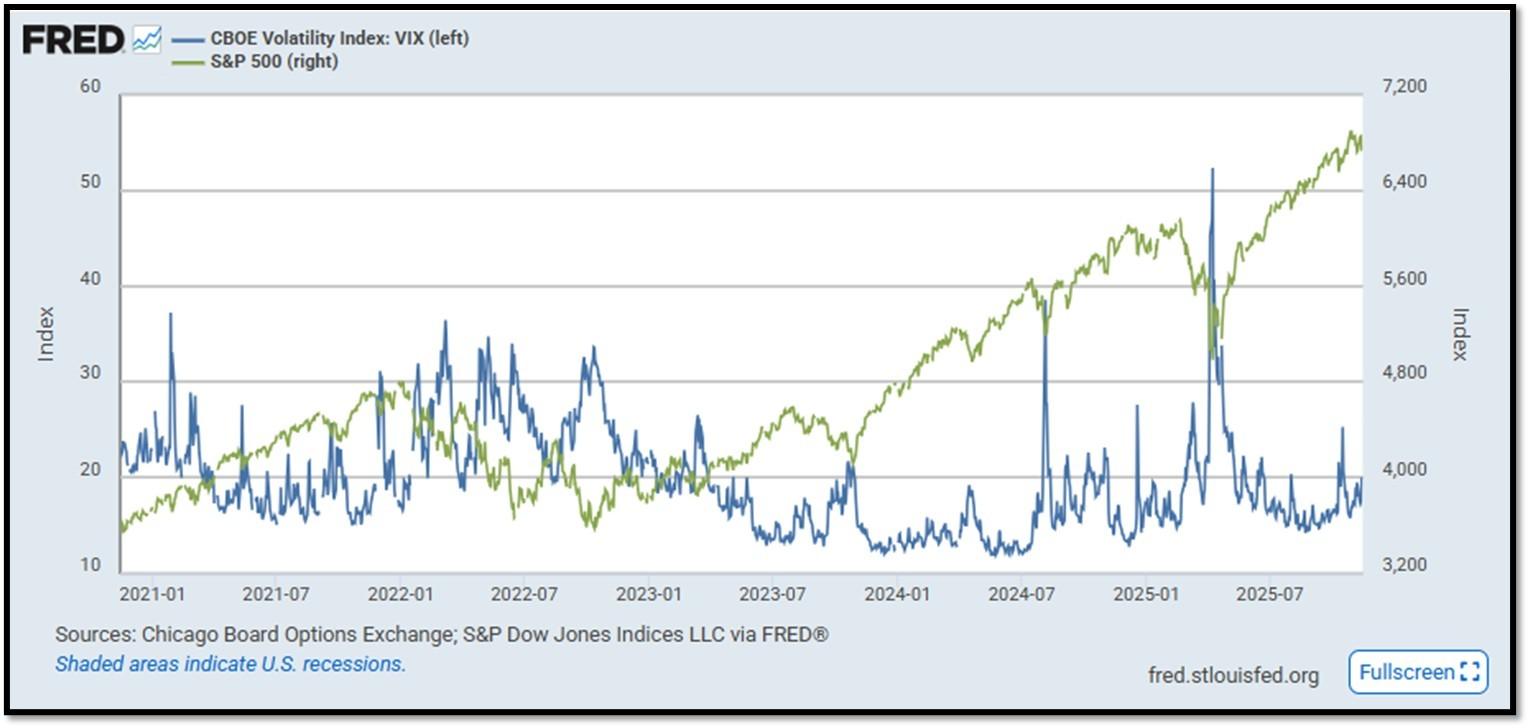
- S&P500 and CBOE Volatility Index (VIX) as of 11/17/2025. REF: FRED, Today’s Print
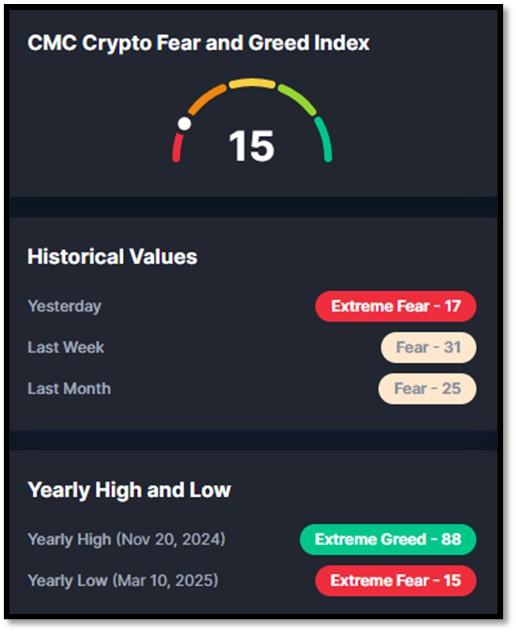
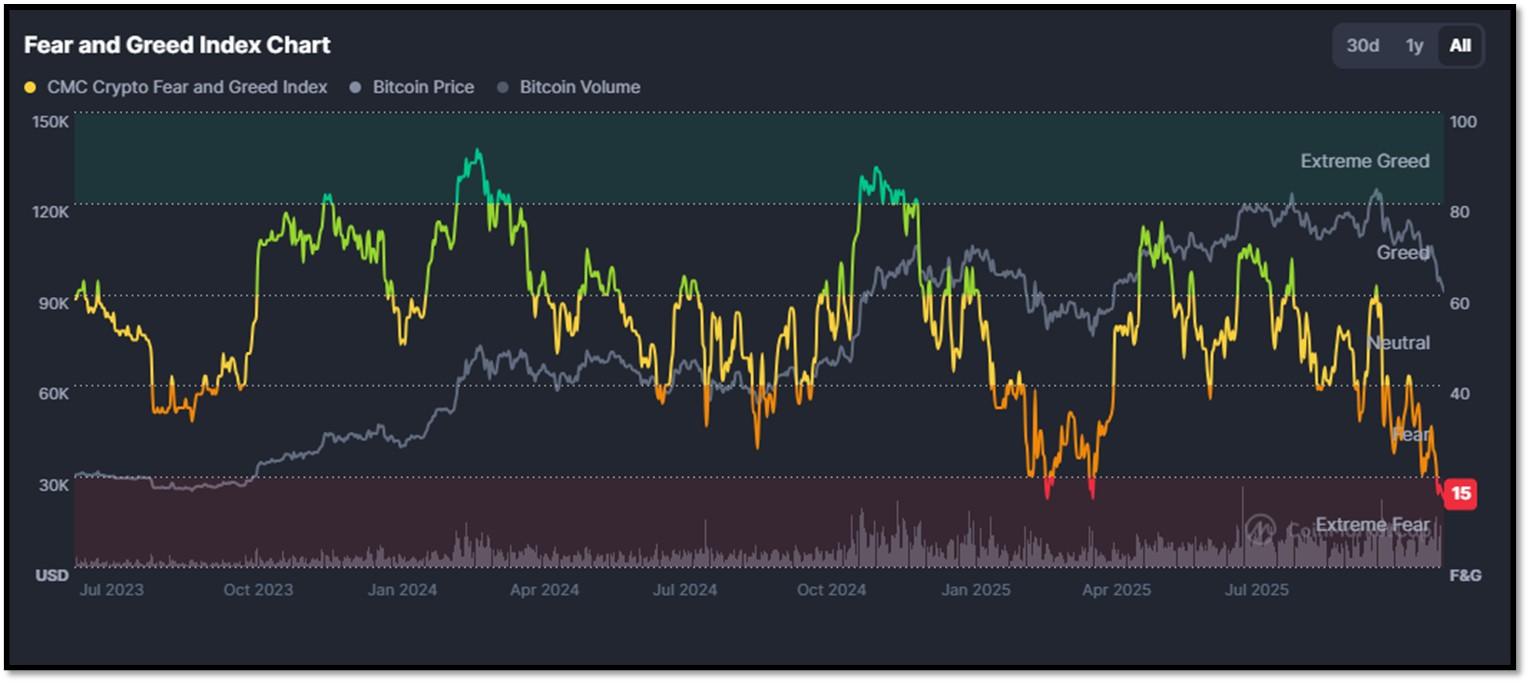
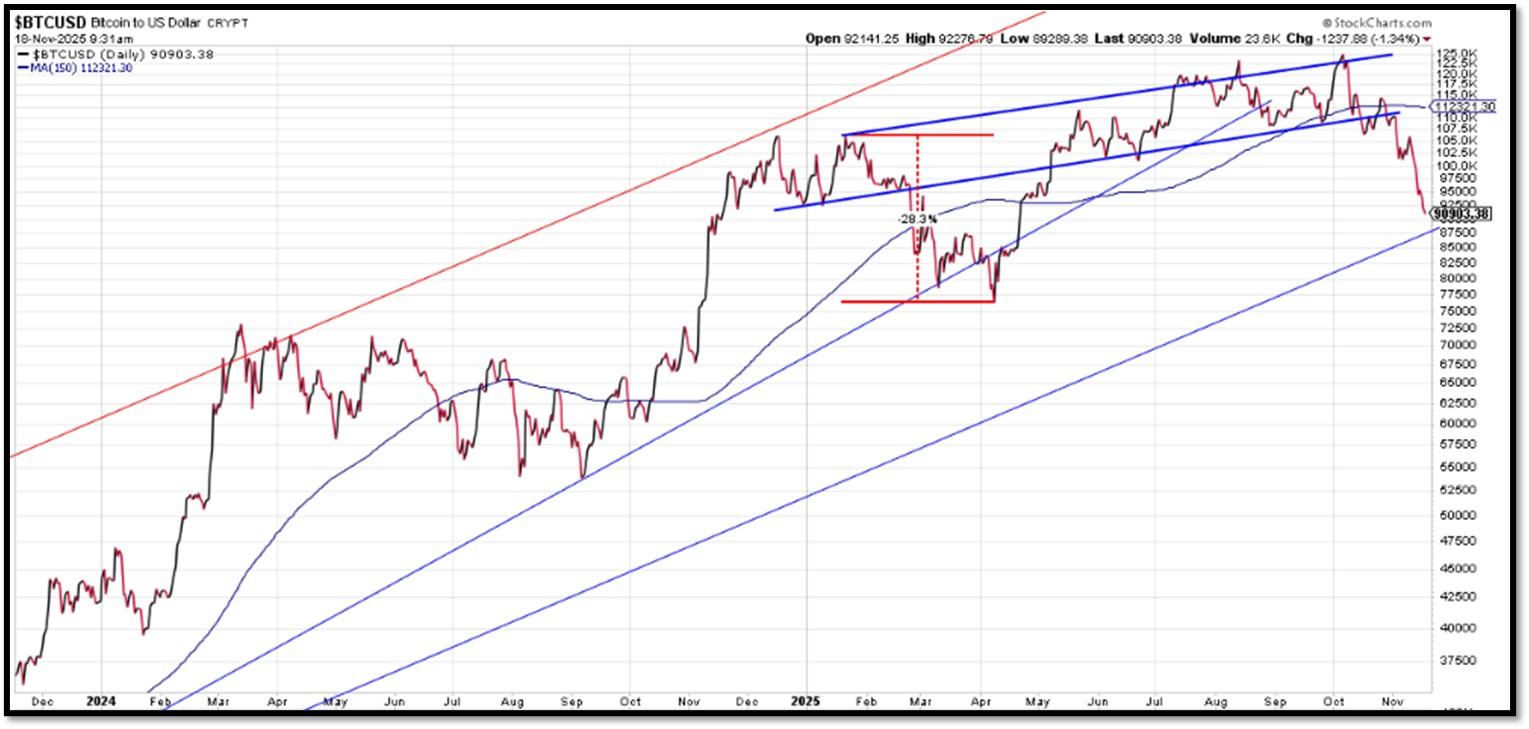
5M. Most recent read on the Crypto Fear & Greed Index with data as of 11/18/2025 is 15 (Extreme Fear). Last week’s data was 31 (Fear) (1-100). Fear & Greed Index – A Contrarian Data. The crypto market behavior is very emotional. People tend to get greedy when the market is rising which results in FOMO (Fear of missing out). Also, people often sell their coins in irrational reaction of seeing red numbers. With the Crypto Fear and Greed Index, the data try to help save investors from their own emotional overreactions. There are two simple assumptions:
- Extreme fear can be a sign that investors are too worried. That could be a buying opportunity.
- When Investors are getting too greedy, that means the market is due for a correction.
Therefore, the program for this index analyzes the current sentiment of the Bitcoin market and crunch the numbers into a simple meter from 0 to 100. Zero means “Extreme Fear”, while 100 means “Extreme Greed”. REF: Coinmarketcap.com, Today’sReading
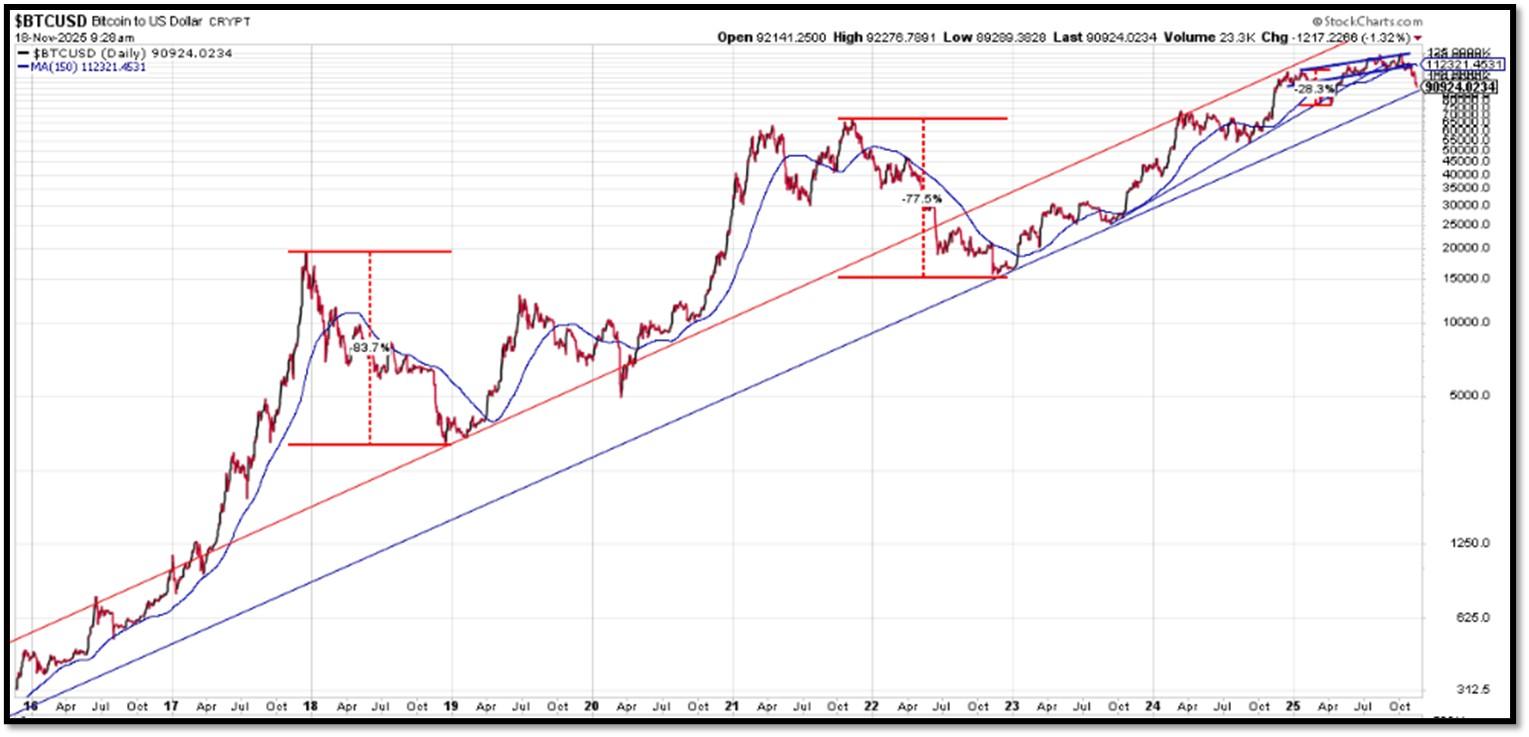
Bitcoin – 10-Year & 2-Year Charts. REF: Stockcharts10Y, Stockcharts2Y
From the desk of our Chief Investment Officer
As an investment professional with over twenty-six years of experience in the financial services industry, Andrew helps clients to protect, grow and transfer wealth during their lifetime with objective, unbiased, customized and efficient strategies.
Education, Professional Licenses Acquired & Affiliations
- Passed the Series 7, 63, 65 and 24 license examinations
- Currently holding Series 65 License
- BA in Economics – Boston University (Boston, MA) 1993
- Certificate in Commodities Trading – New York University (New York, NY) 1991
- Certificate in Financial Planning – New York University (New York, NY) April 2011
With extensive experience in the Financial Services Industry, Andrew Tang and Turner Financial Group provides disciplined wealth management with an intelligent caring approach to each and every client that compliments the Dedicated Financial offering.


Len writes much of his own content, and also shares helpful content from other trusted providers like Turner Financial Group (TFG).
The material contained herein is intended as a general market commentary, solely for informational purposes and is not intended to make an offer or solicitation for the sale or purchase of any securities. Such views are subject to change at any time without notice due to changes in market or economic conditions and may not necessarily come to pass. This information is not intended as a specific offer of investment services by Dedicated Financial and Turner Financial Group, Inc.
Dedicated Financial and Turner Financial Group, Inc., do not provide tax, legal or accounting advice. You should consult your own tax, legal and accounting advisors before engaging in any transaction.
Any hyperlinks in this document that connect to Web Sites maintained by third parties are provided for convenience only. Turner Financial Group, Inc. has not verified the accuracy of any information contained within the links and the provision of such links does not constitute a recommendation or endorsement of the company or the content by Dedicated Financial or Turner Financial Group, Inc. The prices/quotes/statistics referenced herein have been obtained from sources verified to be reliable for their accuracy or completeness and may be subject to change.
Past performance is no guarantee of future returns. Investing involves risk and possible loss of principal capital. The views and strategies described herein may not be suitable for all investors. To the extent referenced herein, real estate, hedge funds, and other private investments can present significant risks, including loss of the original amount invested. All indexes are unmanaged, and an individual cannot invest directly in an index. Index returns do not include fees or expenses.
Turner Financial Group, Inc. is an Investment Adviser registered with the United States Securities and Exchange Commission however, such registration does not imply a certain level of skill or training and no inference to the contrary should be made. Additional information about Turner Financial Group, Inc. is also available at www.adviserinfo.sec.gov. Advisory services are only offered to clients or prospective clients where Turner Financial Group, Inc. and its representatives are properly licensed or exempt from licensure. No advice may be rendered by Turner Financial Group, Inc. unless a client service agreement is in place.


