

- 1. The recent stock market selloff can be traced to ultra short-term liquidity stress rather than structural economic weakness.
- 2. Main story this week focuses on US Youth Unemployment. Unemployment could hit 25% among recent graduates.
- 3. The recent market selloff has pushed many stocks and funds into negative territory for the year, creating a timely opportunity for tax loss harvesting.
- 4. World Watch
- 4A. Meta is reportedly in discussions to incorporate Google AI chips into parts of its infrastructure.
- 4B. The United States government has secured lower prices for Ozempic and fourteen other major prescription drugs through Medicare’s new negotiating authority, marking a major shift in federal drug pricing policy.
- 4C. An updated snapshot of the current global state of economy
- 5. Quant & Technical Corner – A selection of quantitative & technical data we monitor on a regular basis to help gauge the overall financial market conditions and the investment environment.
1. The recent stock market selloff can be traced to ultra short-term liquidity stress rather than structural economic weakness.
Disruptions in the repo market, combined with the temporary government shutdown, reduced the normal flow of liquidity from the Treasury Department and created momentary dislocations across funding markets. Sentiment further deteriorated due to misinformation about alleged accounting issues at META and ORCL, which later proved unfounded, along with forced liquidations in crypto that spilled into broader risk assets. Added to this were renewed fears of an AI bubble, even though we believe the AI cycle has not fully formed. News of Google TPUs gaining META business does not signal the end of Nvidia leadership, as the transition from general purpose computing to accelerated computing supports a market large enough for multiple suppliers and remains essential for preserving United States technological competitiveness in the AI race. Taken together, these factors suggest the recent selloff is driven by temporary liquidity pressure rather than a breakdown in fundamentals, and therefore can be viewed as a buying opportunity.
Regarding interest rates, we maintain a strong conviction that a 25-basis point cut is likely in December as the labor market continues to weaken. The ongoing trend of corporations reducing headcount while increasing capital spending in technology is expected to persist as firms prioritize automation, AI integration, and productivity over labor expansion. College graduate unemployment has now risen above ten percent, highlighting the depth of labor market softness, and reinforcing the case for monetary easing. These conditions support the view that policy will soon shift toward accommodation, setting the stage for potential stabilization in risk assets and helping validate opportunities created by the recent market decline.
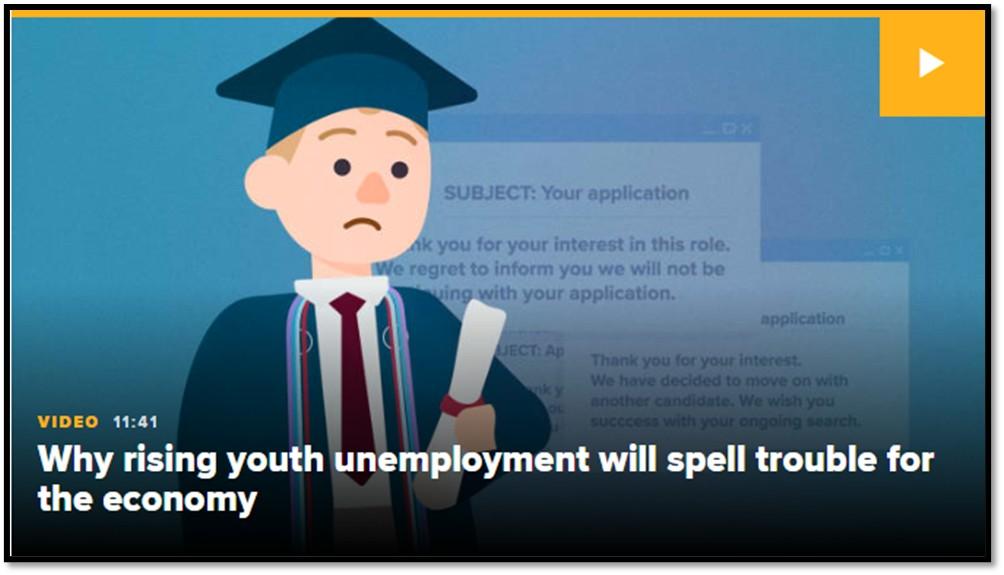
2. Main story this week focuses on US Youth Unemployment. Unemployment could hit 25% among recent graduates.
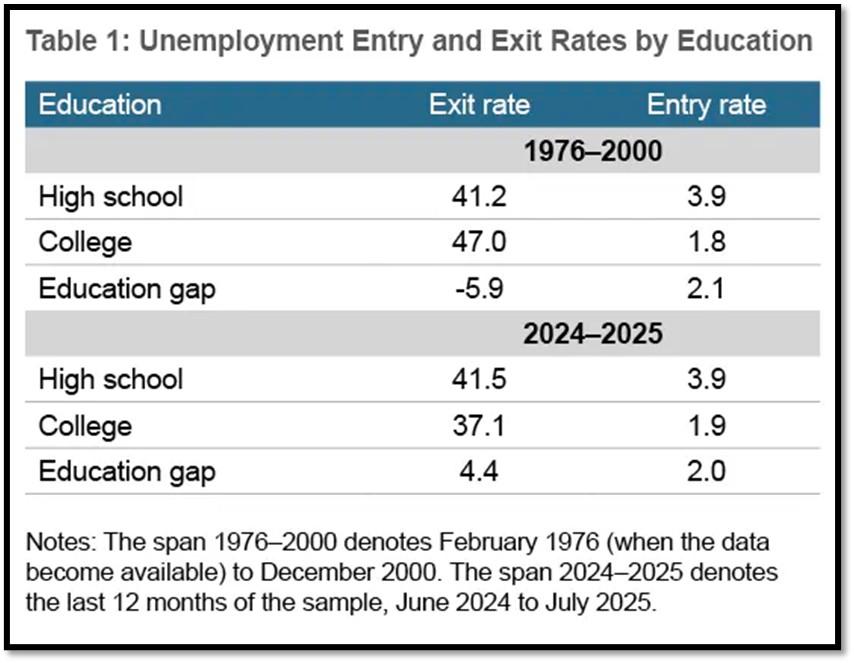
High school graduates in their twenties have usually faced a much higher unemployment rate than college graduates of the same age, reflecting long standing economic advantages associated with higher education. Recently, however, this gap has narrowed to its smallest level since the late nineteen seventies. This shift does not indicate an improvement for high school graduates but rather a weakening labor market for college educated young adults. Many recent graduates are struggling to find work in fields that traditionally offered stable early career opportunities. At the same time, companies are slowing hiring, trimming entry level roles, and redirecting resources toward automation, productivity software, and artificial intelligence systems. As a result, the historical advantage enjoyed by college graduates is eroding as both groups face rising job market pressure.
Some policy makers are warning that unemployment among recent college graduates could reach twenty five percent in the coming years if current trends accelerate. A United States senator recently cautioned that rapid advances in artificial intelligence may eliminate or restructure a wide range of entry level professional roles, which could produce a level of social disruption without precedent in the modern era. Young adults who invested time and money in higher education may find themselves locked out of the very jobs their degrees were meant to secure. This outcome would challenge long standing economic norms and place new pressure on social systems, political institutions, and family structures. It also raises broader questions about the future of work, the value of higher education, and the need for new labor policies as artificial intelligence begins to reshape the foundation of the twenty first century economy. Click onto pictures below to access videos. REF: Federal Reserve Bank of Cleveland, BLS
Sectors with the strongest hiring recently
- Healthcare & Social Assistance: This continues to be the single largest engine of job creation in the U.S. The aging population and rising demand for medical services — from outpatient care to elder care — are driving major hiring across the board. REF: ASU
- Technology / Information / AI & Data-Driven Roles: Despite a tech layoff wave earlier in 2024–25, demand for certain tech roles has rebounded. Employers are hiring software engineers, cloud and network engineers, data scientists, cybersecurity experts, and AI/ML specialists. REF: Roberhalf
- Clean Energy / Renewables / Utility-Green Infrastructure: With renewed investment in clean energy and infrastructure (e.g., solar, wind, grid upgrades), jobs such as solar installers, technicians, and other green-energy trades are seeing a surge. REF: ASU
- Professional & Business Services (Back-office, Administrative, Support Roles): Demand remains elevated for support services — administrative staff, customer support, project managers, business analysts — especially in firms adjusting to hybrid work, outsourcing, or shifting business models. REF: Roberthalf
- Transportation, Warehousing, Logistics, and Select Skilled Trades: As e-commerce, supply-chain re-shoring, and industrial activity remain active, logistic and support roles continue growing. This includes demand for warehouse staff, logistics managers, and general skilled-trade labor tied to infrastructure and manufacturing support. REF: ASU
3. The recent market selloff has pushed many stocks and funds into negative territory for the year, creating a timely opportunity for tax loss harvesting.
When investors sell positions at a loss, they can use those realized losses to offset current or future capital gains, reduce taxable income, and improve after tax returns. Because the selloff appears driven more by short lived liquidity pressure than by fundamental deterioration, investors can harvest losses while maintaining market exposure by rotating into similar but not substantially identical investments. This allows portfolios to capture the tax benefit without sacrificing long term positioning. REF: Tax-Loss-Harvesting
With the current macro-economic backdrop, below are areas we currently favor:
- Fixed Income – (Corporates & Muni) High Yield as Opportunistic Allocation (Low-Beta)
- Fixed Income – Short-term Corporates & Muni (Low-Beta)
- Businesses that contribute to and benefit from AI & Automation (Market-Risk)
- Neo-Cloud Computing (Market-Risk)
- Fintech & Financials (Market-Risk)
- Digital Asset – Bitcoin (Market-Risk/Hedge)
- Cyber-Security & Software (Market-Risk)
- Quantum Computing (Market-Risk)
4. World Watch
4A. Meta is reportedly in discussions to incorporate Google AI chips into parts of its infrastructure.
This reflects a broader effort by large technology firms to diversify chip supply, lower cost, and reduce dependence on any single provider. Google promotes its Tensor Processing Units as energy efficient and effective for certain specific workloads. Meta has strong incentives to evaluate all options as it expands its artificial intelligence infrastructure for large models, recommendation systems, content moderation, and virtual reality. These talks do not replace Meta’s use of Nvidia hardware but show a desire to manage cost and secure supply as computing demand rises.
Nvidia responded to the news by stating that its graphics processors remain a full generation ahead of Google chips. Nvidia argues its advantage comes from high performance architecture, optimized software systems, advanced interconnects, and a broad developer ecosystem. Its products support the most demanding and general model training workloads, while Google chips remain more specialized. Nvidia continues to dominate the artificial intelligence hardware market because it offers a complete platform that is difficult for competitors to match. Meta’s interest in Google chips does not weaken Nvidia’s position but reflects the expanding market and the need for multiple suppliers as artificial intelligence adoption accelerates. Click onto to pictures below to access videos. REF: CNBC, TechEchelon

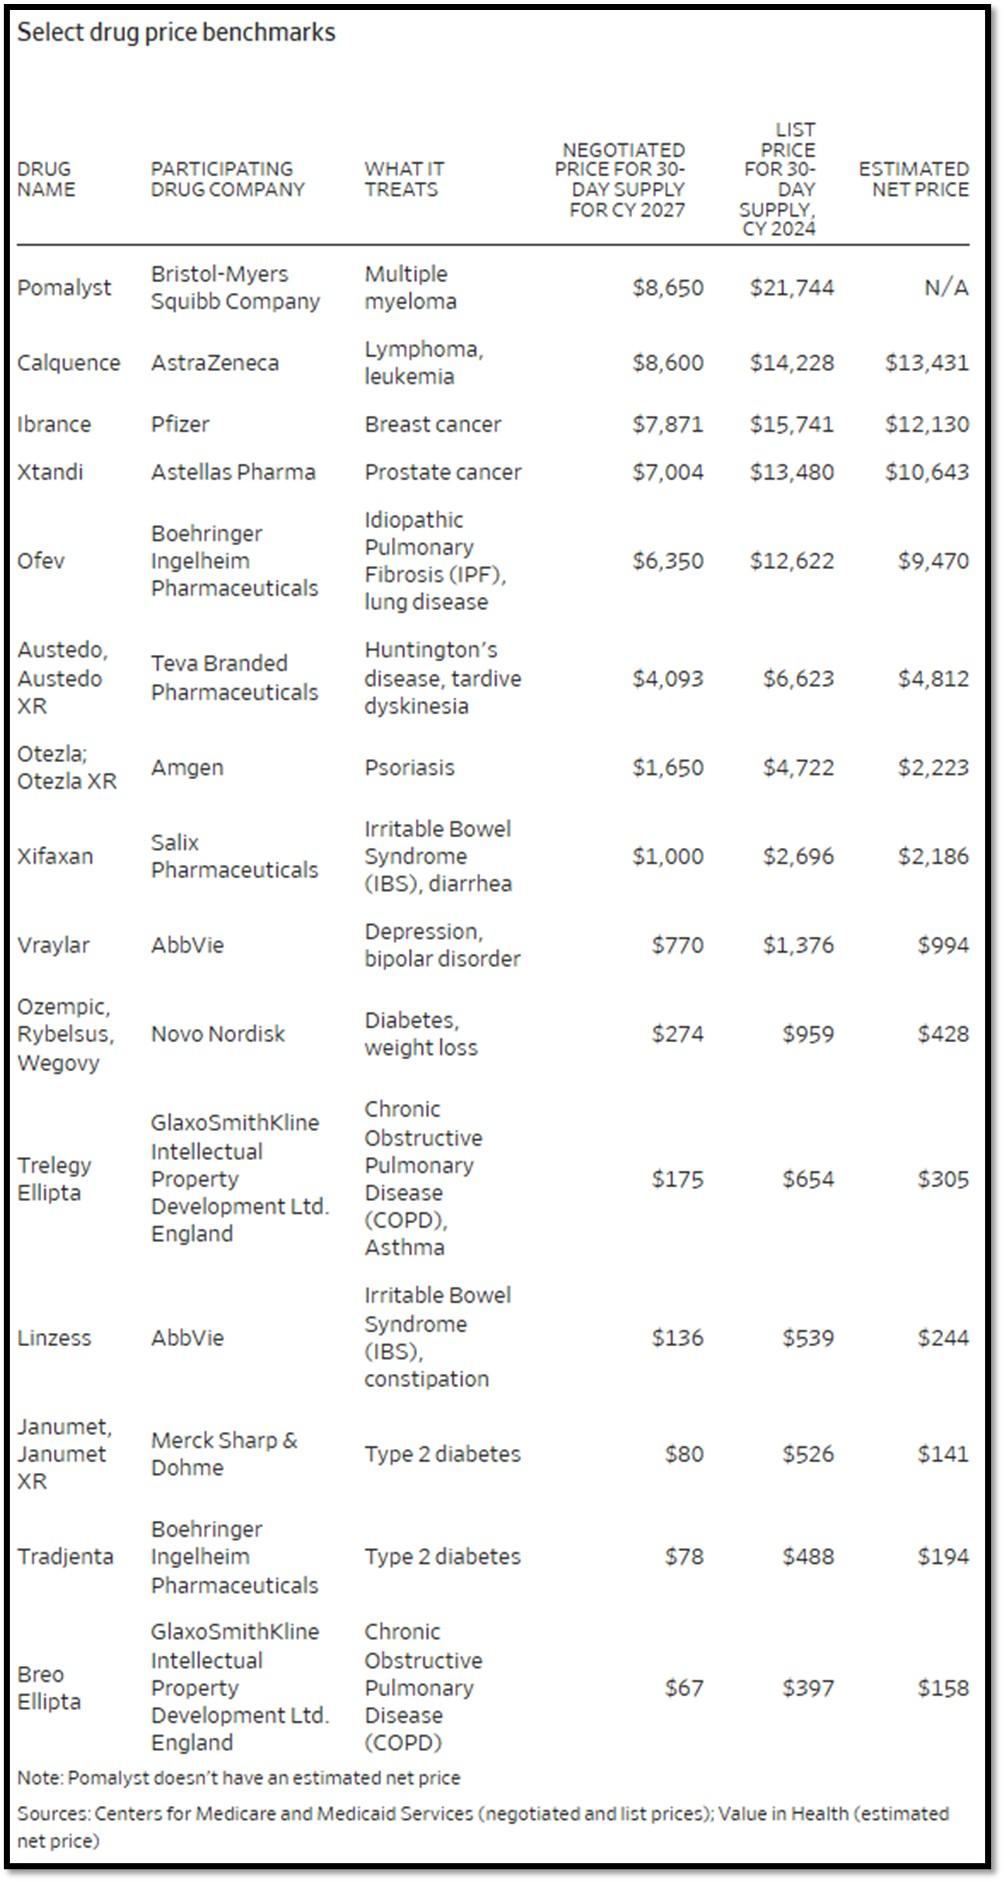
4B. The United States government has secured lower prices for Ozempic and fourteen other major prescription drugs through Medicare’s new negotiating authority, marking a major shift in federal drug pricing policy.
These medications, many used for chronic and costly conditions such as diabetes, obesity, cancer, and respiratory disease, will see meaningful price reductions starting in 2027, generating billions in taxpayer savings and lowering out-of-pocket costs for seniors. The implications are significant. For patients, the change improves access and long-term adherence to essential treatments. For the health-care system, it begins to curb rising pharmaceutical spending that has strained federal budgets. For drug makers, the negotiations signal a new era in which pricing power is constrained and future revenue models must account for government oversight. This may also push companies to focus more on genuine innovation rather than incremental products. Over time, these negotiated reductions could reshape industry competition and expand the role of government in drug pricing. REF: WSJ
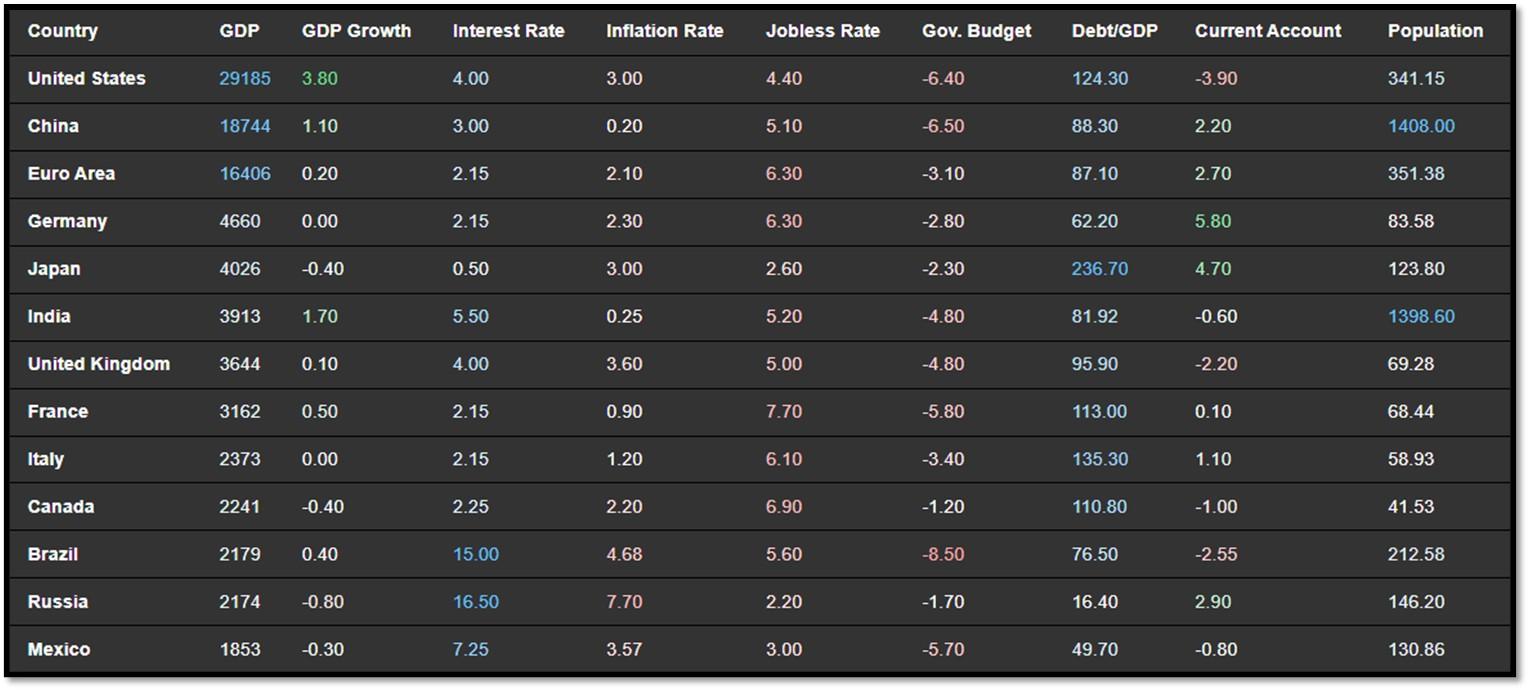
4C. An updated snapshot of the current global state of economy
According to TradingEconomics as of 11/24/2025 (REF: TradingEconomics):
- The US unemployment rate increased to 4.4% in September 2025 from 4.3% in August, exceeding market expectations of 4.3% and marking the highest level since October 2021.
- China’s surveyed urban unemployment rate fell to 5.1% in October 2025, missing market expectations that it would hold steady at September’s 5.2%.
- Japan’s GDP contracted 0.4% qoq in Q3 2025, reversing an upwardly revised 0.6% growth in Q2 but performing slightly better than market expectations of a 0.6% decline, preliminary data showed.
- Japan’s annual inflation rate edged up to 3.0% in October 2025 from 2.9% in September, marking the highest reading since July.
5. Quant & Technical Corner – A selection of quantitative & technical data we monitor on a regular basis to help gauge the overall financial market conditions and the investment environment.
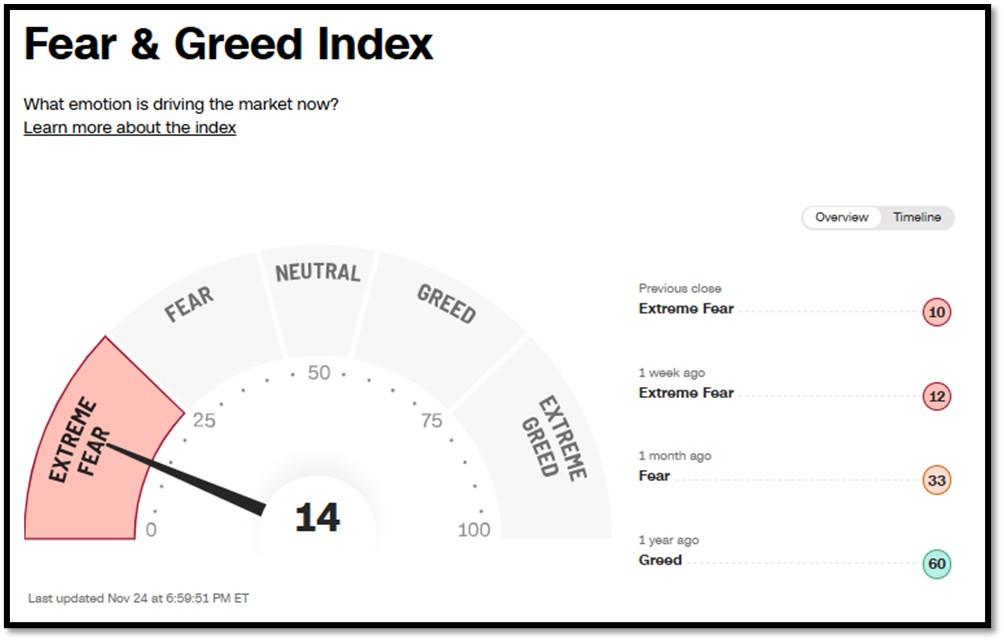
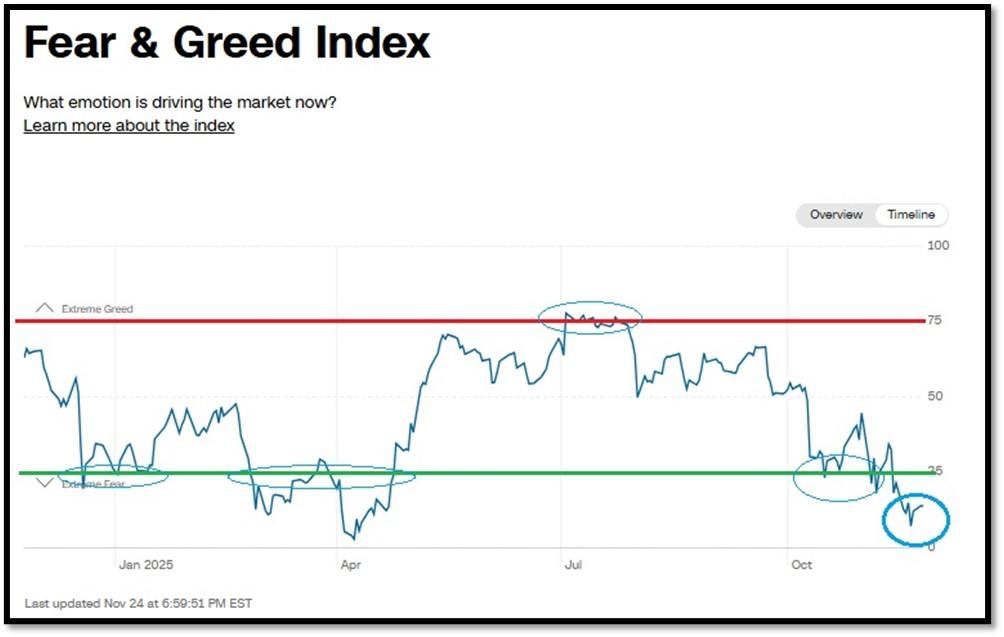
5A. Most recent read on the Fear & Greed Index with data as of 11/24/2025 – 6:59 PM-ET is 14 (Extreme Fear). Last week’s data was 12 (Extreme Fear) (1-100). CNNMoney’s Fear & Greed index looks at 7 indicators (Stock Price Momentum, Stock Price Strength, Stock Price Breadth, Put and Call Options, Junk Bond Demand, Market Volatility, and Safe Haven Demand). Keep in mind this is a contrarian indicator! REF: Fear&Greed via CNNMoney
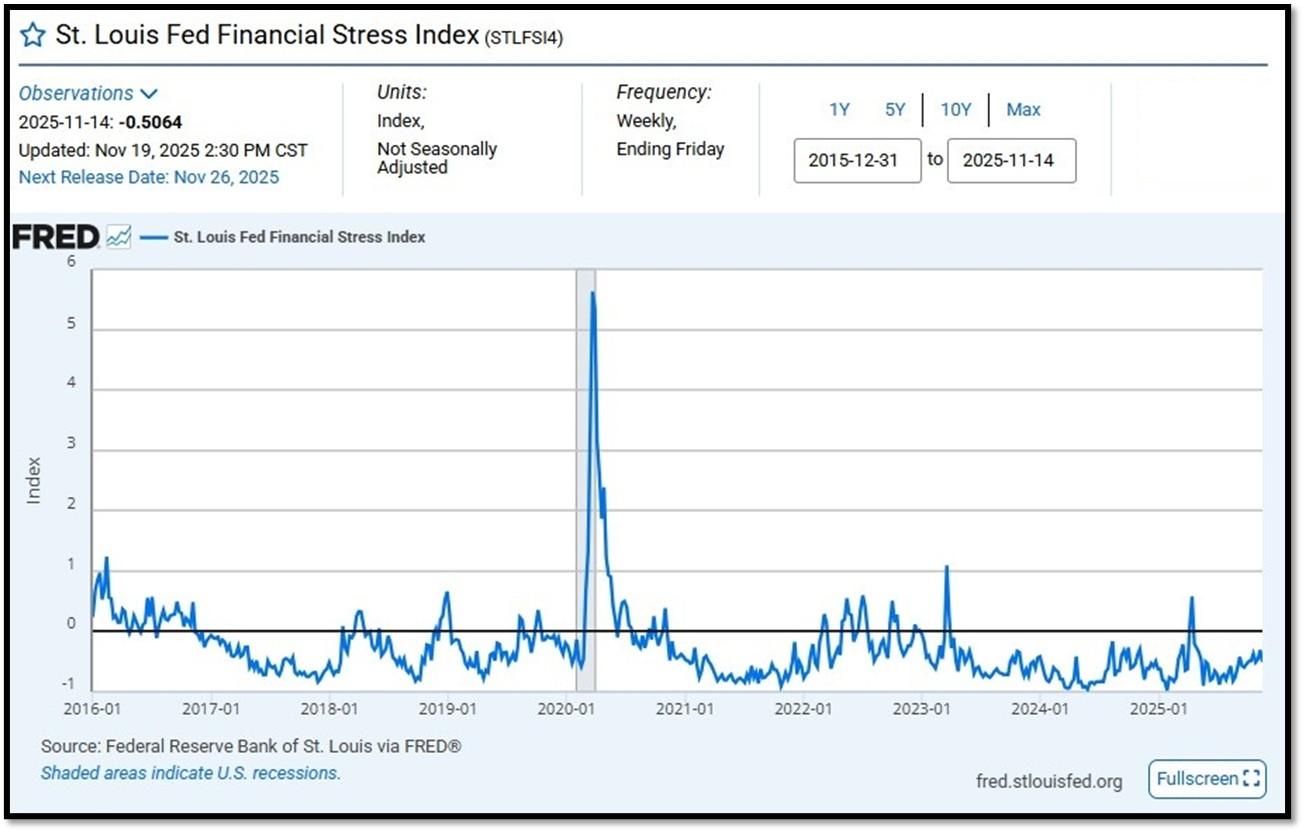
5B. St. Louis Fed Financial Stress Index’s (STLFSI4) most recent read is at –0.5064 as of November 19, 2025. Previous week’s data was -0.3091. A big spike up from previous readings reflecting the turmoil in the banking sector back in 2023. This weekly index is not seasonally adjusted. The STLFSI4 measures the degree of financial stress in the markets and is constructed from 18 weekly data series: seven interest rate series, six yield spreads and five other indicators. Each of these variables captures some aspect of financial stress. Accordingly, as the level of financial stress in the economy changes, the data series are likely to move together. REF: St. Louis Fed
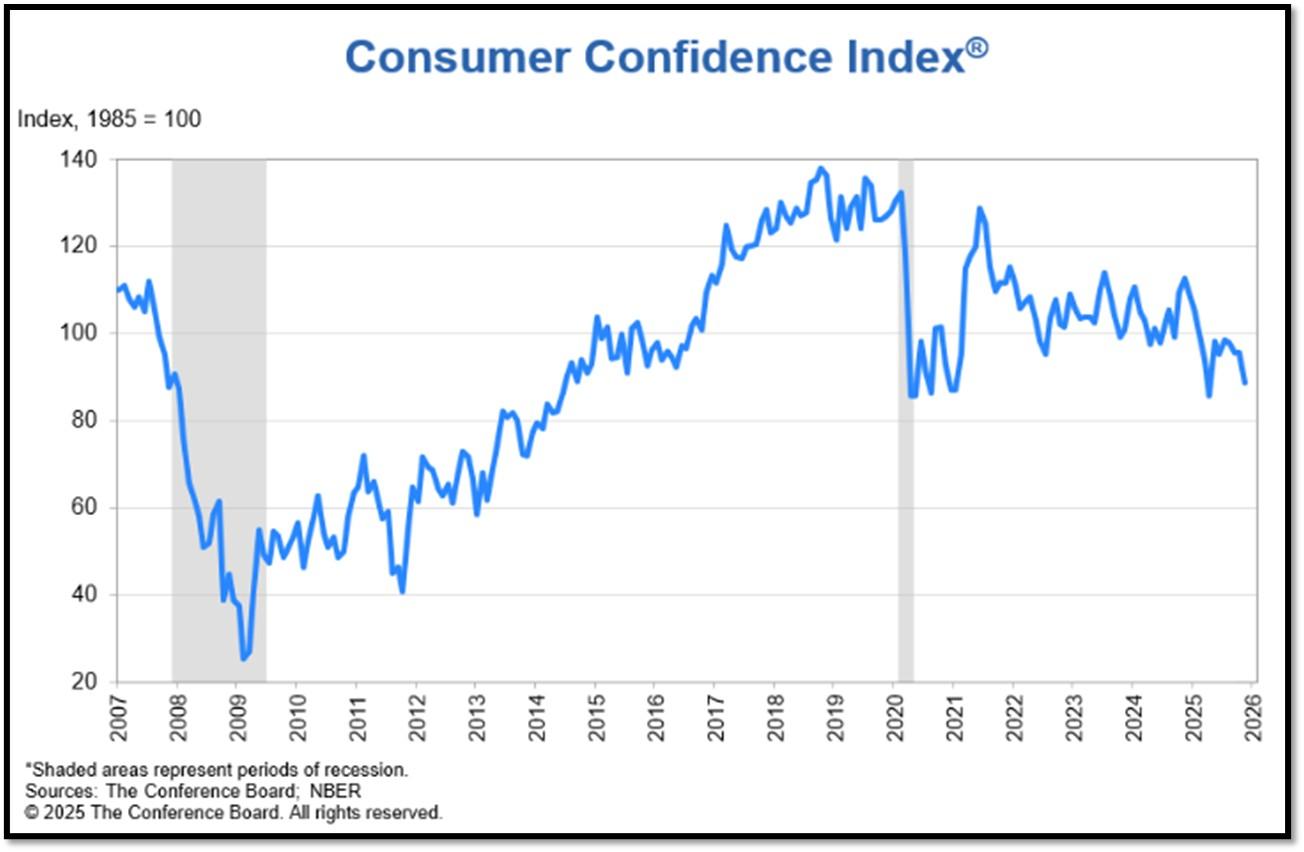
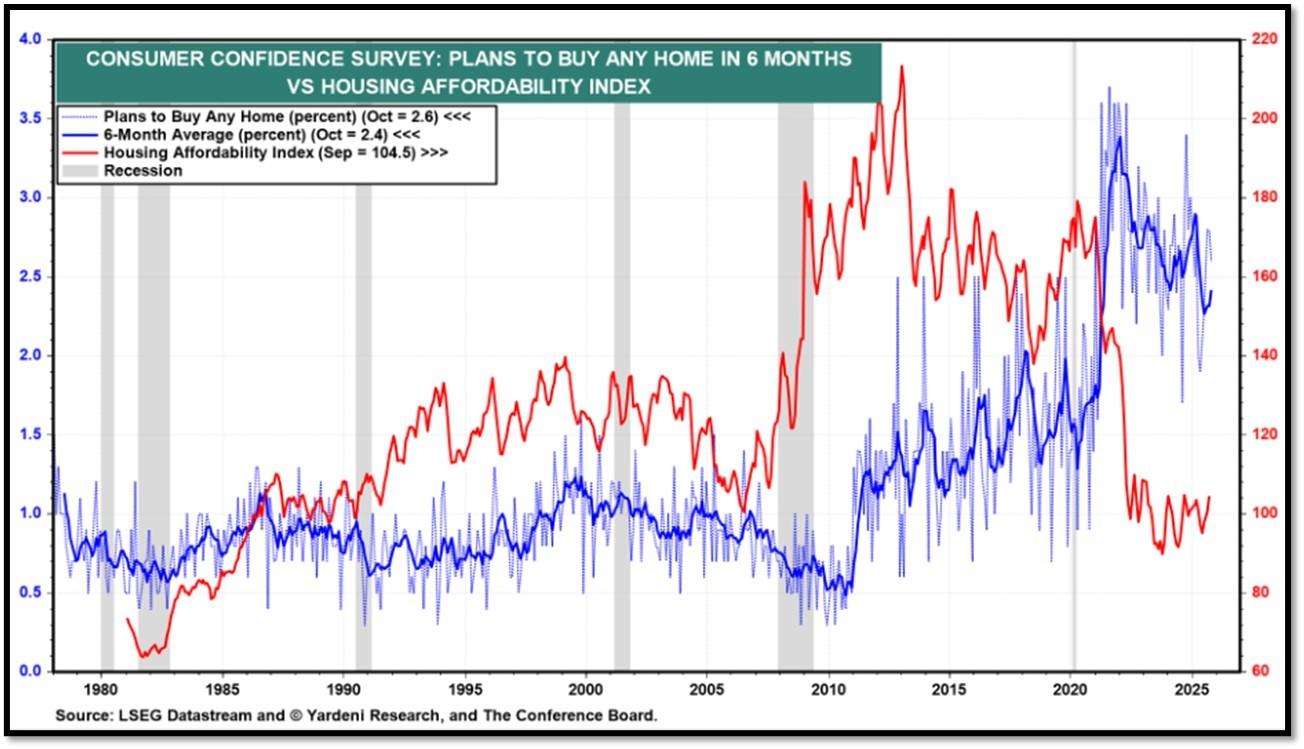
5C. Consumers revealed reduced confidence across jobs, incomes, and financial situations, both now and in the future, potentially due to the government shutdown. The Conference Board Consumer Confidence Index® declined by 6.8 points in November to 88.7 (1985=100) from 95.5 in October. “Consumer confidence tumbled in November to its lowest level since April after moving sideways for several months,” said Dana M Peterson, Chief Economist, The Conference Board. “All five components of the overall index flagged or remained weak. REF: ConsumerConfidence
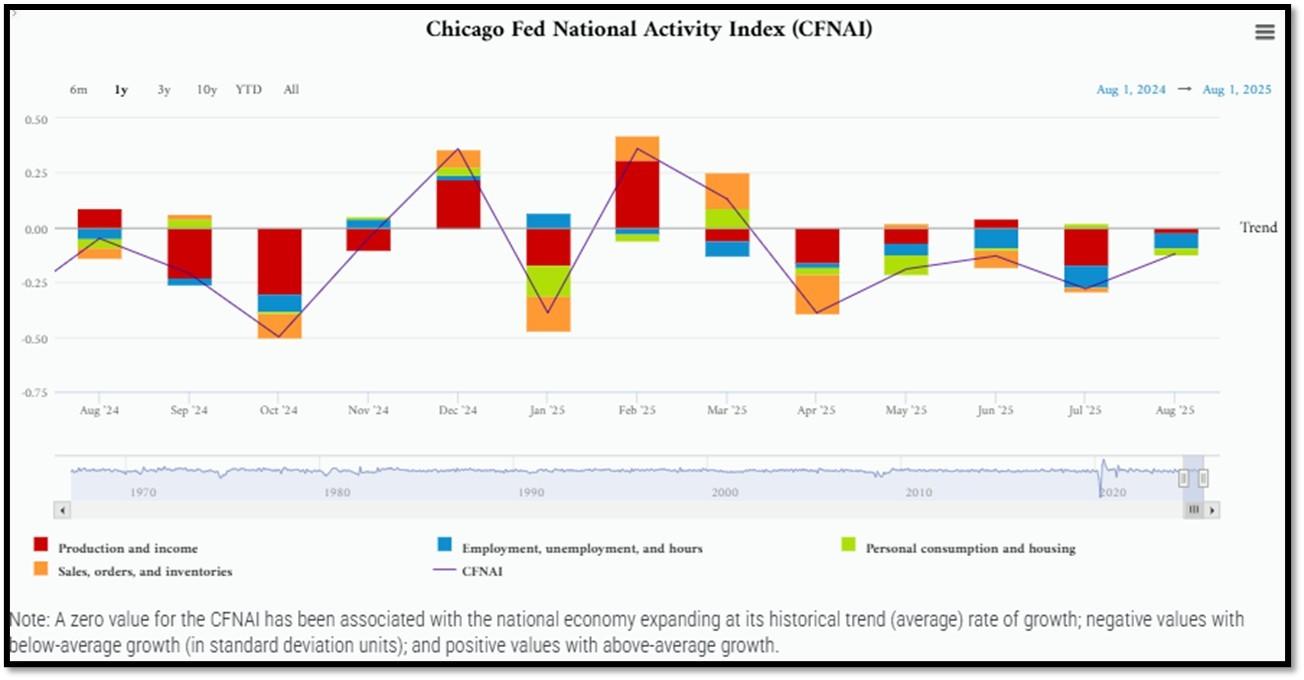
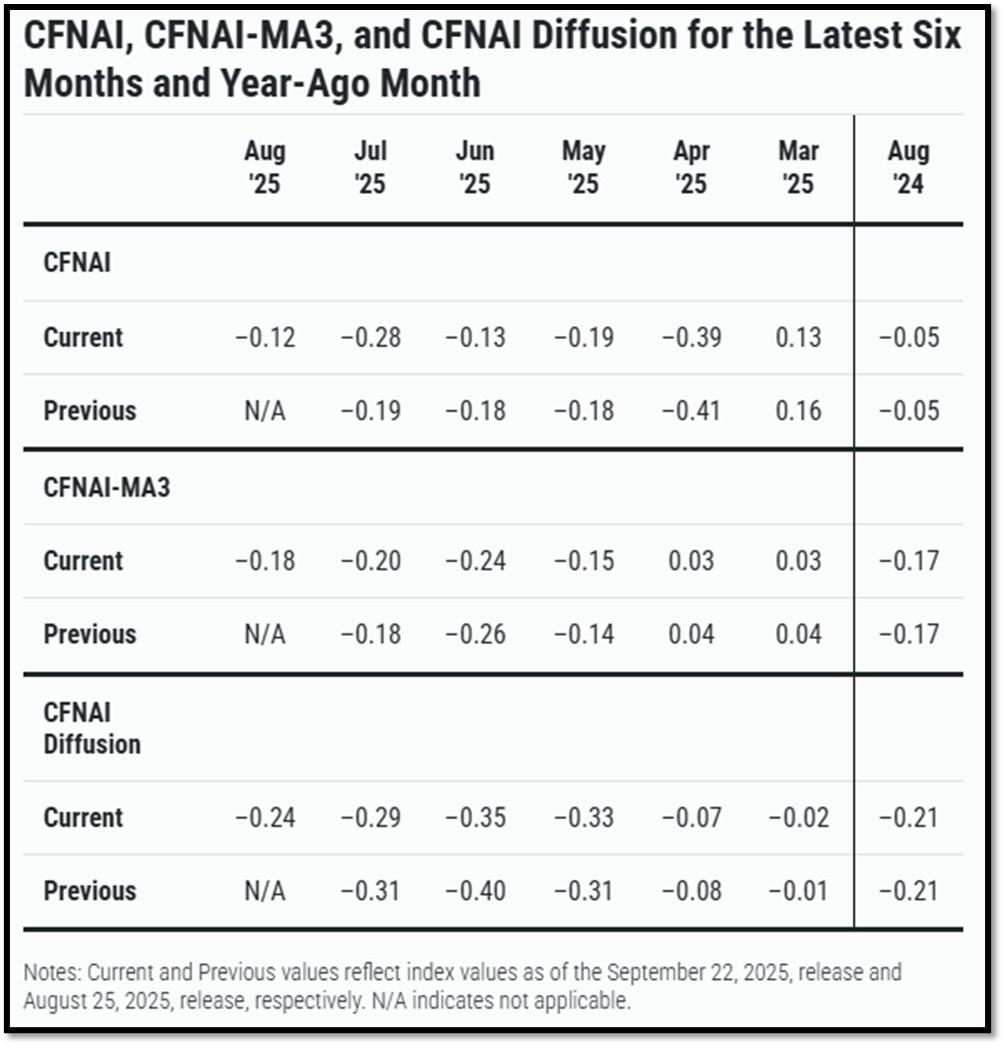
5D. The Chicago Fed National Activity Index (CFNAI) increased to –0.12 in August from –0.28 in July. Three of the four broad categories of indicators used to construct the index increased from July, but three categories made negative contributions in August. The index’s three-month moving average, CFNAI-MA3, increased to –0.18 in August from –0.20 in July. REF: ChicagoFed, August’s Report
5E. (9/18/2025) The Conference Board Leading Economic Index (LEI) for the US declined by 0.5% in August 2025 to 98.4 (2016=100), after a small 0.1% increase in July (upwardly revised from an originally reported 0.1% decline). The LEI fell by 2.8% over the six months between February and August 2025, a faster rate of decline than its 0.9% contraction over the previous six-month period (August 2024 to February 2025). The composite economic indexes are the key elements in an analytic system designed to signal peaks and troughs in the business cycle. The indexes are constructed to summarize and reveal common turning points in the economy in a clearer and more convincing manner than any individual component. The CEI is highly correlated with real GDP. The LEI is a predictive variable that anticipates (or “leads”) turning points in the business cycle by around 7 months. Shaded areas denote recession periods or economic contractions. The dates above the shaded areas show the chronology of peaks and troughs in the business cycle. The ten components of The Conference Board Leading Economic Index® for the U.S. include: Average weekly hours in manufacturing; Average weekly initial claims for unemployment insurance; Manufacturers’ new orders for consumer goods and materials; ISM® Index of New Orders; Manufacturers’ new orders for nondefense capital goods excluding aircraft orders; Building permits for new private housing units; S&P 500® Index of Stock Prices; Leading Credit Index™; Interest rate spread (10-year Treasury bonds less federal funds rate); Average consumer expectations for business conditions. REF: ConferenceBoard, LEI Report for August (ReceesionAlert) (Released on 9/30/2025)
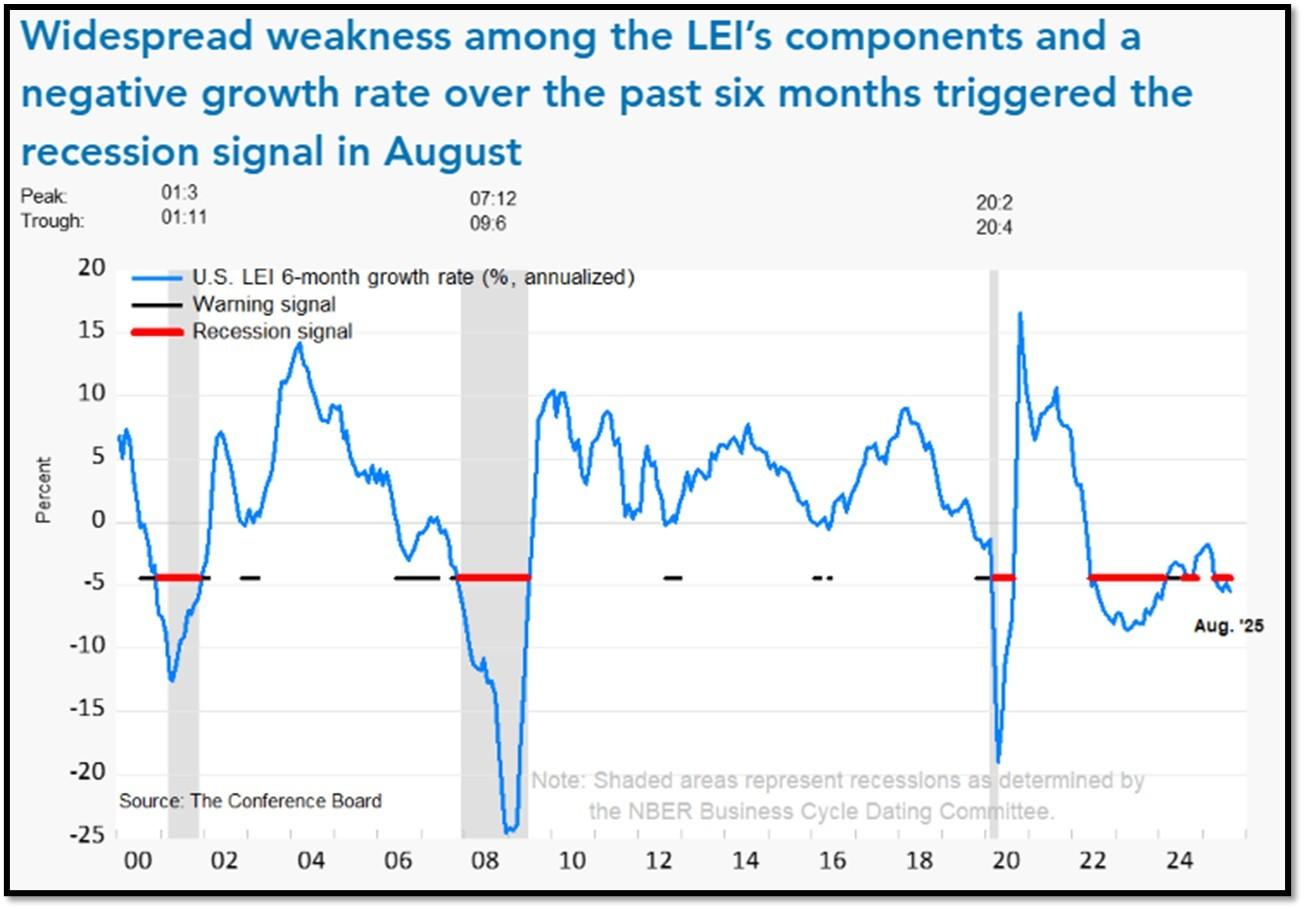
We have experienced a “rolling recession” since June 2022 and are only now emerging from it. However, authorities are not labeling it a recession due to high employment data from June 2022-2025.
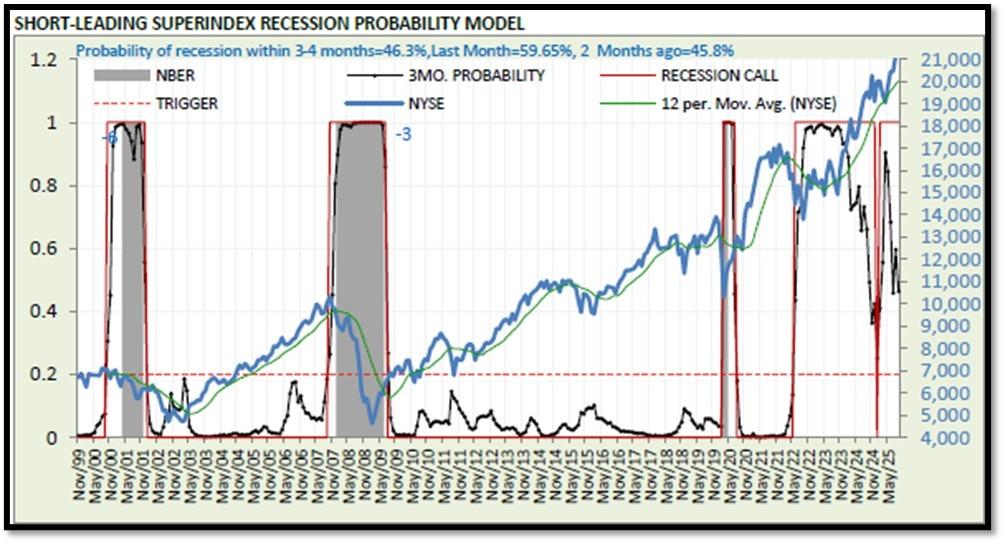
5F. Probability of U.S. falling into Recession within 3 to 4 months is currently at 46.3% (with data as of 09/28/2025 – Next Report 10/12/2025) according to RecessionAlert Research. Last release’s data was at 59.51%. This report is updated every two weeks. REF: RecessionAlertResearch
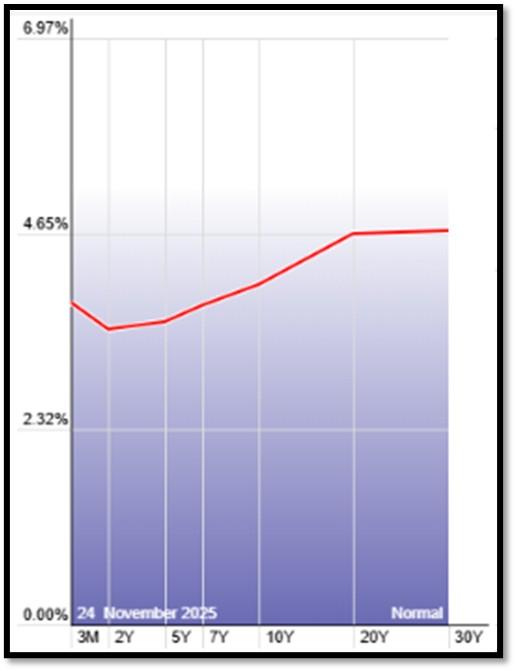
5G. Yield Curve as of 11/24/2025 is showing Normal. Spread on the 10-yr Treasury Yield (4.04%) minus yield on the 2-yr Treasury Yield (3.51%) is currently at 53bps as of 11/24/25. REF: Stockcharts The yield curve—specifically, the spread between the interest rates on the ten-year Treasury note and the three-month Treasury bill—is a valuable forecasting tool. It is simple to use and significantly outperforms other financial and macroeconomic indicators in predicting recessions two to six quarters ahead. REF: NYFED
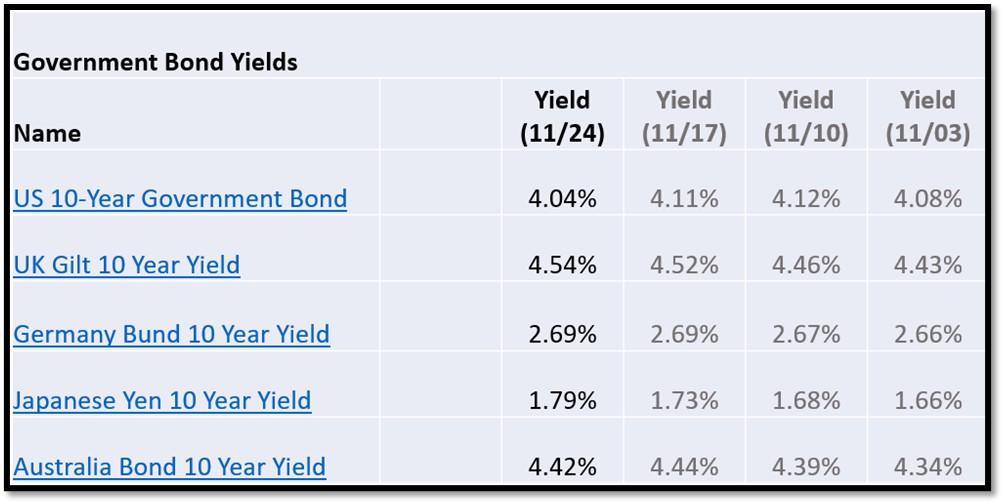
5H. Recent Yields in 10-Year Government Bonds. REF: Source is from Bloomberg.com, dated 11/24/2025, rates shown below are as of 11/24/2025, subject to change.
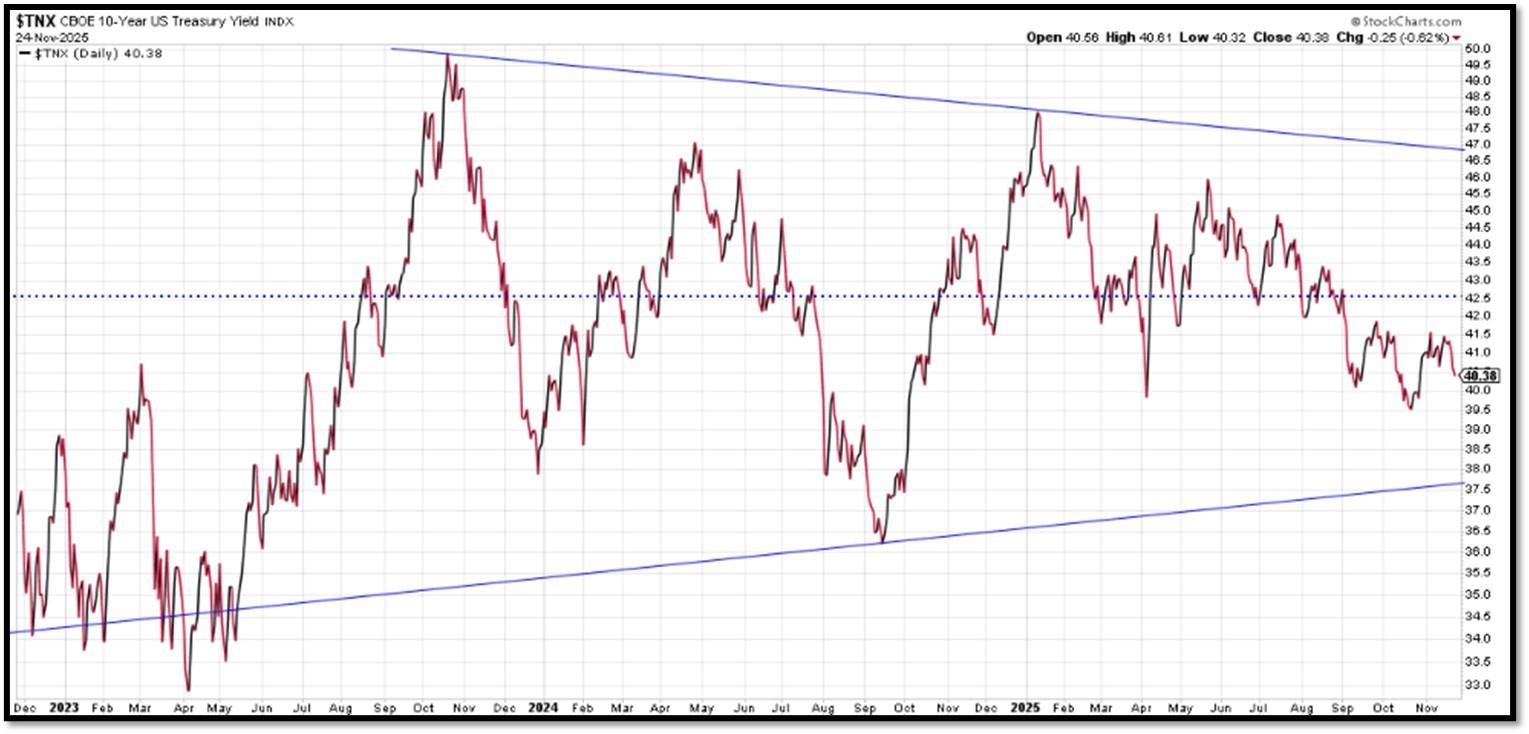
The 10-Year US Treasury Yield… The 10-Year Yield is indirectly related to inflation and prospect of the economy. I expect the 10-Year Yield to drop towards the support line. REF: StockCharts1
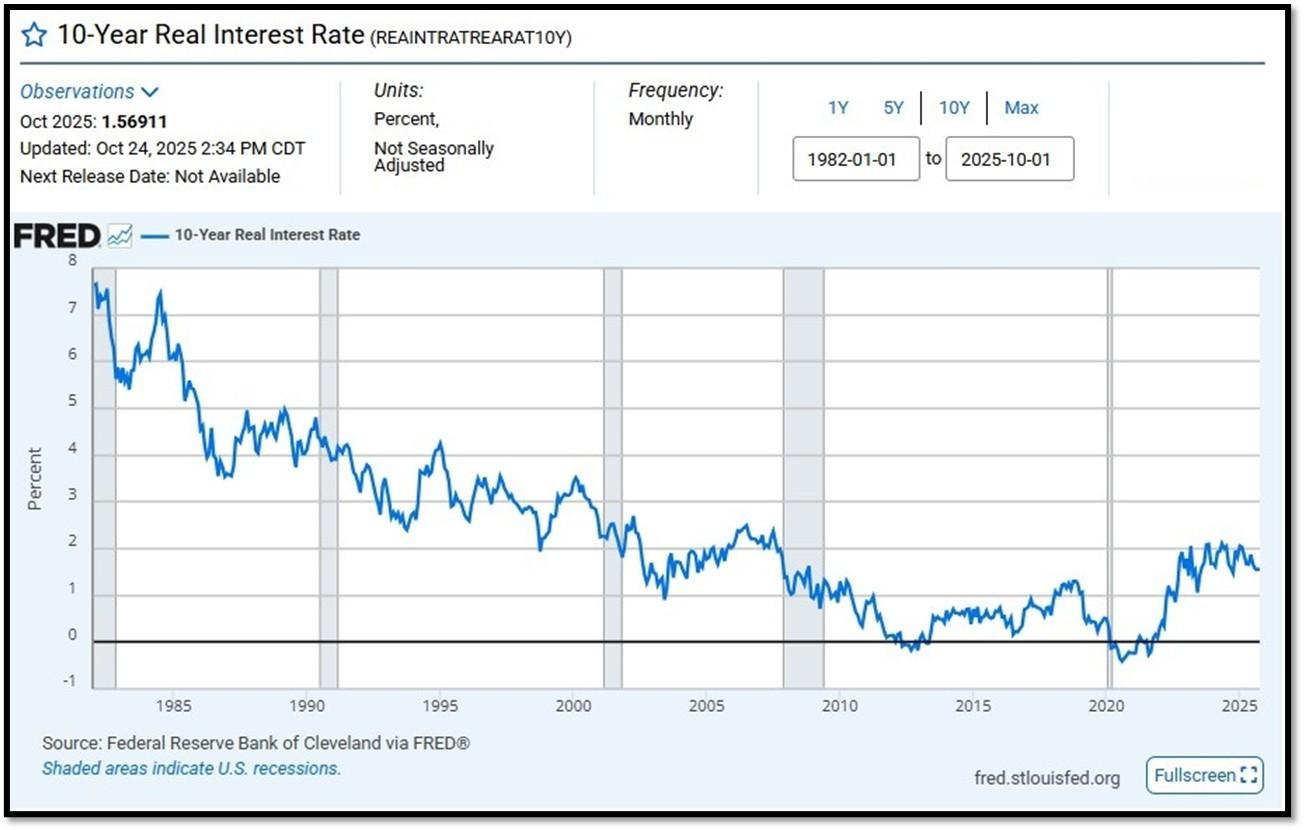
10-Year Real Interest Rate at 1.56911% as of 10/24/25. Last month’s data was 1.56046%. REF: REAINTRATREARAT10Y
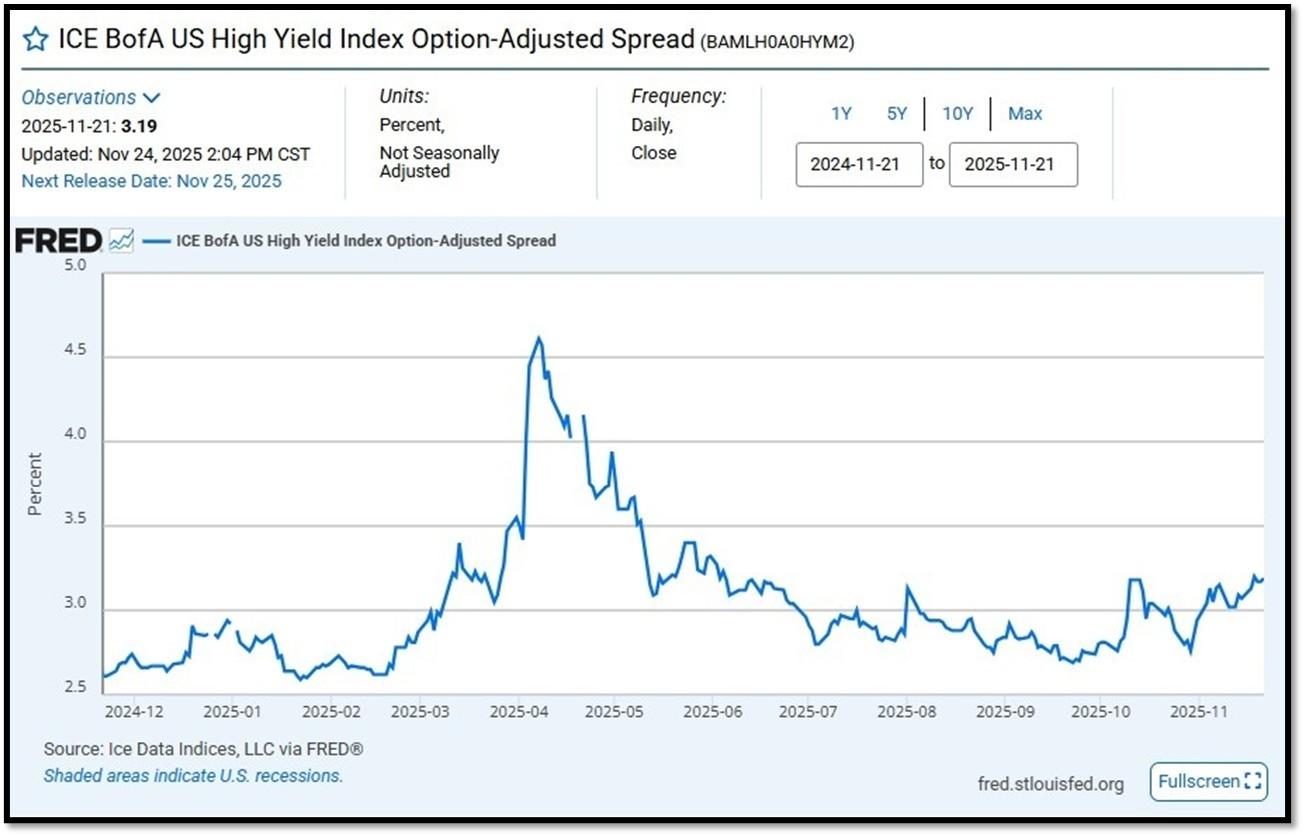
ICE BofA US High Yield Index Option-Adjusted Spread (BAMLH0A0HYM2) currently at 3.19 as of November 24, 2025. This is a key indicator of market sentiment, particularly regarding risk and economic health. At its core, the spread reflects the extra return investors demand to hold riskier corporate debt over safer government securities. High-yield bonds are issued by companies with lower credit ratings (below investment grade, like BB or lower), meaning they carry a higher chance of default. The spread compensates for this risk. When the spread is narrow—say, around 2.5% to 3%, as seen recently—it suggests investors are confident, willing to accept less extra yield because they perceive lower default risk or a strong economy. Narrow spreads often align with bullish markets, where cash is flowing, growth is steady, and fear is low. REF: FRED-BAMLH0A0HYM2
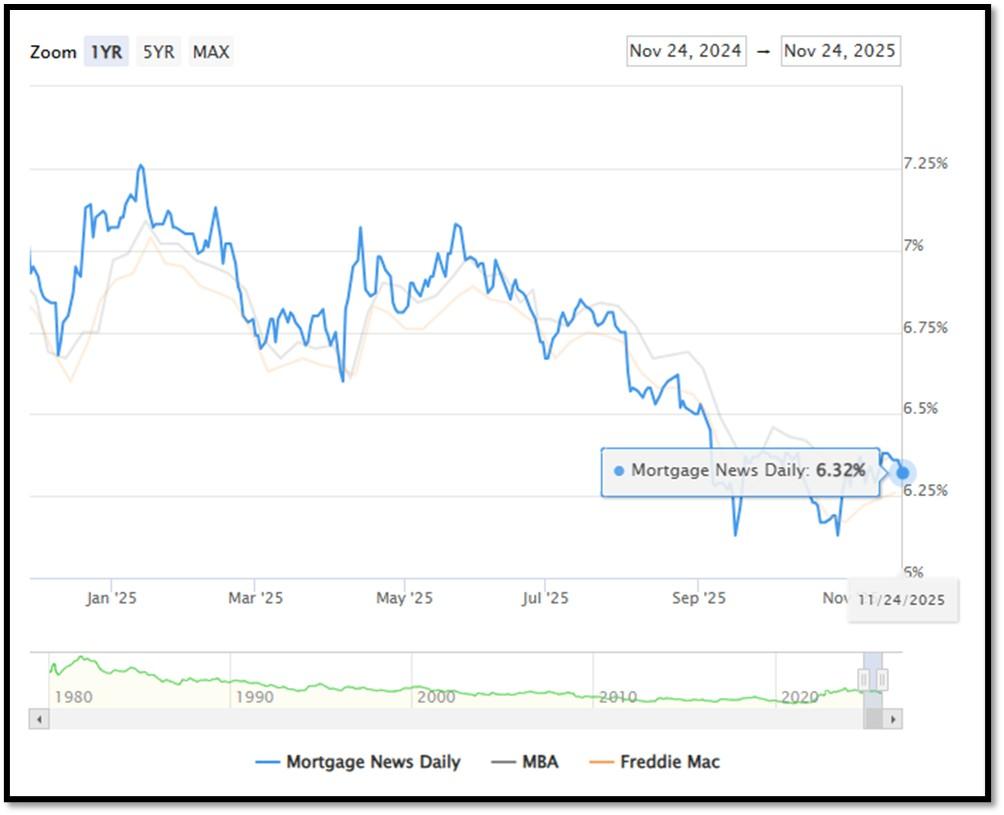
5I. (11/24/2025) Today’s National Average 30-Year Fixed Mortgage Rate is 6.32% (All Time High was 8.03% on 10/19/23). Last week’s data was 6.38%. This rate is the average 30-year fixed mortgage rates from several different surveys including Mortgage News Daily (daily index), Freddie Mac (weekly survey), Mortgage Bankers Association (weekly survey) and FHFA (monthly survey). REF: MortgageNewsDaily, Today’s Average Rate
The recent spike in the 30-year fixed-rate jumbo mortgage to 6.32%, compared to Freddie Mac’s rate at 6.26% and the Mortgage Bankers Association (MBA) rate at 6.37%, highlights key differences in the mortgage market. Jumbo mortgages, which exceed the conforming loan limits set by government agencies like Freddie Mac, typically carry higher interest rates because they are riskier for lenders. These loans are not backed by government entities, which increases the risk for lenders and, consequently, leads to higher rates. In contrast, Freddie Mac and MBA provide averages for conforming loans, which meet federal guidelines and have lower risk due to government backing, keeping their rates lower.
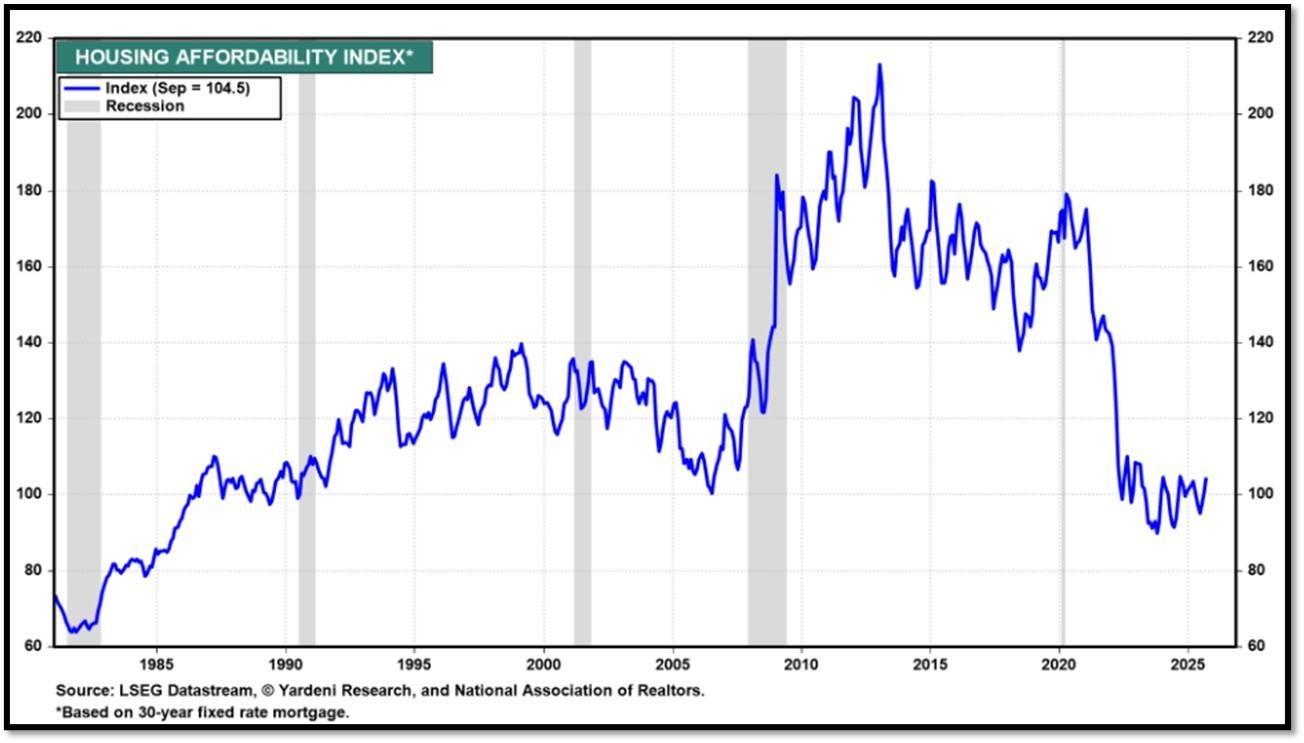
Housing Affordability Index for Sep = 104.5 // Aug = 100.5 // July = 98.8 // Jun = 94.4 // May = 97.2 // Apr = 101.0 // Mar = 103.2 // Feb = 102.2. Data provided by Yardeni Research. REF: Yardeni
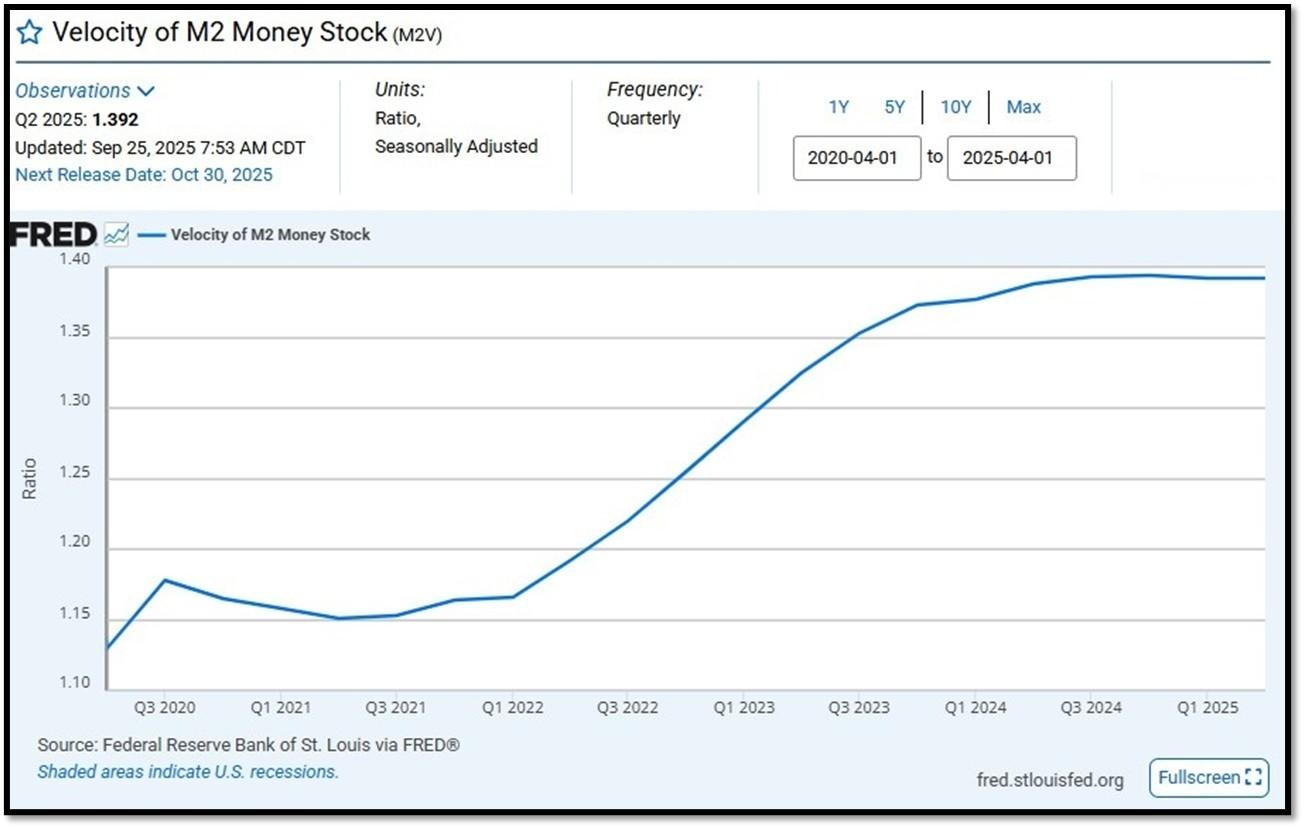
5J. Velocity of M2 Money Stock (M2V) with current read at 1.392 as of (Q2-2025 updated September 25, 2025). Previous quarter’s data was 1.386. The velocity of money is the frequency at which one unit of currency is used to purchase domestically- produced goods and services within a given time period. In other words, it is the number of times one dollar is spent to buy goods and services per unit of time. If the velocity of money is increasing, then more transactions are occurring between individuals in an economy. Current Money Stock (M2) report can be viewed in the reference link. REF: St.LouisFed-M2V
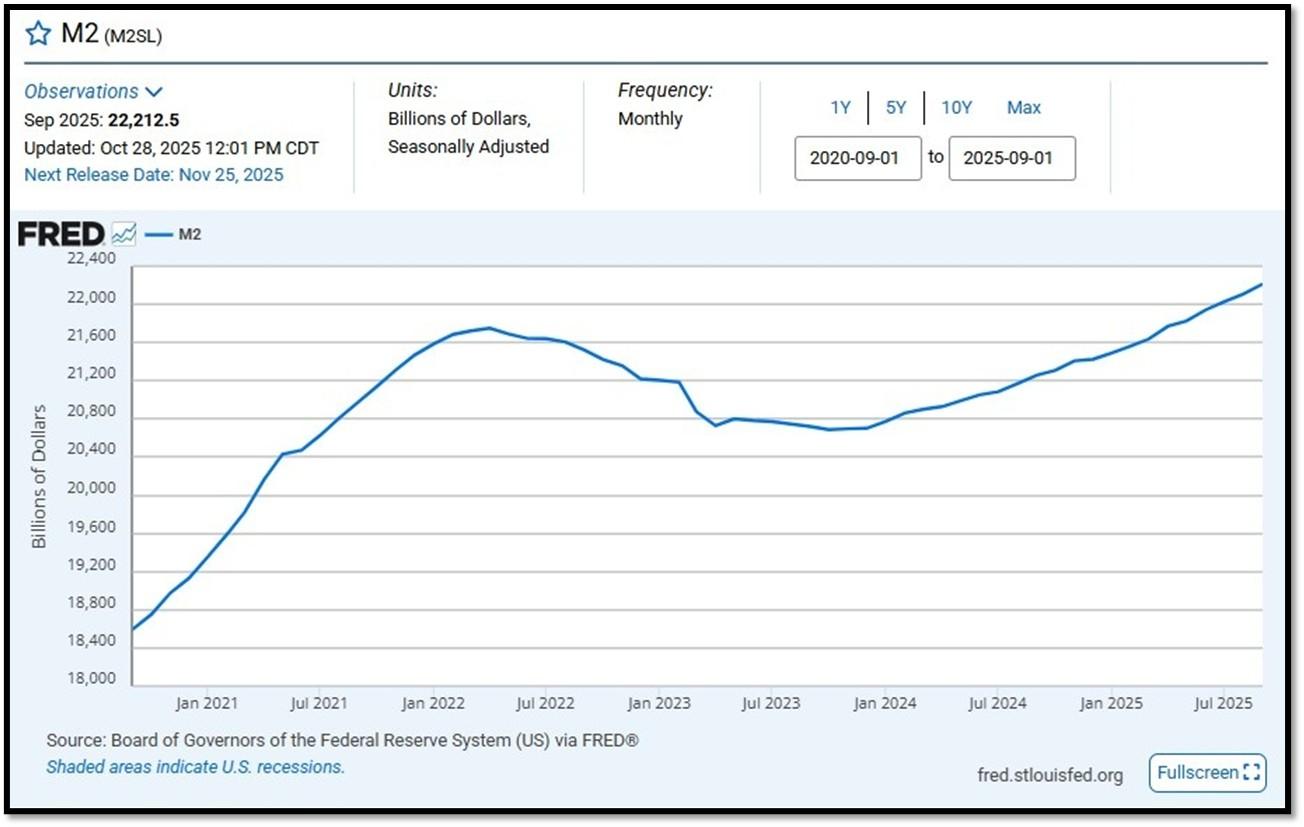
M2 consists of M1 plus (1) small-denomination time deposits (time deposits in amounts of less than $100,000) less IRA and Keogh balances at depository institutions; and (2) balances in retail MMFs less IRA and Keogh balances at MMFs. Seasonally adjusted M2 is constructed by summing savings deposits (before May 2020), small-denomination time deposits, and retail MMFs, each seasonally adjusted separately, and adding this result to seasonally adjusted M1. Board of Governors of the Federal Reserve System (US), M2 [M2SL], retrieved from FRED, Federal Reserve Bank of St. Louis; Updated on October 28, 2025. REF: St.LouisFed-M2
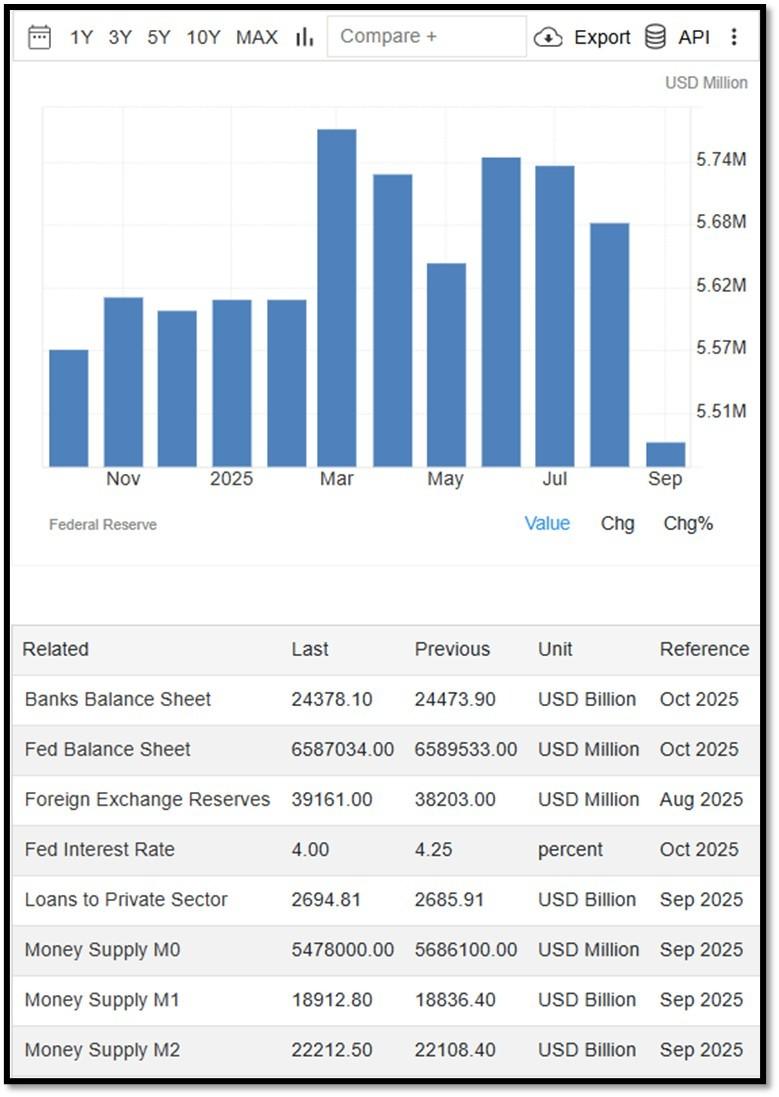
Money Supply M0 in the United States decreased to 5,478,000 USD Million in September from 5,686,100 USD Million in August of 2025. Money Supply M0 in the United States averaged 1,216,883.40 USD Million from 1959 until 2025, reaching an all time high of 6,413,100.00 USD Million in December of 2021 and a record low of 48,400.00 USD Million in February of 1961. REF: TradingEconomics, M0
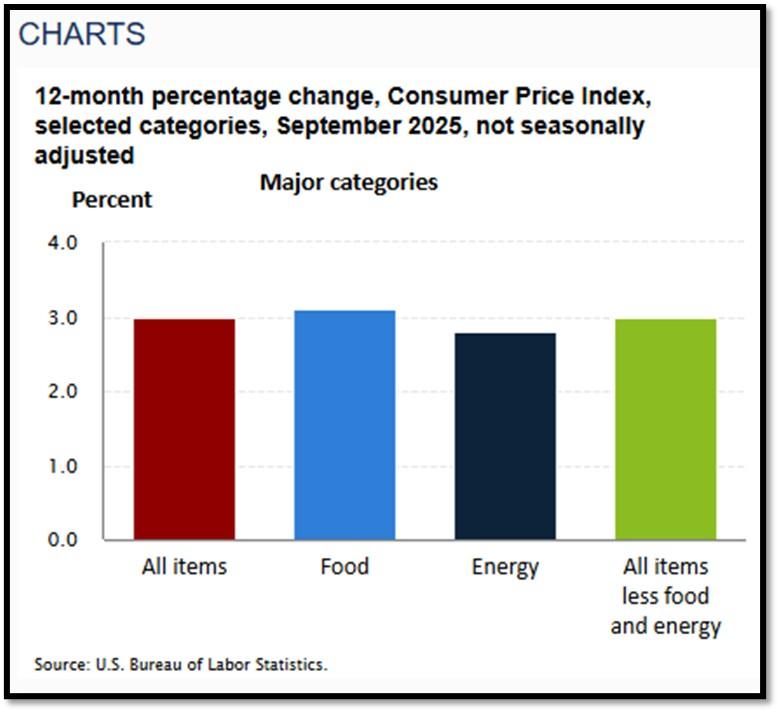
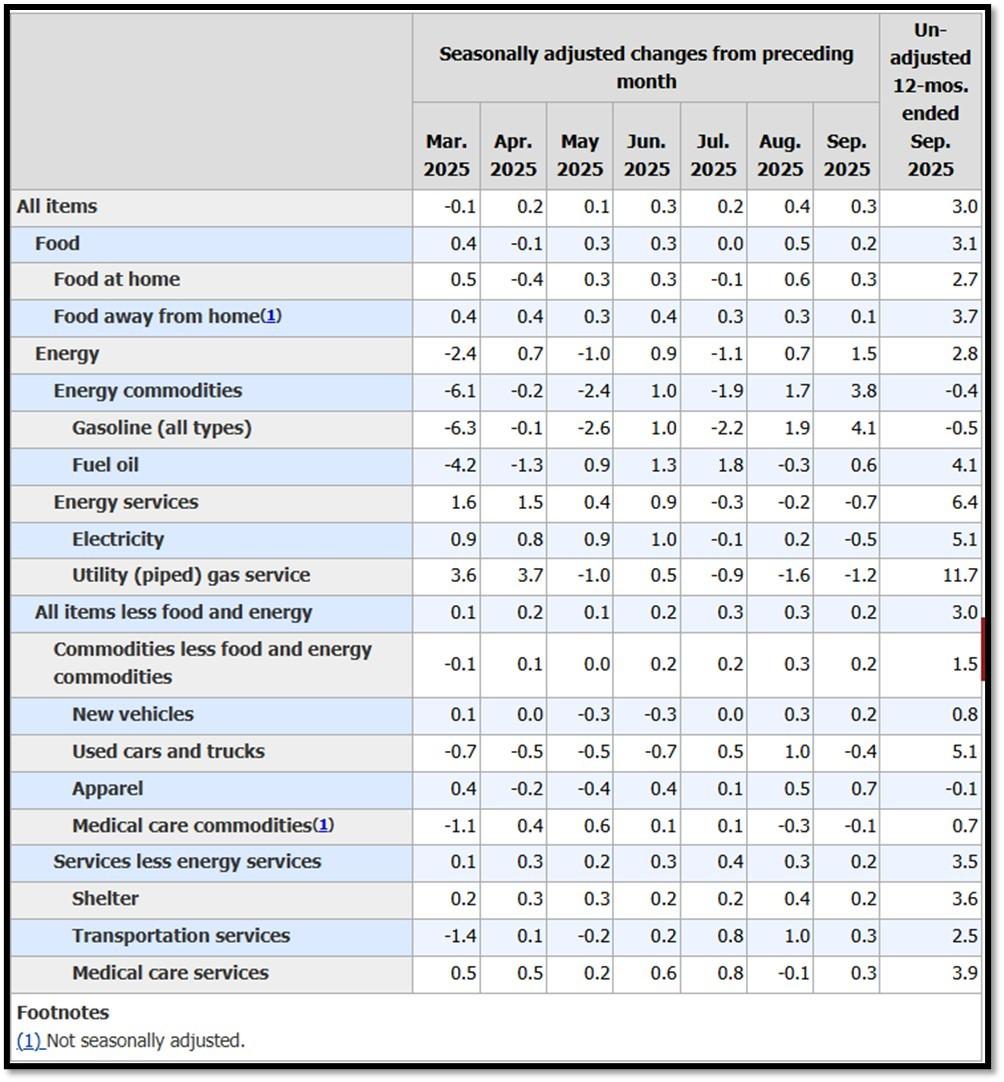
5K. In September, the Consumer Price Index for All Urban Consumers rose 0.3 percent, seasonally adjusted, and rose 3.0 percent over the last 12 months, not seasonally adjusted. The index for all items less food and energy increased 0.2 percent in September (SA); up 3.0 percent over the year (NSA). No announcement was made on October 2025’s CPI data. REF: BLS, BLS.GOV
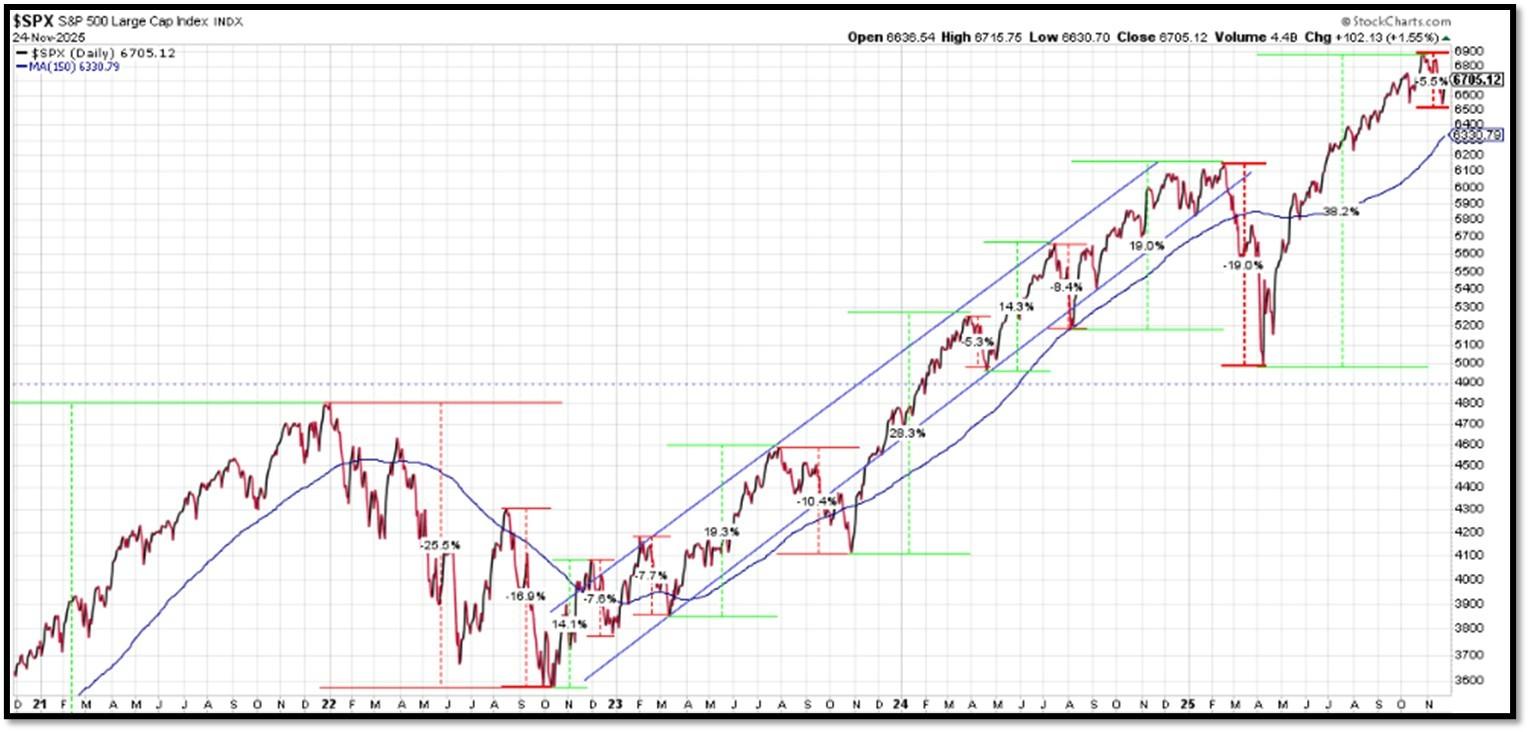
5L. Technical Analysis of the S&P500 Index. Click onto reference links below for images.
- Short-term Chart: Trend Bullish/Falling on 11/24/2025 – REF: Short-term S&P500 Chart by Marc Slavin (Click Here to Access Chart)
- Medium-term Chart: Trend Bullish on 11/24/2025 – REF: Medium-term S&P500 Chart by Marc Slavin (Click Here to Access Chart)
- Market Timing Indicators – S&P500 Index as of 11/24/2025 – REF: S&P500 Charts (7 of them) by Joanne Klein’s Top 7 (Click Here to Access Updated Charts)
- The S&P500 is hitting all-time-high, rebounding from a V-shaped recovery to all-time high. REF: Stockcharts
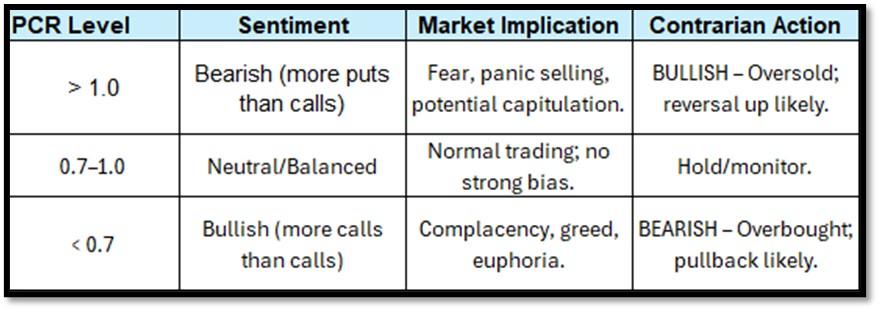
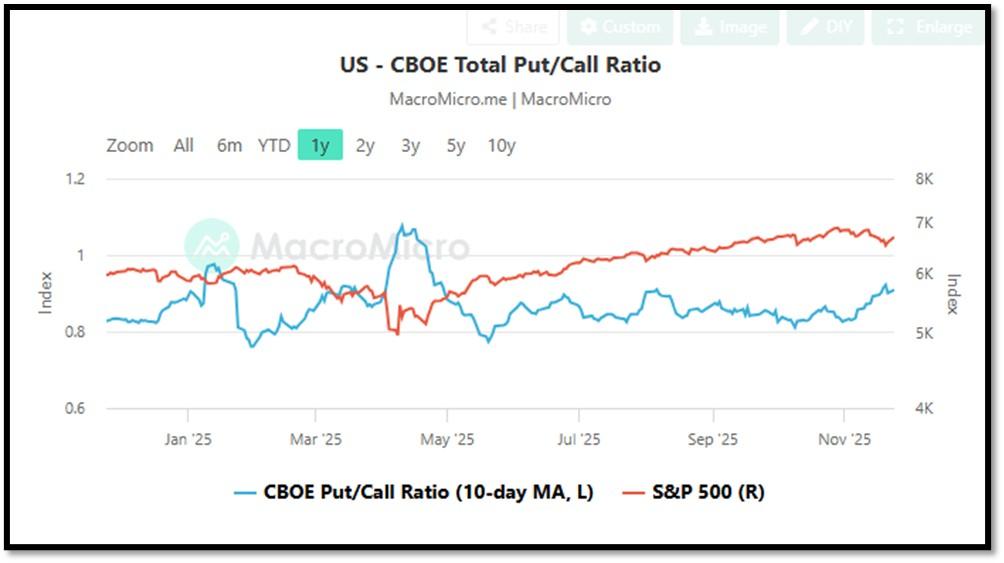
- CBOE Total Put/Call Ratio as of 11/24/2025. REF: MacroMicro
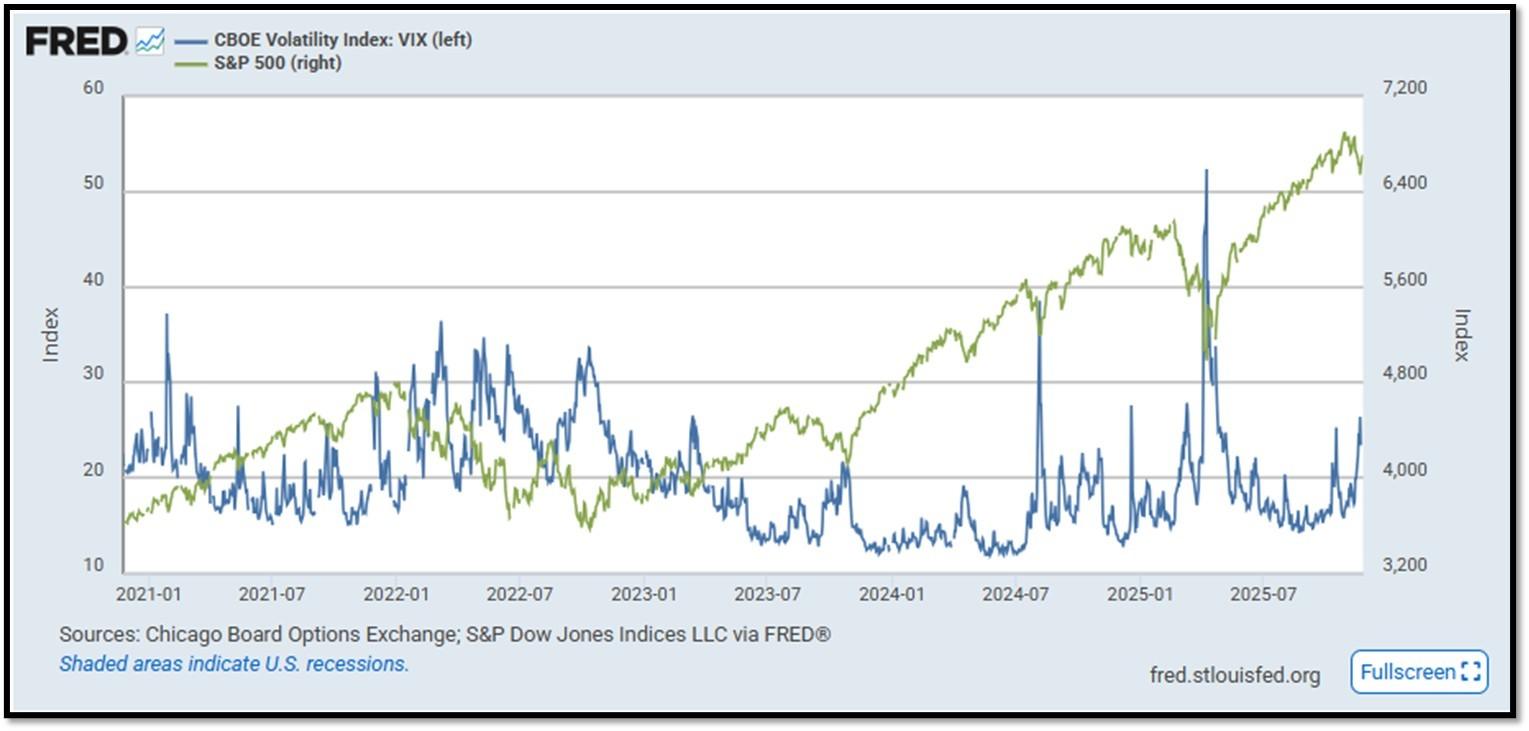
- S&P500 and CBOE Volatility Index (VIX) as of 11/24/2025. REF: FRED, Today’s Print
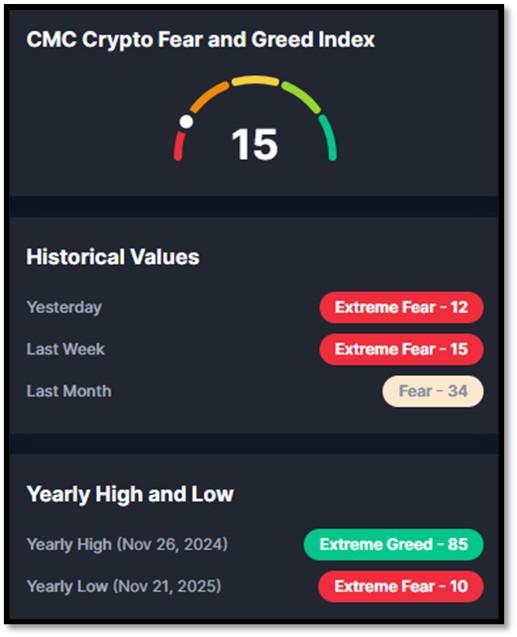
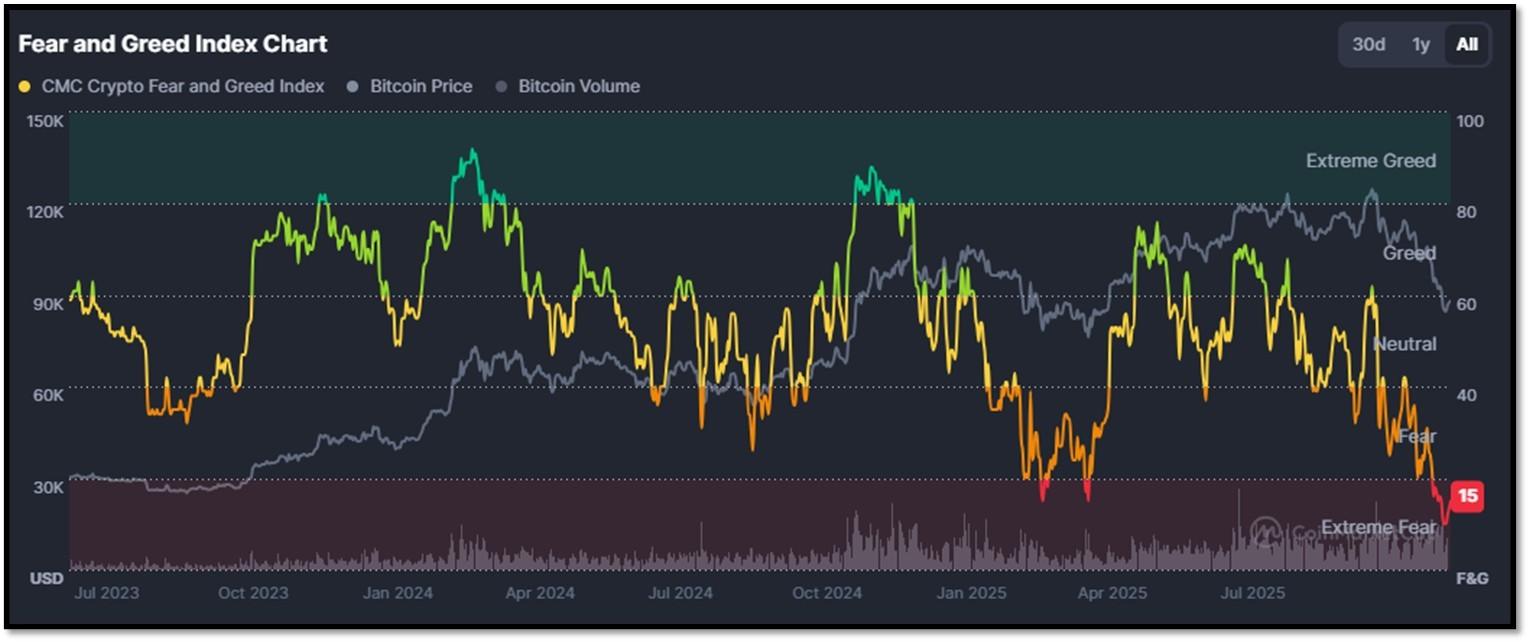
5M. Most recent read on the Crypto Fear & Greed Index with data as of 11/25/2025 is 15 (Extreme Fear). Last week’s data was 15 (Extreme Fear) (1-100). Fear & Greed Index – A Contrarian Data. The crypto market behavior is very emotional. People tend to get greedy when the market is rising which results in FOMO (Fear of missing out). Also, people often sell their coins in irrational reaction of seeing red numbers. With the Crypto Fear and Greed Index, the data try to help save investors from their own emotional overreactions. There are two simple assumptions:
- Extreme fear can be a sign that investors are too worried. That could be a buying opportunity.
- When Investors are getting too greedy, that means the market is due for a correction.
Therefore, the program for this index analyzes the current sentiment of the Bitcoin market and crunch the numbers into a simple meter from 0 to 100. Zero means “Extreme Fear”, while 100 means “Extreme Greed”. REF: Coinmarketcap.com, Today’sReading
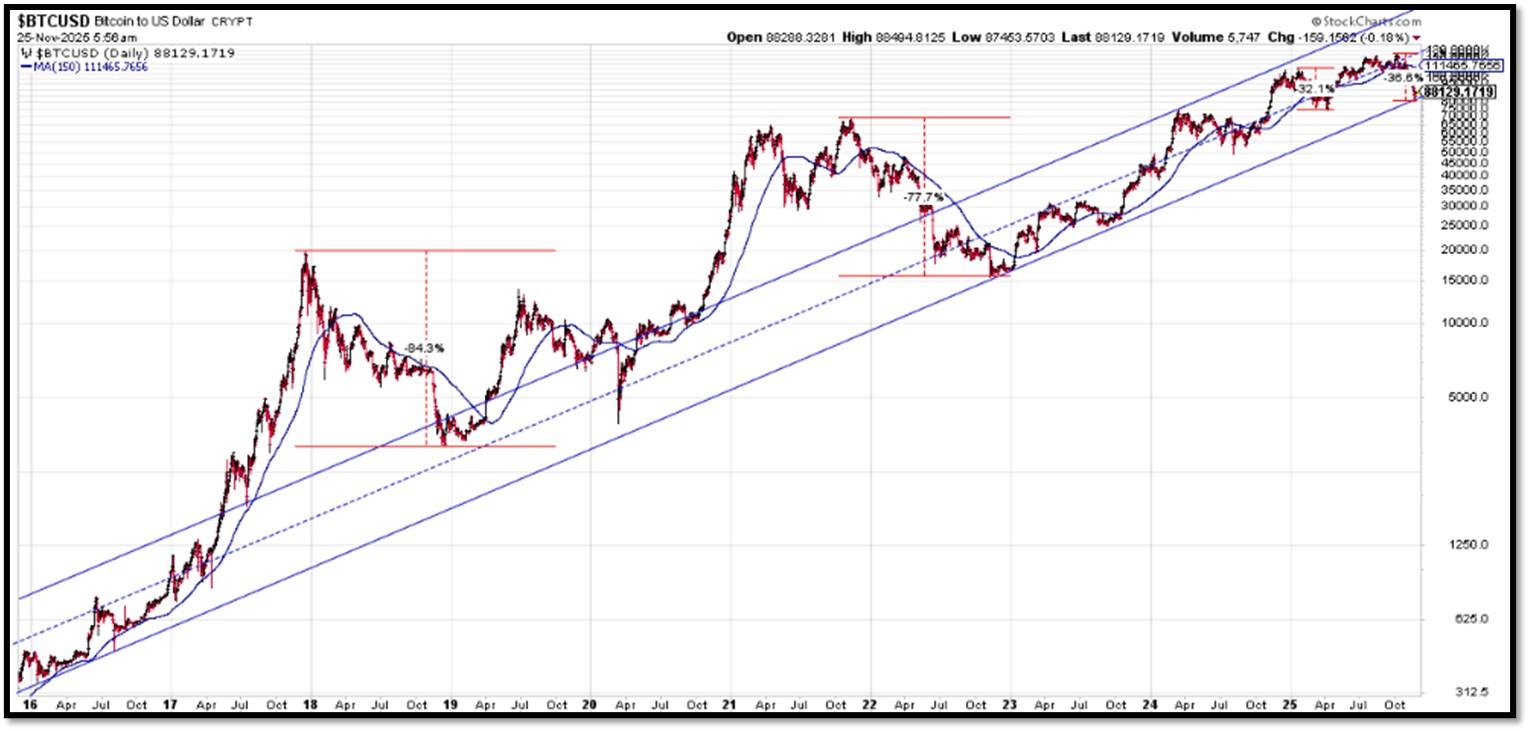
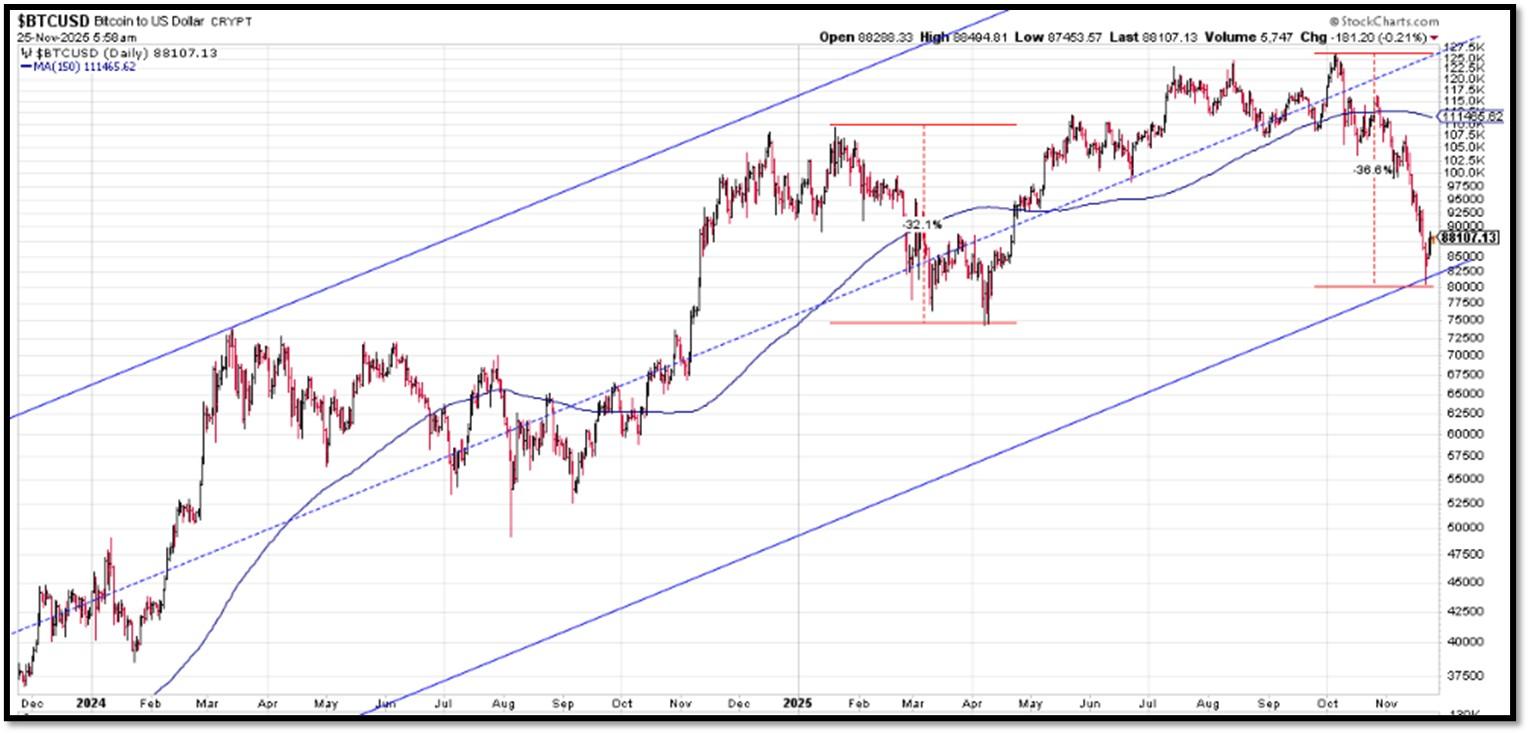
Bitcoin – 10-Year & 2-Year Charts. REF: Stockcharts10Y, Stockcharts2Y
From the desk of our Chief Investment Officer
As an investment professional with over twenty-six years of experience in the financial services industry, Andrew helps clients to protect, grow and transfer wealth during their lifetime with objective, unbiased, customized and efficient strategies.
Education, Professional Licenses Acquired & Affiliations
- Passed the Series 7, 63, 65 and 24 license examinations
- Currently holding Series 65 License
- BA in Economics – Boston University (Boston, MA) 1993
- Certificate in Commodities Trading – New York University (New York, NY) 1991
- Certificate in Financial Planning – New York University (New York, NY) April 2011
With extensive experience in the Financial Services Industry, Andrew Tang and Turner Financial Group provides disciplined wealth management with an intelligent caring approach to each and every client that compliments the Dedicated Financial offering.


Len writes much of his own content, and also shares helpful content from other trusted providers like Turner Financial Group (TFG).
The material contained herein is intended as a general market commentary, solely for informational purposes and is not intended to make an offer or solicitation for the sale or purchase of any securities. Such views are subject to change at any time without notice due to changes in market or economic conditions and may not necessarily come to pass. This information is not intended as a specific offer of investment services by Dedicated Financial and Turner Financial Group, Inc.
Dedicated Financial and Turner Financial Group, Inc., do not provide tax, legal or accounting advice. You should consult your own tax, legal and accounting advisors before engaging in any transaction.
Any hyperlinks in this document that connect to Web Sites maintained by third parties are provided for convenience only. Turner Financial Group, Inc. has not verified the accuracy of any information contained within the links and the provision of such links does not constitute a recommendation or endorsement of the company or the content by Dedicated Financial or Turner Financial Group, Inc. The prices/quotes/statistics referenced herein have been obtained from sources verified to be reliable for their accuracy or completeness and may be subject to change.
Past performance is no guarantee of future returns. Investing involves risk and possible loss of principal capital. The views and strategies described herein may not be suitable for all investors. To the extent referenced herein, real estate, hedge funds, and other private investments can present significant risks, including loss of the original amount invested. All indexes are unmanaged, and an individual cannot invest directly in an index. Index returns do not include fees or expenses.
Turner Financial Group, Inc. is an Investment Adviser registered with the United States Securities and Exchange Commission however, such registration does not imply a certain level of skill or training and no inference to the contrary should be made. Additional information about Turner Financial Group, Inc. is also available at www.adviserinfo.sec.gov. Advisory services are only offered to clients or prospective clients where Turner Financial Group, Inc. and its representatives are properly licensed or exempt from licensure. No advice may be rendered by Turner Financial Group, Inc. unless a client service agreement is in place.


