

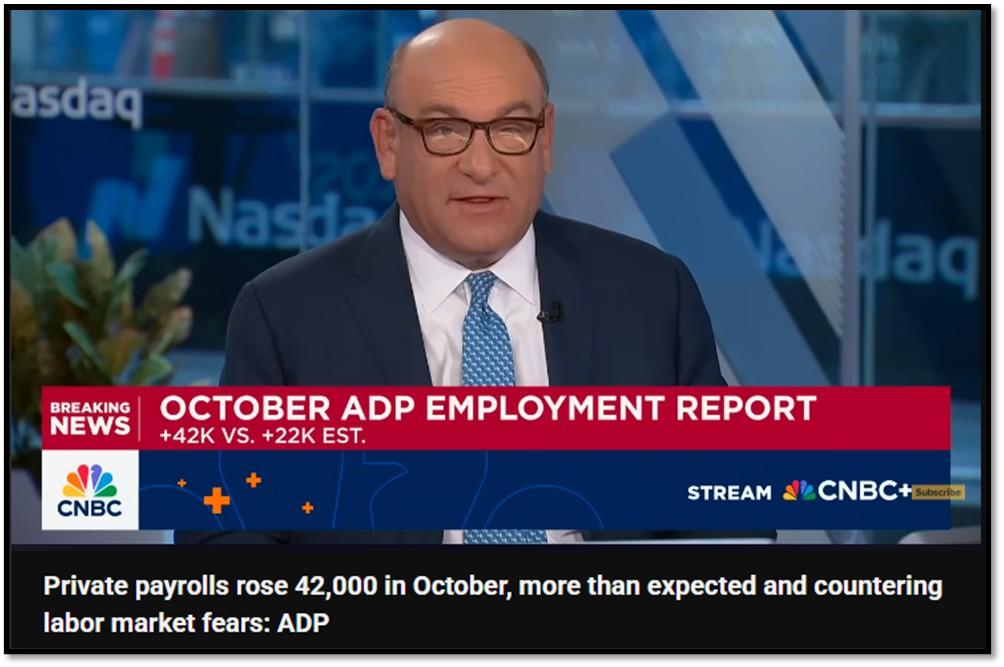
- 1. According to the latest ADP employment report, the U.S. private sector added 42,000 jobs in October 2025, marking a positive reversal from the revised loss of 29,000 in September.
- 2. Main story this week focuses on Zohran Mamdani’s mayoral agenda for New York City.
- 3. Given the current macroeconomic environment, small cap equities stand out as an attractive area for investment.
- 4. World Watch
- 4A. Amazon announced plans to eliminate about 14,000 corporate positions worldwide, with roughly 1,450 jobs affected in California alone.
- 4B. The bloc of European Union (EU) countries recently agreed to a revised climate-plan ahead of the COP30 summit, signaling a practical shift in ambition. Under the deal, the EU committed to a legally binding target of cutting collective emissions by 90 % from 1990 levels by 2040, yet countries were given flexibility to meet up to 5 % of that target via carbon-credits, effectively lowering the domestic effort to around 85 %.
- 4C. An updated snapshot of the current global state of economy.
- 5. Quant & Technical Corner – A selection of quantitative & technical data we monitor on a regular basis to help gauge the overall financial market conditions and the investment environment.
1. According to the latest ADP employment report, the U.S. private sector added 42,000 jobs in October 2025, marking a positive reversal from the revised loss of 29,000 in September.
The improvement suggests that the labor market is stabilizing after several months of weakness. Hiring gains were concentrated in trade, transportation, utilities, and healthcare, while professional business services and leisure sectors continued to show softness. Although modest, this uptick indicates that employers may be regaining confidence as inflation pressures ease and financial conditions improve.
However, the broader economy still shows signs of strain. The ISM Manufacturing Index for October came in at 48.7, remaining below the 50 threshold that separates expansion from contraction. A reading under 50 indicates that manufacturing activity is shrinking, reflecting slower new orders, reduced output, and weaker business sentiment. This divergence between modest job growth and contracting factory activity highlights a mixed economic picture: the services sector remains relatively stable, but industrial production continues to face headwinds from higher borrowing costs and cautious business investment. Overall, the data suggests that while the U.S. economy is not in decline, growth remains uneven and dependent on the resilience of consumer and service-related sectors. Click onto picture below to access video. REF: WSJ, Briefing.com
2. Main story this week focuses on Zohran Mamdani’s mayoral agenda for New York City.
It is ambitious and ideologically driven, but it now faces the constraints of fiscal reality. His campaign centered on progressive goals such as fare free public buses, universal childcare, city owned grocery stores, and the construction of 200,000 new affordable housing units. These initiatives are designed to address deep social and economic inequalities in the city, and they resonate strongly with voters seeking transformative change. However, financing such expansive programs requires vast resources that the city does not currently possess. Mamdani’s proposals rely heavily on new tax revenue from corporations and high-income residents, along with expanded borrowing, measures that may encounter political and legal resistance at both the state and municipal levels.
The underlying challenge is that New York City’s budget is already under significant strain. Rising pension obligations, public sector wage demands, and the growing costs of social services limit the fiscal flexibility needed to implement sweeping new programs. While Mamdani’s vision seeks to redefine the city’s social contract, the practical hurdles, such as dependence on Albany for tax authorization and the risk of capital flight, illustrate the difficulty of aligning ideology with economic feasibility. In essence, his promises are colliding with the hard arithmetic of municipal finance. The coming months will test whether his administration can balance bold progressive objectives with the discipline required to maintain fiscal stability and investor confidence in one of the world’s most complex urban economies. Click onto picture below to access video. REF: Bloomberg


3. Given the current macroeconomic environment, small cap equities stand out as an attractive area for investment.
Valuations in large cap U.S. equities remain elevated after a long period of outperformance, while small cap companies have lagged despite solid fundamentals and improving earnings expectations. As the economy transitions from late cycle deceleration toward modest recovery, smaller firms are well positioned to benefit from renewed business investment, easing credit conditions, and stronger domestic demand. Historically, small caps have outperformed in the early stages of rate cutting cycles and periods of moderate inflation, conditions that now appear to be taking shape. For investors seeking growth opportunities with potential valuation tailwinds, small caps offer a compelling entry point within a diversified portfolio.
One high quality option in this space is the Congress Asset Small Cap Growth Fund (CSMCX). The fund focuses on identifying innovative, early-stage growth companies with sustainable earnings momentum and disciplined capital management. Its strategy emphasizes businesses with durable competitive advantages, strong balance sheets, and above average revenue growth, while maintaining a prudent approach to risk. CSMCX has historically provided exposure to sectors such as technology, healthcare, and industrial innovation—areas that tend to lead in periods of renewed economic expansion. In today’s environment, where valuations are more reasonable and the probability of monetary easing is increasing, the fund’s emphasis on quality growth within the small cap universe offers an appealing balance of opportunity and resilience. REF: CSMCX – Congress Small Cap Growth
NOTE: Not investment advice or recommendations. Investors should carefully consider the investment objectives, risks, charges, and expenses before investing. For additional information about the securities mentioned above or in the videos, please visit the respective fund’s documents pages for the fund’s prospectus. Please read all materials carefully before investing.

With the current macro-economic backdrop, below are areas we currently favor:
- Fixed Income – (Corporates & Muni) High Yield as Opportunistic Allocation (Low-Beta)
- Fixed Income – Short-term Corporates & Muni (Low-Beta)
- Businesses that contribute to and benefit from AI & Automation (Market-Risk)
- Fintech & Financials (Market-Risk)
- Digital Asset – Bitcoin (Market-Risk/Hedge)
- Neo-Cloud Computing (Market-Risk)
- India & China-Tech (Market-Risk)
- Cyber-Security & Software (Market-Risk)
- Quantum Computing (Market-Risk)
4. World Watch
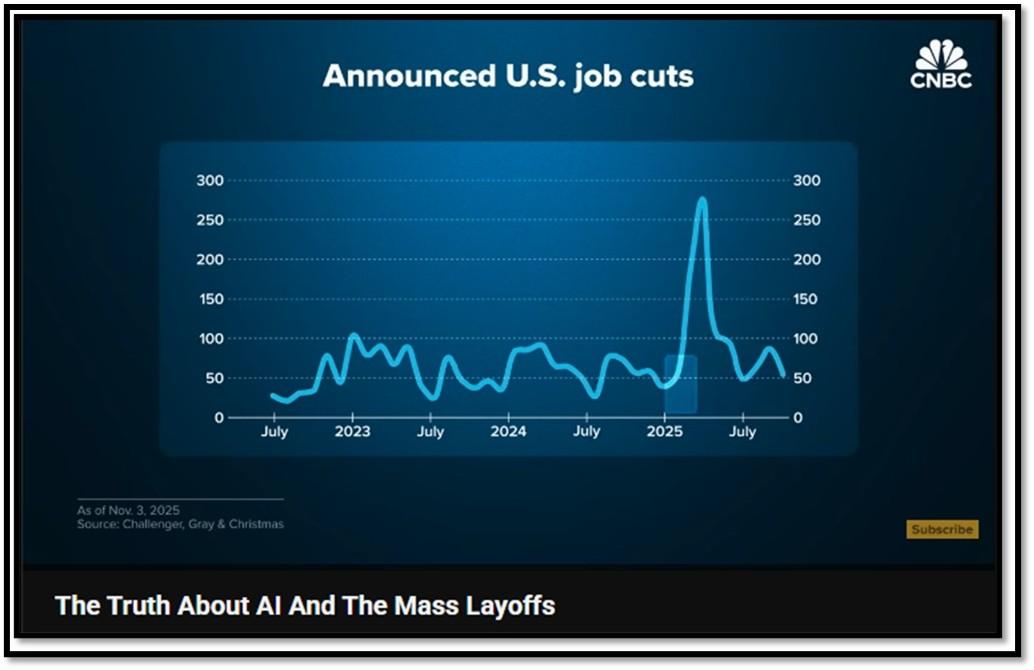
4A. Amazon announced plans to eliminate about 14,000 corporate positions worldwide, with roughly 1,450 jobs affected in California alone.
The reductions are concentrated in corporate and technology roles as the company redirects resources toward artificial intelligence development and operational efficiency. Paramount Global, following its merger with Skydance Media, confirmed plans to cut approximately 2,000 employees, or about 10 percent of its workforce, as part of a broad restructuring aimed at consolidating overlapping business units. Cargill Inc., one of the world’s largest agricultural companies, disclosed permanent layoffs of 80 employees in Minnesota and additional reductions globally under a plan to trim its total workforce by around 5 percent.
Outside the United States, the layoff trend has spread across multiple industries and regions. Siemens Energy announced job reductions in its wind turbine division amid continuing losses in its renewable energy business. Samsung Electronics launched voluntary separation programs within its semiconductor segment due to weak global demand and pricing pressure. HSBC also confirmed additional staff cuts in London and Hong Kong as part of its cost reduction and digital transformation plan. These widespread workforce reductions reflect a cooling global economy and rising corporate caution. The weakening labor market, alongside easing inflation pressures, increases the likelihood that the Federal Reserve will move forward with a December interest rate cut to support employment and stabilize economic momentum heading into 2026. REF: CNBC, REUTERS, LATimes
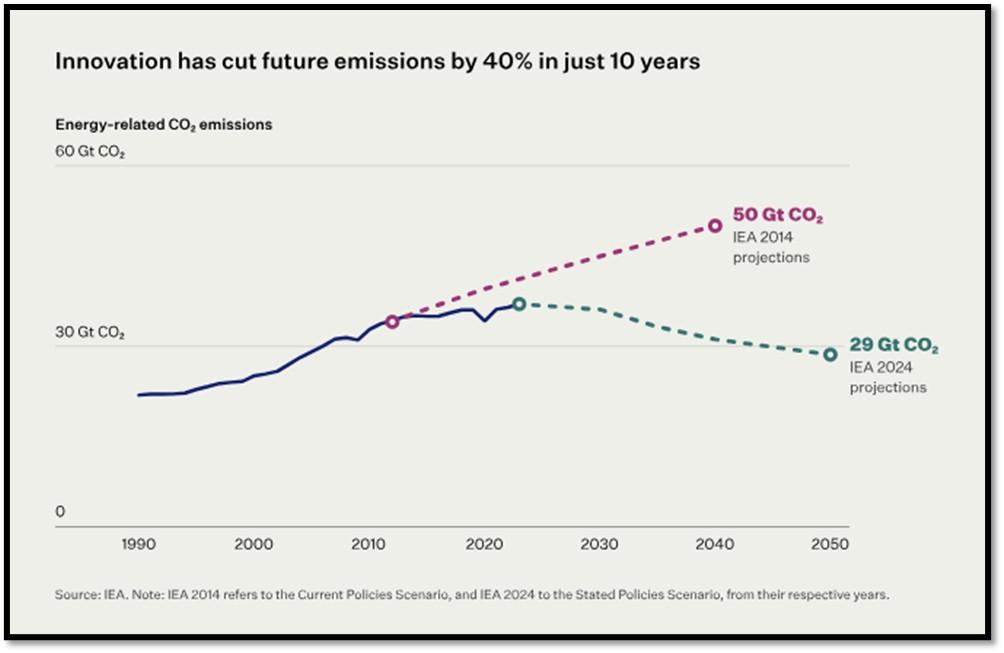
4B. The bloc of European Union (EU) countries recently agreed to a revised climate-plan ahead of the COP30 summit, signaling a practical shift in ambition. Under the deal, the EU committed to a legally binding target of cutting collective emissions by 90 % from 1990 levels by 2040, yet countries were given flexibility to meet up to 5 % of that target via carbon-credits, effectively lowering the domestic effort to around 85 %.
Additional compromises include allowance for a further 5 % of international credits in future and a delay in launching a new carbon market. While supporters argue the target remains science-based and avoids industrial damage, critics say the softening undermines the bloc’s historical role as climate leader.
In parallel, Bill Gates issued a new position on climate change that marks a notable tonal shift. In a recent memo he argued that although climate change is serious and will disproportionately affect poor countries, it will not bring about civilization’s end. He urged the climate-community to pivot away from a “doomsday view” focused narrowly on near-term emissions and temperature metrics, and instead center policy on improving human welfare, long-term innovation, and adaptation. His stance underscores a growing pragmatism in climate discourse: acknowledging the crisis while appealing for resource prioritization toward solutions that maximize human-impact. Click onto picture below to access video from REUTERS. REF: GatesNotes, WSJ, REUTERS, COP30

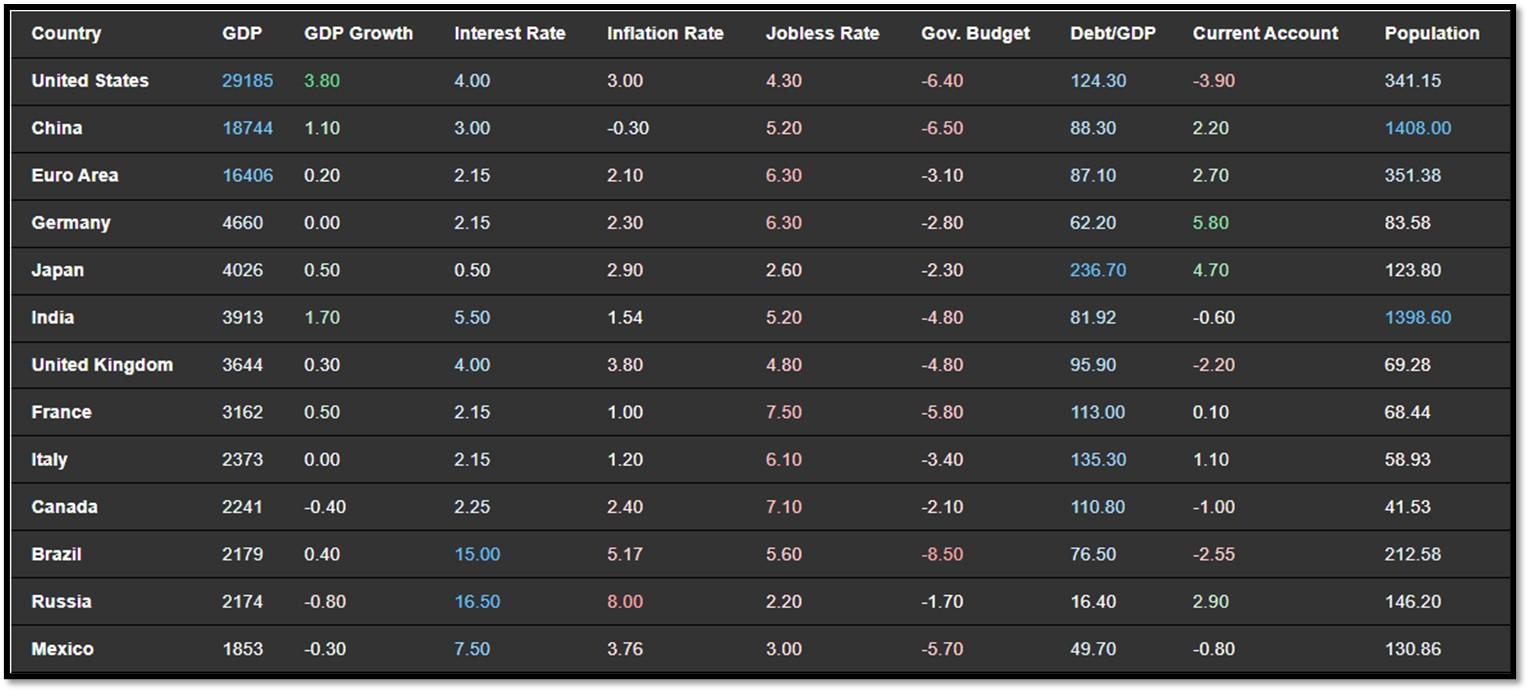
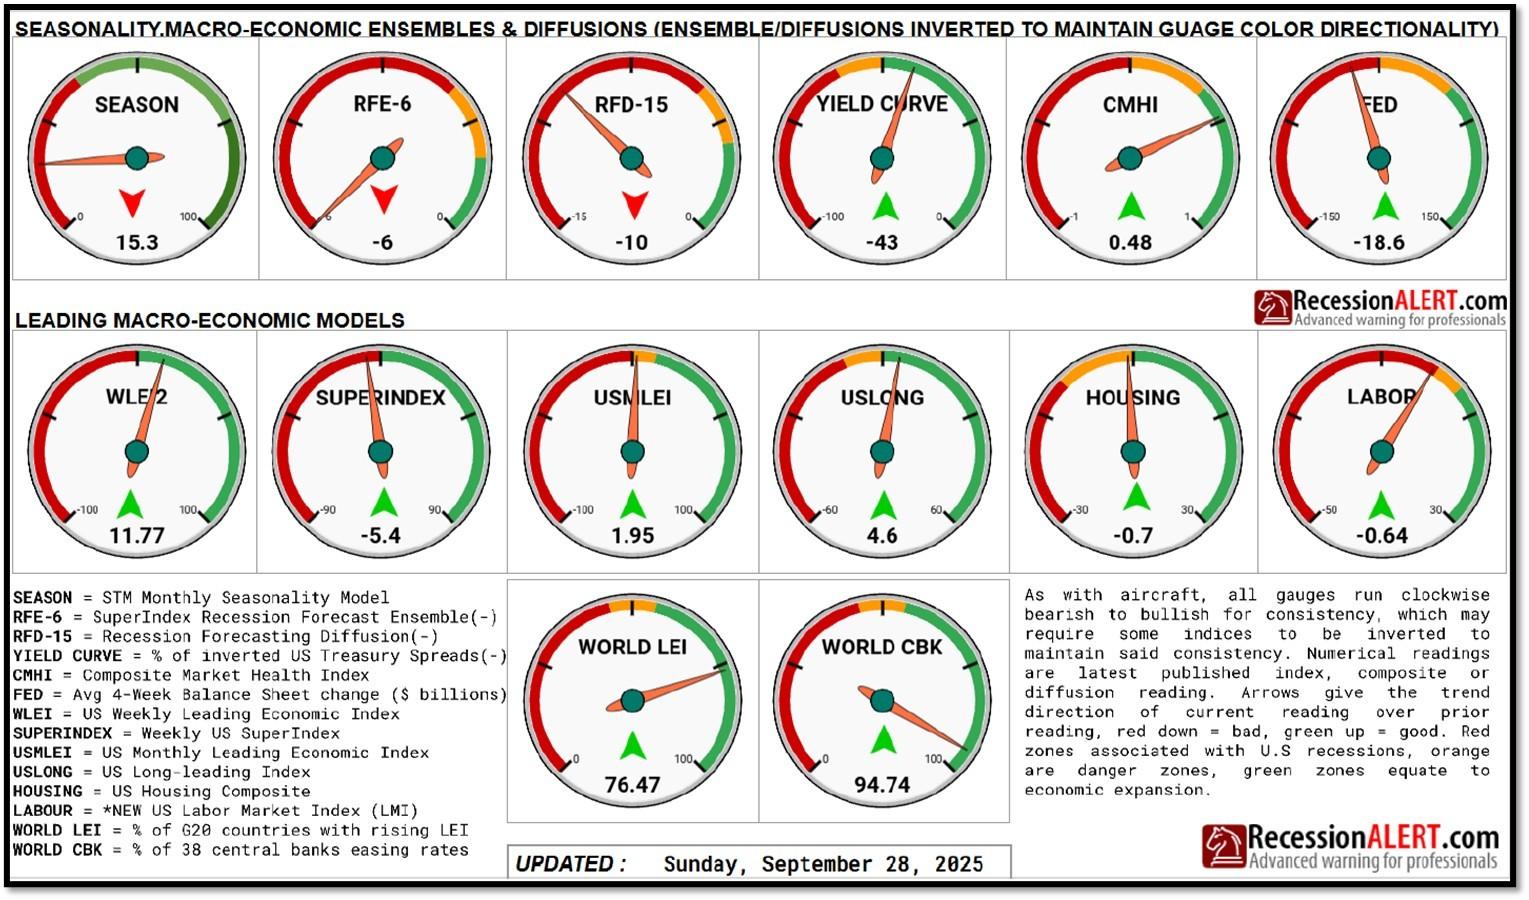
4C. An updated snapshot of the current global state of economy.
According to TradingEconomics as of 11/3/2025 (REF: TradingEconomics)
- The Federal Reserve lowered the federal funds rate by 25 bps to a target range of 3.75%–4.00% at its October 2025 meeting, in line with market expectations.
- The German economy stagnated in Q3 2025, following an upwardly revised 0.2% contraction in Q2, according to preliminary estimates.
- The German annual inflation rate inched lower to 2.3% in October of 2025 from the year-to-date high of 2.4% in the previous month, but remained above market expectations of 2.2%, according to a preliminary estimate.
- France’s economy expanded by 0.5% quarter-on-quarter in Q3 2025, accelerating from 0.3% in the previous quarter and well above market expectations of 0.1%.
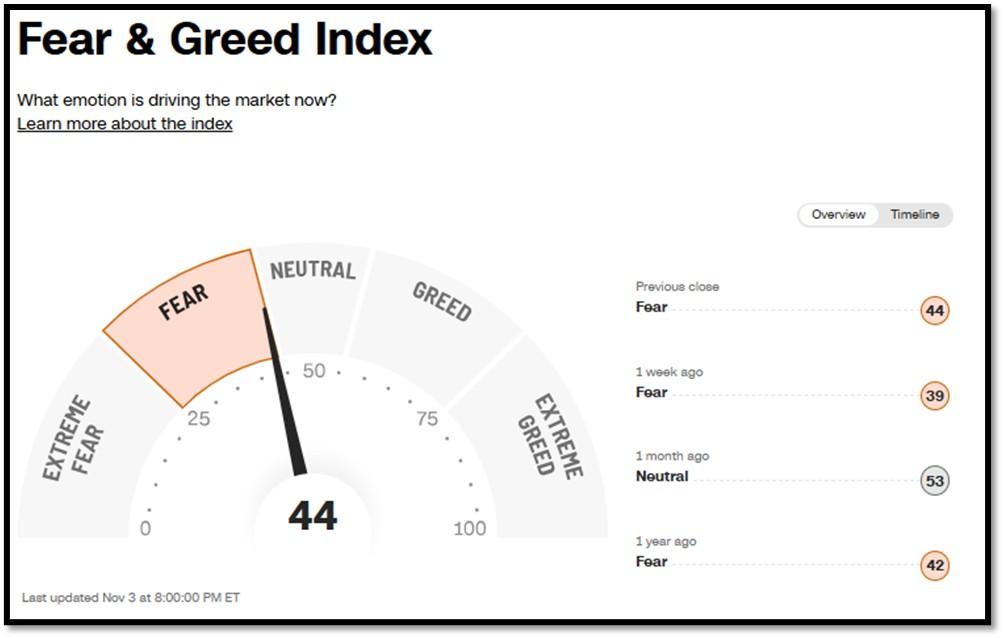
5. Quant & Technical Corner – A selection of quantitative & technical data we monitor on a regular basis to help gauge the overall financial market conditions and the investment environment.
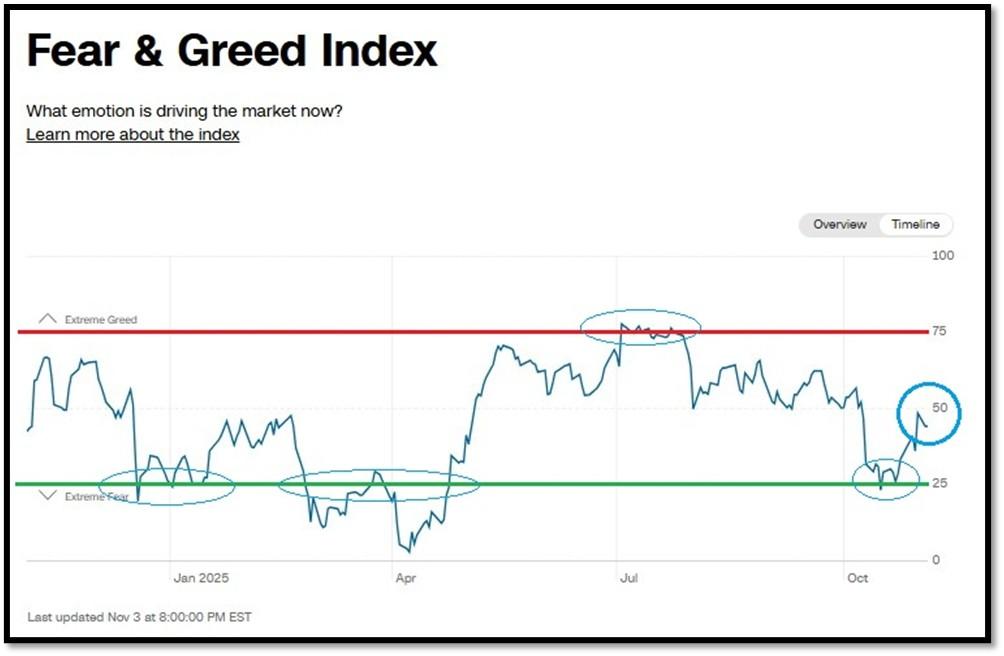
5A. Most recent read on the Fear & Greed Index with data as of 11/3/2025 – 8:00 PM-ET is 44 (Fear). Last week’s data was 39 (Fear) (1-100). CNNMoney’s Fear & Greed index looks at 7 indicators (Stock Price Momentum, Stock Price Strength, Stock Price Breadth, Put and Call Options, Junk Bond Demand, Market Volatility, and Safe Haven Demand). Keep in mind this is a contrarian indicator! REF: Fear&Greed via CNNMoney
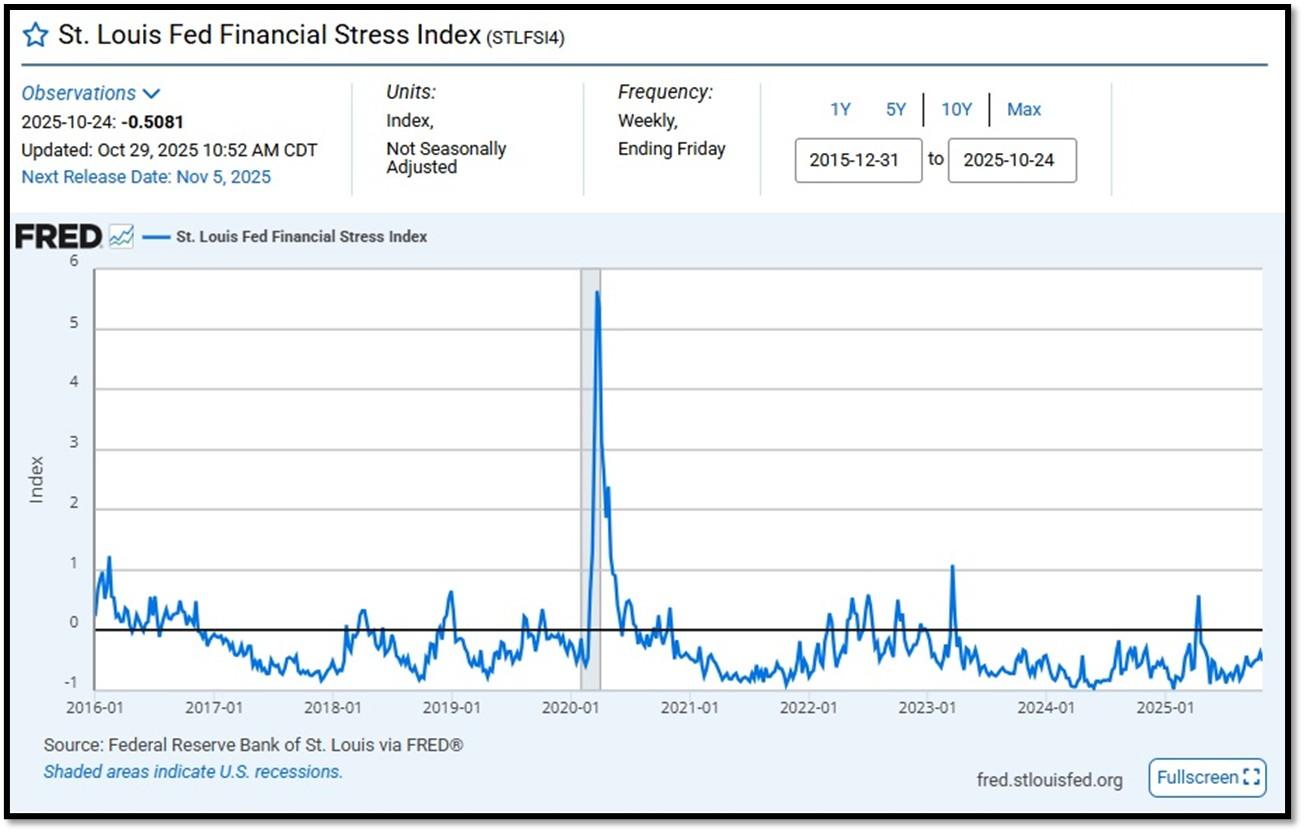
5B. St. Louis Fed Financial Stress Index’s (STLFSI4) most recent read is at –0.5081 as of October 29, 2025. Previous week’s data was -0.3683. A big spike up from previous readings reflecting the turmoil in the banking sector back in 2023. This weekly index is not seasonally adjusted. The STLFSI4 measures the degree of financial stress in the markets and is constructed from 18 weekly data series: seven interest rate series, six yield spreads and five other indicators. Each of these variables captures some aspect of financial stress. Accordingly, as the level of financial stress in the economy changes, the data series are likely to move together. REF: St. Louis Fed
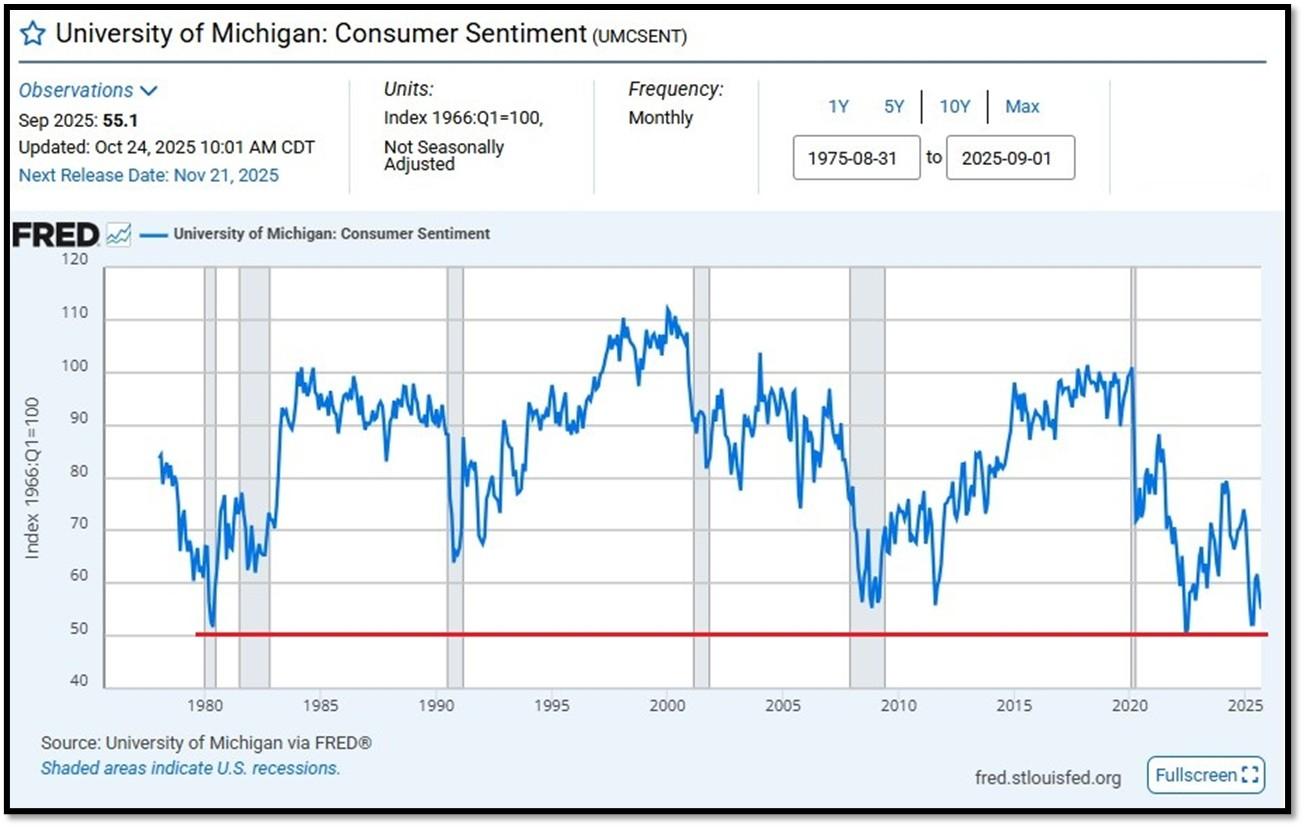
5C. University of Michigan, University of Michigan: Consumer Sentiment [UMCSEMT] for September at 55.1, retrieved from FRED, Federal Reserve Bank of St. Louis, October 24, 2025. Back in June 2022, Consumer Sentiment hit a low point going back to April 1980. REF: UofM
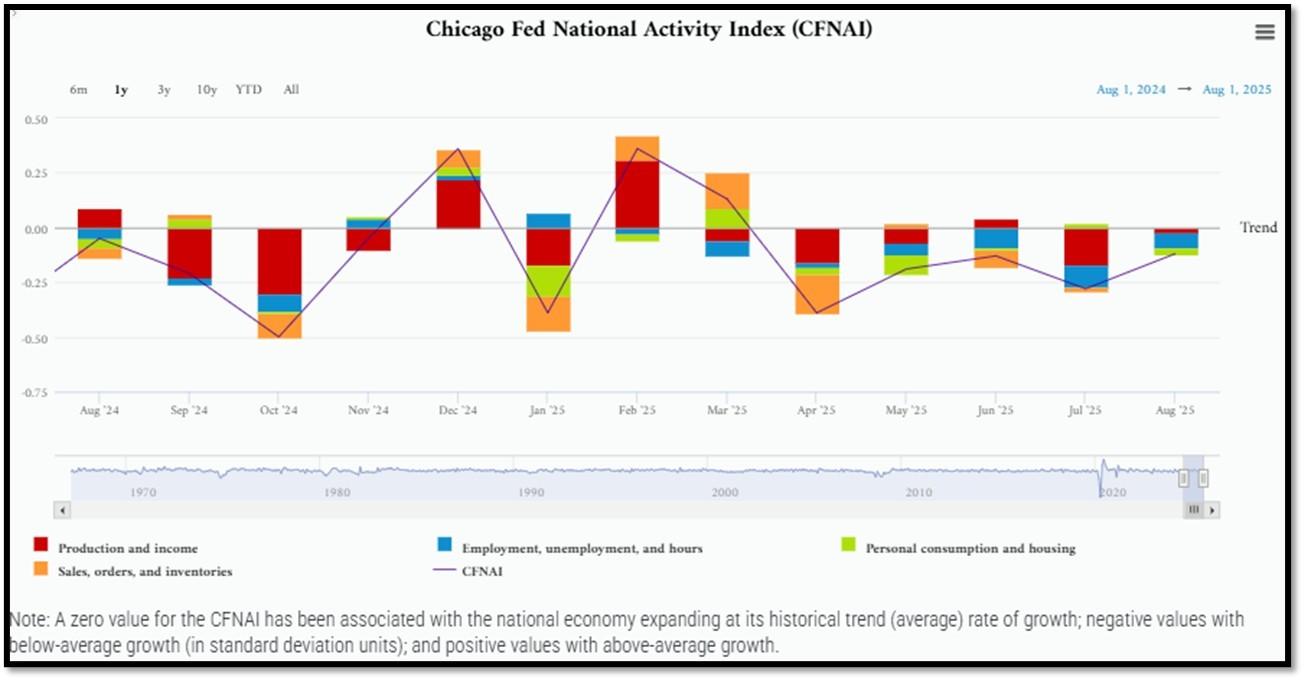
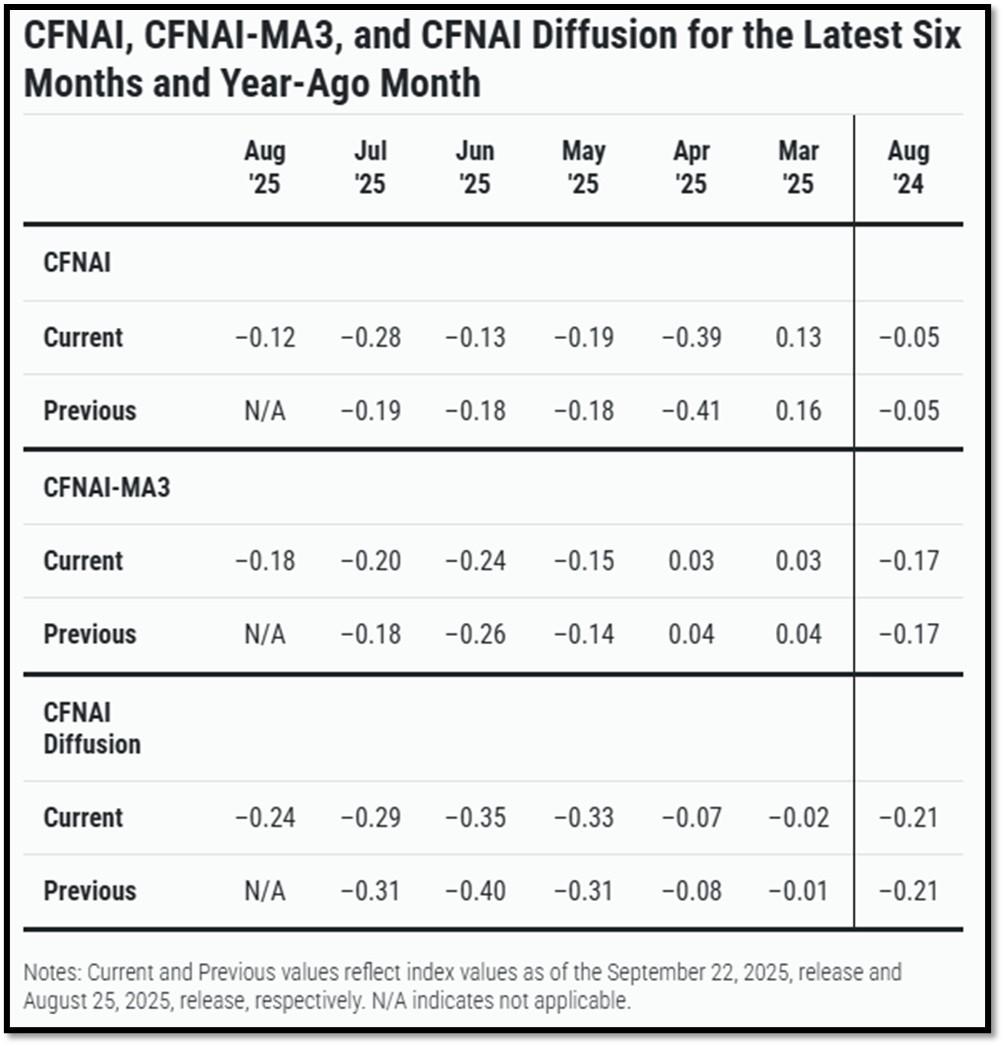
5D. The Chicago Fed National Activity Index (CFNAI) increased to –0.12 in August from –0.28 in July. Three of the four broad categories of indicators used to construct the index increased from July, but three categories made negative contributions in August. The index’s three-month moving average, CFNAI-MA3, increased to –0.18 in August from –0.20 in July. REF: ChicagoFed, August’s Report
5E. (9/18/2025) The Conference Board Leading Economic Index (LEI) for the US declined by 0.5% in August 2025 to 98.4 (2016=100), after a small 0.1% increase in July (upwardly revised from an originally reported 0.1% decline). The LEI fell by 2.8% over the six months between February and August 2025, a faster rate of decline than its 0.9% contraction over the previous six-month period (August 2024 to February 2025). The composite economic indexes are the key elements in an analytic system designed to signal peaks and troughs in the business cycle. The indexes are constructed to summarize and reveal common turning points in the economy in a clearer and more convincing manner than any individual component. The CEI is highly correlated with real GDP. The LEI is a predictive variable that anticipates (or “leads”) turning points in the business cycle by around 7 months. Shaded areas denote recession periods or economic contractions. The dates above the shaded areas show the chronology of peaks and troughs in the business cycle. The ten components of The Conference Board Leading Economic Index® for the U.S. include: Average weekly hours in manufacturing; Average weekly initial claims for unemployment insurance; Manufacturers’ new orders for consumer goods and materials; ISM® Index of New Orders; Manufacturers’ new orders for nondefense capital goods excluding aircraft orders; Building permits for new private housing units; S&P 500® Index of Stock Prices; Leading Credit Index™; Interest rate spread (10-year Treasury bonds less federal funds rate); Average consumer expectations for business conditions. REF: ConferenceBoard, LEI Report for August (ReceesionAlert) (Released on 9/30/2025)
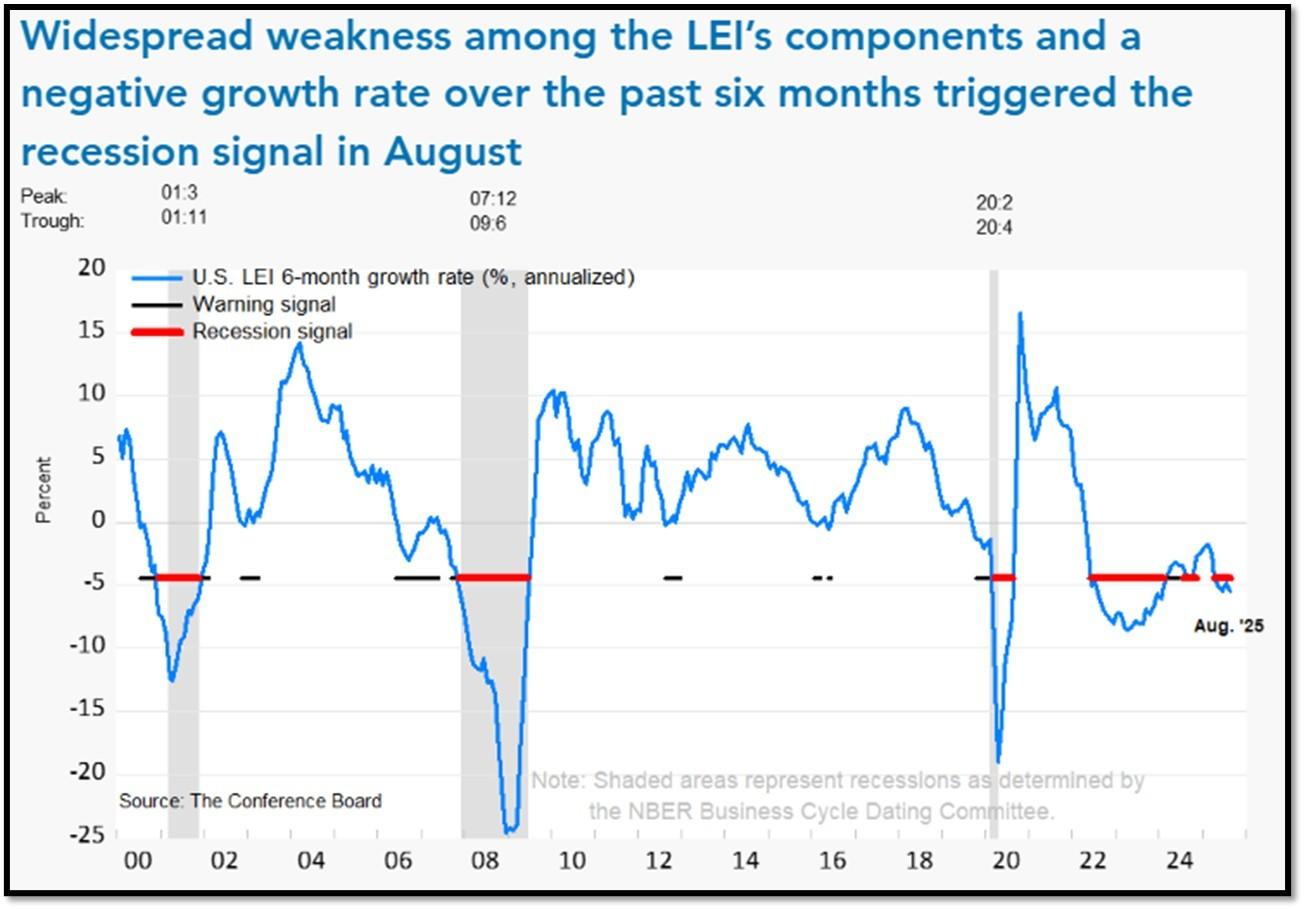
We have experienced a “rolling recession” since June 2022 and are only now emerging from it. However, authorities are not labeling it a recession due to high employment data from June 2022-2025.
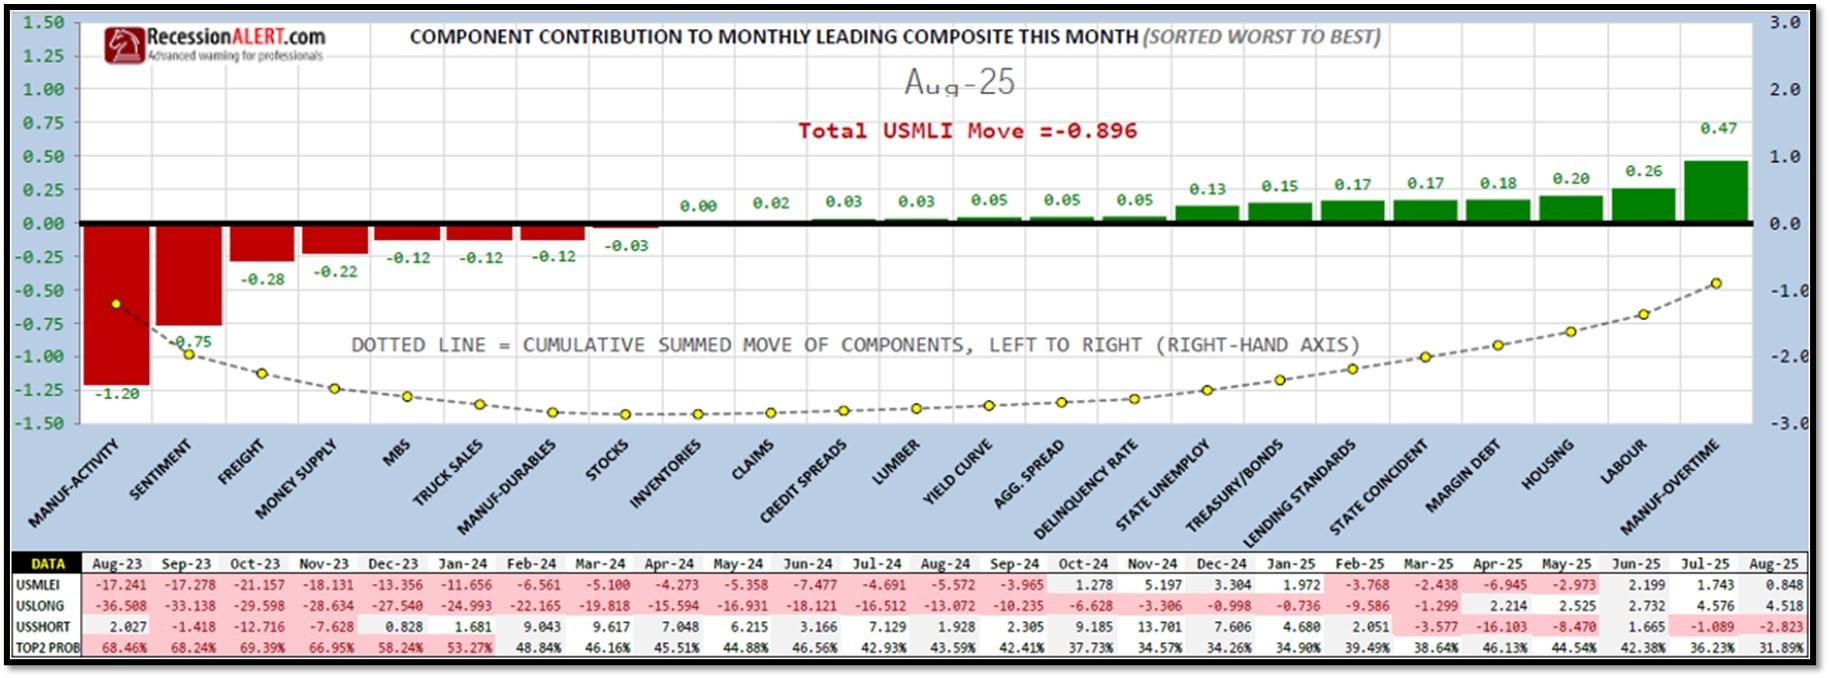
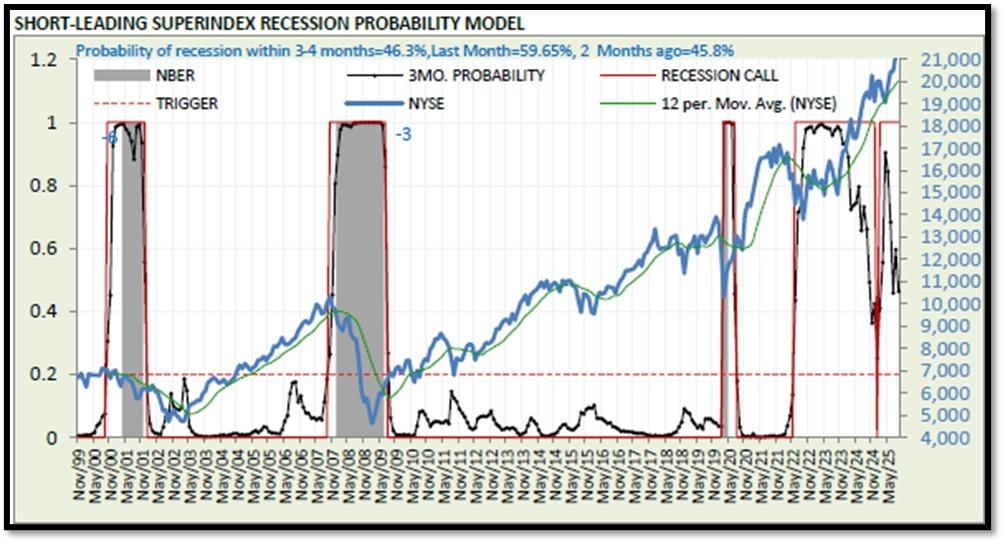
5F. Probability of U.S. falling into Recession within 3 to 4 months is currently at 46.3% (with data as of 09/28/2025 – Next Report 10/12/2025) according to RecessionAlert Research. Last release’s data was at 59.51%. This report is updated every two weeks. REF: RecessionAlertResearch
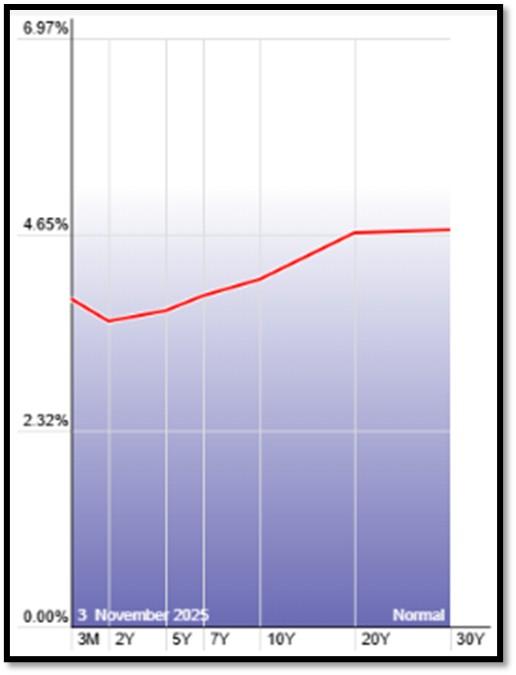
5G. Yield Curve as of 11/3/2025 is showing Normal. Spread on the 10-yr Treasury Yield (3.98%) minus yield on the 2-yr Treasury Yield (3.48%) is currently at 50bps as of 11/3/25. REF: Stockcharts The yield curve—specifically, the spread between the interest rates on the ten-year Treasury note and the three-month Treasury bill—is a valuable forecasting tool. It is simple to use and significantly outperforms other financial and macroeconomic indicators in predicting recessions two to six quarters ahead. REF: NYFED
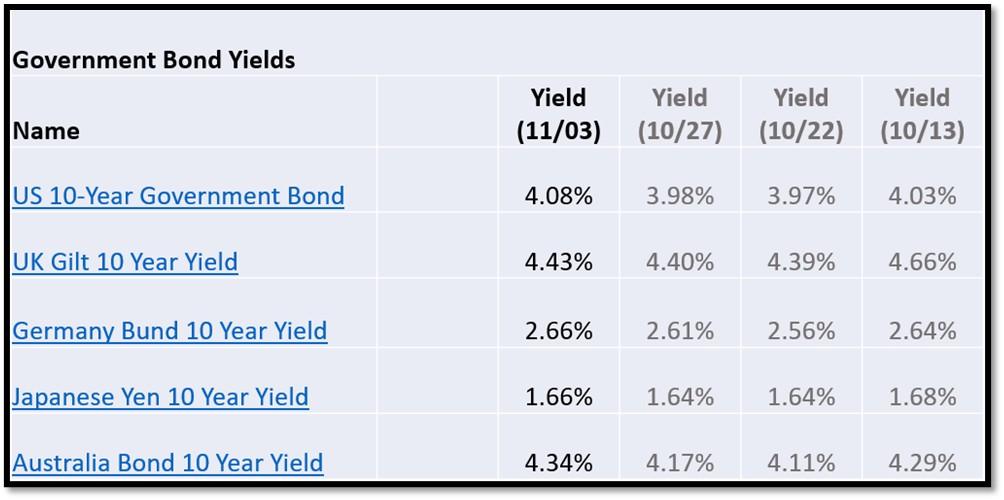
5H. Recent Yields in 10-Year Government Bonds. REF: Source is from Bloomberg.com, dated 11/3/2025, rates shown below are as of 11/3/2025, subject to change.
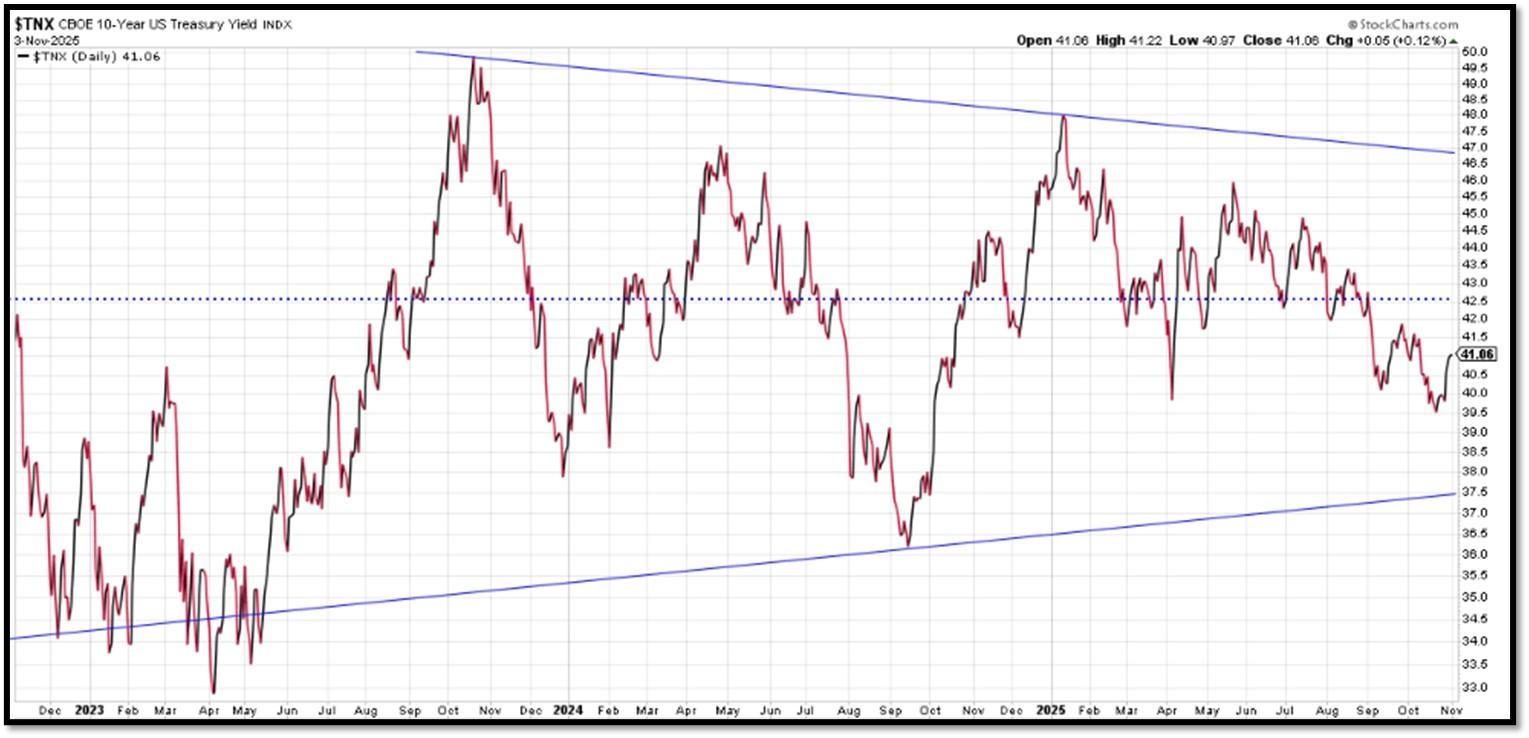
The 10-Year US Treasury Yield… The 10-Year Yield is indirectly related to inflation and prospect of the economy. I expect the 10-Year Yield to drop towards the support line. REF: StockCharts1
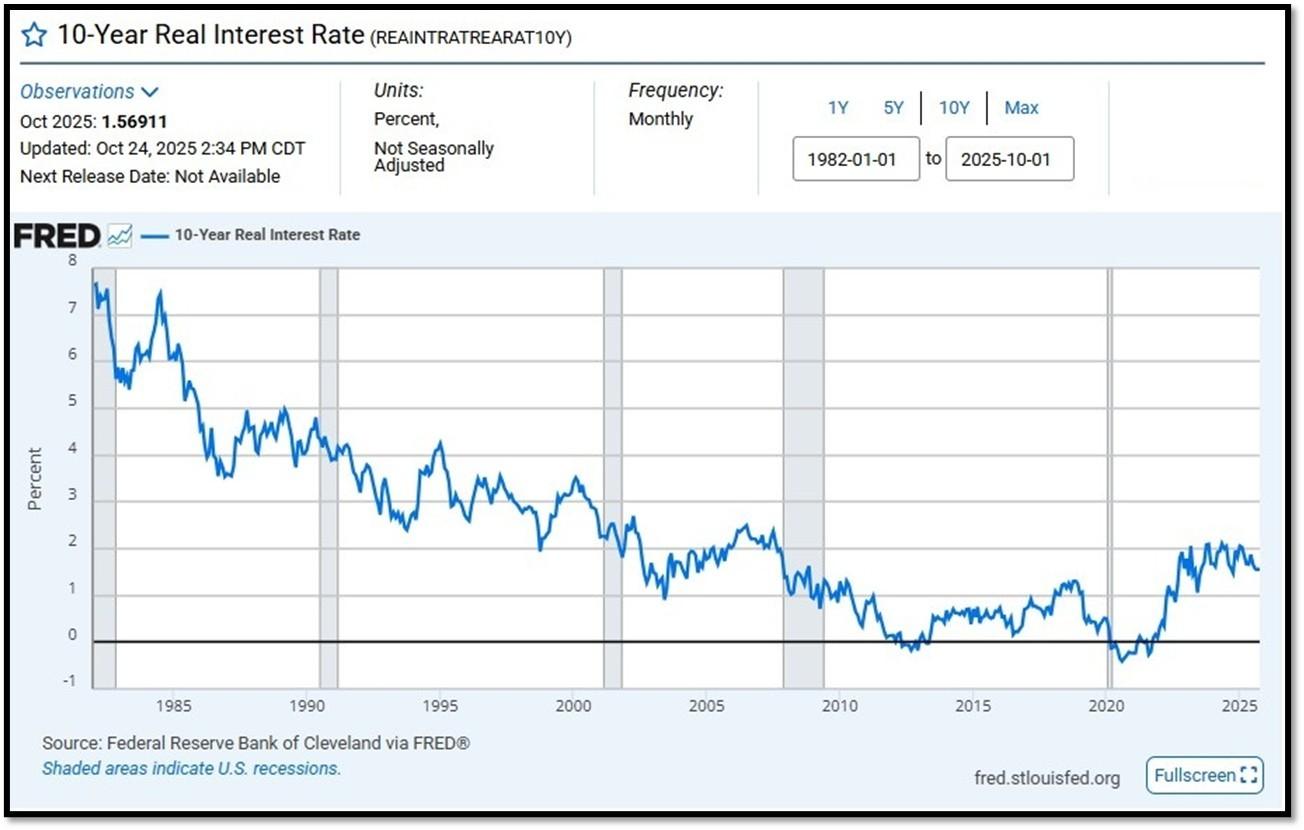
10-Year Real Interest Rate at 1.56911% as of 10/24/25. Last month’s data was 1.56046%. REF: REAINTRATREARAT10Y
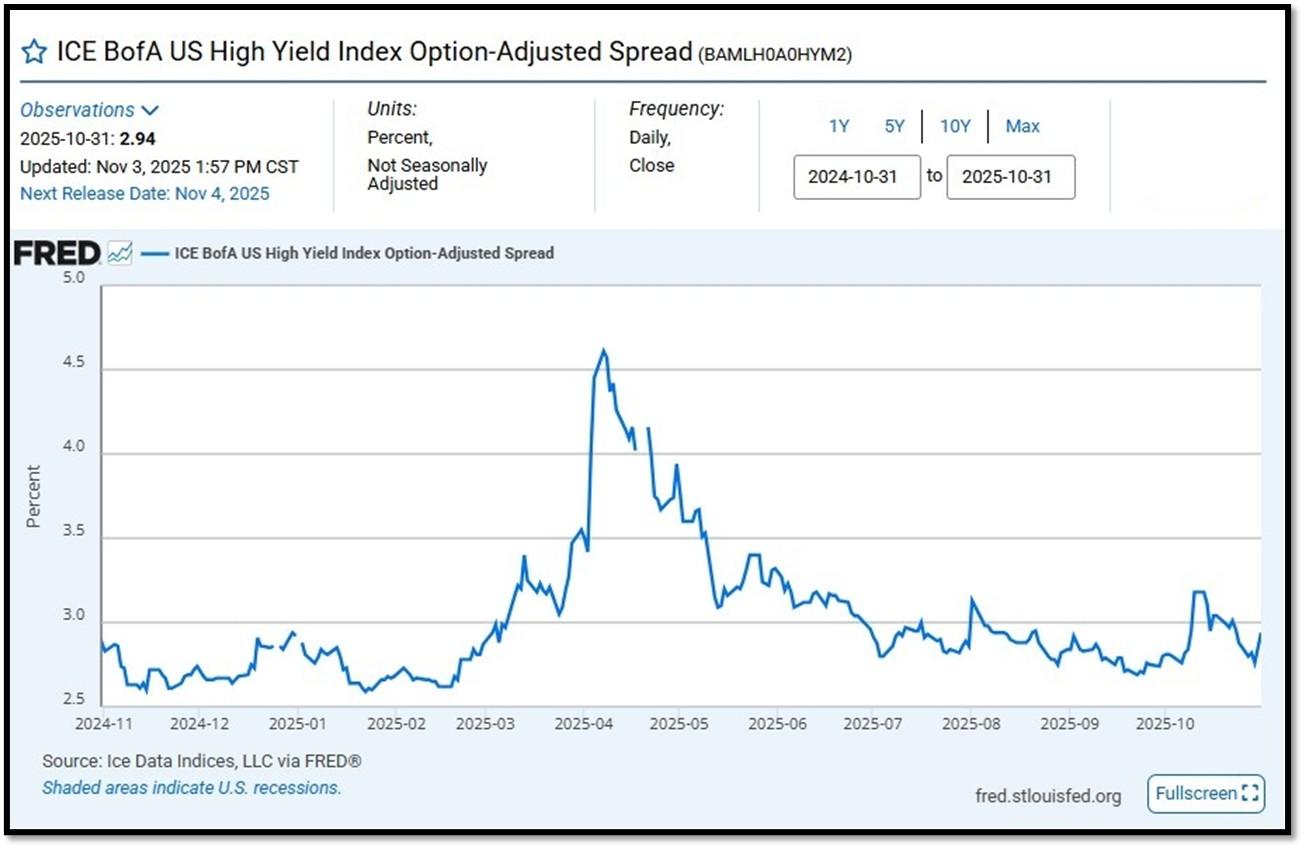
ICE BofA US High Yield Index Option-Adjusted Spread (BAMLH0A0HYM2) currently at 2.94 as of November 3, 2025. This is a key indicator of market sentiment, particularly regarding risk and economic health. At its core, the spread reflects the extra return investors demand to hold riskier corporate debt over safer government securities. High-yield bonds are issued by companies with lower credit ratings (below investment grade, like BB or lower), meaning they carry a higher chance of default. The spread compensates for this risk. When the spread is narrow—say, around 2.5% to 3%, as seen recently—it suggests investors are confident, willing to accept less extra yield because they perceive lower default risk or a strong economy. Narrow spreads often align with bullish markets, where cash is flowing, growth is steady, and fear is low. REF: FRED-BAMLH0A0HYM2
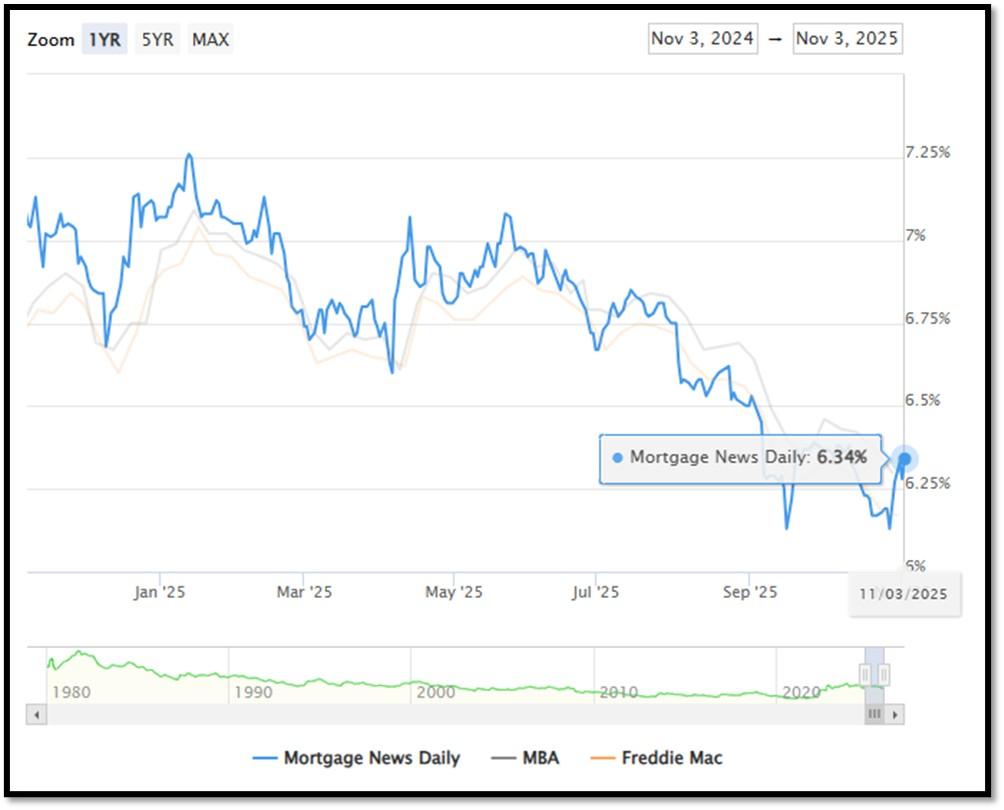
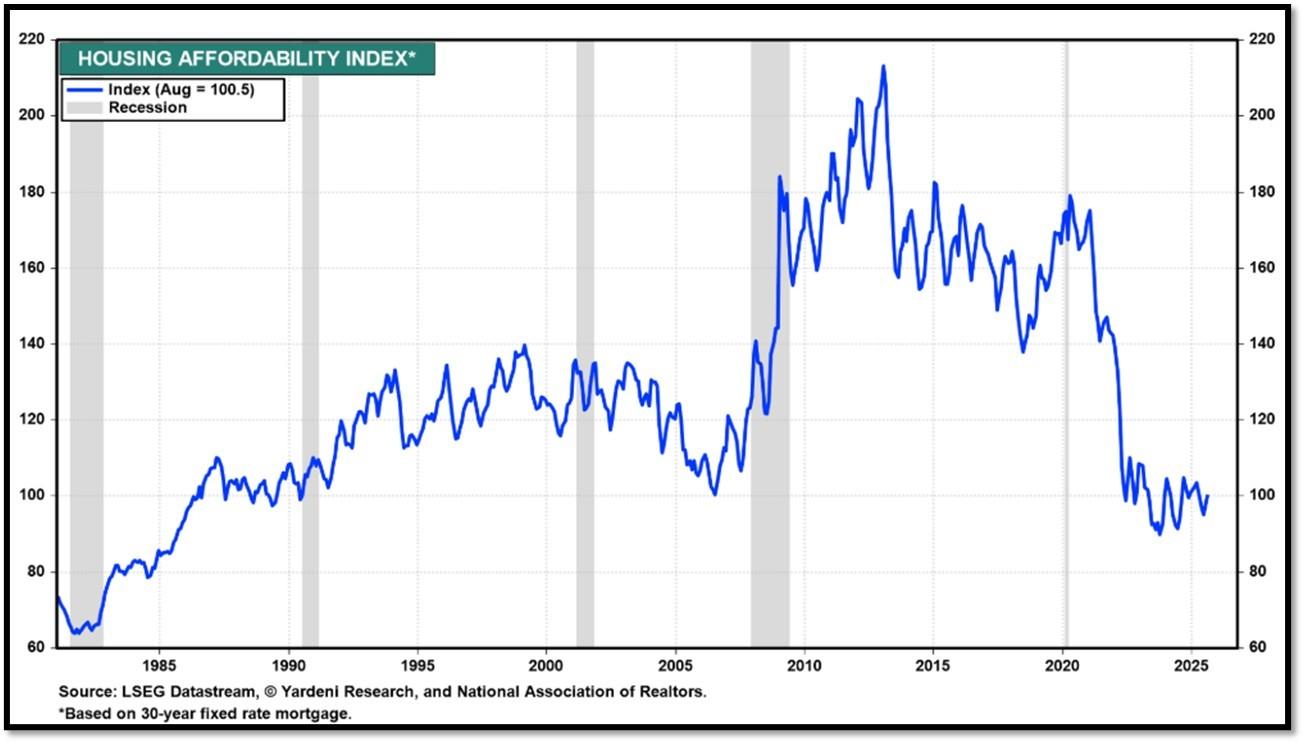
5I. (11/3/2025) Today’s National Average 30-Year Fixed Mortgage Rate is 6.34% (All Time High was 8.03% on 10/19/23). Last week’s data was 6.19%. This rate is the average 30-year fixed mortgage rates from several different surveys including Mortgage News Daily (daily index), Freddie Mac (weekly survey), Mortgage Bankers Association (weekly survey) and FHFA (monthly survey). REF: MortgageNewsDaily, Today’s Average Rate
The recent spike in the 30-year fixed-rate jumbo mortgage to 6.34%, compared to Freddie Mac’s rate at 6.17% and the Mortgage Bankers Association (MBA) rate at 6.30%, highlights key differences in the mortgage market. Jumbo mortgages, which exceed the conforming loan limits set by government agencies like Freddie Mac, typically carry higher interest rates because they are riskier for lenders. These loans are not backed by government entities, which increases the risk for lenders and, consequently, leads to higher rates. In contrast, Freddie Mac and MBA provide averages for conforming loans, which meet federal guidelines and have lower risk due to government backing, keeping their rates lower.
Housing Affordability Index for Aug = 100.5 // July = 98.8 // Jun = 94.4 // May = 97.2 // Apr = 101.0 // Mar = 103.2 // Feb = 102.2. Data provided by Yardeni Research. REF: Yardeni
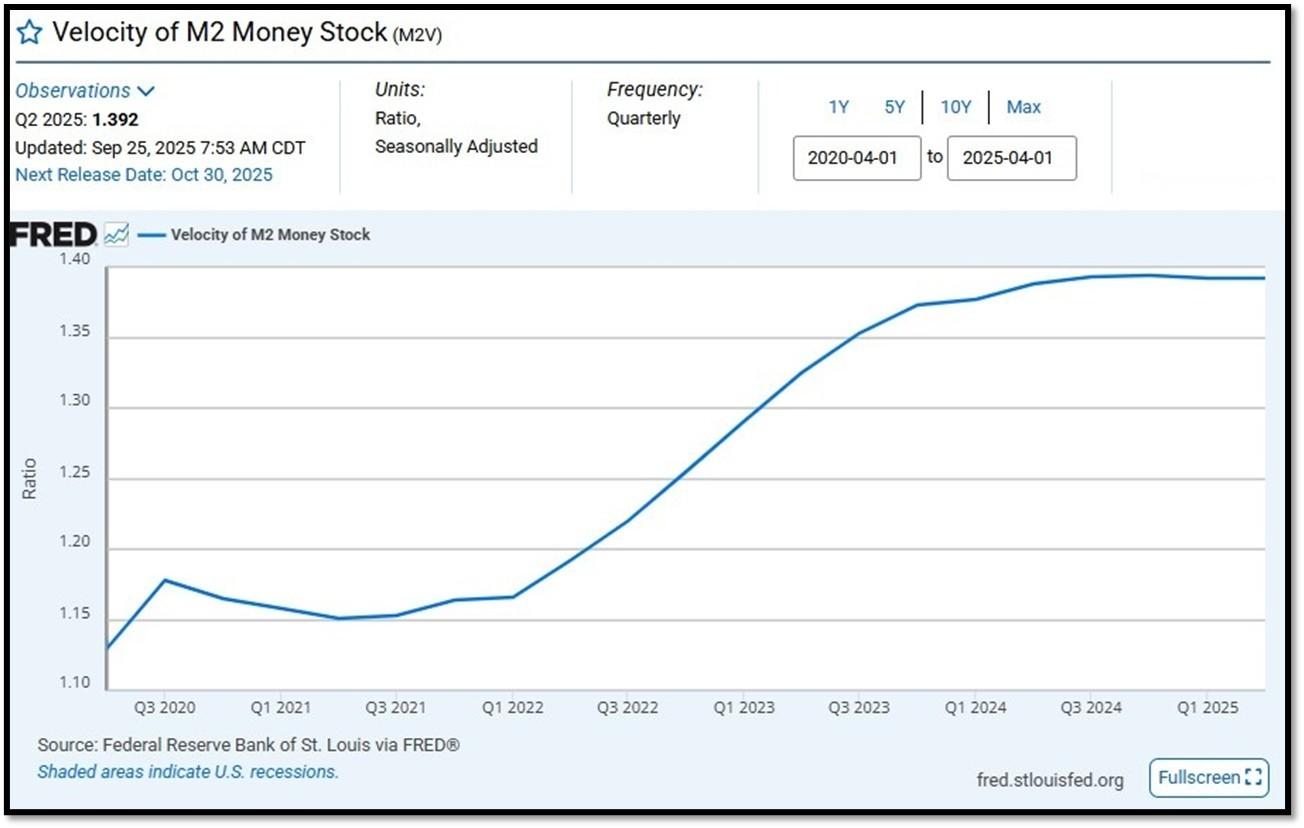
5J. Velocity of M2 Money Stock (M2V) with current read at 1.392 as of (Q2-2025 updated September 25, 2025). Previous quarter’s data was 1.386. The velocity of money is the frequency at which one unit of currency is used to purchase domestically- produced goods and services within a given time period. In other words, it is the number of times one dollar is spent to buy goods and services per unit of time. If the velocity of money is increasing, then more transactions are occurring between individuals in an economy. Current Money Stock (M2) report can be viewed in the reference link. REF: St.LouisFed-M2V
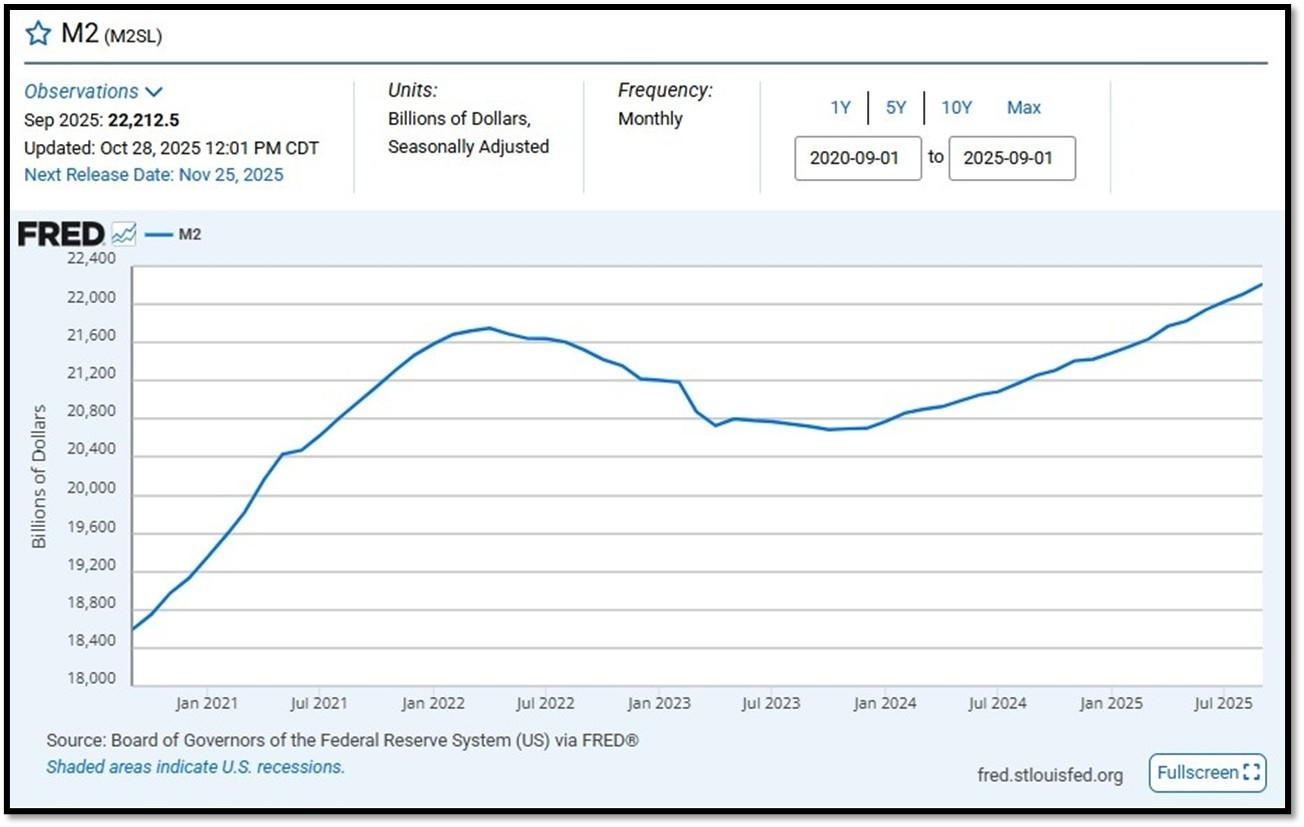
M2 consists of M1 plus (1) small-denomination time deposits (time deposits in amounts of less than $100,000) less IRA and Keogh balances at depository institutions; and (2) balances in retail MMFs less IRA and Keogh balances at MMFs. Seasonally adjusted M2 is constructed by summing savings deposits (before May 2020), small-denomination time deposits, and retail MMFs, each seasonally adjusted separately, and adding this result to seasonally adjusted M1. Board of Governors of the Federal Reserve System (US), M2 [M2SL], retrieved from FRED, Federal Reserve Bank of St. Louis; Updated on October 28, 2025. REF: St.LouisFed-M2
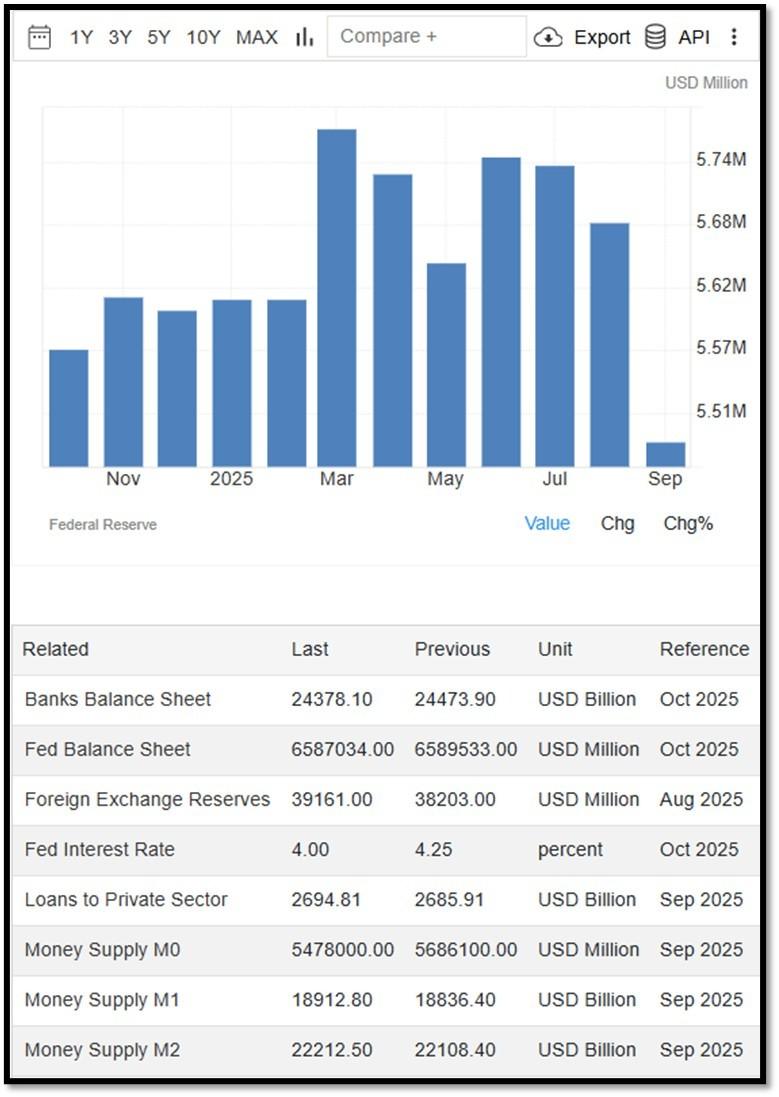
Money Supply M0 in the United States decreased to 5,478,000 USD Million in September from 5,686,100 USD Million in August of 2025. Money Supply M0 in the United States averaged 1,216,883.40 USD Million from 1959 until 2025, reaching an all time high of 6,413,100.00 USD Million in December of 2021 and a record low of 48,400.00 USD Million in February of 1961. REF: TradingEconomics, M0
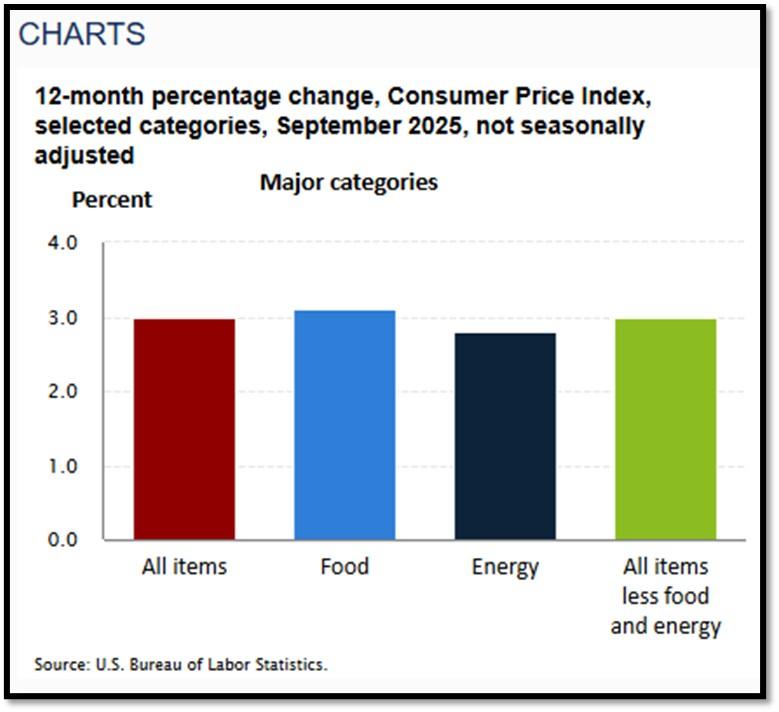
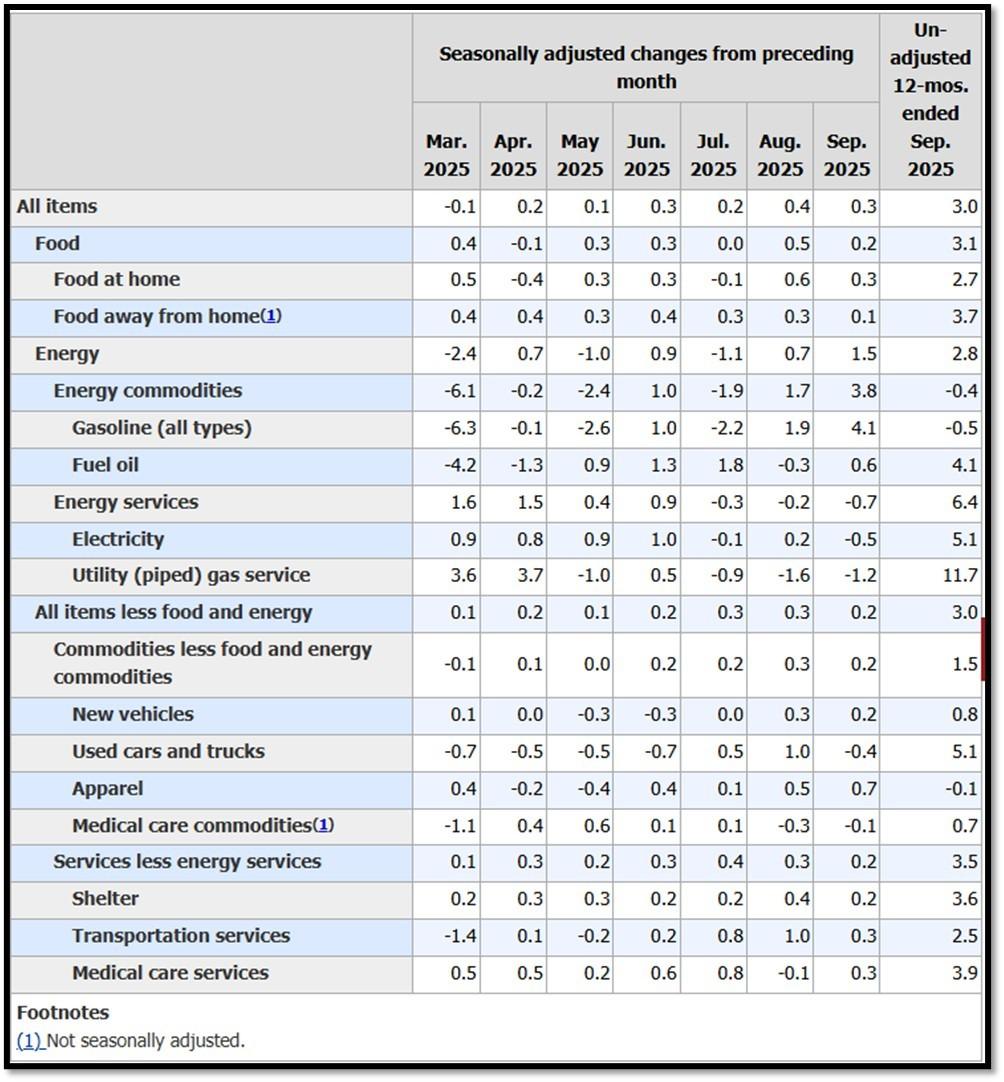
5K. In September, the Consumer Price Index for All Urban Consumers rose 0.3 percent, seasonally adjusted, and rose 3.0 percent over the last 12 months, not seasonally adjusted. The index for all items less food and energy increased 0.2 percent in September (SA); up 3.0 percent over the year (NSA). No announcement was made on October 2025’s CPI data. REF: BLS, BLS.GOV
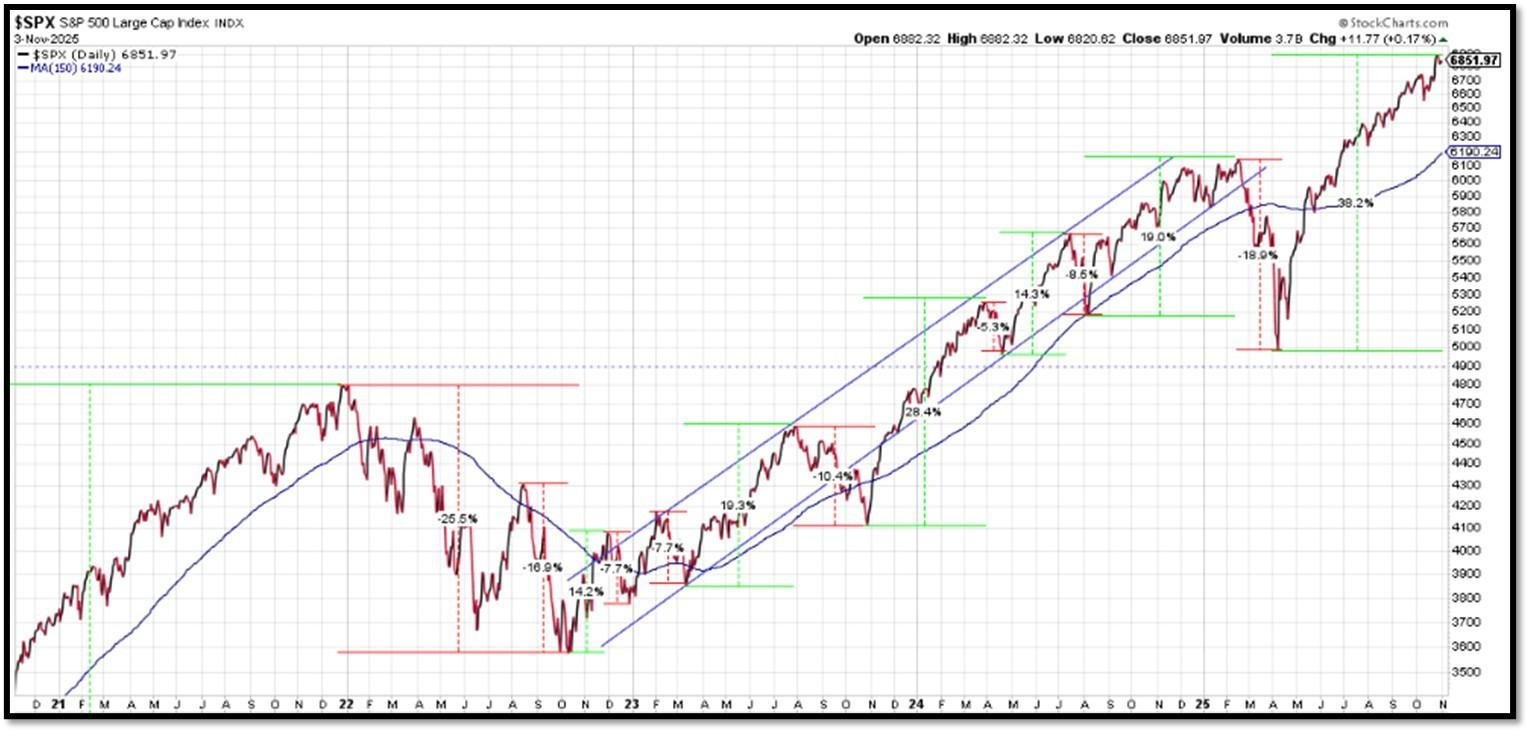
5L. Technical Analysis of the S&P500 Index. Click onto reference links below for images.
- Short-term Chart: Trend Bullish on 11/03/2025 – REF: Short-term S&P500 Chart by Marc Slavin (Click Here to Access Chart)
- Medium-term Chart: Trend Bullish on 11/03/2025 – REF: Medium-term S&P500 Chart by Marc Slavin (Click Here to Access Chart)
- Market Timing Indicators – S&P500 Index as of 11/03/2025 – REF: S&P500 Charts (7 of them) by Joanne Klein’s Top 7 (Click Here to Access Updated Charts)
- The S&P500 is hitting all-time-high, rebounding from a V-shaped recovery to all-time high. REF: Stockcharts
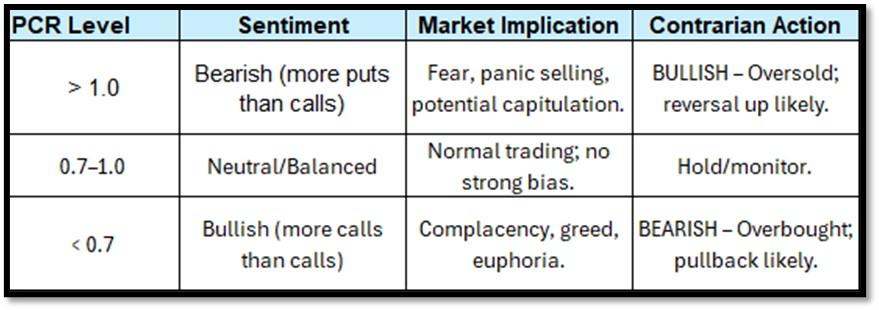
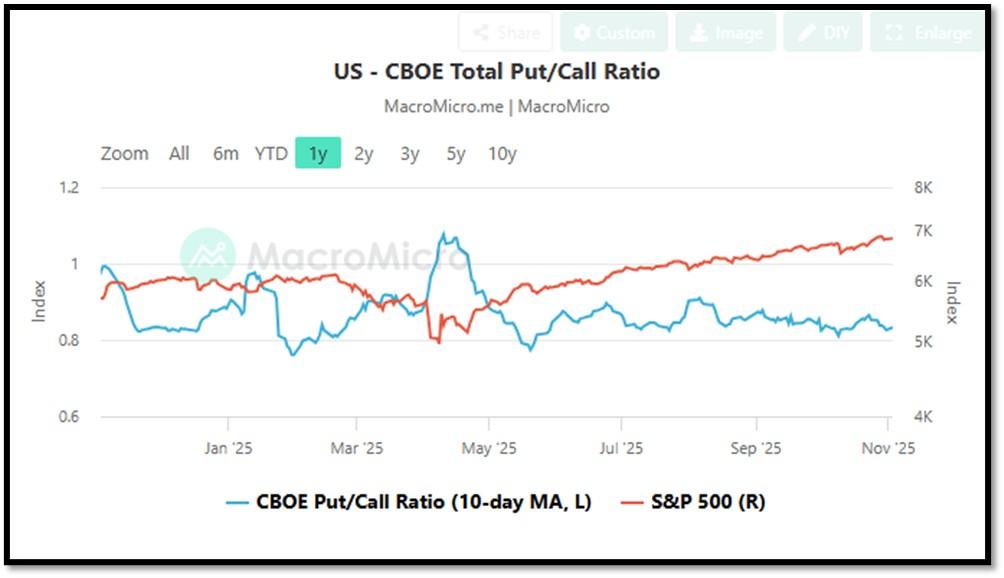
- CBOE Total Put/Call Ratio as of 11/3/2025. REF: MacroMicro
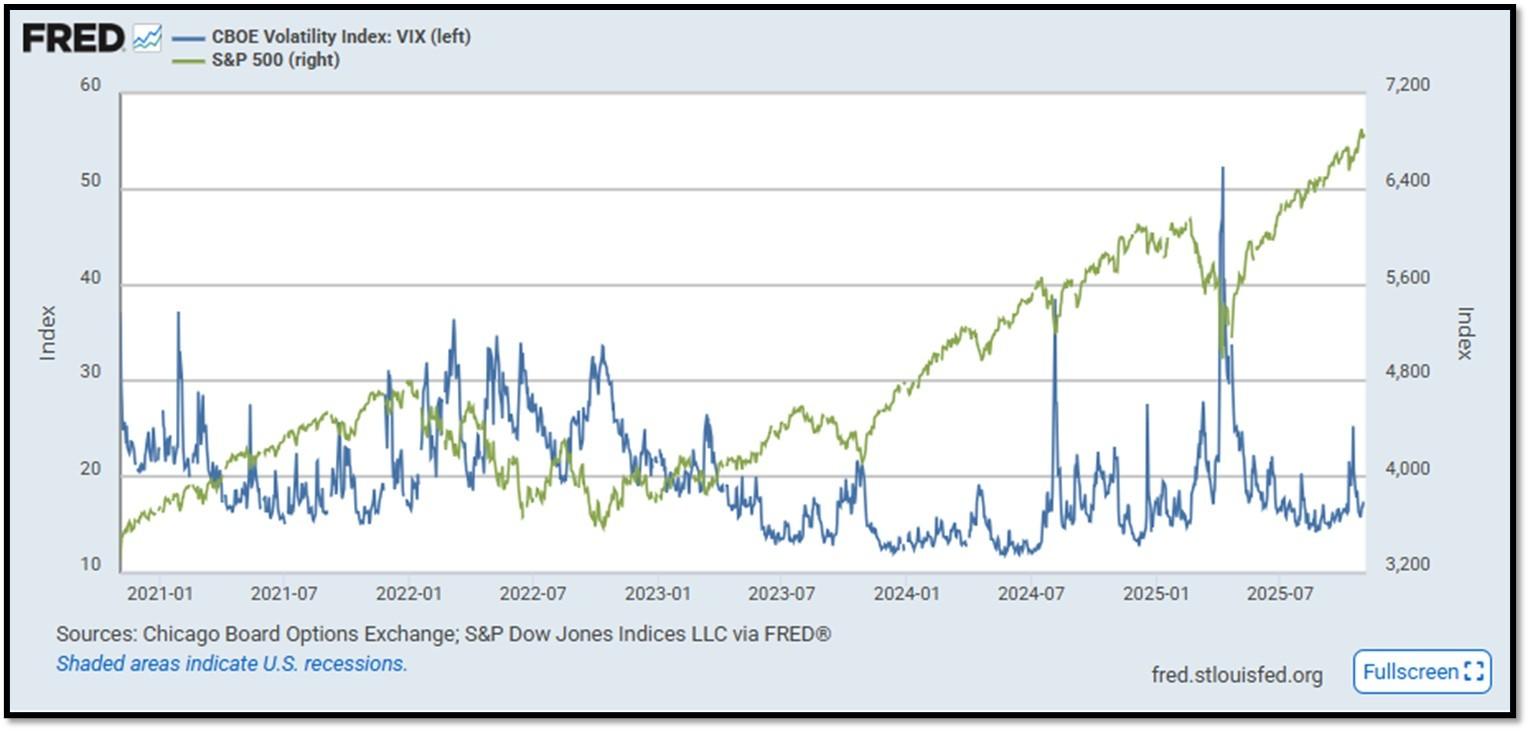
- S&P500 and CBOE Volatility Index (VIX) as of 11/3/2025. REF: FRED, Today’s Print
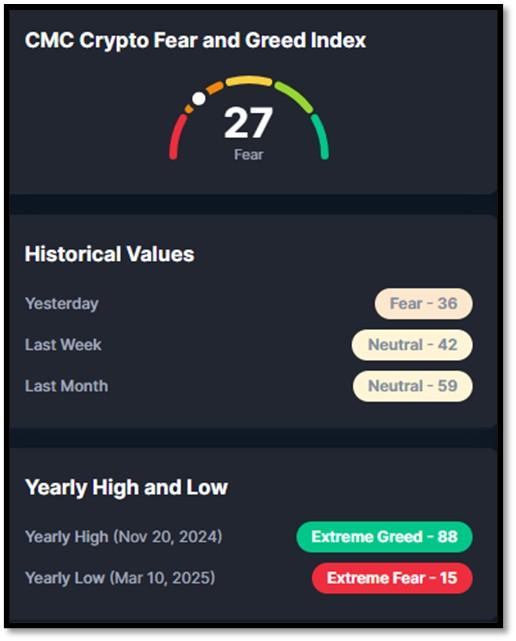
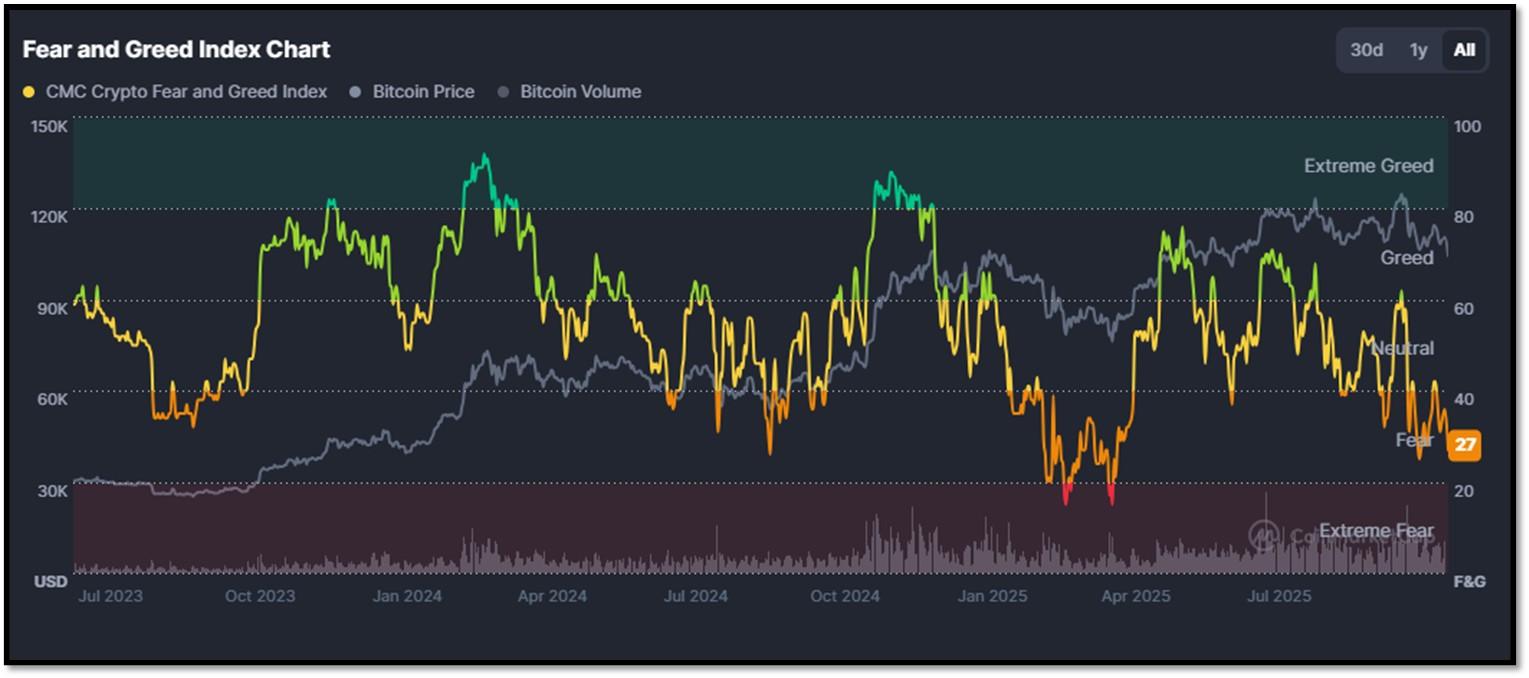
5M. Most recent read on the Crypto Fear & Greed Index with data as of 11/3/2025 is 27 (Fear). Last week’s data was 42 (Neutral) (1-100). Fear & Greed Index – A Contrarian Data. The crypto market behavior is very emotional. People tend to get greedy when the market is rising which results in FOMO (Fear of missing out). Also, people often sell their coins in irrational reaction of seeing red numbers. With the Crypto Fear and Greed Index, the data try to help save investors from their own emotional overreactions. There are two simple assumptions:
- Extreme fear can be a sign that investors are too worried. That could be a buying opportunity.
- When Investors are getting too greedy, that means the market is due for a correction.
Therefore, the program for this index analyzes the current sentiment of the Bitcoin market and crunch the numbers into a simple meter from 0 to 100. Zero means “Extreme Fear”, while 100 means “Extreme Greed”. REF: Coinmarketcap.com, Today’sReading
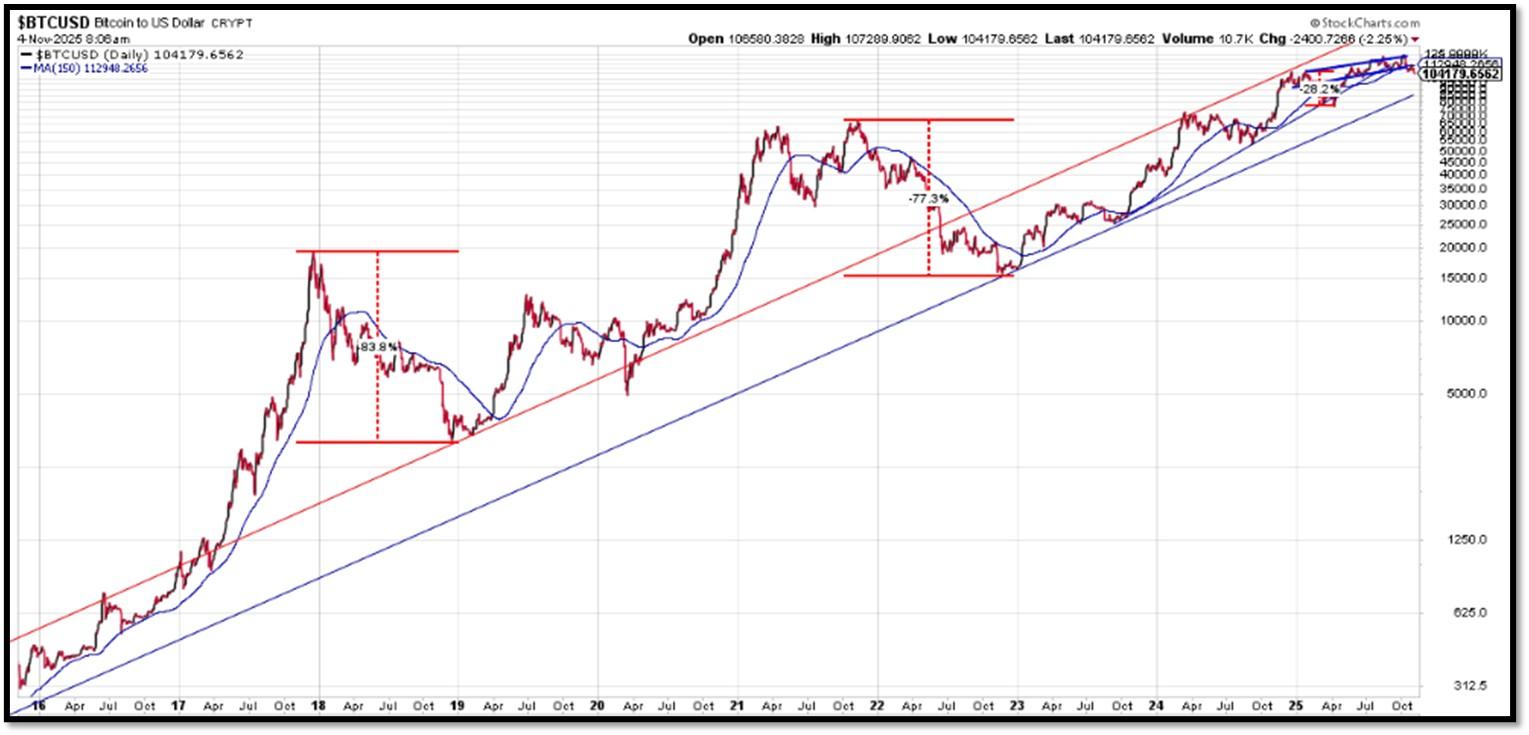
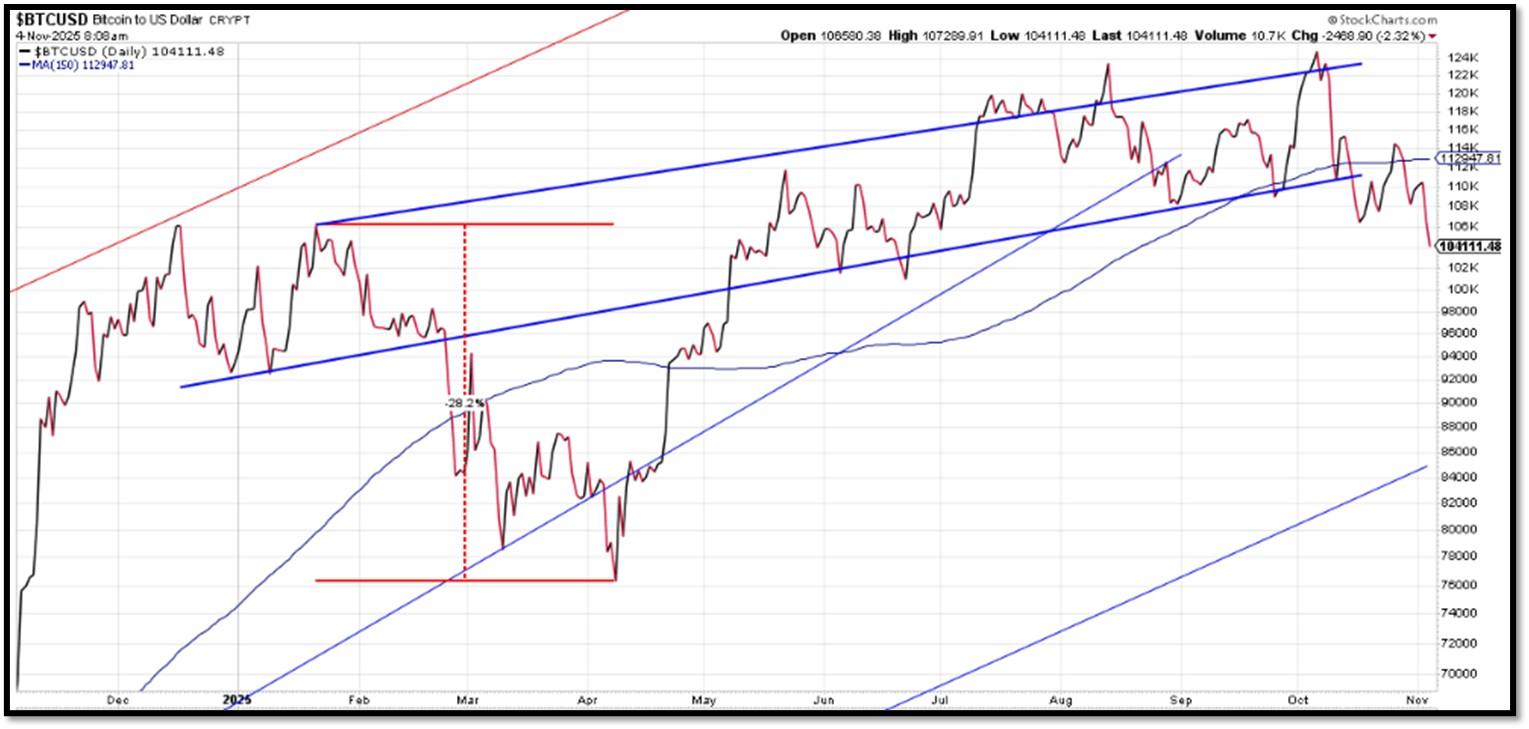
Bitcoin – 10-Year & 2-Year Charts. REF: Stockcharts10Y, Stockcharts2Y
From the desk of our Chief Investment Officer
As an investment professional with over twenty-six years of experience in the financial services industry, Andrew helps clients to protect, grow and transfer wealth during their lifetime with objective, unbiased, customized and efficient strategies.
Education, Professional Licenses Acquired & Affiliations
- Passed the Series 7, 63, 65 and 24 license examinations
- Currently holding Series 65 License
- BA in Economics – Boston University (Boston, MA) 1993
- Certificate in Commodities Trading – New York University (New York, NY) 1991
- Certificate in Financial Planning – New York University (New York, NY) April 2011
With extensive experience in the Financial Services Industry, Andrew Tang and Turner Financial Group provides disciplined wealth management with an intelligent caring approach to each and every client that compliments the Dedicated Financial offering.


Len writes much of his own content, and also shares helpful content from other trusted providers like Turner Financial Group (TFG).
The material contained herein is intended as a general market commentary, solely for informational purposes and is not intended to make an offer or solicitation for the sale or purchase of any securities. Such views are subject to change at any time without notice due to changes in market or economic conditions and may not necessarily come to pass. This information is not intended as a specific offer of investment services by Dedicated Financial and Turner Financial Group, Inc.
Dedicated Financial and Turner Financial Group, Inc., do not provide tax, legal or accounting advice. You should consult your own tax, legal and accounting advisors before engaging in any transaction.
Any hyperlinks in this document that connect to Web Sites maintained by third parties are provided for convenience only. Turner Financial Group, Inc. has not verified the accuracy of any information contained within the links and the provision of such links does not constitute a recommendation or endorsement of the company or the content by Dedicated Financial or Turner Financial Group, Inc. The prices/quotes/statistics referenced herein have been obtained from sources verified to be reliable for their accuracy or completeness and may be subject to change.
Past performance is no guarantee of future returns. Investing involves risk and possible loss of principal capital. The views and strategies described herein may not be suitable for all investors. To the extent referenced herein, real estate, hedge funds, and other private investments can present significant risks, including loss of the original amount invested. All indexes are unmanaged, and an individual cannot invest directly in an index. Index returns do not include fees or expenses.
Turner Financial Group, Inc. is an Investment Adviser registered with the United States Securities and Exchange Commission however, such registration does not imply a certain level of skill or training and no inference to the contrary should be made. Additional information about Turner Financial Group, Inc. is also available at www.adviserinfo.sec.gov. Advisory services are only offered to clients or prospective clients where Turner Financial Group, Inc. and its representatives are properly licensed or exempt from licensure. No advice may be rendered by Turner Financial Group, Inc. unless a client service agreement is in place.


