

- 1. A Week Defined by Labor Adjustments and Policy Shifts – This week’s headlines were dominated by Amazon’s announcement of extensive workforce reductions, echoing similar moves by other major corporations as automation and cost optimization accelerate across industries.
- 2. Main story this week focuses on 1X’s Home Robot that you can preorder now…
- 3. The US dollar is weakening against the Japanese yen due to shifting interest rate dynamics and the unwinding of the yen carry trade.
- 4. World Watch
- 4A. China is intensifying its investment in biotechnology and life sciences as part of a broader strategy to become the world’s dominant player in cutting edge science.
- 4B. The wave of layoffs seen across major corporations reflects widespread cost cutting tied to automation, artificial intelligence, and robotics that are changing how companies operate.
- 4C. An updated snapshot of the current global state of economy.
- 5. Quant & Technical Corner – A selection of quantitative & technical data we monitor on a regular basis to help gauge the overall financial market conditions and the investment environment.
1. A Week Defined by Labor Adjustments and Policy Shifts – This week’s headlines were dominated by Amazon’s announcement of extensive workforce reductions, echoing similar moves by other major corporations as automation and cost optimization accelerate across industries.
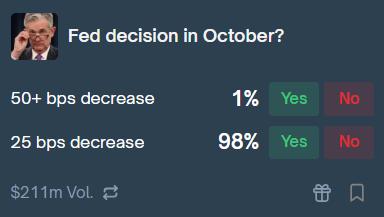
I address this in greater detail in item 4B below. On the policy front, investor attention remains focused on the upcoming FOMC meeting, where a 25-bps cut is now broadly anticipated. September CPI data reflected a mild but persistent increase, bringing the annual inflation rate to 3 percent and reinforcing expectations of a gradual disinflationary trend.
Consumer confidence fell to 94.6, undershooting consensus estimates, while spending behavior continues to reveal a distinctly K-shaped pattern. Higher-income households are sustaining demand through wealth gains and resilient wage growth, whereas lower-income consumers face increasing budget pressures from slower income growth and elevated living costs. Together, these dynamics underscore an uneven but ongoing recovery, shaped by productivity gains, policy recalibration, and shifting labor market fundamentals. REF: Briefing.com, Polymarket, EY Parthenon
2. Main story this week focuses on 1X’s Home Robot that you can preorder now…
According to the Wall Street Journal, the Neo home robot from 1X Technologies has opened for preorders at a price of around $20,000 or through a subscription model at $499 per month, with deliveries expected to begin in 2026. The humanoid robot stands roughly five feet six inches tall and is designed to perform everyday household chores such as loading the dishwasher, folding laundry, cleaning surfaces, and even fetching food or drinks from the refrigerator. Neo is powered by advanced artificial intelligence and equipped with cameras, sensors, and dexterous hands that allow it to navigate living spaces and handle delicate objects.
The company describes Neo as an early example of “physical AI,” combining software intelligence with robotic embodiment to assist people in their daily routines. However, the current version of Neo still requires partial human supervision through remote monitoring to ensure safety and task accuracy. Over time, 1X aims to transition Neo from a semi-autonomous helper to a fully independent household assistant capable of learning from its environment and adapting to user preferences. The project reflects a growing race among robotics firms to introduce functional humanoid robots into consumer homes, bridging the gap between industrial automation and personal companionship. Click onto picture below to access videos. REF: 1XTech, WSJ


3. The US dollar is weakening against the Japanese yen due to shifting interest rate dynamics and the unwinding of the yen carry trade.
The Bank of Japan raised its policy rate to 0.25 percent in July 2025, its first hike in seventeen years, while the Federal Reserve holds rates at 4.25 to 4.50 percent, with markets expecting two to three cuts in 2026. This shrinking yield gap has diminished the appeal of dollar assets, spurring yen repurchasing. At the same time, the carry trade, which borrowed low yielding yen to fund higher yielding US investments, is reversing rapidly. Over 1.2 trillion dollars in positions have unwound in recent weeks, driving sharp yen buying and pushing USD/JPY down eight percent in three weeks.
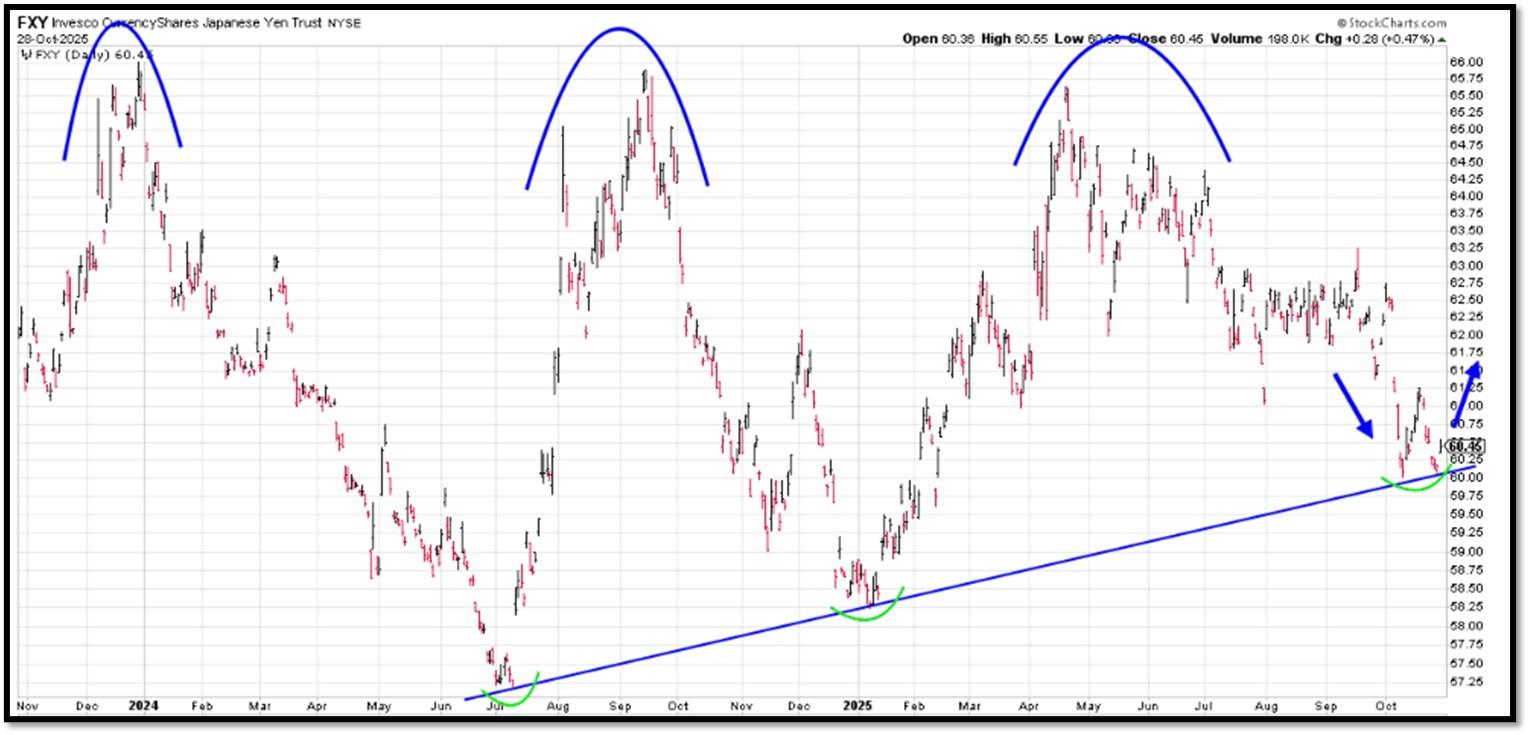
US economic softness and safe haven flows are amplifying the trend. Manufacturing is contracting with the ISM index at 48.5, job openings are at their lowest since 2021, and Q4 GDP is forecasted at 1.9 percent, below trend. These signals have increased odds of a Federal Reserve cut in December to eighty percent. Meanwhile, Middle East tensions and rising equity volatility have fueled yen demand as a safe haven. Technically, USD/JPY has broken below 148, triggering algorithmic selling and a short squeeze. As of October 29, 2025, USD/JPY sits at 146.80, down 1.8 percent today, underscoring the dollar’s persistent weakness against a strengthening yen. Below is a chart of FXY (FXY ↑ → Yen ↑ → USD/JPY ↓ → Dollar weaker vs. yen) REF: TradingEconomics
NOTE: Not investment advice or recommendations. Investors should carefully consider the investment objectives, risks, charges, and expenses before investing. For additional information about the securities mentioned above or in the videos, please visit the respective funds’ documents pages for the funds’ prospectus. Please read all materials carefully before investing.
FXY – Invesco CurrencyShares Japanese Yen Trust
With the current macro-economic backdrop, below are areas we currently favor:
- Fixed Income – (Corporates & Muni) High Yield as Opportunistic Allocation (Low-Beta)
- Fixed Income – Short-term Corporates & Muni (Low-Beta)
- Businesses that contribute to and benefit from AI & Automation (Market-Risk)
- Fintech & Financials (Market-Risk)
- Digital Asset – Bitcoin (Market-Risk/Hedge)
- Neo-Cloud Computing (Market-Risk)
- India & China-Tech (Market-Risk)
- Cyber-Security & Software (Market-Risk)
- Quantum Computing (Market-Risk)
4. World Watch
4A. China is intensifying its investment in biotechnology and life sciences as part of a broader strategy to become the world’s dominant player in cutting edge science.
According to Bloomberg, Chinese laboratories and research institutions have been conducting an unprecedented volume of animal testing to accelerate discoveries in areas such as gene editing, pharmaceuticals, and regenerative medicine. This aggressive approach has raised ethical questions internationally, but within China it is viewed as a necessary step to compete with Western innovation and to reduce reliance on foreign medical and biotech imports. The government has directed vast funding toward biotech infrastructure, data collection, and talent recruitment, aiming to secure a decisive lead in sectors that will shape the global economy of the future.
A separate study highlighted that China is rapidly closing the gap with the United States in overall scientific leadership, measured by research output, patents, and global influence. Chinese universities now produce more high impact scientific papers than many of their American counterparts, and government led initiatives have created a powerful ecosystem of public and private collaboration. The combination of state funding, relaxed regulations, and an expanding domestic market for medical technology is allowing China to move faster than most countries in converting research into commercial applications. While the United States remains the top innovator in advanced science, China’s momentum suggests it could soon rival or even surpass American dominance in key biotech and research fields. Click onto picture below to access video from WMIF. REF: Bloomberg, WMIF

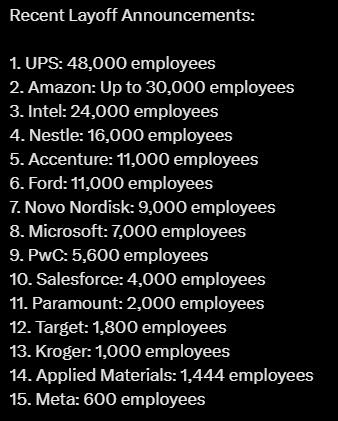
4B. The wave of layoffs seen across major corporations reflects widespread cost cutting tied to automation, artificial intelligence, and robotics that are changing how companies operate.
Many firms are reducing staff as business models shift toward leaner operations, greater use of digital processes, and fewer manual inputs. This reflects the same deflationary pressures on labor and costs that are visible across the economy as technology continues to improve productivity and reduce the need for large workforces.
At the same time, there is growing evidence that the unwinding of diversity, equity, and inclusion programs has contributed to some of the recent job cuts. Corporate DEI hiring reached its height during the 2020 to 2022 period, when many companies created new roles and departments focused on inclusion and social responsibility. As firms refocus on profitability and efficiency, many of these positions have been scaled back or eliminated. While automation and AI remain the main drivers of workforce reductions, the retreat from DEI initiatives has also added to the total layoffs, particularly in human resources and administrative functions. Click onto picture further below from CNBC on why so many Americans are clinging to their jobs. REF: TheKobeissiLetter, CNBC

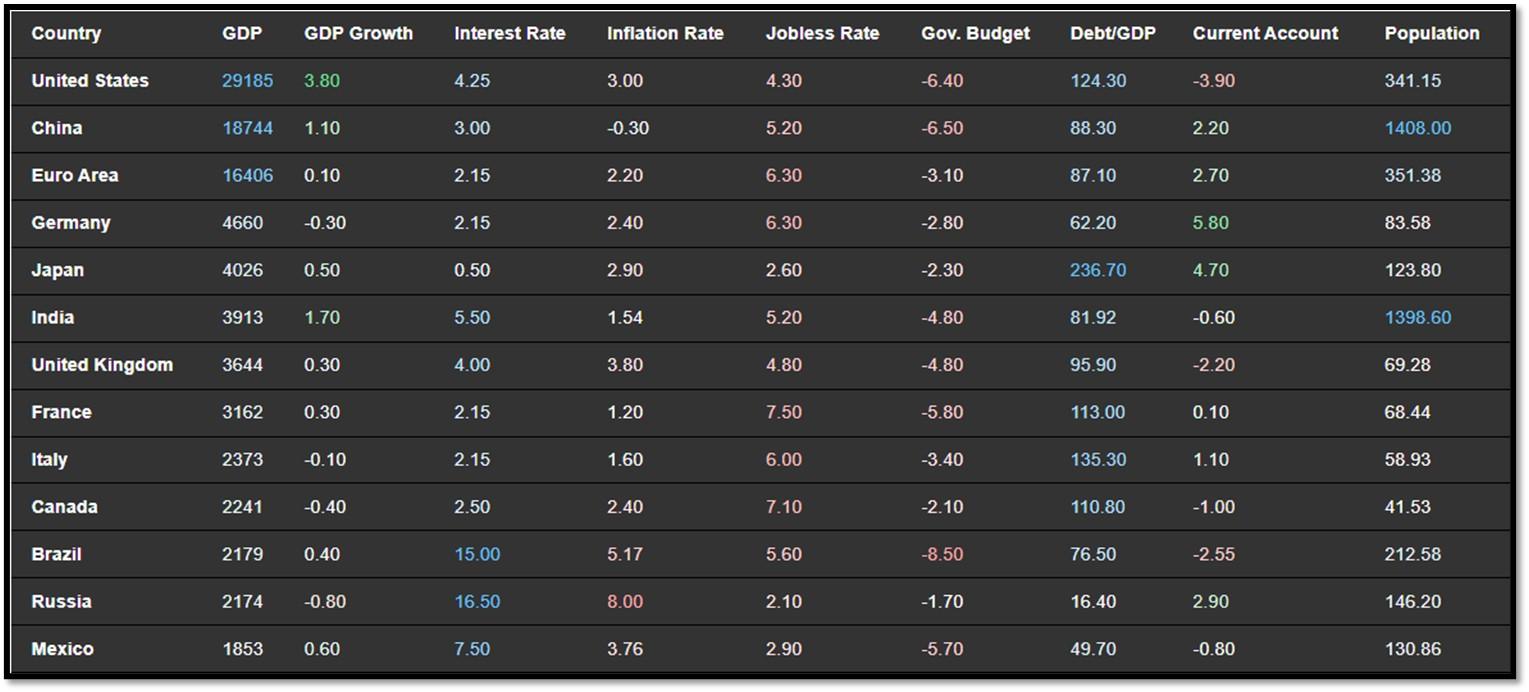
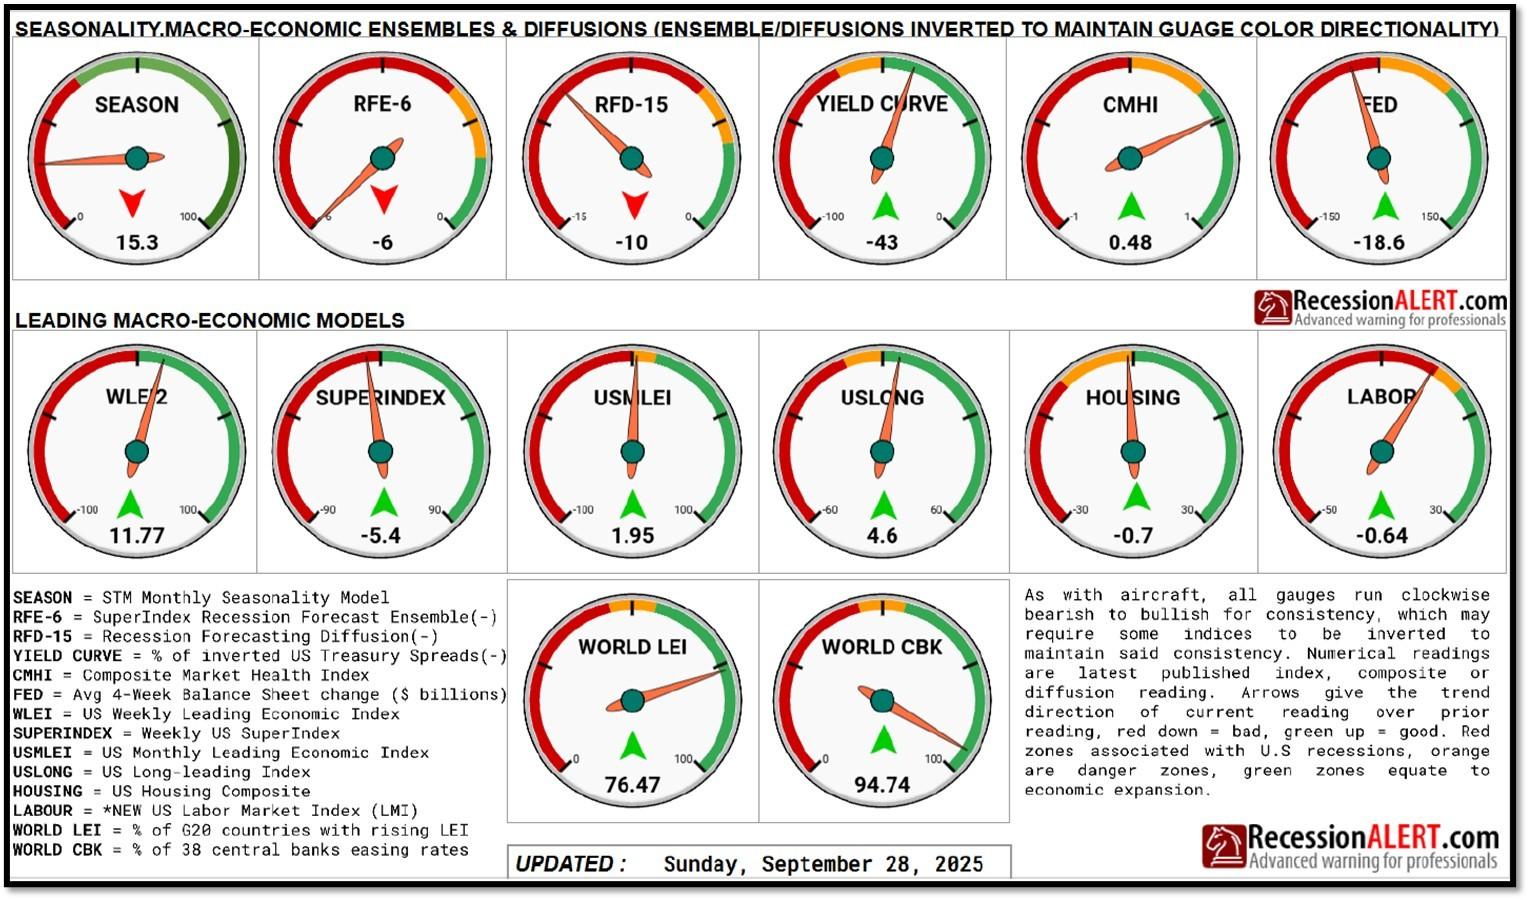
4C. An updated snapshot of the current global state of economy.
According to TradingEconomics as of 10/27/2025 (REF: TradingEconomics):
- The annual inflation rate in the US rose to 3% in September 2025, the highest since January, from 2.9% in August and below forecasts of 3.1%.
- Japan’s annual inflation rate rose to 2.9% in September 2025 from August’s 10-month low of 2.7%.
- The annual consumer price inflation in Italy stood at 1.6% in September 2025, unchanged from the previous month and confirming preliminary estimates.
- The Bank of Russia cut its benchmark interest rate by 50bps to 16.5% on October 24th, the 4th consecutive rate cut, and contrasting with market expectations of a hold.
5. Quant & Technical Corner – A selection of quantitative & technical data we monitor on a regular basis to help gauge the overall financial market conditions and the investment environment.
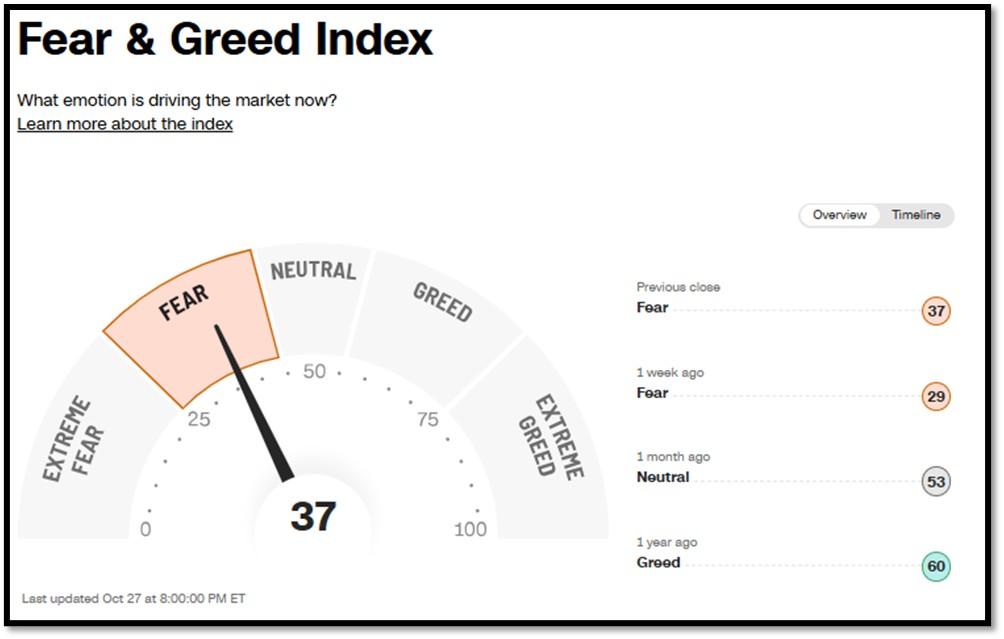
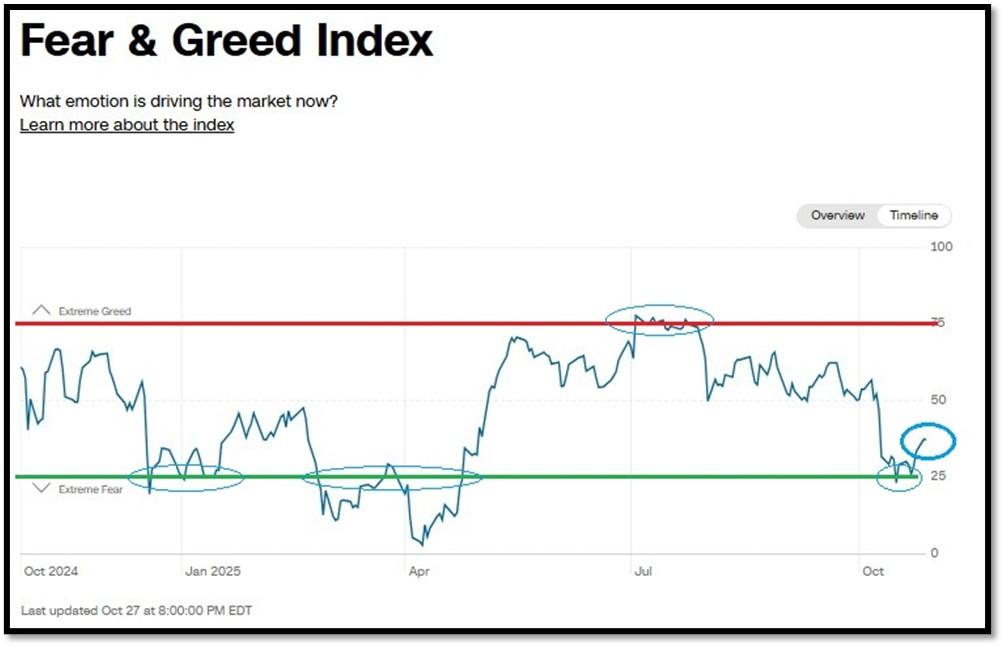
5A. Most recent read on the Fear & Greed Index with data as of 10/27/2025 – 8:00 PM-ET is 37 (Fear). Last week’s data was 29 (Fear) (1-100). CNNMoney’s Fear & Greed index looks at 7 indicators (Stock Price Momentum, Stock Price Strength, Stock Price Breadth, Put and Call Options, Junk Bond Demand, Market Volatility, and Safe Haven Demand). Keep in mind this is a contrarian indicator! REF: Fear&Greed via CNNMoney
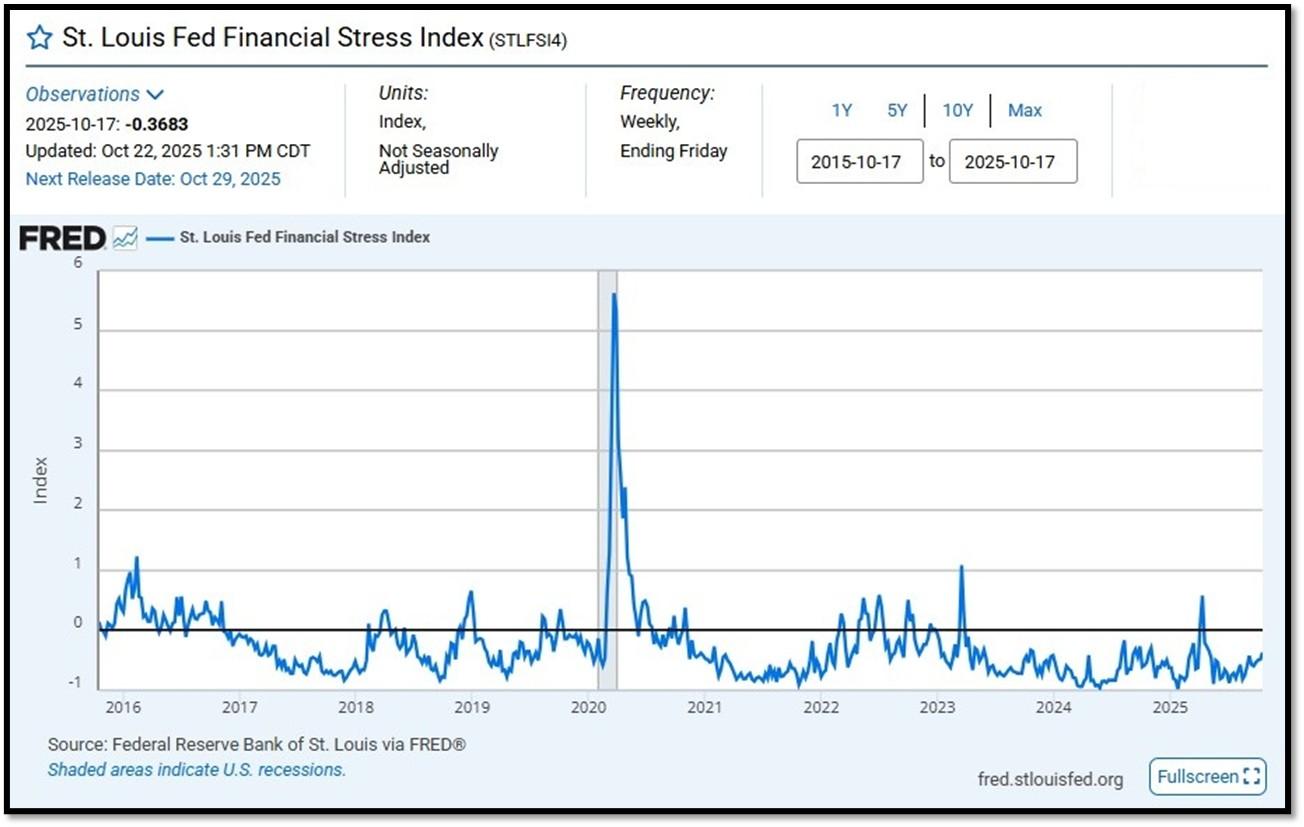
5B. St. Louis Fed Financial Stress Index’s (STLFSI4) most recent read is at –0.3683 as of October 22, 2025. Previous week’s data was -0.4834. A big spike up from previous readings reflecting the turmoil in the banking sector back in 2023. This weekly index is not seasonally adjusted. The STLFSI4 measures the degree of financial stress in the markets and is constructed from 18 weekly data series: seven interest rate series, six yield spreads and five other indicators. Each of these variables captures some aspect of financial stress. Accordingly, as the level of financial stress in the economy changes, the data series are likely to move together. REF: St. Louis Fed
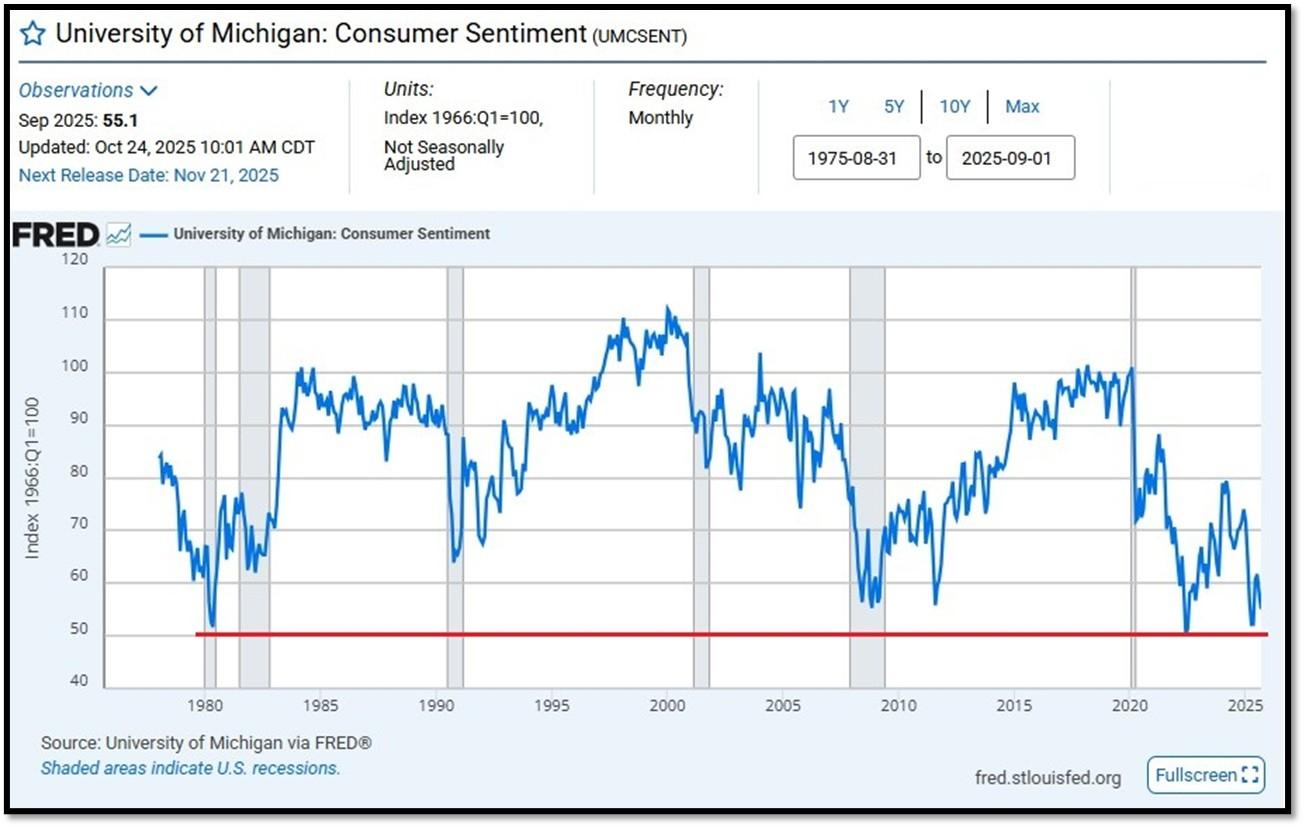
5C. University of Michigan, University of Michigan: Consumer Sentiment [UMCSEMT] for September at 55.1, retrieved from FRED, Federal Reserve Bank of St. Louis, October 24, 2025. Back in June 2022, Consumer Sentiment hit a low point going back to April 1980. REF: UofM
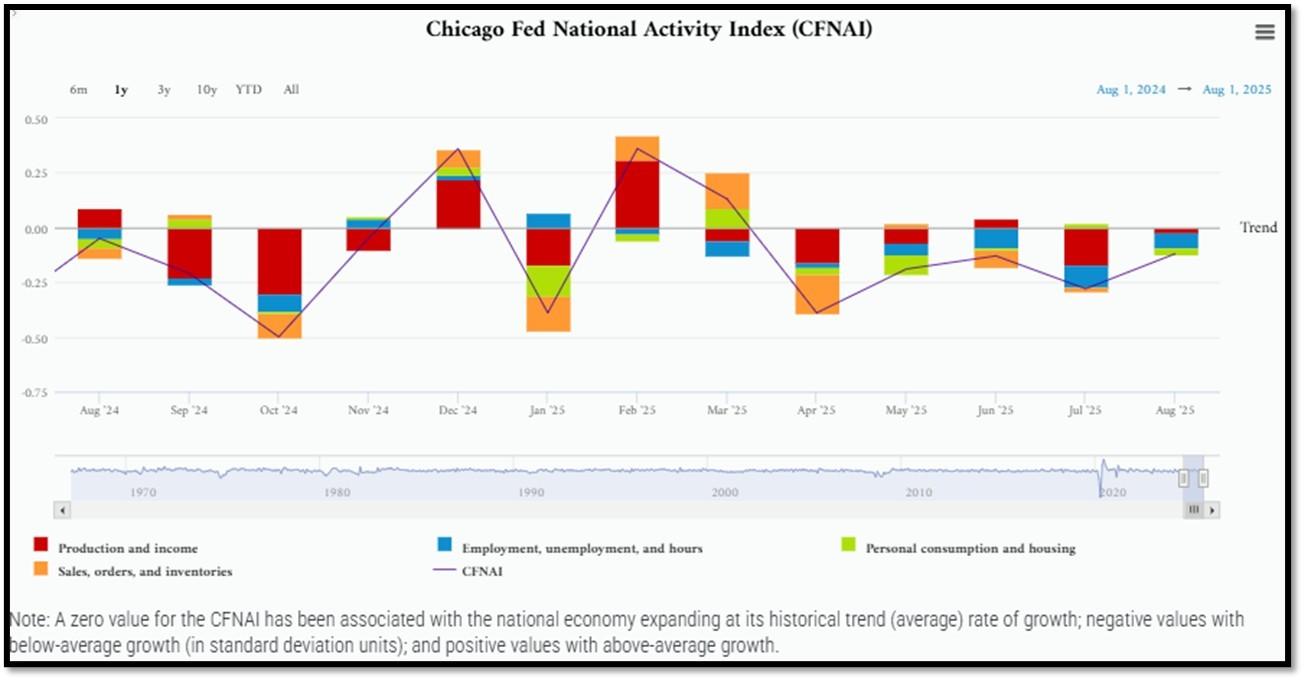
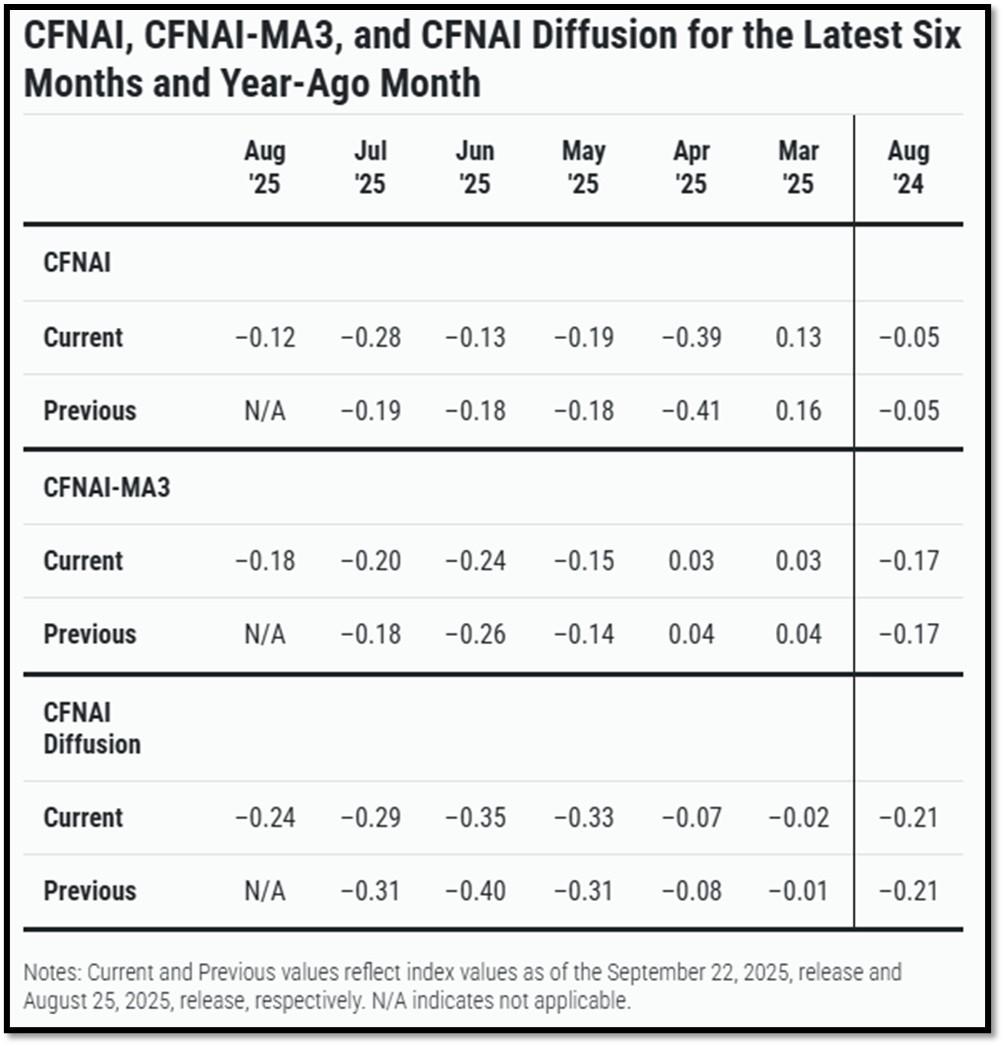
5D. The Chicago Fed National Activity Index (CFNAI) increased to –0.12 in August from –0.28 in July. Three of the four broad categories of indicators used to construct the index increased from July, but three categories made negative contributions in August. The index’s three-month moving average, CFNAI-MA3, increased to –0.18 in August from –0.20 in July. REF: ChicagoFed, August’s Report
5E. (9/18/2025) The Conference Board Leading Economic Index (LEI) for the US declined by 0.5% in August 2025 to 98.4 (2016=100), after a small 0.1% increase in July (upwardly revised from an originally reported 0.1% decline). The LEI fell by 2.8% over the six months between February and August 2025, a faster rate of decline than its 0.9% contraction over the previous six-month period (August 2024 to February 2025). The composite economic indexes are the key elements in an analytic system designed to signal peaks and troughs in the business cycle. The indexes are constructed to summarize and reveal common turning points in the economy in a clearer and more convincing manner than any individual component. The CEI is highly correlated with real GDP. The LEI is a predictive variable that anticipates (or “leads”) turning points in the business cycle by around 7 months. Shaded areas denote recession periods or economic contractions. The dates above the shaded areas show the chronology of peaks and troughs in the business cycle. The ten components of The Conference Board Leading Economic Index® for the U.S. include: Average weekly hours in manufacturing; Average weekly initial claims for unemployment insurance; Manufacturers’ new orders for consumer goods and materials; ISM® Index of New Orders; Manufacturers’ new orders for nondefense capital goods excluding aircraft orders; Building permits for new private housing units; S&P 500® Index of Stock Prices; Leading Credit Index™; Interest rate spread (10-year Treasury bonds less federal funds rate); Average consumer expectations for business conditions. REF: ConferenceBoard, LEI Report for August (ReceesionAlert) (Released on 9/30/2025)
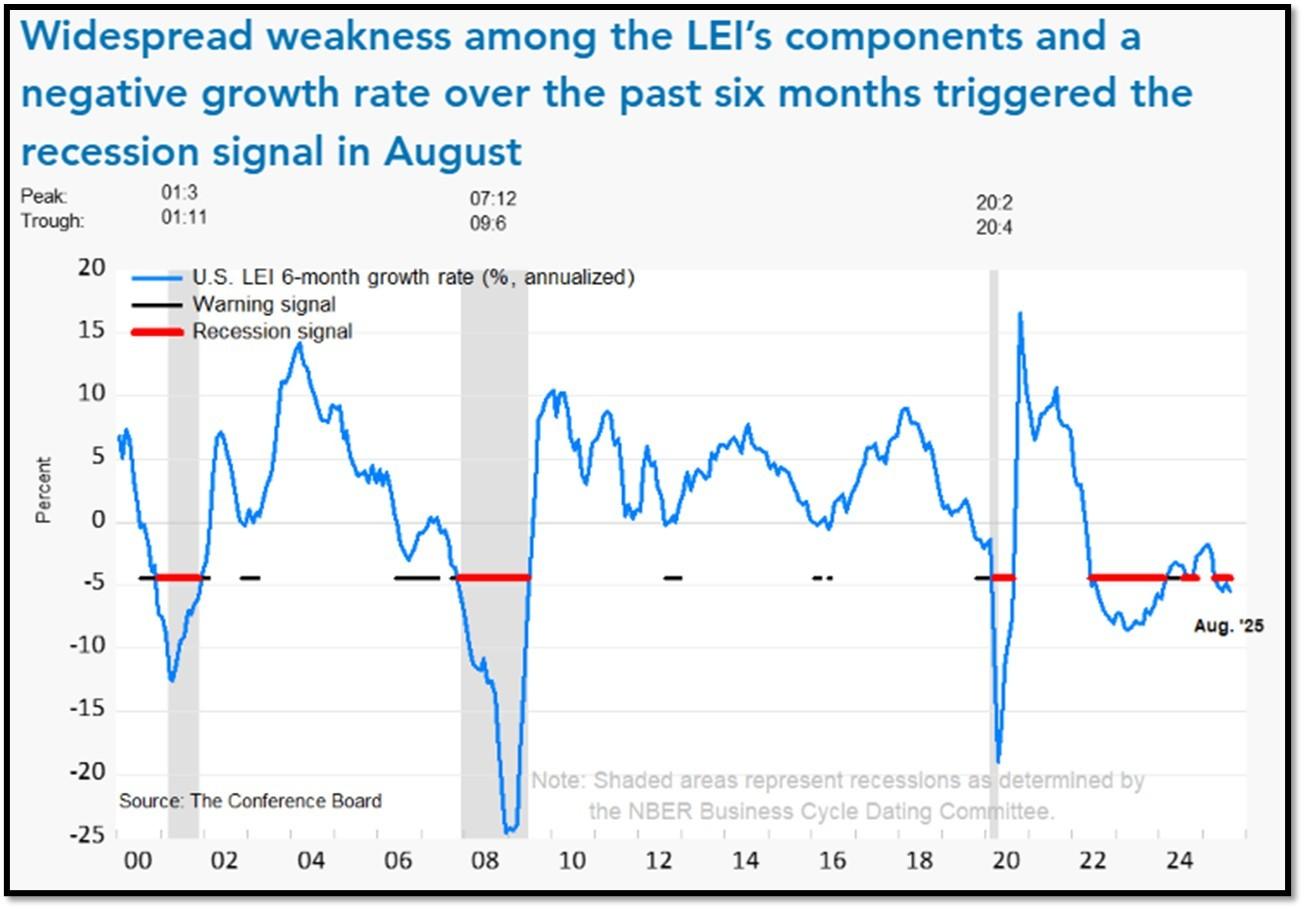
We have experienced a “rolling recession” since June 2022 and are only now emerging from it. However, authorities are not labeling it a recession due to high employment data from June 2022-2025.
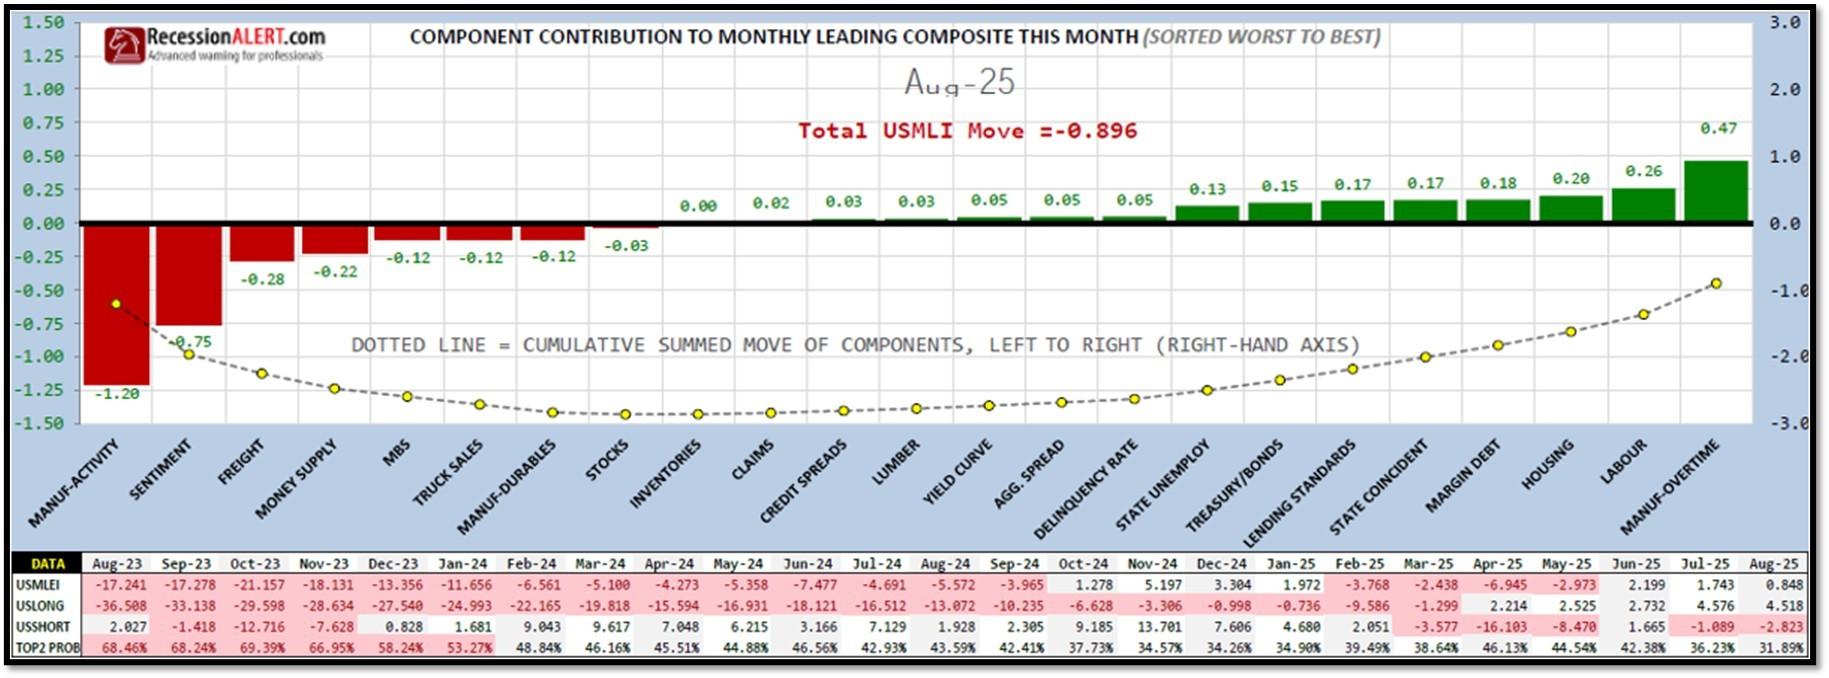
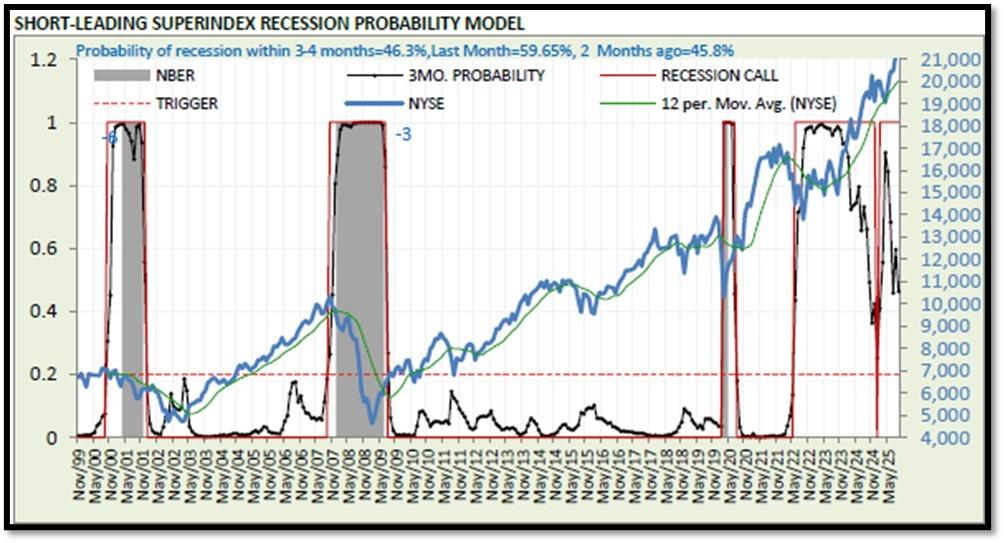
5F. Probability of U.S. falling into Recession within 3 to 4 months is currently at 46.3% (with data as of 09/28/2025 – Next Report 10/12/2025) according to RecessionAlert Research. Last release’s data was at 59.51%. This report is updated every two weeks. REF: RecessionAlertResearch
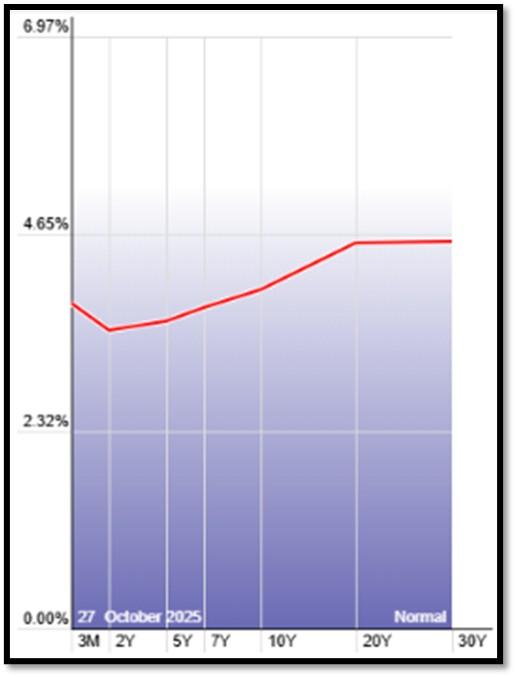
5G. Yield Curve as of 10/27/2025 is showing Normal. Spread on the 10-yr Treasury Yield (3.98%) minus yield on the 2-yr Treasury Yield (3.48%) is currently at 50bps as of 10/27/25. REF: Stockcharts The yield curve—specifically, the spread between the interest rates on the ten-year Treasury note and the three-month Treasury bill—is a valuable forecasting tool. It is simple to use and significantly outperforms other financial and macroeconomic indicators in predicting recessions two to six quarters ahead. REF: NYFED
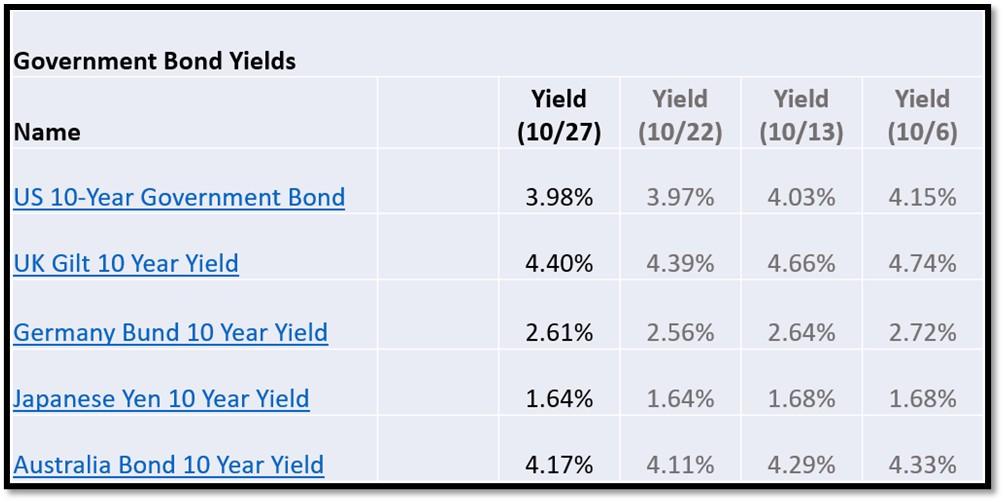
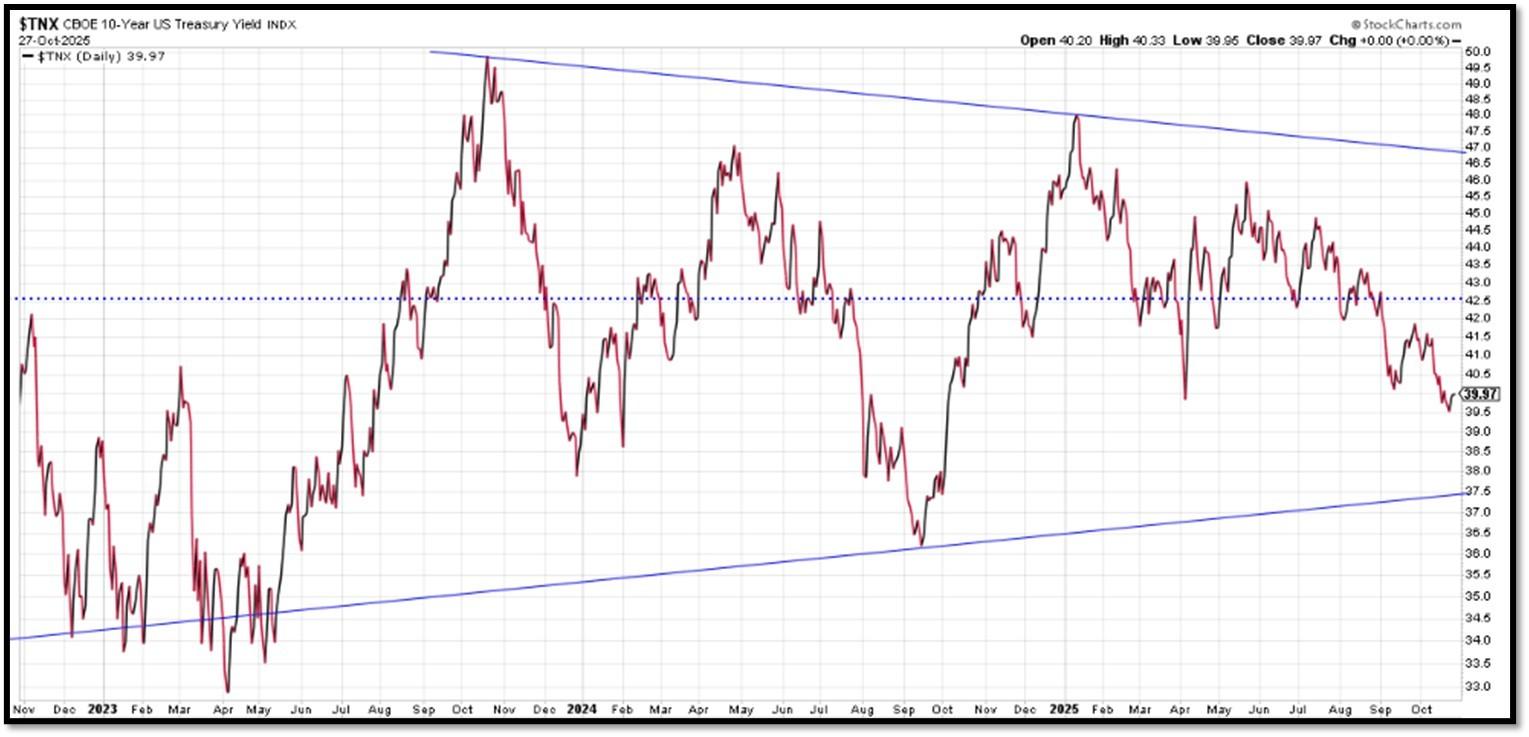
5H. Recent Yields in 10-Year Government Bonds. REF: Source is from Bloomberg.com, dated 10/27/2025, rates shown below are as of 10/27/2025, subject to change.
The 10-Year US Treasury Yield… The 10-Year Yield is indirectly related to inflation and prospect of the economy. I expect the 10-Year Yield to drop towards the support line. REF: StockCharts1
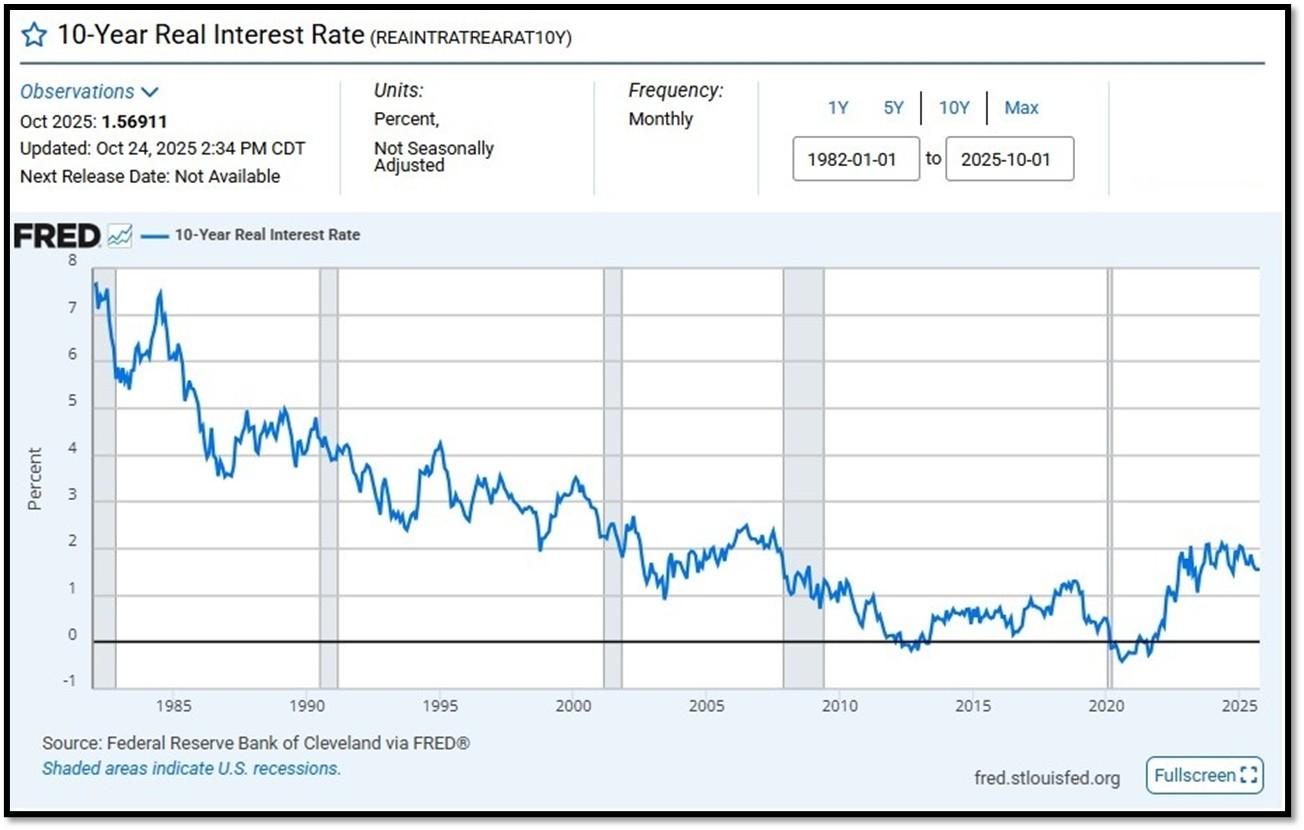
10-Year Real Interest Rate at 1.56911% as of 10/24/25. Last month’s data was 1.56046%. REF: REAINTRATREARAT10Y
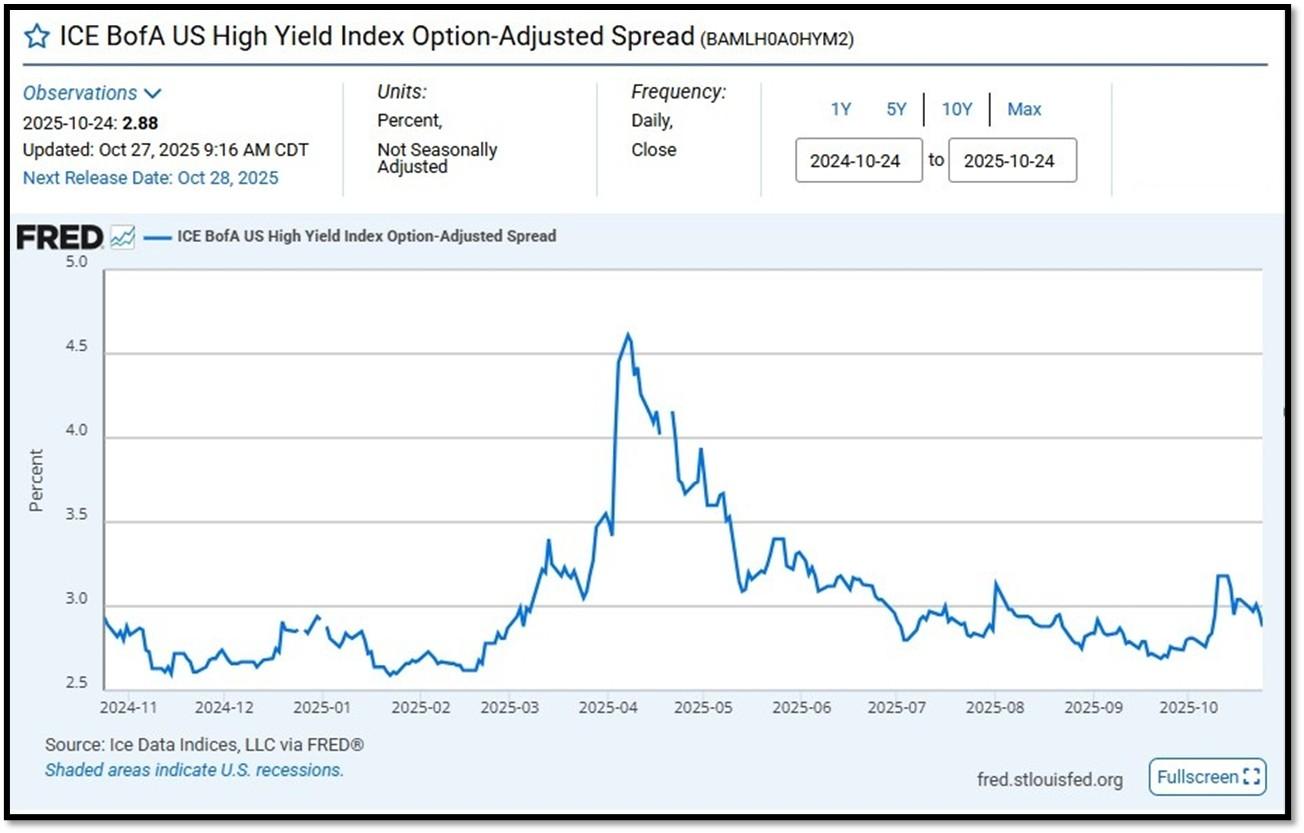
ICE BofA US High Yield Index Option-Adjusted Spread (BAMLH0A0HYM2) currently at 2.88 as of October 27, 2025. This is a key indicator of market sentiment, particularly regarding risk and economic health. At its core, the spread reflects the extra return investors demand to hold riskier corporate debt over safer government securities. High-yield bonds are issued by companies with lower credit ratings (below investment grade, like BB or lower), meaning they carry a higher chance of default. The spread compensates for this risk. When the spread is narrow—say, around 2.5% to 3%, as seen recently—it suggests investors are confident, willing to accept less extra yield because they perceive lower default risk or a strong economy. Narrow spreads often align with bullish markets, where cash is flowing, growth is steady, and fear is low. REF: FRED-BAMLH0A0HYM2
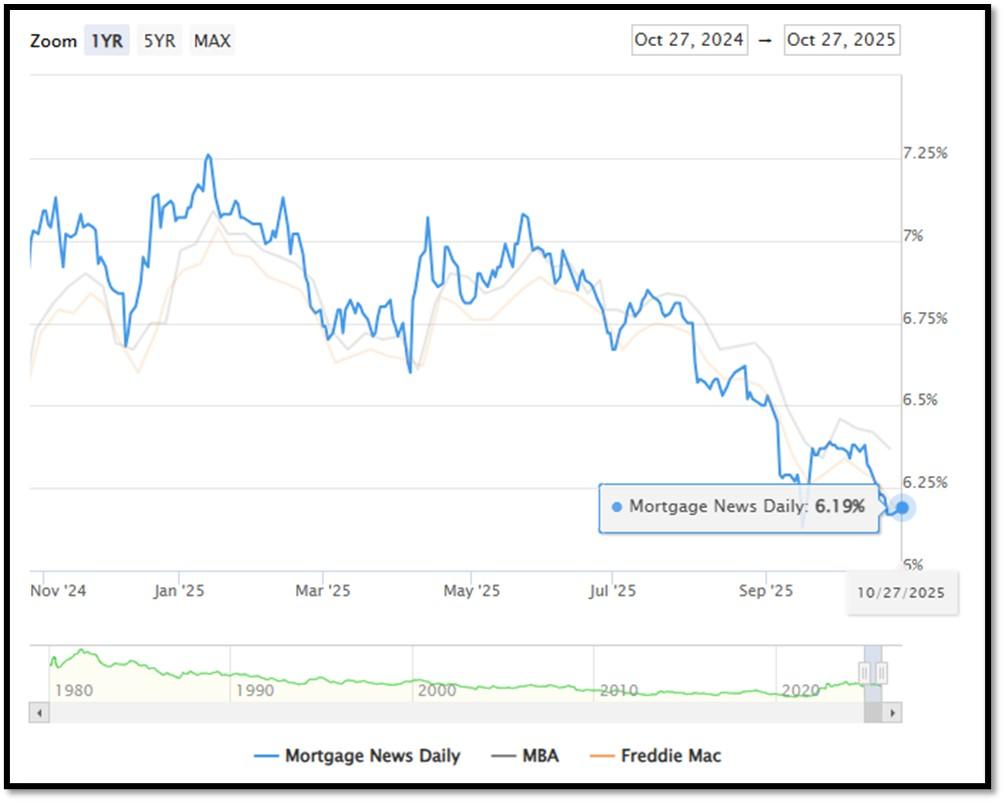
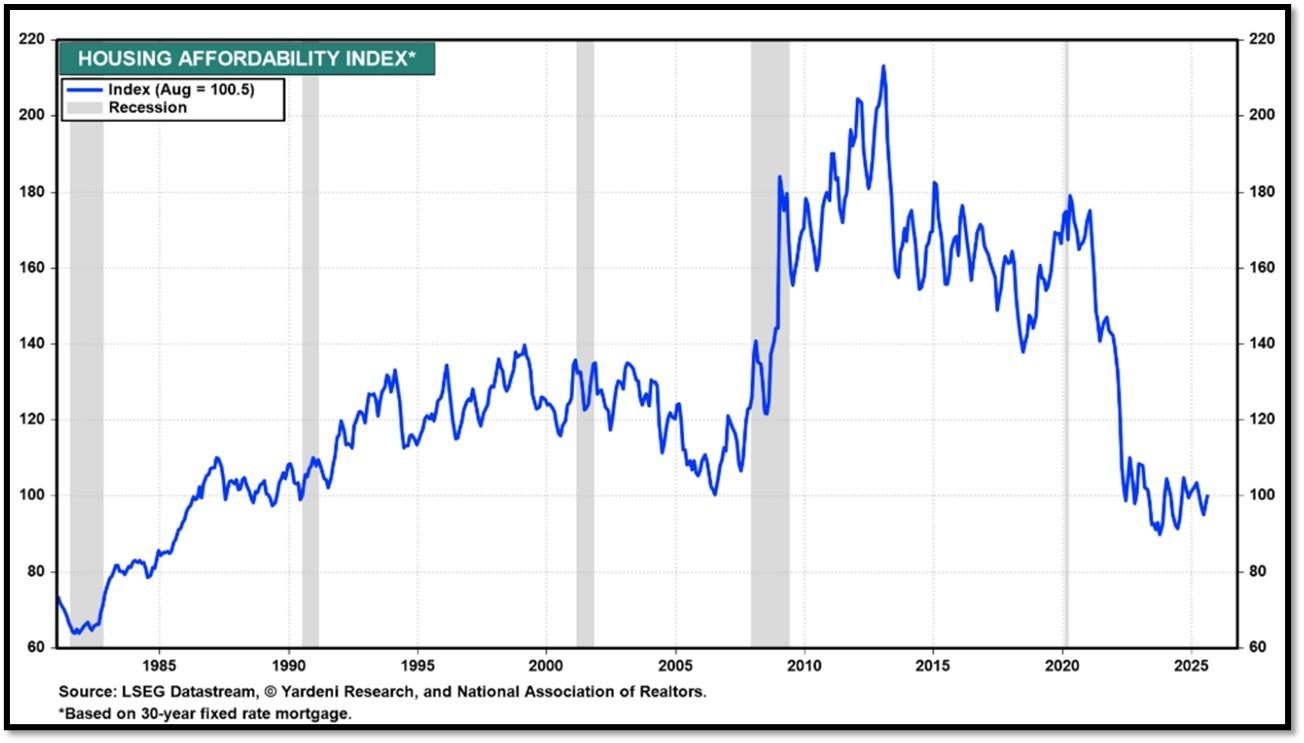
5I. (10/27/2025) Today’s National Average 30-Year Fixed Mortgage Rate is 6.19% (All Time High was 8.03% on 10/19/23). Last week’s data was 6.17%. This rate is the average 30-year fixed mortgage rates from several different surveys including Mortgage News Daily (daily index), Freddie Mac (weekly survey), Mortgage Bankers Association (weekly survey) and FHFA (monthly survey). REF: MortgageNewsDaily, Today’s Average Rate
The recent spike in the 30-year fixed-rate jumbo mortgage to 6.19%, compared to Freddie Mac’s rate at 6.19% and the Mortgage Bankers Association (MBA) rate at 6.37%, highlights key differences in the mortgage market. Jumbo mortgages, which exceed the conforming loan limits set by government agencies like Freddie Mac, typically carry higher interest rates because they are riskier for lenders. These loans are not backed by government entities, which increases the risk for lenders and, consequently, leads to higher rates. In contrast, Freddie Mac and MBA provide averages for conforming loans, which meet federal guidelines and have lower risk due to government backing, keeping their rates lower.
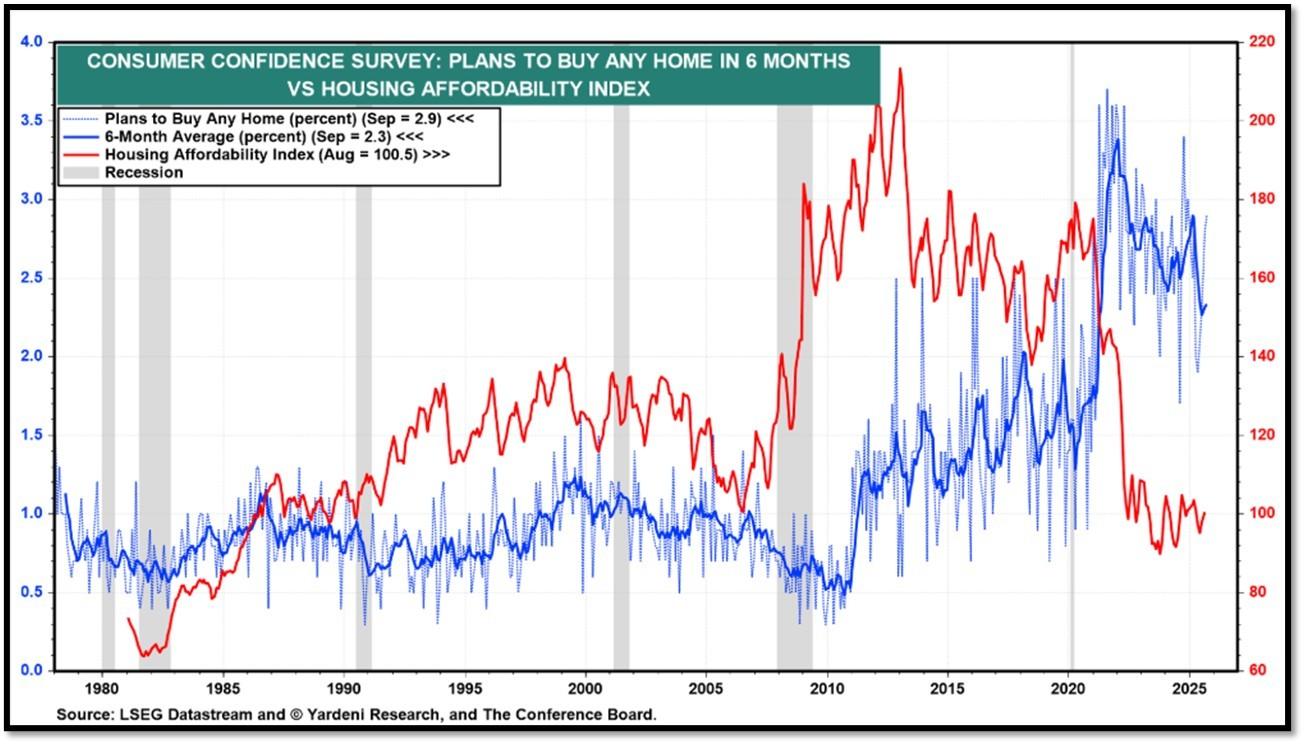
Housing Affordability Index for Aug = 100.5 // July = 98.8 // Jun = 94.4 // May = 97.2 // Apr = 101.0 // Mar = 103.2 // Feb = 102.2. Data provided by Yardeni Research. REF: Yardeni
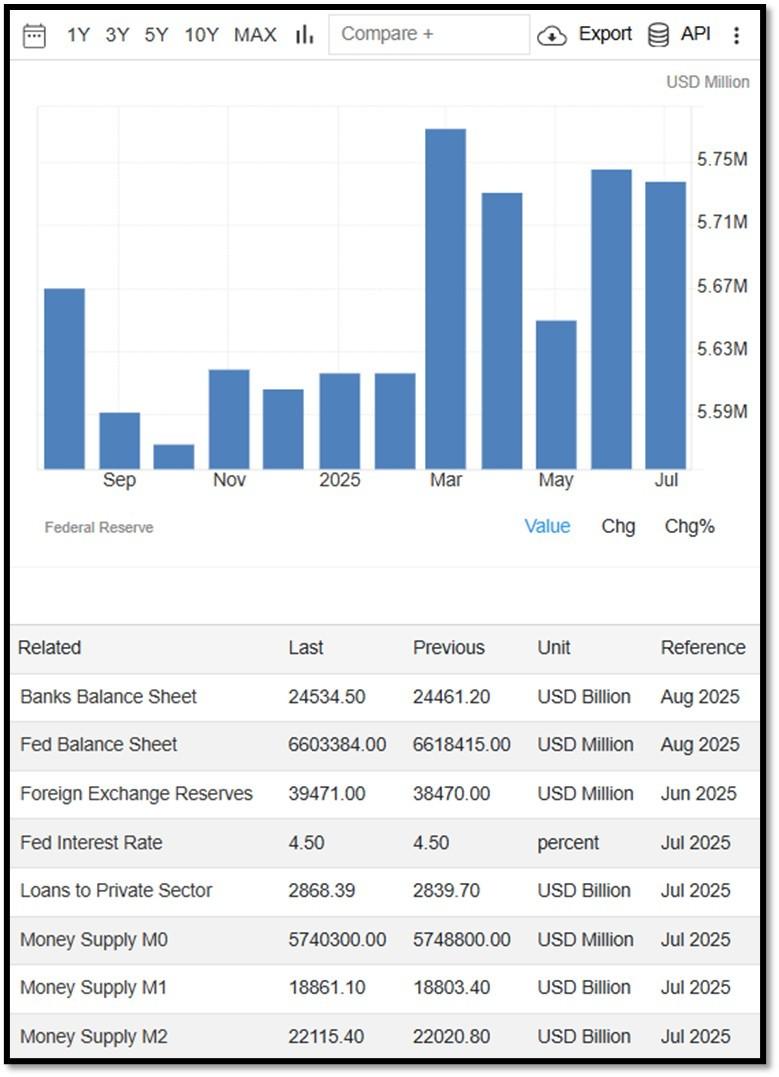
5J. Velocity of M2 Money Stock (M2V) with current read at 1.392 as of (Q2-2025 updated September 25, 2025). Previous quarter’s data was 1.386. The velocity of money is the frequency at which one unit of currency is used to purchase domestically- produced goods and services within a given time period. In other words, it is the number of times one dollar is spent to buy goods and services per unit of time. If the velocity of money is increasing, then more transactions are occurring between individuals in an economy. Current Money Stock (M2) report can be viewed in the reference link. REF: St.LouisFed-M2V
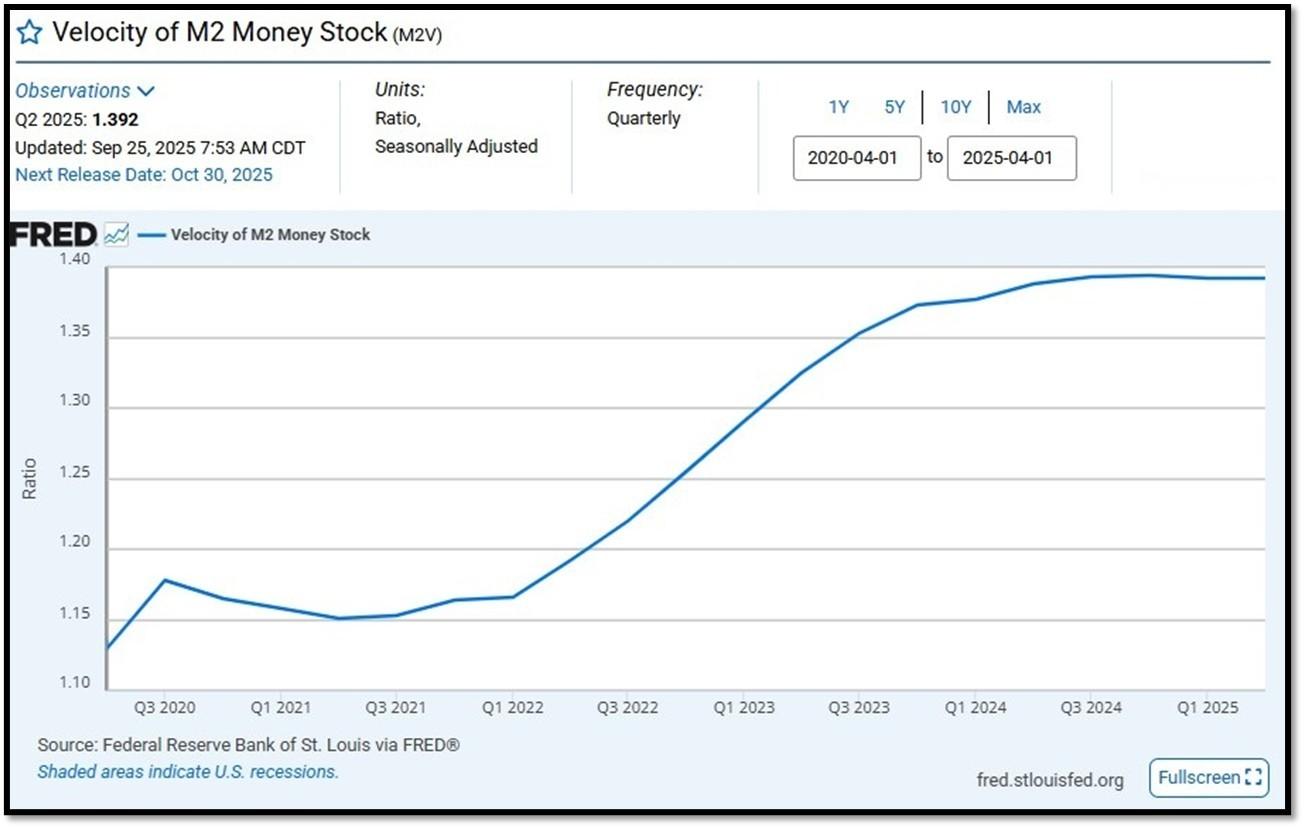
M2 consists of M1 plus (1) small-denomination time deposits (time deposits in amounts of less than $100,000) less IRA and Keogh balances at depository institutions; and (2) balances in retail MMFs less IRA and Keogh balances at MMFs. Seasonally adjusted M2 is constructed by summing savings deposits (before May 2020), small-denomination time deposits, and retail MMFs, each seasonally adjusted separately, and adding this result to seasonally adjusted M1. Board of Governors of the Federal Reserve System (US), M2 [M2SL], retrieved from FRED, Federal Reserve Bank of St. Louis; Updated on September 23, 2025. REF: St.LouisFed-M2
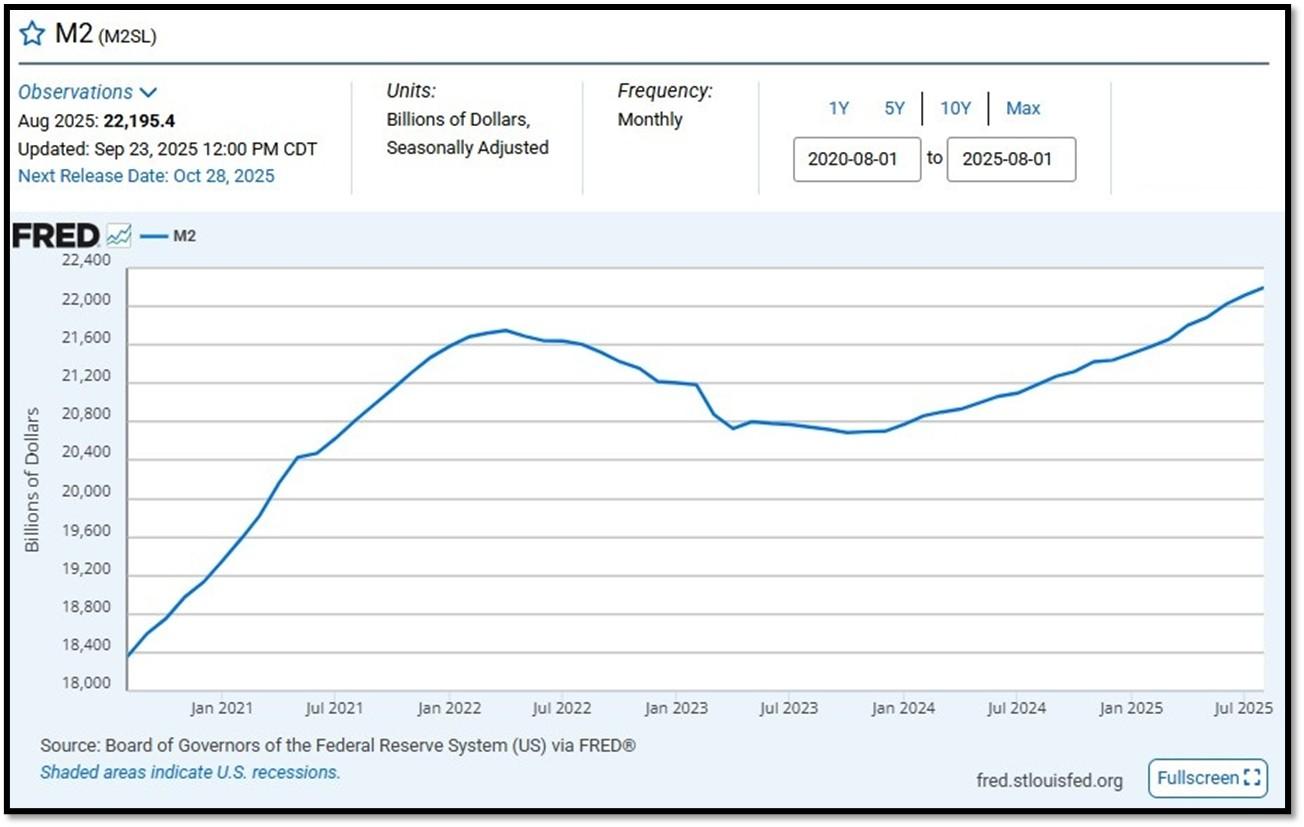
Money Supply M0 in the United States decreased to 5,686,400 USD Million in August from 5,740,300 USD Million in July of 2025. Money Supply M0 in the United States averaged 1,211,562.63 USD Million from 1959 until 2025, reaching an all-time high of 6,413,100.00 USD Million in December of 2021 and a record low of 484,00.00 USD Million in February of 1961.. REF: TradingEconomics, M0
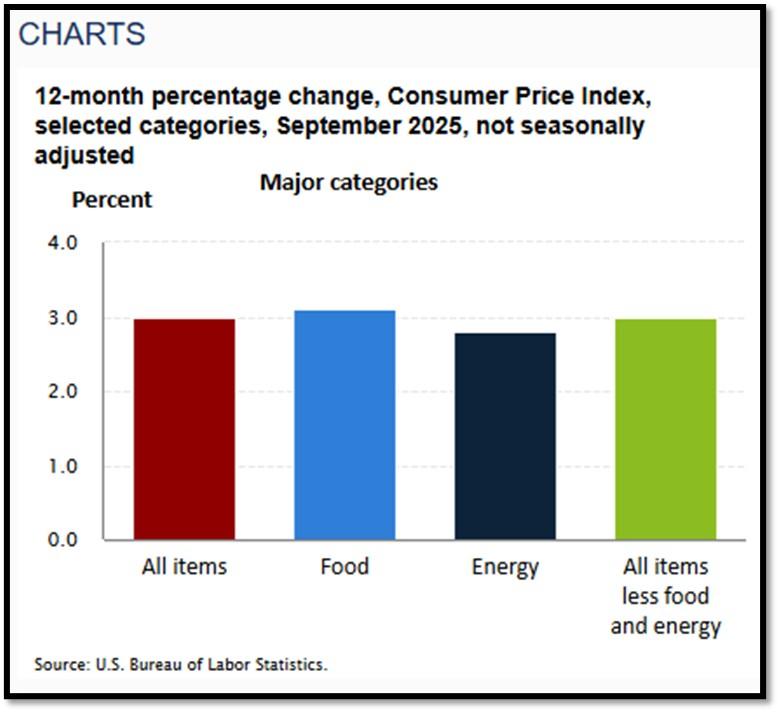
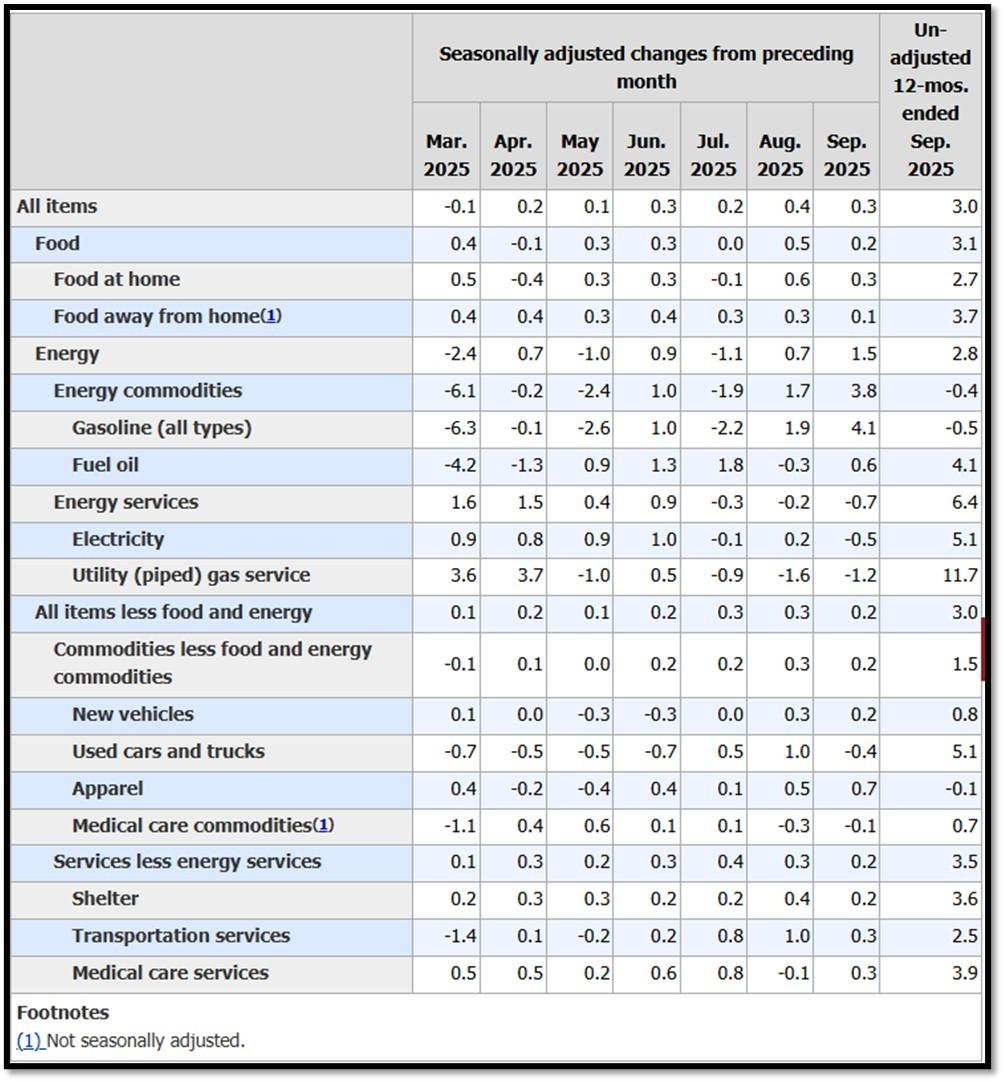
5K. In September, the Consumer Price Index for All Urban Consumers rose 0.3 percent, seasonally adjusted, and rose 3.0 percent over the last 12 months, not seasonally adjusted. The index for all items less food and energy increased 0.2 percent in September (SA); up 3.0 percent over the year (NSA). No announcement was made on October 2025’s CPI data. REF: BLS, BLS.GOV
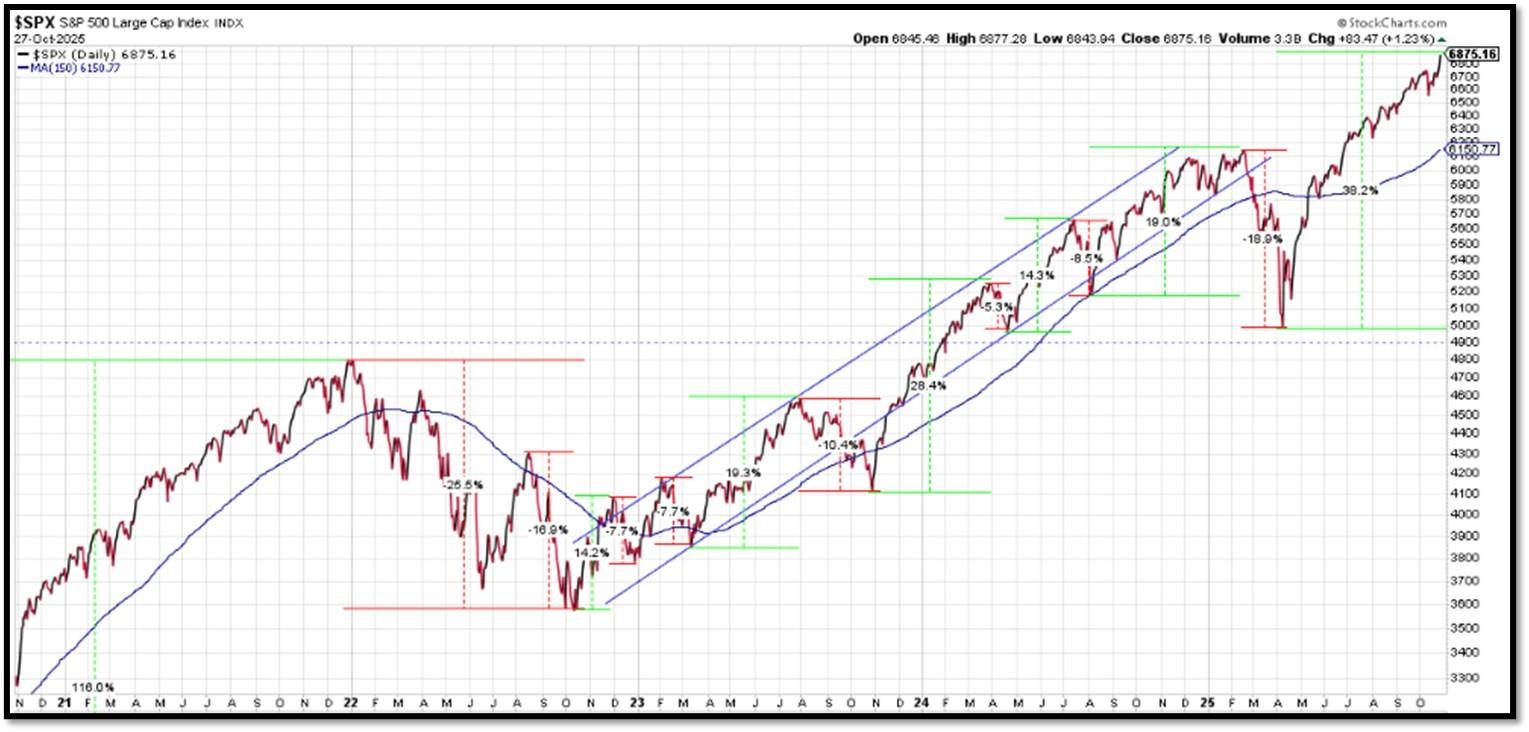
5L. Technical Analysis of the S&P500 Index. Click onto reference links below for images.
- Short-term Chart: Trend Bullish on 10/27/2025 – REF: Short-term S&P500 Chart by Marc Slavin (Click Here to Access Chart)
- Medium-term Chart: Trend Bullish on 10/27/2025 – REF: Medium-term S&P500 Chart by Marc Slavin (Click Here to Access Chart)
- Market Timing Indicators – S&P500 Index as of 10/27/2025 – REF: S&P500 Charts (7 of them) by Joanne Klein’s Top 7 (Click Here to Access Updated Charts)
- The S&P500 is hitting all-time-high, rebounding from a V-shaped recovery to all-time high. REF: Stockcharts
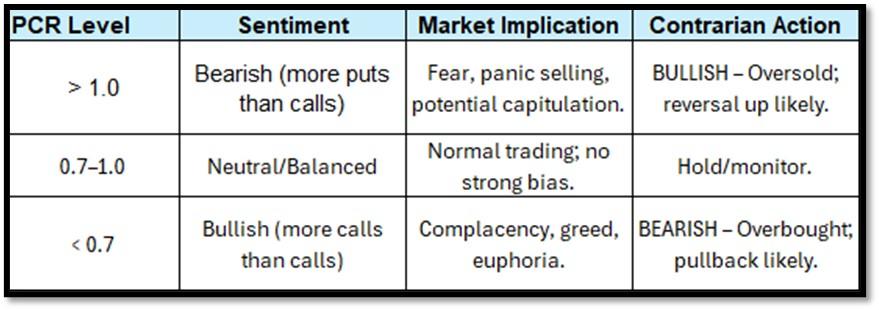
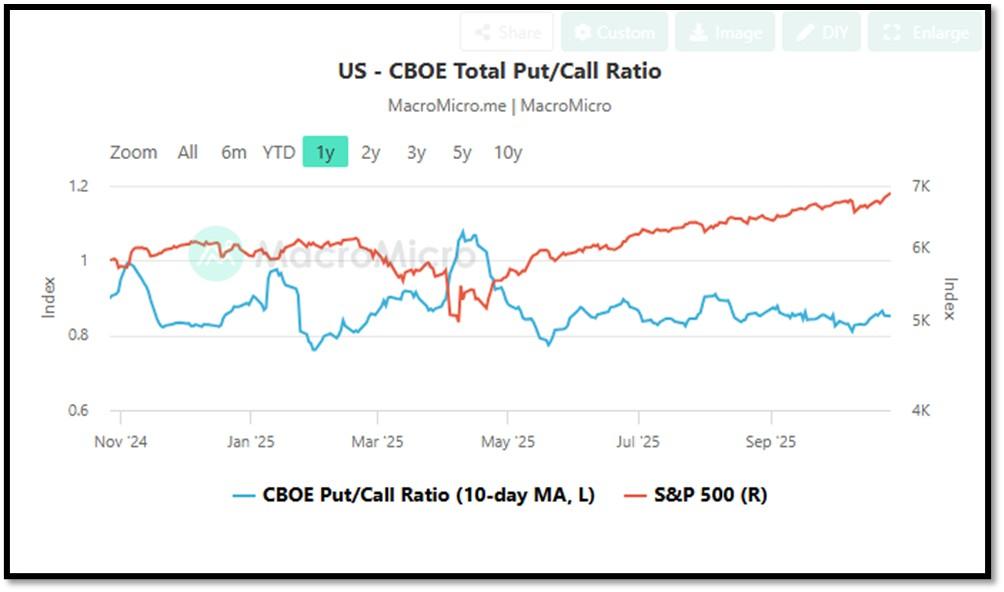
- CBOE Total Put/Call Ratio as of 10/27/2025. REF: MacroMicro
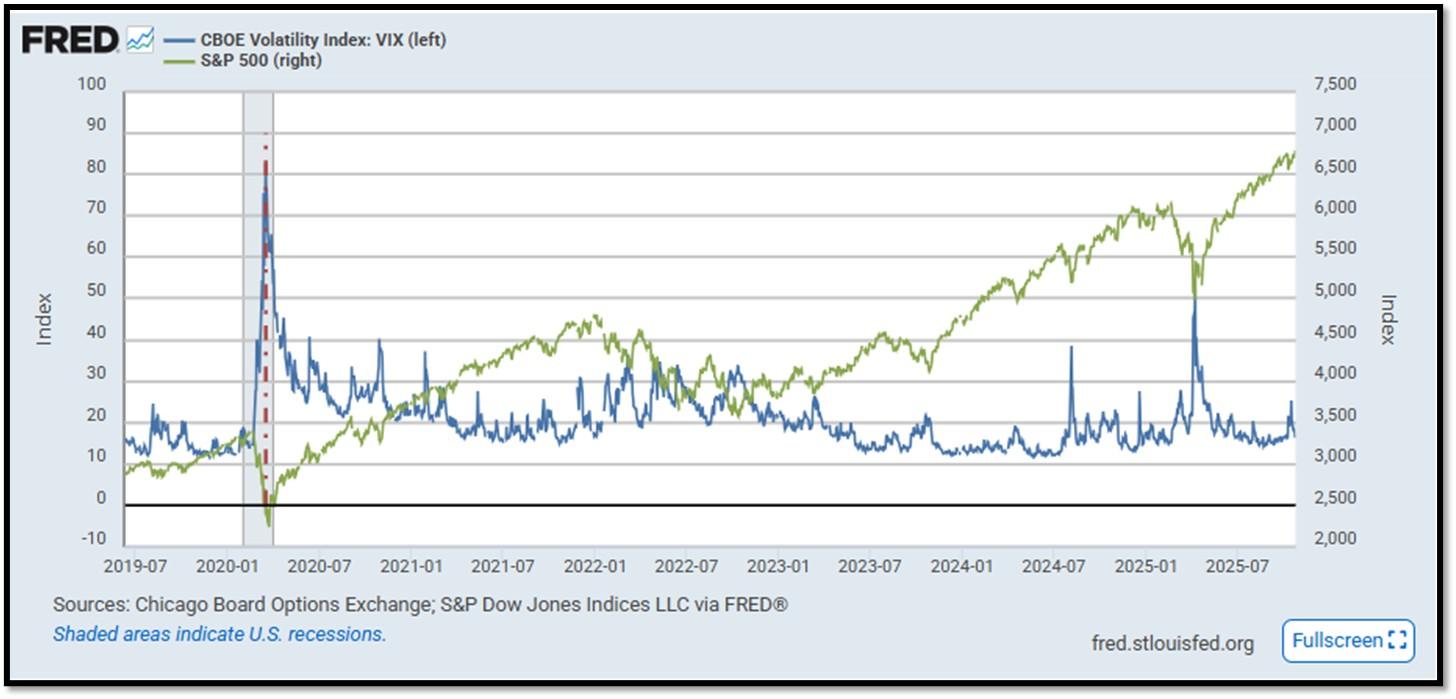
- S&P500 and CBOE Volatility Index (VIX) as of 10/21/2025. REF: FRED, Today’s Print
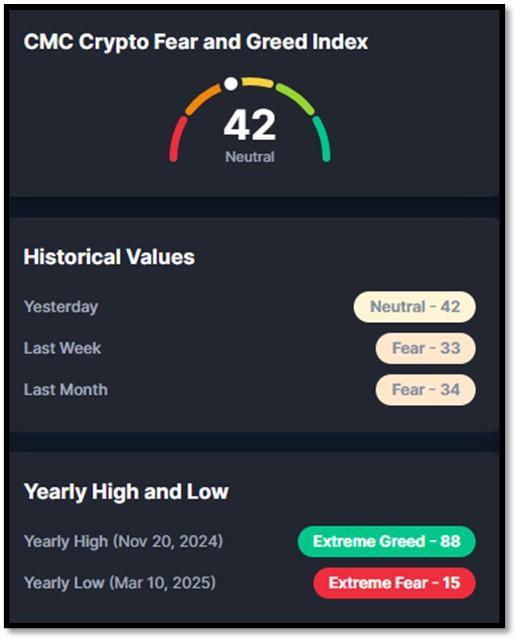
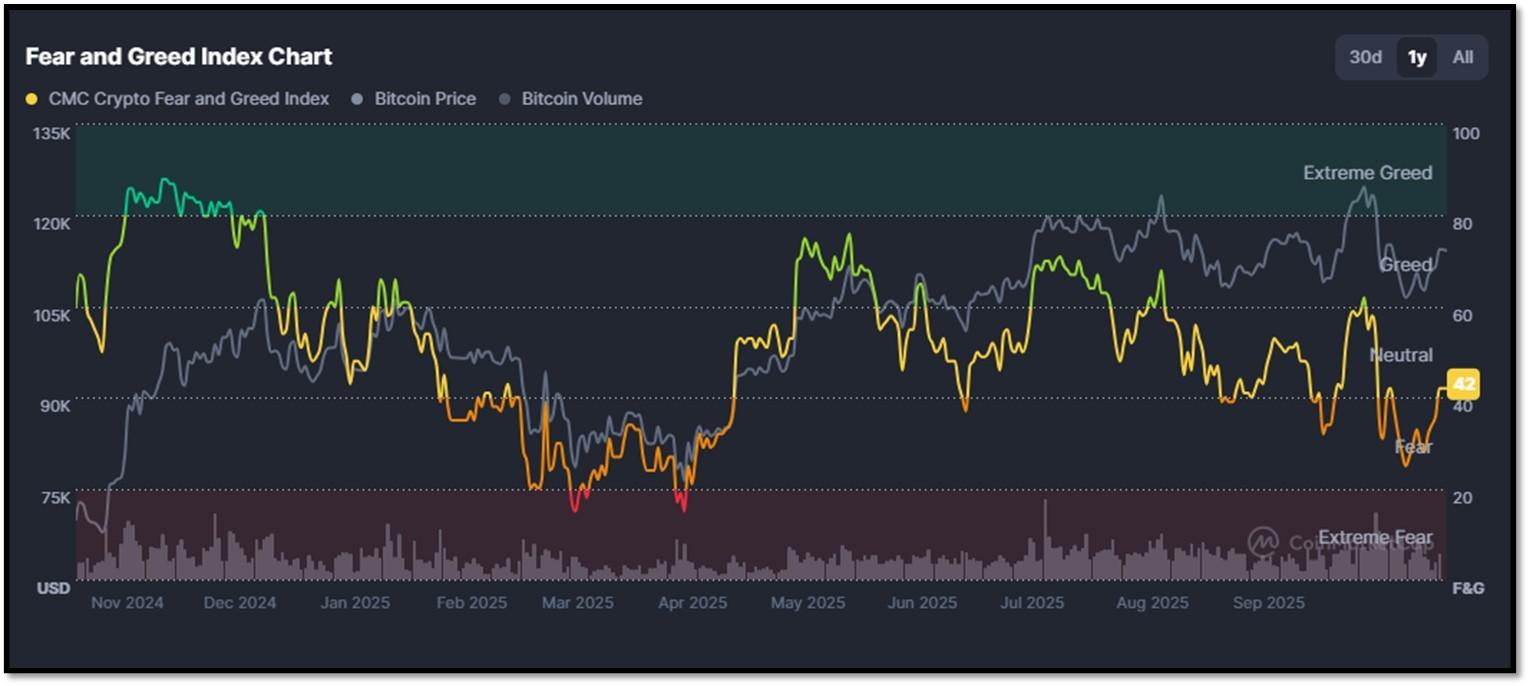
5M. Most recent read on the Crypto Fear & Greed Index with data as of 10/28/2025 is 42 (Neutral). Last week’s data was 33 (Fear) (1-100). Fear & Greed Index – A Contrarian Data. The crypto market behavior is very emotional. People tend to get greedy when the market is rising which results in FOMO (Fear of missing out). Also, people often sell their coins in irrational reaction of seeing red numbers. With the Crypto Fear and Greed Index, the data try to help save investors from their own emotional overreactions. There are two simple assumptions:
- Extreme fear can be a sign that investors are too worried. That could be a buying opportunity.
- When Investors are getting too greedy, that means the market is due for a correction.
Therefore, the program for this index analyzes the current sentiment of the Bitcoin market and crunch the numbers into a simple meter from 0 to 100. Zero means “Extreme Fear”, while 100 means “Extreme Greed”. REF: Coinmarketcap.com, Today’sReading
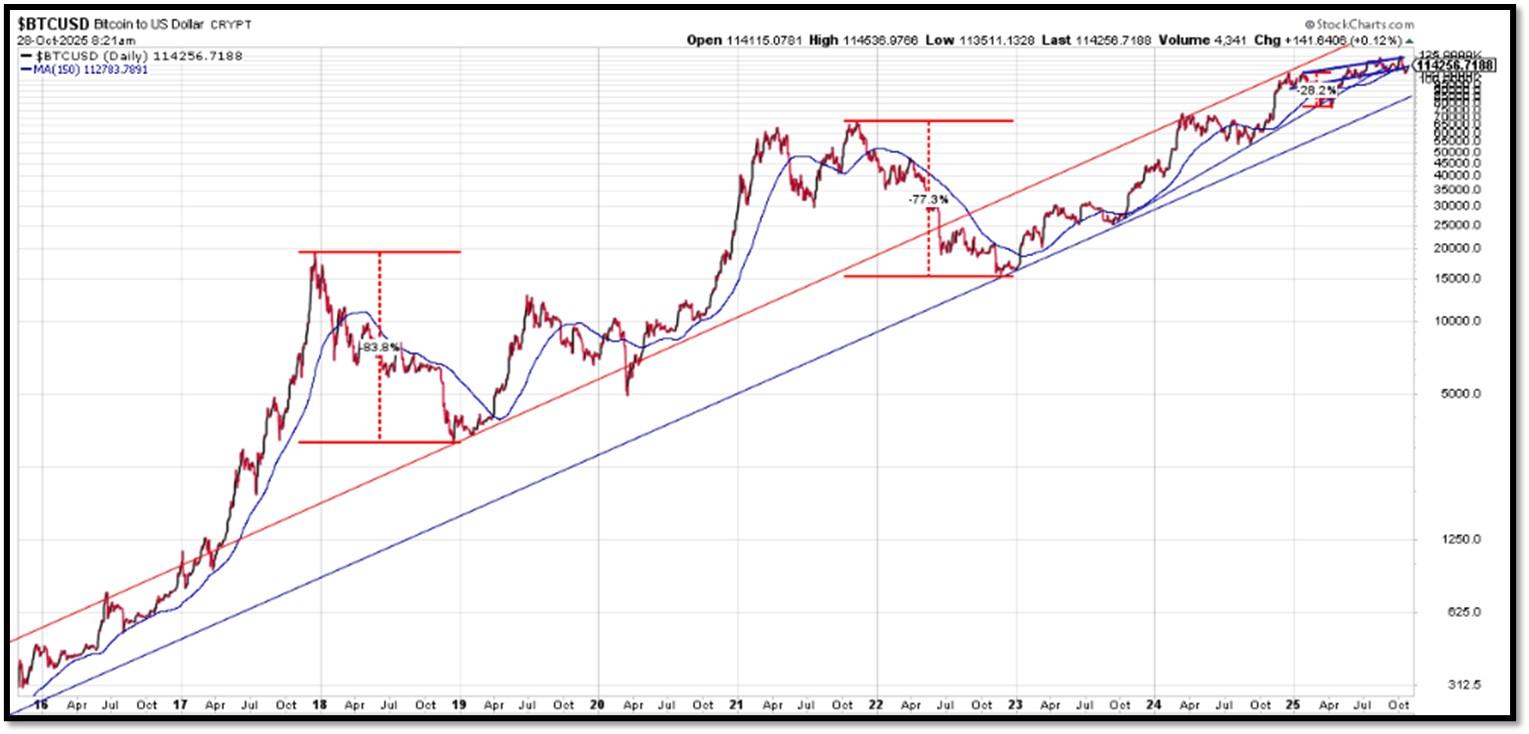
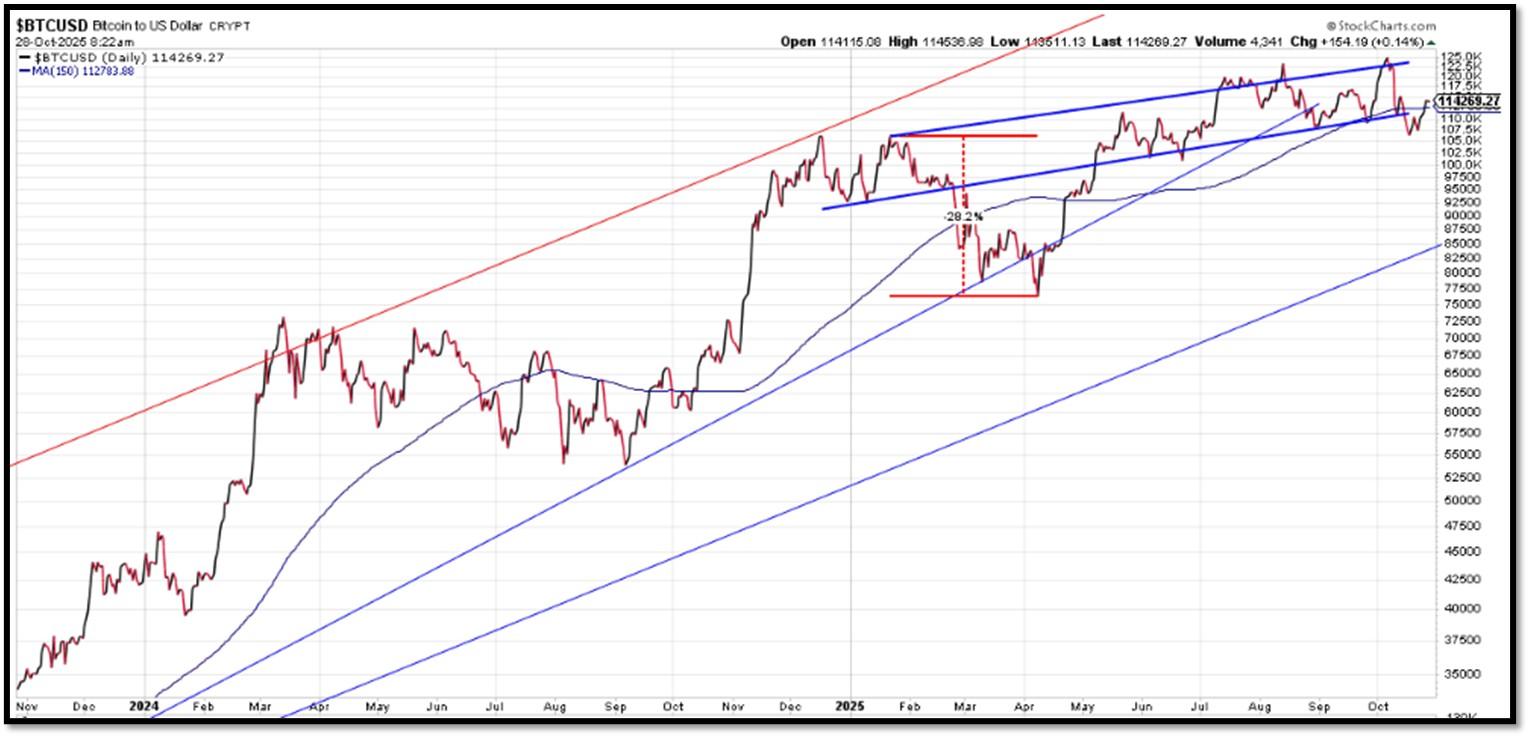
Bitcoin – 10-Year & 2-Year Charts. REF: Stockcharts10Y, Stockcharts2Y
From the desk of our Chief Investment Officer
As an investment professional with over twenty-six years of experience in the financial services industry, Andrew helps clients to protect, grow and transfer wealth during their lifetime with objective, unbiased, customized and efficient strategies.
Education, Professional Licenses Acquired & Affiliations
- Passed the Series 7, 63, 65 and 24 license examinations
- Currently holding Series 65 License
- BA in Economics – Boston University (Boston, MA) 1993
- Certificate in Commodities Trading – New York University (New York, NY) 1991
- Certificate in Financial Planning – New York University (New York, NY) April 2011
With extensive experience in the Financial Services Industry, Andrew Tang and Turner Financial Group provides disciplined wealth management with an intelligent caring approach to each and every client that compliments the Dedicated Financial offering.


Len writes much of his own content, and also shares helpful content from other trusted providers like Turner Financial Group (TFG).
The material contained herein is intended as a general market commentary, solely for informational purposes and is not intended to make an offer or solicitation for the sale or purchase of any securities. Such views are subject to change at any time without notice due to changes in market or economic conditions and may not necessarily come to pass. This information is not intended as a specific offer of investment services by Dedicated Financial and Turner Financial Group, Inc.
Dedicated Financial and Turner Financial Group, Inc., do not provide tax, legal or accounting advice. You should consult your own tax, legal and accounting advisors before engaging in any transaction.
Any hyperlinks in this document that connect to Web Sites maintained by third parties are provided for convenience only. Turner Financial Group, Inc. has not verified the accuracy of any information contained within the links and the provision of such links does not constitute a recommendation or endorsement of the company or the content by Dedicated Financial or Turner Financial Group, Inc. The prices/quotes/statistics referenced herein have been obtained from sources verified to be reliable for their accuracy or completeness and may be subject to change.
Past performance is no guarantee of future returns. Investing involves risk and possible loss of principal capital. The views and strategies described herein may not be suitable for all investors. To the extent referenced herein, real estate, hedge funds, and other private investments can present significant risks, including loss of the original amount invested. All indexes are unmanaged, and an individual cannot invest directly in an index. Index returns do not include fees or expenses.
Turner Financial Group, Inc. is an Investment Adviser registered with the United States Securities and Exchange Commission however, such registration does not imply a certain level of skill or training and no inference to the contrary should be made. Additional information about Turner Financial Group, Inc. is also available at www.adviserinfo.sec.gov. Advisory services are only offered to clients or prospective clients where Turner Financial Group, Inc. and its representatives are properly licensed or exempt from licensure. No advice may be rendered by Turner Financial Group, Inc. unless a client service agreement is in place.


