

- 1. This week’s economic data highlighted U.S. inflation, energy, and labor trends.
- 2. The Role of Simulations and Synthetic Data in Advancing AI and Autonomous Systems – In AI training, simulations refer to virtual environments or scenarios designed to mimic real-world conditions, allowing AI models to learn and refine their performance without the risks, costs, or limitations of physical testing.
- 3. The Push for Bitcoin in Retirement Plans: A Maturing Asset with Growth Potential – The Trump administration issued an executive order promoting the inclusion of digital assets, notably Bitcoin, in 401(k) and ERISA-governed retirement plans, expanding options for 90 million Americans managing $8.7 trillion in assets.
- 4. World Watch
- 4A. Drones – You Can’t Shape the Future Without Building Them First…! China, the global leader in drone manufacturing, produces tens of millions of drones yearly, exporting nearly 40 million in 2023, including 600,000 to the U.S. DJI, controlling 80% of the consumer drone market, drives China’s 90% global market share, with a monthly output of 500,000 FPV drones, potentially expandable to 700,000 in wartime.
- 4B. China’s economy is slowing, intensifying pressure on Beijing for stronger stimulus amid trade tensions and a real estate crisis, worsened by China Evergrande Group’s delisting from the Hong Kong stock exchange on August 25, 2025.
- 4C. An updated snapshot of the current global state of economy.
- 5. Quant & Technical Corner – A selection of quantitative & technical data we monitor on a regular basis to help gauge the overall financial market conditions and the investment environment.
1. This week’s economic data highlighted U.S. inflation, energy, and labor trends.
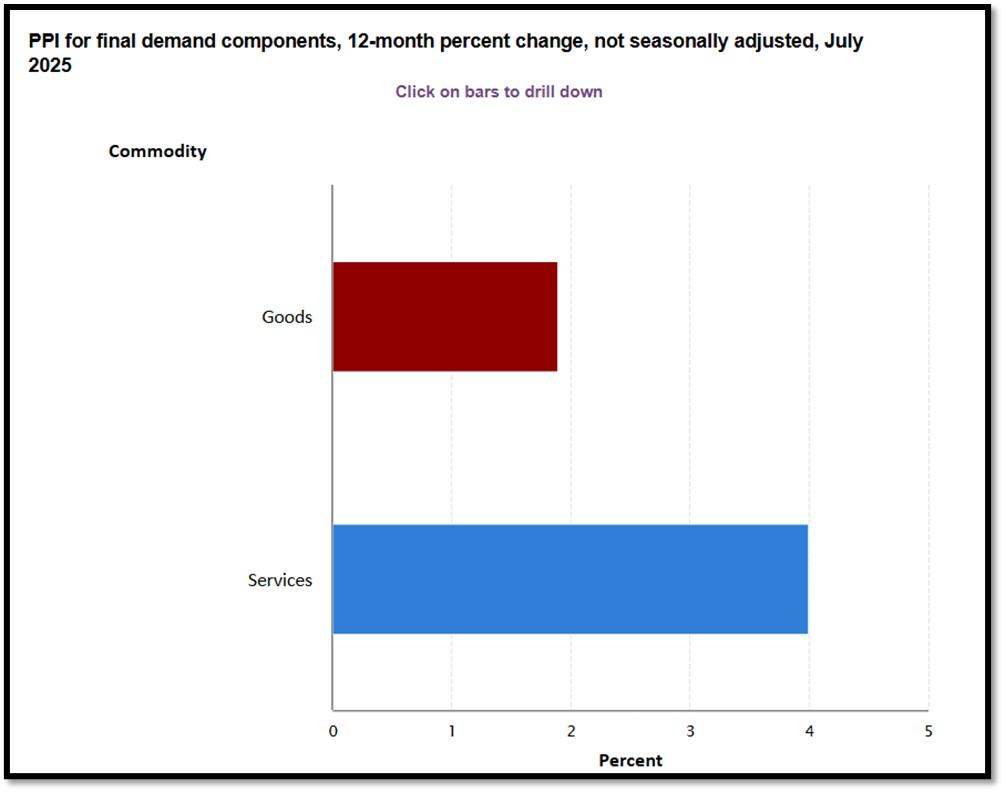
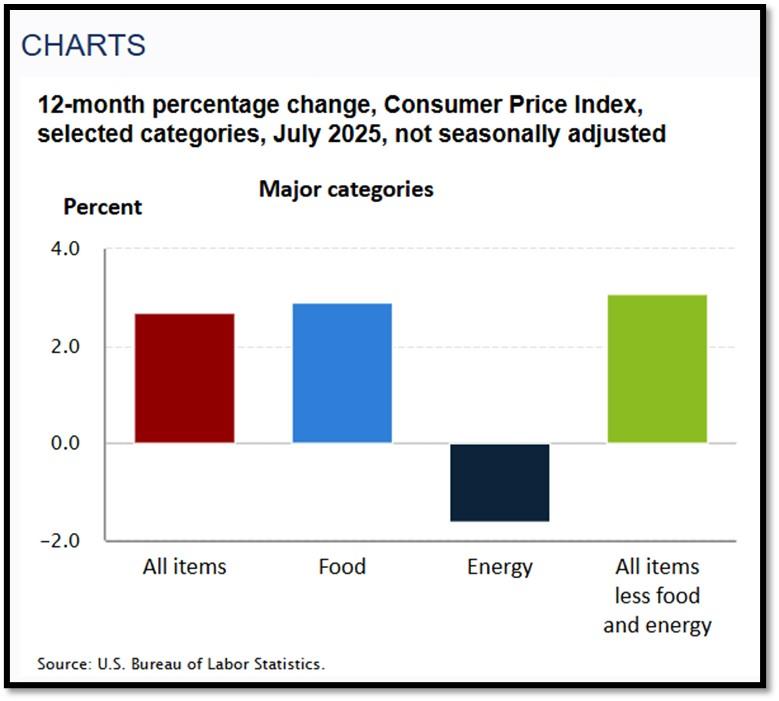
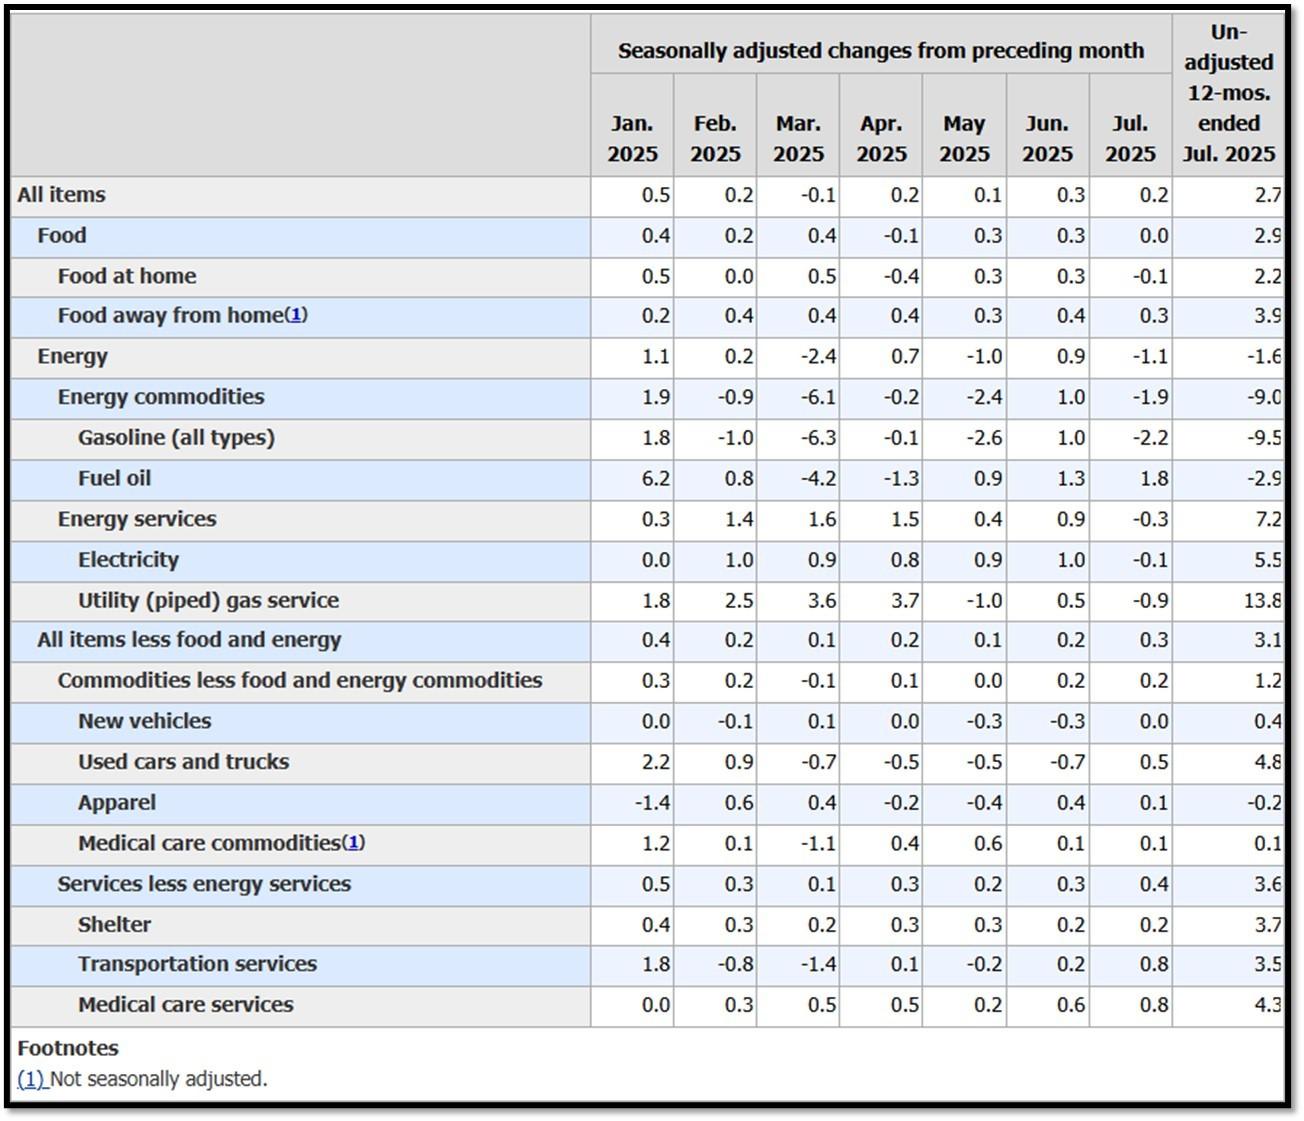
The Consumer Price Index (CPI) for July 2025 rose 2.7% year-over-year, up from 2.4%, with a 0.2% monthly increase driven by a 3.8% rise in shelter prices; core CPI, excluding food and energy, hit 2.9% annually. Overall inflation is in line with expectations and better than anticipated given the effects of tariffs. The EIA reported a 7.1 million barrel crude oil inventory build, against expectations of a 2.8 million barrel draw, with stocks at 426 million barrels, while gasoline and distillate inventories fell by 2.7 million and 800,000 barrels, respectively. This data is a reflection on the rising cost of producing oil in the US. Projected US oil production is also trending down with a great reduction in oil-related workforce. While US oil production slows, the Middle East (OPEC nations) picks up the slack. The Producer Price Index (PPI) surged 0.9% month-over-month and 3.3% year-over-year, the largest since June 2022, with 78% of the increase from services like machinery wholesaling (up 3.8%), portfolio management, and transportation, though goods like vegetables (up 38.9%) also contributed; core PPI rose 0.6% monthly and 3.7% annually. Initial jobless claims fell slightly to 224,000, below the 228,000 estimate, indicating labor market stability. The services-driven PPI jump suggests persistent inflation in non-goods sectors, potentially challenging Federal Reserve policy, though its volatility compared to CPI warrants cautious interpretation. REF: Briefing.com, BLS
2. The Role of Simulations and Synthetic Data in Advancing AI and Autonomous Systems – In AI training, simulations refer to virtual environments or scenarios designed to mimic real-world conditions, allowing AI models to learn and refine their performance without the risks, costs, or limitations of physical testing.
These controlled settings generate synthetic data—artificially created datasets that replicate real-world patterns, behaviors, or edge cases. For instance, in training autonomous vehicles like Tesla’s Full Self-Driving (FSD) system, simulations create millions of driving scenarios, including rare events like extreme weather or erratic road behavior, enabling the AI to practice responses safely. Similarly, synthetic data augments AI training by providing diverse, scalable, and customizable datasets, addressing gaps in real-world data collection, such as privacy concerns or underrepresented scenarios. By leveraging simulations and synthetic data, AI systems can train on vast, varied inputs, accelerating learning and improving robustness.
For companies like Tesla, simulations are critical to advancing FSD, enabling the system to handle complex driving conditions with superior performance. Tesla’s Dojo supercomputer generates billions of simulated miles, training FSD on scenarios that would take years to encounter in real-world driving, enhancing its ability to navigate safely and efficiently. Similarly, synthetic data is propelling general AI models toward superintelligence—systems surpassing human cognitive capabilities. By creating tailored datasets, such as diverse language patterns or rare decision-making scenarios, synthetic data ensures AI models like those developed by xAI can generalize across tasks and domains. This approach reduces reliance on costly real-world data, mitigates biases, and enables rapid iteration, positioning companies to achieve breakthroughs in autonomous systems and intelligent agents, with profound implications for industries like transportation and AI research. Click onto pictures below to access videos. I included a fantastic video from MS on how AI is getting physical. REF: NATA, Xai, Grok, Nvidia
NOTE: Not investment advice or recommendations. Investor should consider the investment objective, risks, charges and expenses carefully before investing. For additional information about securities mentioned above or in the video, please visit the companies’ websites of referenced securities mentioned above and in videos below. Read carefully before investing.


3. The Push for Bitcoin in Retirement Plans: A Maturing Asset with Growth Potential – The Trump administration issued an executive order promoting the inclusion of digital assets, notably Bitcoin, in 401(k) and ERISA-governed retirement plans, expanding options for 90 million Americans managing $8.7 trillion in assets.
Reversing the Biden-era’s 2022 cautionary guidance on cryptocurrencies’ volatility, the order directs the Department of Labor to reassess fiduciary rules and the SEC to ease regulations for alternative assets like Bitcoin, private equity, and real estate. This aligns with Trump’s goal to position the U.S. as the “crypto capital of the world.” Bitcoin, once dismissed as a meme or fad, has proven its staying power, with growing institutional adoption signaling its maturity. The policy could drive mainstream investment, stabilize prices, and diversify portfolios, though Bitcoin’s volatility and illiquidity raise fiduciary concerns under ERISA’s prudence standards. By legitimizing Bitcoin in retirement plans, the policy could unlock trillions, boosting demand and market growth, still in its infancy due to rising adoption.
The order mandates a 180-day review to clarify fiduciary processes and propose safe harbors to mitigate litigation risks, which have deterred alternative asset inclusion. Bitcoin’s high fees and liquidity challenges complicate 401(k) cash-out needs, prompting suggestions for managed funds or ETFs to reduce risks, as experts like Matt Radgowski advocate. For the investment realm, this could elevate Bitcoin’s status as a mainstream asset, with its potential upside still early-stage as adoption grows. Fiduciaries must ensure compliance with ERISA’s strict duties, emphasizing investor education and risk management. Critics warn that without clear regulations, volatility could harm retirees. For now, I focus on Bitcoin as a stable retirement investment. Click onto picture below to access video. REF: WH, NYT
With the current macro-economic backdrop, below are areas we currently favor:
- Fixed Income – Short-term Corporates (Low-Beta)
- Fixed Income – (Corporates & Muni) High Yield as Opportunistic Allocation (Low-Beta)
- Businesses that contribute to and benefit from AI & Automation (Market-Risk)
- Fintech & Financials (Market-Risk)
- Digital Asset – Bitcoin (Market-Risk/Hedge)
- Cyber-Security & Software (Market-Risk)
- Cloud Computing (Market-Risk)
- Biotechnology (Market-Risk)
4. World Watch
4A. Drones – You Can’t Shape the Future Without Building Them First…! China, the global leader in drone manufacturing, produces tens of millions of drones yearly, exporting nearly 40 million in 2023, including 600,000 to the U.S. DJI, controlling 80% of the consumer drone market, drives China’s 90% global market share, with a monthly output of 500,000 FPV drones, potentially expandable to 700,000 in wartime.
In contrast, the U.S. produces fewer than 100,000 drones annually, focusing on advanced military systems like the MQ-9 Reaper, with monthly FPV output in the thousands. Other countries, like Turkey and India, trail with annual production in the tens of thousands. China’s estimated daily output of 20,000 consumer drones equates to 7.3 million annually, surpassing most nations’ yearly totals but not necessarily the U.S.’s combined military and commercial output. The claim is thus largely valid for consumer drones against smaller producers but less definitive for military drones.
China’s dominance stems from its integrated supply chain, low-cost production, and government support via initiatives like “Made in China 2025,” enabling drone costs up to three times lower than U.S. counterparts. In 2023, China’s drone output was valued at $82 billion, with DJI filing 64 of 7,890 global drone patents in 2024. The U.S., with 13,000 military UAVs in 2025, lags in consumer drones due to reliance on Chinese components and higher costs. To shape the future, the U.S. must invest in domestic manufacturing, develop independent supply chains for motors, batteries, and controllers, and incentivize innovation through R&D funding. Reducing dependency on Chinese components is critical to counter national security risks and compete in the consumer market. Failure to act could cede strategic drone applications—commercial delivery, surveillance, and warfare—to China, undermining U.S. technological leadership. Other nations, focusing on niche military drones, face similar challenges. China’s lead in consumer drones is clear, but the U.S. can close the gap with targeted investments. Click onto pictures below to access videos. REF: WorldEconomicForum, Forbes, CNBC, NYT


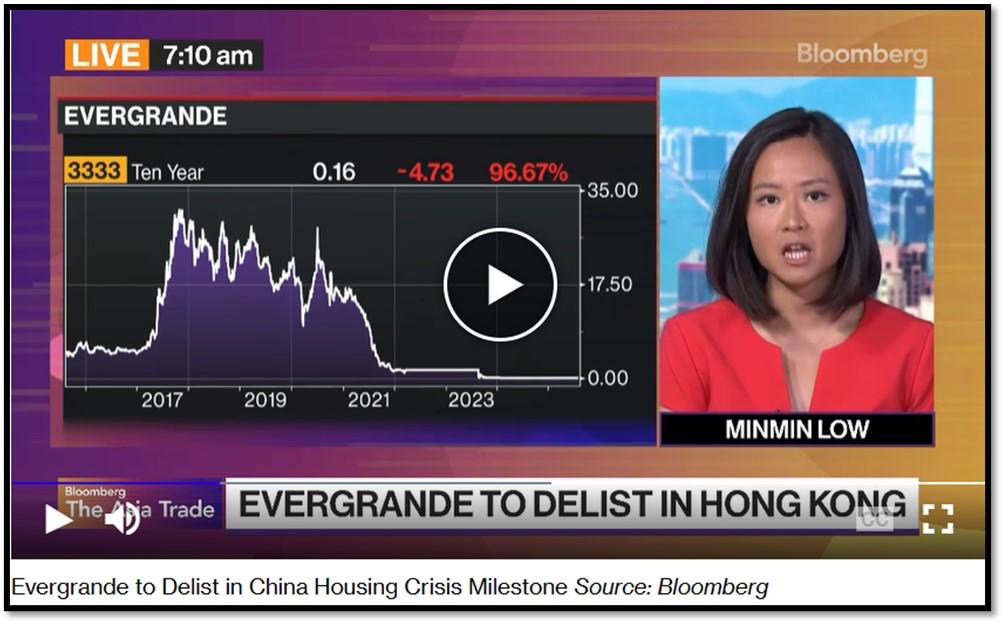
4B. China’s economy is slowing, intensifying pressure on Beijing for stronger stimulus amid trade tensions and a real estate crisis, worsened by China Evergrande Group’s delisting from the Hong Kong stock exchange on August 25, 2025.
Industrial output grew by 5.7% year-on-year in July, down from 6.8%, while retail sales rose only 3.7%, missing forecasts of 4.6%. Fixed-asset investment increased by 1.6% in the first seven months, with unemployment at 5.2%. The U.S.-China trade war, with tariffs up to 145% from the U.S. and 125% from China, has hurt exports, despite a 90-day truce. The property sector, 25% of GDP, saw investments drop 12% and residential housing fall 11% in 2025. Evergrande’s delisting, tied to a $45 billion debt and only $255 million recovered, echoes the U.S.’s 2008 housing crisis, with home prices falling in 67 of 70 major cities, eroding consumer confidence as 70% of household wealth is property-based.
The real estate crisis, highlighted by Evergrande’s collapse, reflects deep structural issues, demanding urgent policy action. A 20-30% price correction, costing 7.7 trillion yuan ($1.07 trillion), is needed to clear inventory, but the CCP supports prices to avoid a banking crisis, with real estate loans at 23.5% of bank credit and a projected 6.4% non-performing loan ratio in 2025. Evergrande’s liquidation, spanning 3,000 entities and 1,300 projects, recovered just 3.53% for offshore creditors (A big blow to investment sentiment into this sector). Low interest rates (one-year LPR at 3.0%, five-year at 3.5%) and relaxed purchase rules have failed to spur demand, with a housing price-to-income ratio of 28.5. Combined with trade war pressures and deflation (wholesale prices down 3.6% in July), this risks economic and social instability. Beijing must implement fiscal stimulus, boost consumption, and address real estate oversupply to avert a deeper slump with global implications. Click onto picture below to access video. REF: Bloomberg, WSJ
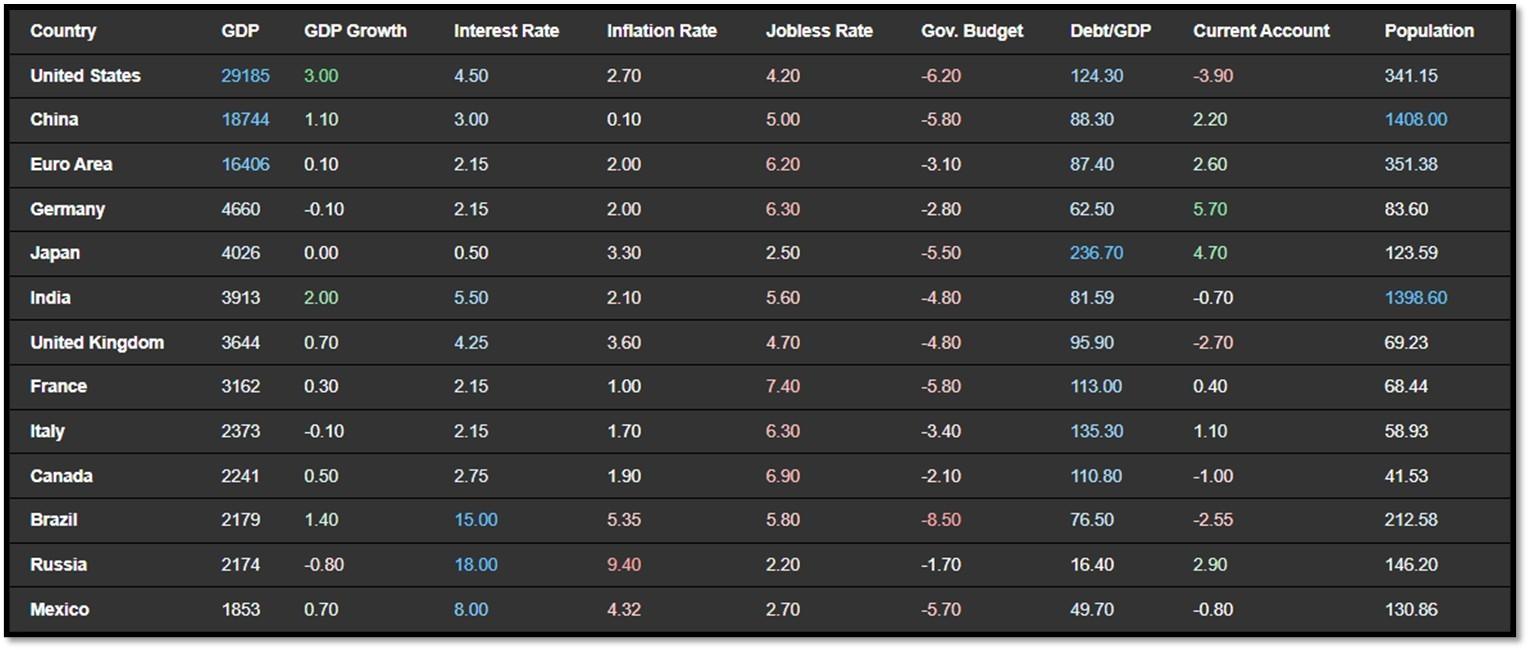
4C. An updated snapshot of the current global state of economy.
According to TradingEconomics as of 8/14/2025 (REF: TradingEconomics):
- China’s consumer prices were flat from a year earlier in July 2025, surpassing market expectations for a 0.1% drop and following a 0.1% gain in the previous month.
- The annual consumer price inflation rate in India fell to 1.55% in July of 2025 from 2.1% in the previous month, firmly below the market consensus of a 1.76%, to mark the ninth consecutive decrease in the inflation rate and only 1 basis point away from the series-low in June of 2017.
- The US annual inflation rate remained at 2.7% in in July 2025, the same as in June and below forecasts of 2.8%.
- France’s annual inflation rate held steady at 1% in July 2025, unchanged from June and in line with market expectations, according to preliminary estimates_.
5. Quant & Technical Corner – A selection of quantitative & technical data we monitor on a regular basis to help gauge the overall financial market conditions and the investment environment.
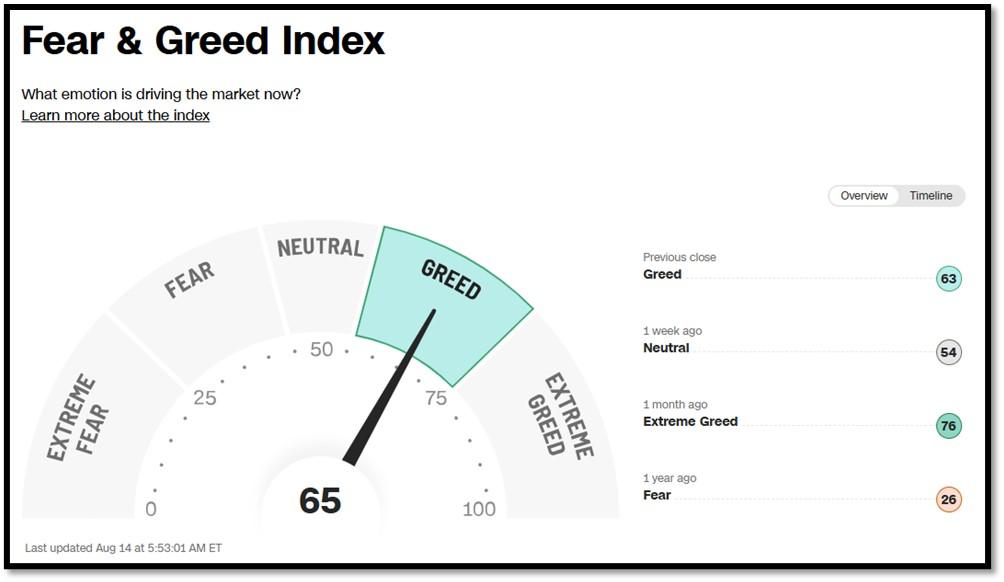
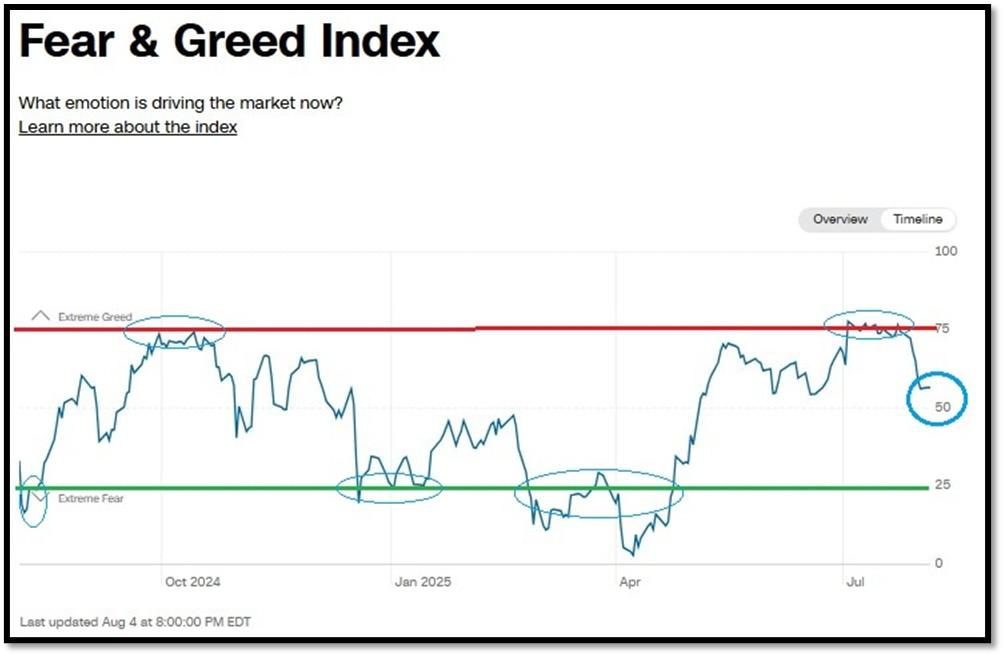
5A. Most recent read on the Fear & Greed Index with data as of 8/14/2025 – 5:53AM-ET is 65 (Greed). Last week’s data was 54 (Greed) (1-100). CNNMoney’s Fear & Greed index looks at 7 indicators (Stock Price Momentum, Stock Price Strength, Stock Price Breadth, Put and Call Options, Junk Bond Demand, Market Volatility, and Safe Haven Demand). Keep in mind this is a contrarian indicator! REF: Fear&Greed via CNNMoney
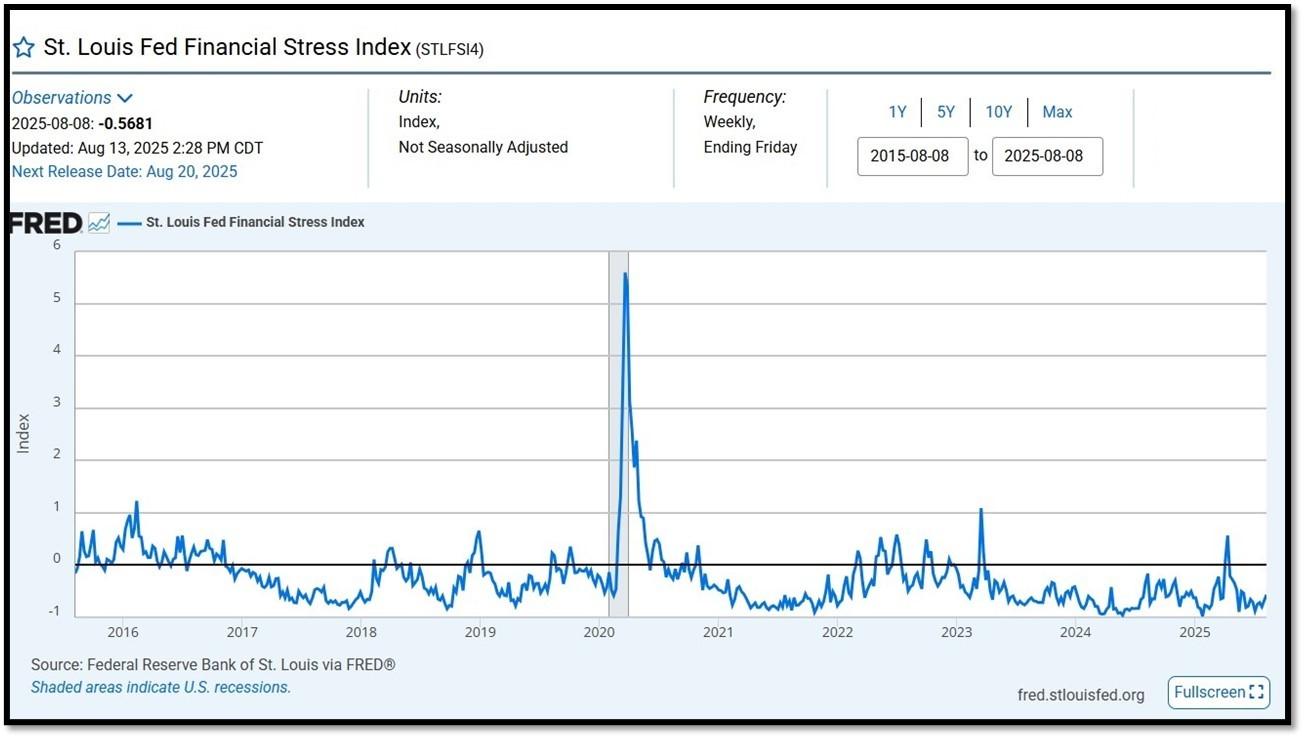
5B. St. Louis Fed Financial Stress Index’s (STLFSI4) most recent read is at –0.5681 as of August 13, 2025. Previous week’s data was -0.7950. A big spike up from previous readings reflecting the turmoil in the banking sector back in 2023. This weekly index is not seasonally adjusted. The STLFSI4 measures the degree of financial stress in the markets and is constructed from 18 weekly data series: seven interest rate series, six yield spreads and five other indicators. Each of these variables captures some aspect of financial stress. Accordingly, as the level of financial stress in the economy changes, the data series are likely to move together. REF: St. Louis Fed
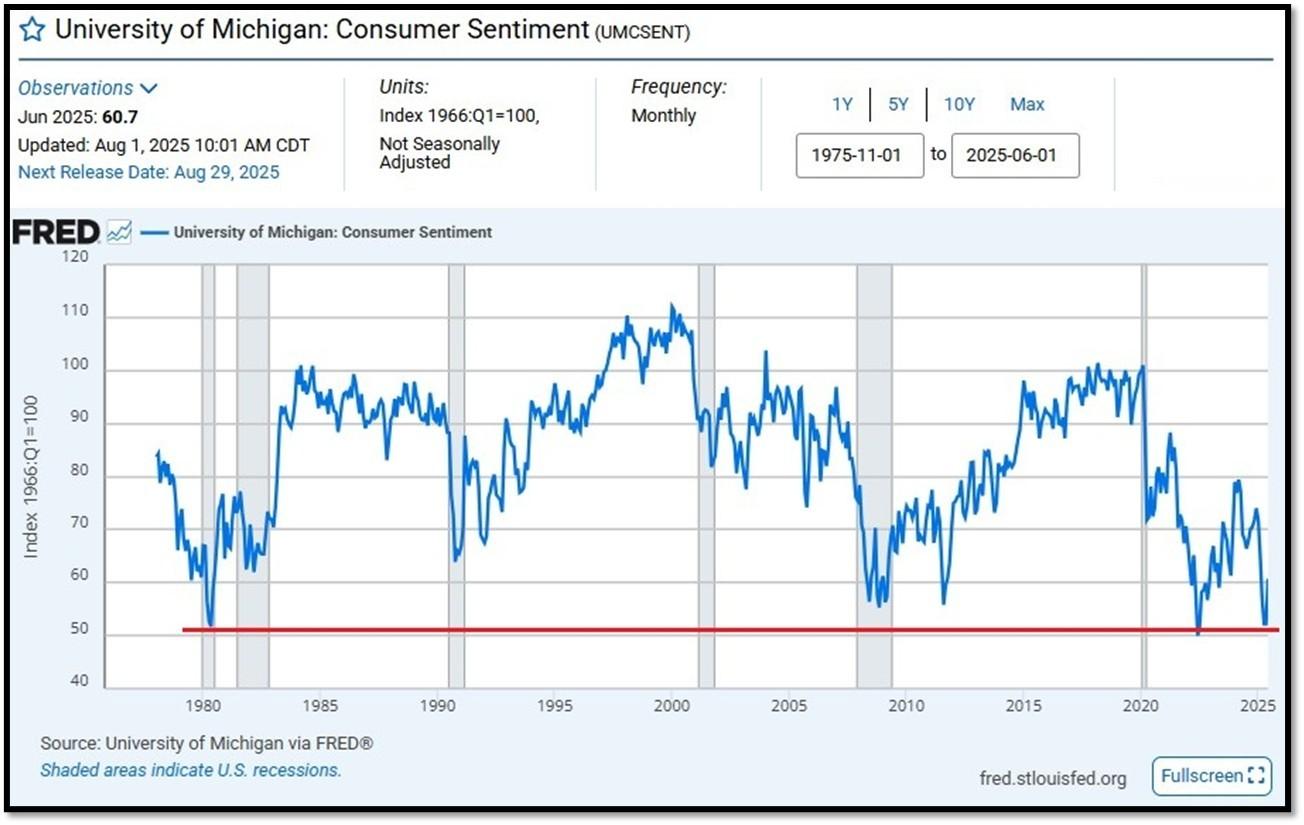
5C. University of Michigan, University of Michigan: Consumer Sentiment for February [UMCSENT] at 60.7, retrieved from FRED, Federal Reserve Bank of St. Louis, August 1, 2025. Back in June 2022, Consumer Sentiment hit a low point going back to April 1980. REF: UofM
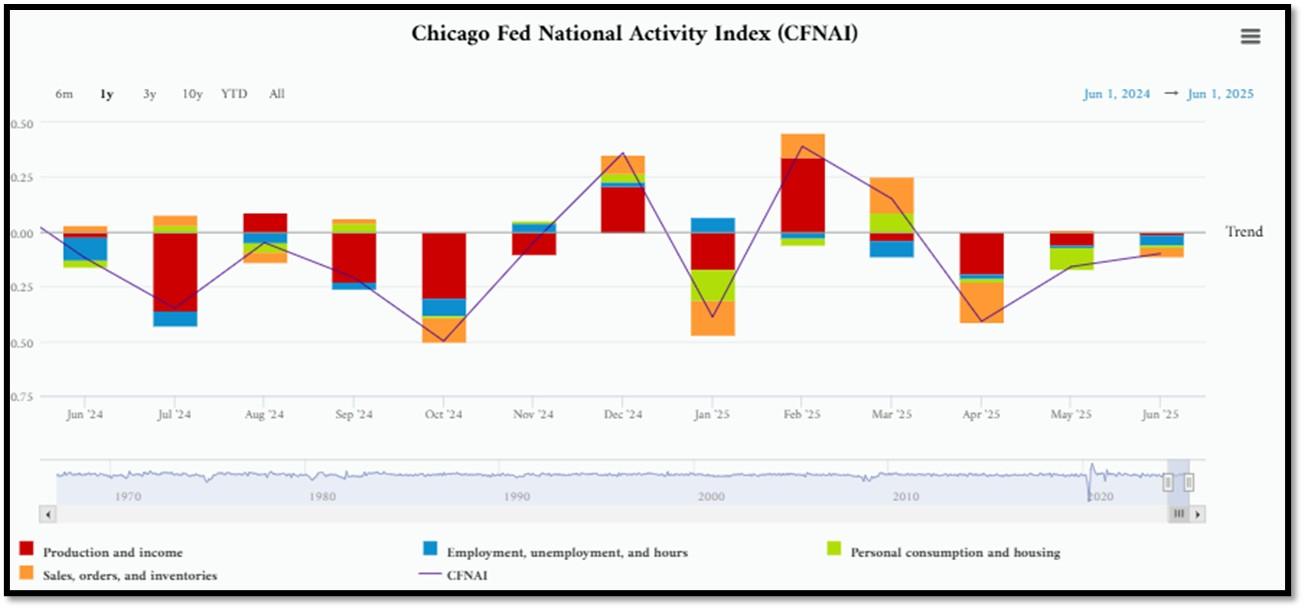
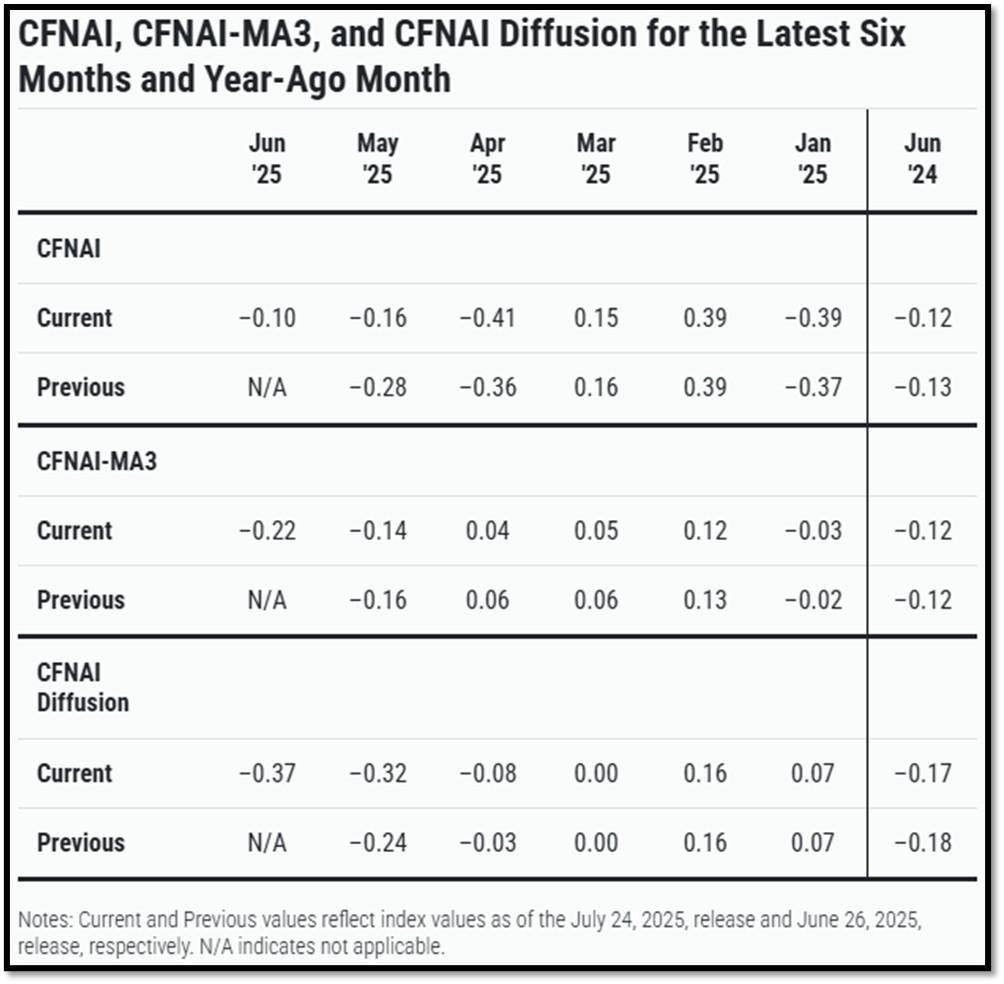
5D. The Chicago Fed National Activity Index (CFNAI) increased to –0.10 in June from –0.16 in May. Two of the four broad categories of indicators used to construct the index increased from May, but all four categories made negative contributions in June. The index’s three-month moving average, CFNAI-MA3, decreased to –0.22 in June from –0.14 in May. REF: ChicagoFed, June’s Report
5E. (7/21/2025) The Conference Board Leading Economic Index (LEI) for the US declined by 0.3% in June 2025 to 98.8 (2016=100), after no change in May (revised upward from –0.1% originally reported). As a result, the LEI fell by 2.8% over the first half of 2025, a substantially faster rate of decline than the –1.3% contraction over the second half of 2024. The composite economic indexes are the key elements in an analytic system designed to signal peaks and troughs in the business cycle. The indexes are constructed to summarize and reveal common turning points in the economy in a clearer and more convincing manner than any individual component. The CEI is highly correlated with real GDP. The LEI is a predictive variable that anticipates (or “leads”) turning points in the business cycle by around 7 months. Shaded areas denote recession periods or economic contractions. The dates above the shaded areas show the chronology of peaks and troughs in the business cycle. The ten components of The Conference Board Leading Economic Index® for the U.S. include: Average weekly hours in manufacturing; Average weekly initial claims for unemployment insurance; Manufacturers’ new orders for consumer goods and materials; ISM® Index of New Orders; Manufacturers’ new orders for nondefense capital goods excluding aircraft orders; Building permits for new private housing units; S&P 500® Index of Stock Prices; Leading Credit Index™; Interest rate spread (10-year Treasury bonds less federal funds rate); Average consumer expectations for business conditions. REF: ConferenceBoard, LEI Report for June (Released on 7/31/2025)
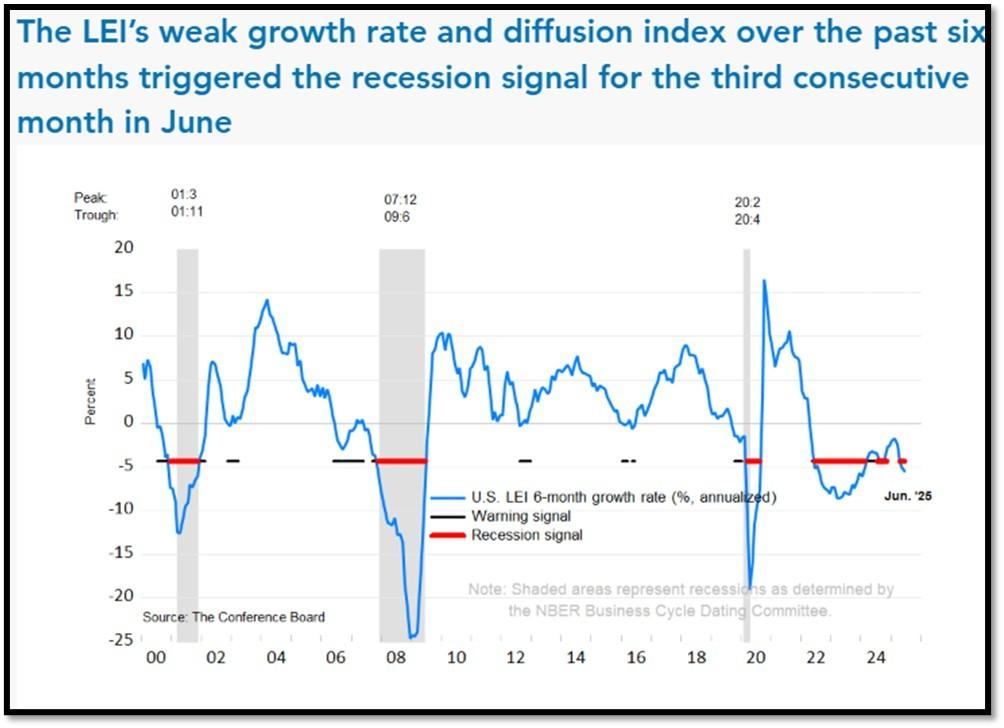
We have experienced a “rolling recession” since June 2022 and are only now emerging from it. However, authorities are not labeling it a recession due to high employment data.
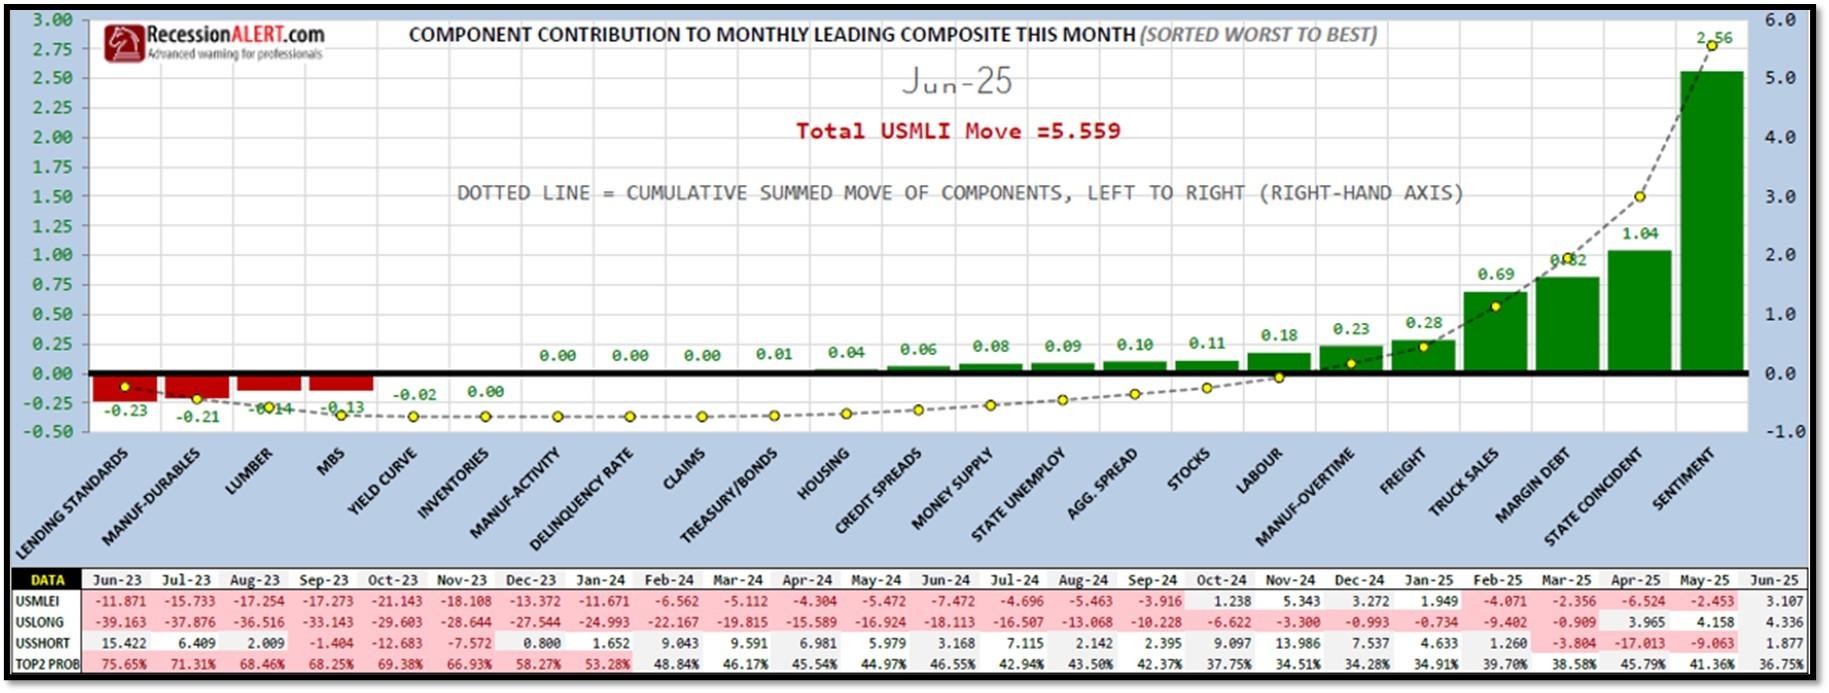
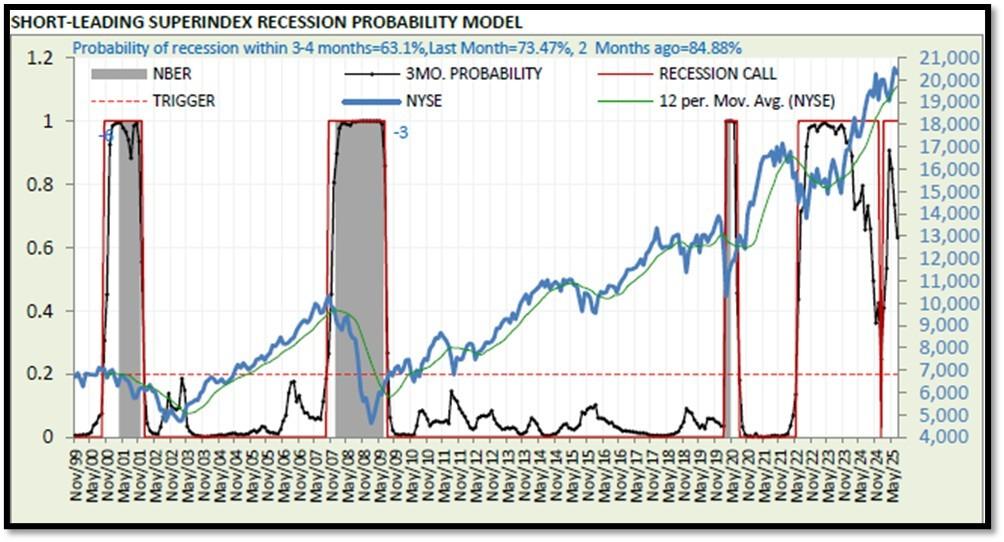
5F. Probability of U.S. falling into Recession within 3 to 4 months is currently at 63.1% (with data as of 08/4/2025 – Next Report 08/18/2025) according to RecessionAlert Research. Last release’s data was at 82.02%. This report is updated every two weeks. REF: RecessionAlertResearch
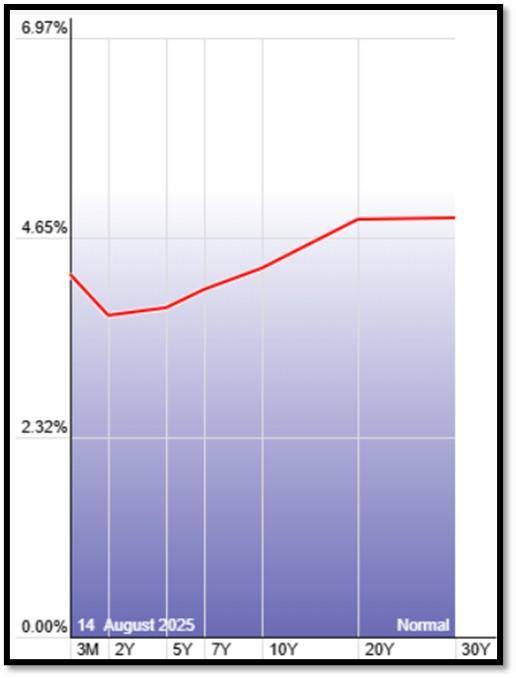
5G. Yield Curve as of 8/14/2025 is showing Normal. Spread on the 10-yr Treasury Yield (4.21%) minus yield on the 2-yr Treasury Yield (3.70%) is currently at 51bps. REF: Stockcharts The yield curve—specifically, the spread between the interest rates on the ten-year Treasury note and the three-month Treasury bill—is a valuable forecasting tool. It is simple to use and significantly outperforms other financial and macroeconomic indicators in predicting recessions two to six quarters ahead. REF: NYFED
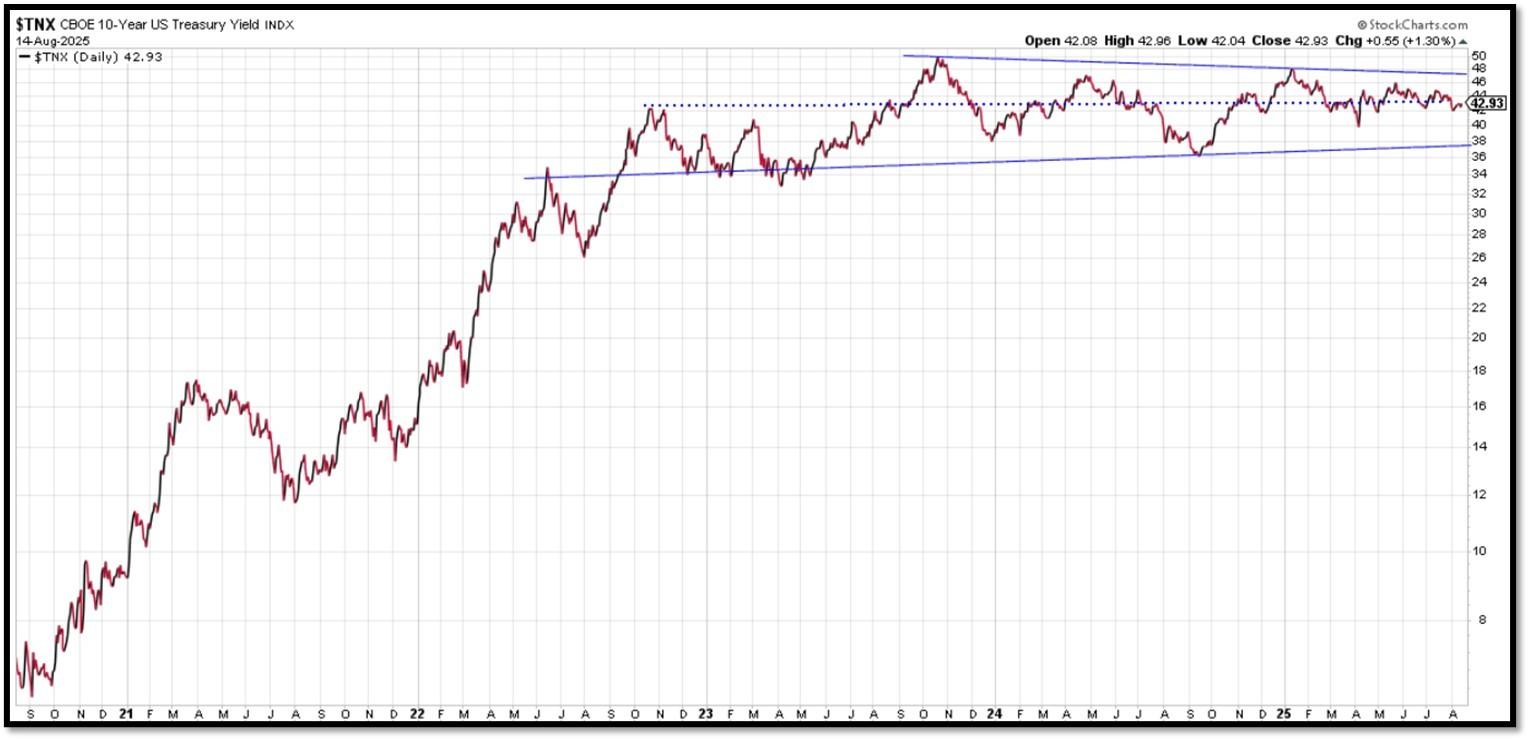
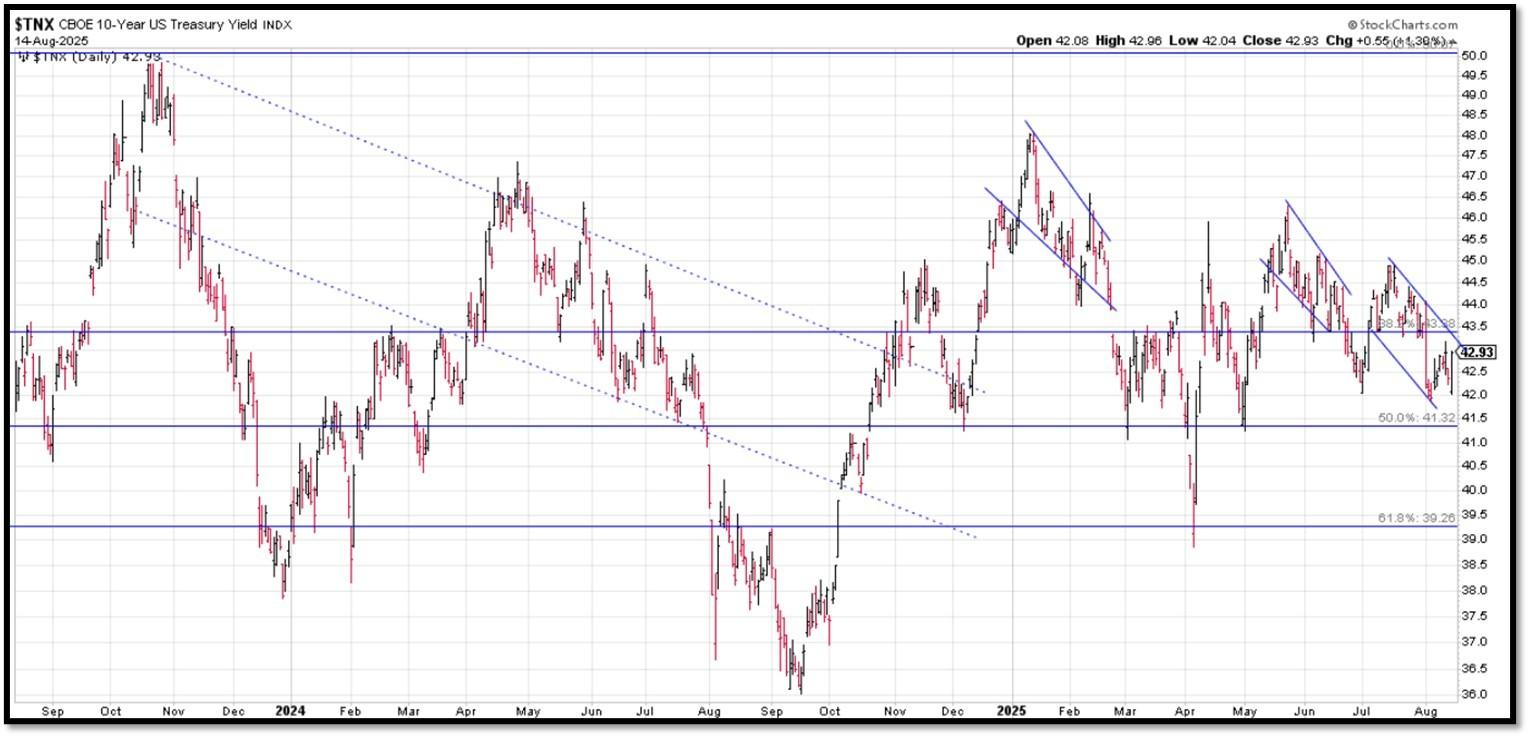
5H. Recent Yields in 10-Year Government Bonds. REF: Source is from Bloomberg.com, dated 8/14/2025, rates shown below are as of 8/14/2025, subject to change.
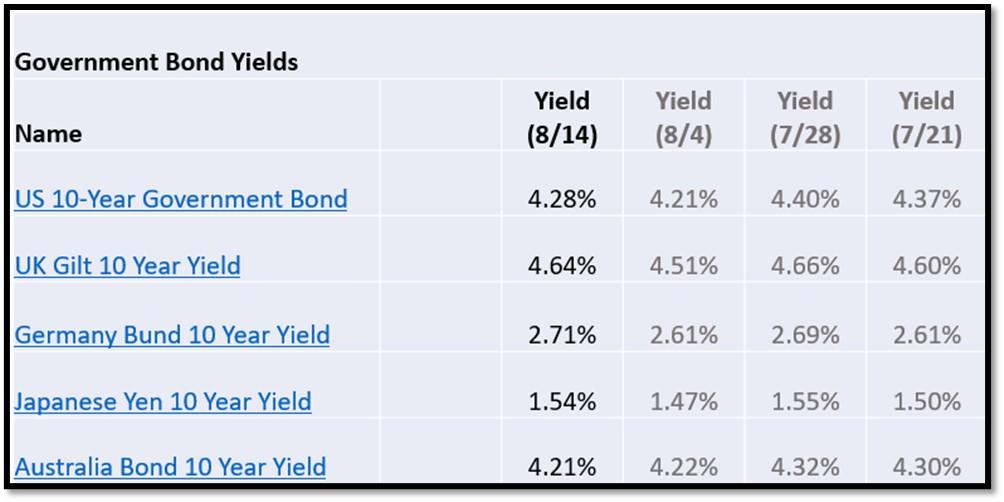
The 10-Year US Treasury Yield… The 10-Year Yield is indirectly related to inflation. I expect the 10-Year Yield to drop further as dis-inflation kicks in. REF: StockCharts1, StockCharts2
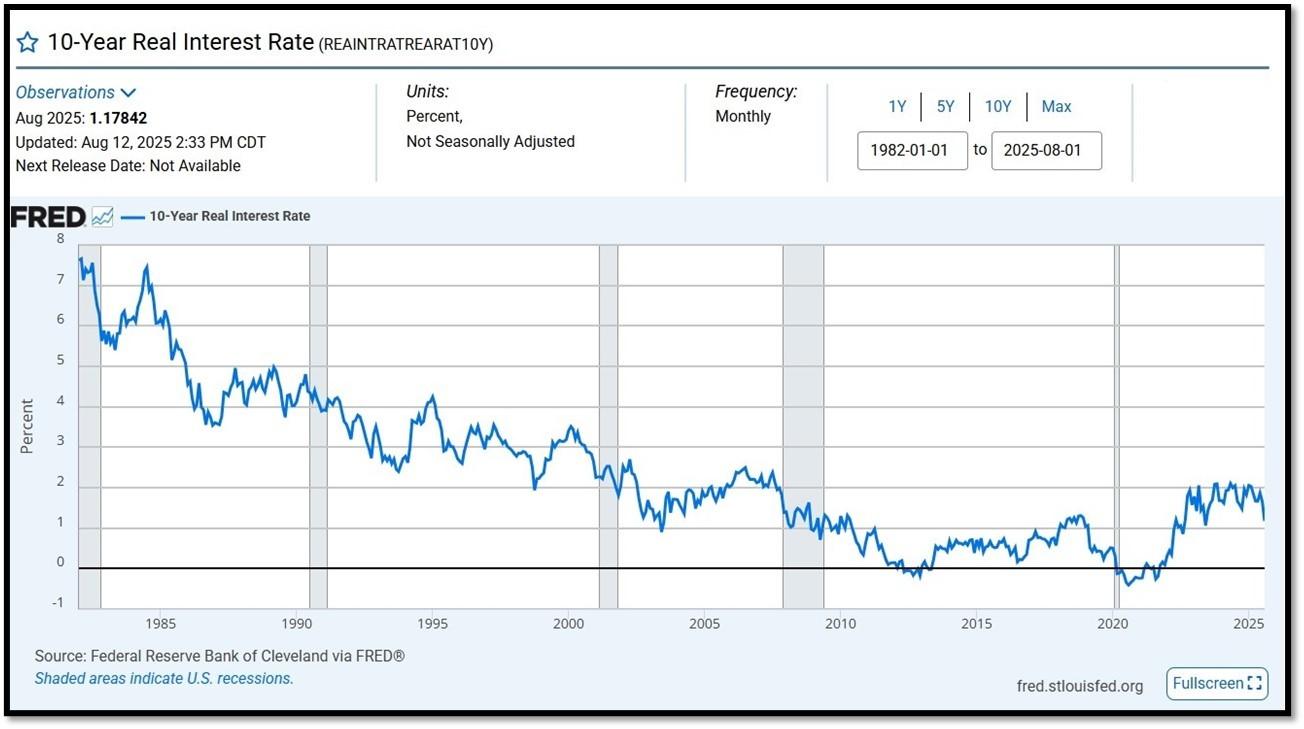
10-Year Real Interest Rate at 1.17842% as of 8/12/25. Last month’s data was 1.64906%. REF: REAINTRATREARAT10Y
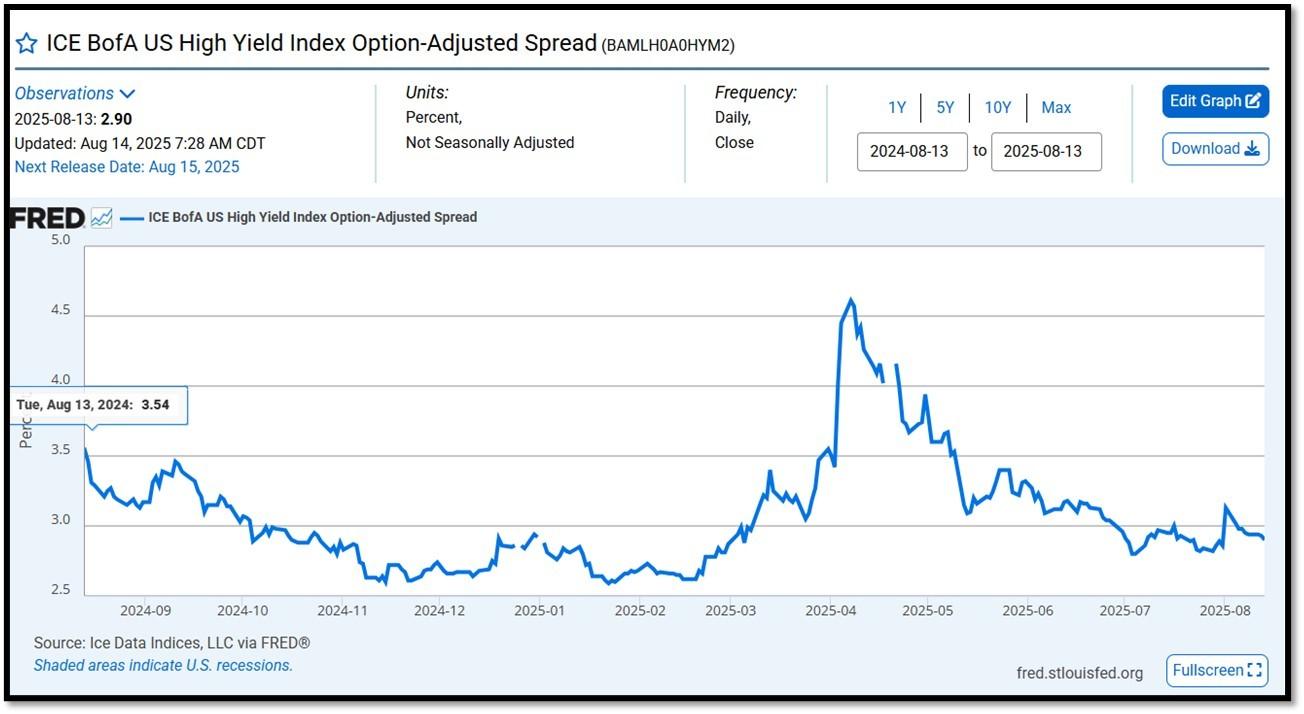
ICE BofA US High Yield Index Option-Adjusted Spread (BAMLH0A0HYM2) currently at 2.90 as of August 14, 2025. This is a key indicator of market sentiment, particularly regarding risk and economic health. At its core, the spread reflects the extra return investors demand to hold riskier corporate debt over safer government securities. High-yield bonds are issued by companies with lower credit ratings (below investment grade, like BB or lower), meaning they carry a higher chance of default. The spread compensates for this risk. When the spread is narrow—say, around 2.5% to 3%, as seen recently—it suggests investors are confident, willing to accept less extra yield because they perceive lower default risk or a strong economy. Narrow spreads often align with bullish markets, where cash is flowing, growth is steady, and fear is low. REF: FRED-BAMLH0A0HYM2
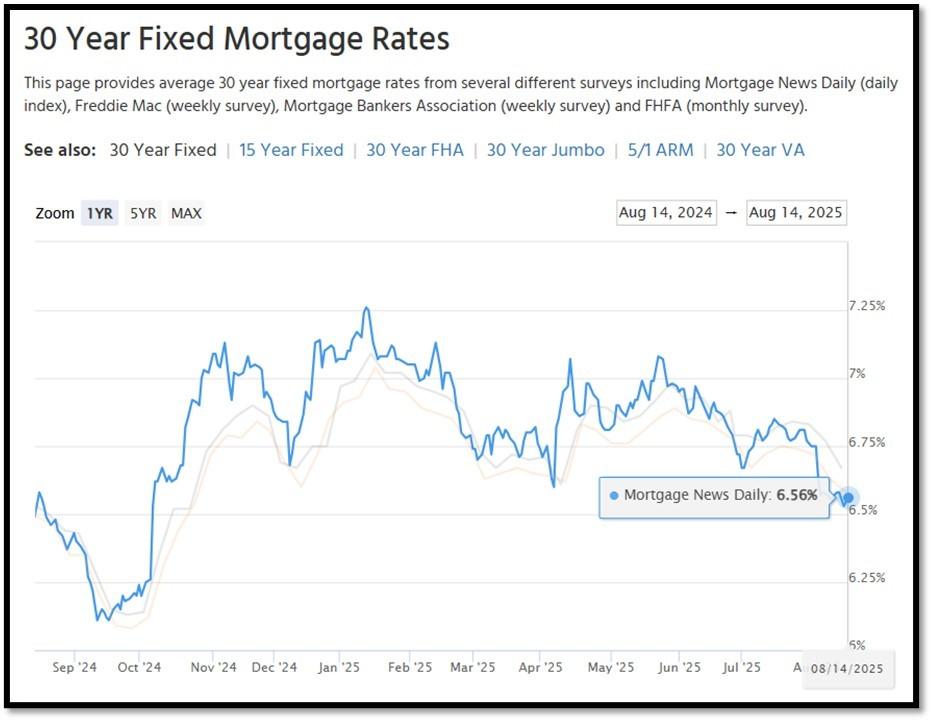
5I. (8/14/2025) Today’s National Average 30-Year Fixed Mortgage Rate is 6.56% (All Time High was 8.03% on 10/19/23). Last week’s data was 6.57%. This rate is the average 30-year fixed mortgage rates from several different surveys including Mortgage News Daily (daily index), Freddie Mac (weekly survey), Mortgage Bankers Association (weekly survey) and FHFA (monthly survey). REF: MortgageNewsDaily, Today’s Average Rate
The recent spike in the 30-year fixed-rate jumbo mortgage to 6.56%, compared to Freddie Mac’s rate at 6.58% and the Mortgage Bankers Association (MBA) rate at 6.67%, highlights key differences in the mortgage market. Jumbo mortgages, which exceed the conforming loan limits set by government agencies like Freddie Mac, typically carry higher interest rates because they are riskier for lenders. These loans are not backed by government entities, which increases the risk for lenders and, consequently, leads to higher rates. In contrast, Freddie Mac and MBA provide averages for conforming loans, which meet federal guidelines and have lower risk due to government backing, keeping their rates lower.
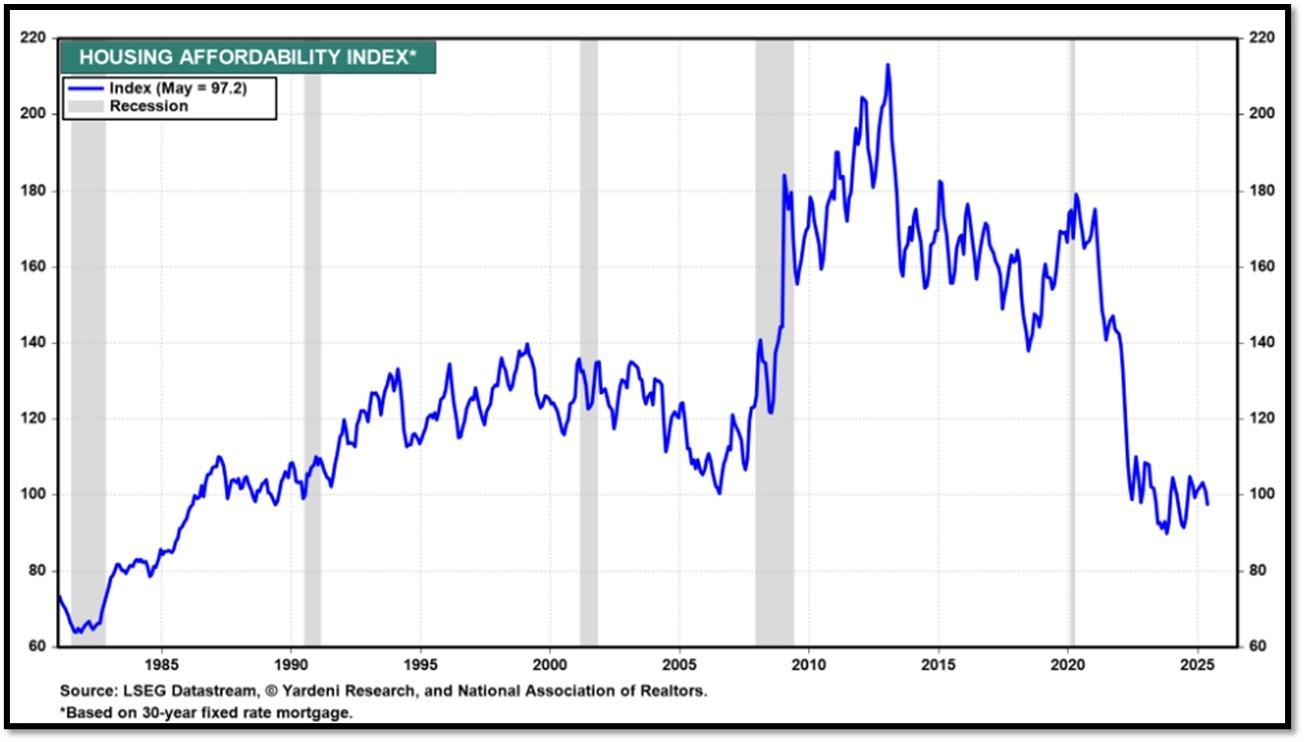
Housing Affordability Index for May = 97.2 // Apr = 101.0 // Mar = 103.2 // Feb = 102.2 // Jan = 100.7 // Dec = 100.7 // Nov = 99 // Oct = 102.3. Data provided by Yardeni Research. REF: Yardeni
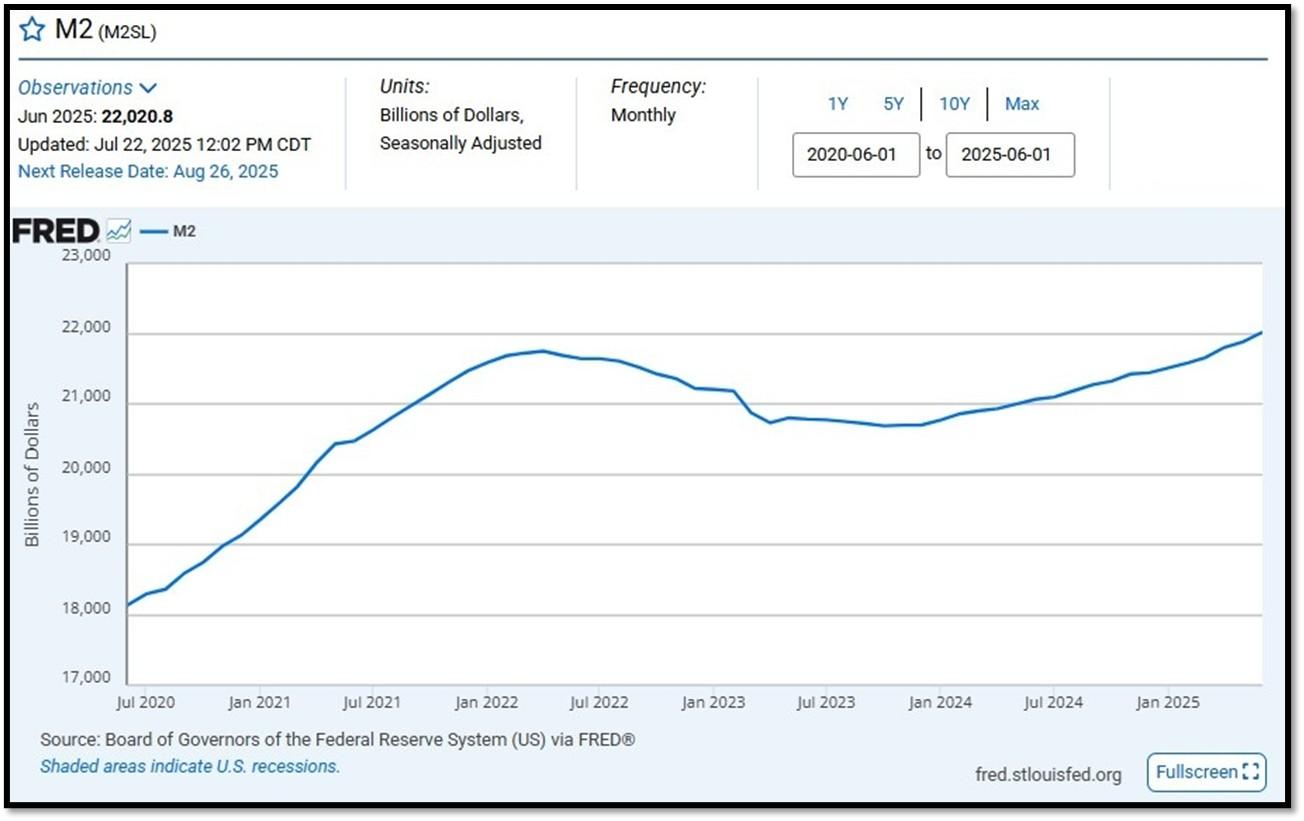
5J. Velocity of M2 Money Stock (M2V) with current read at 1.385 as of (Q2-2025 updated 7/30/2025). Previous quarter’s data was 1.386. The velocity of money is the frequency at which one unit of currency is used to purchase domestically- produced goods and services within a given time period. In other words, it is the number of times one dollar is spent to buy goods and services per unit of time. If the velocity of money is increasing, then more transactions are occurring between individuals in an economy. Current Money Stock (M2) report can be viewed in the reference link. REF: St.LouisFed-M2V
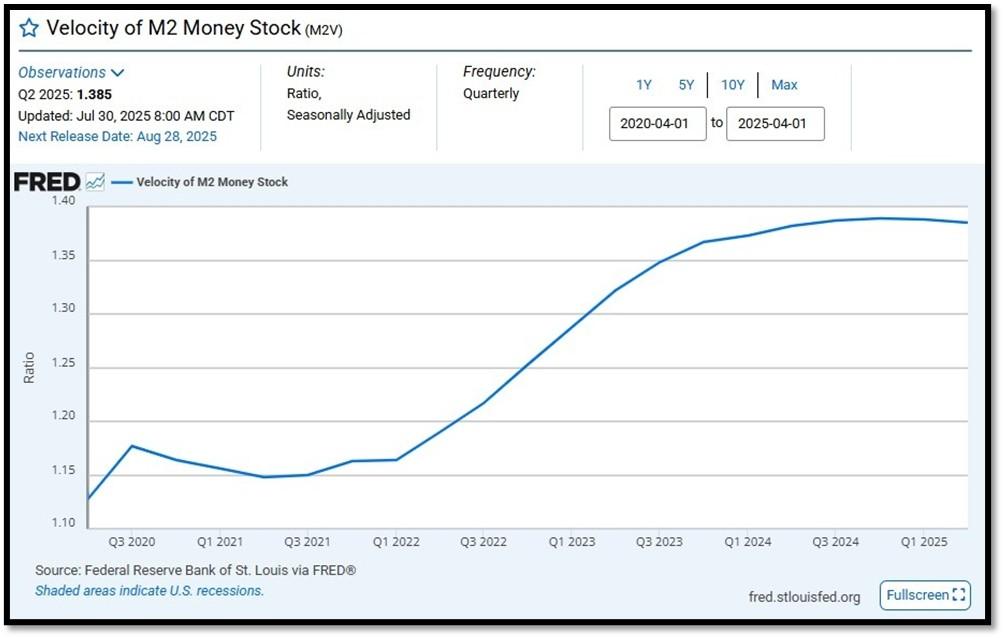
M2 consists of M1 plus (1) small-denomination time deposits (time deposits in amounts of less than $100,000) less IRA and Keogh balances at depository institutions; and (2) balances in retail MMFs less IRA and Keogh balances at MMFs. Seasonally adjusted M2 is constructed by summing savings deposits (before May 2020), small-denomination time deposits, and retail MMFs, each seasonally adjusted separately, and adding this result to seasonally adjusted M1. Board of Governors of the Federal Reserve System (US), M2 [M2SL], retrieved from FRED, Federal Reserve Bank of St. Louis; Updated on July 22, 2025. REF: St.LouisFed-M2
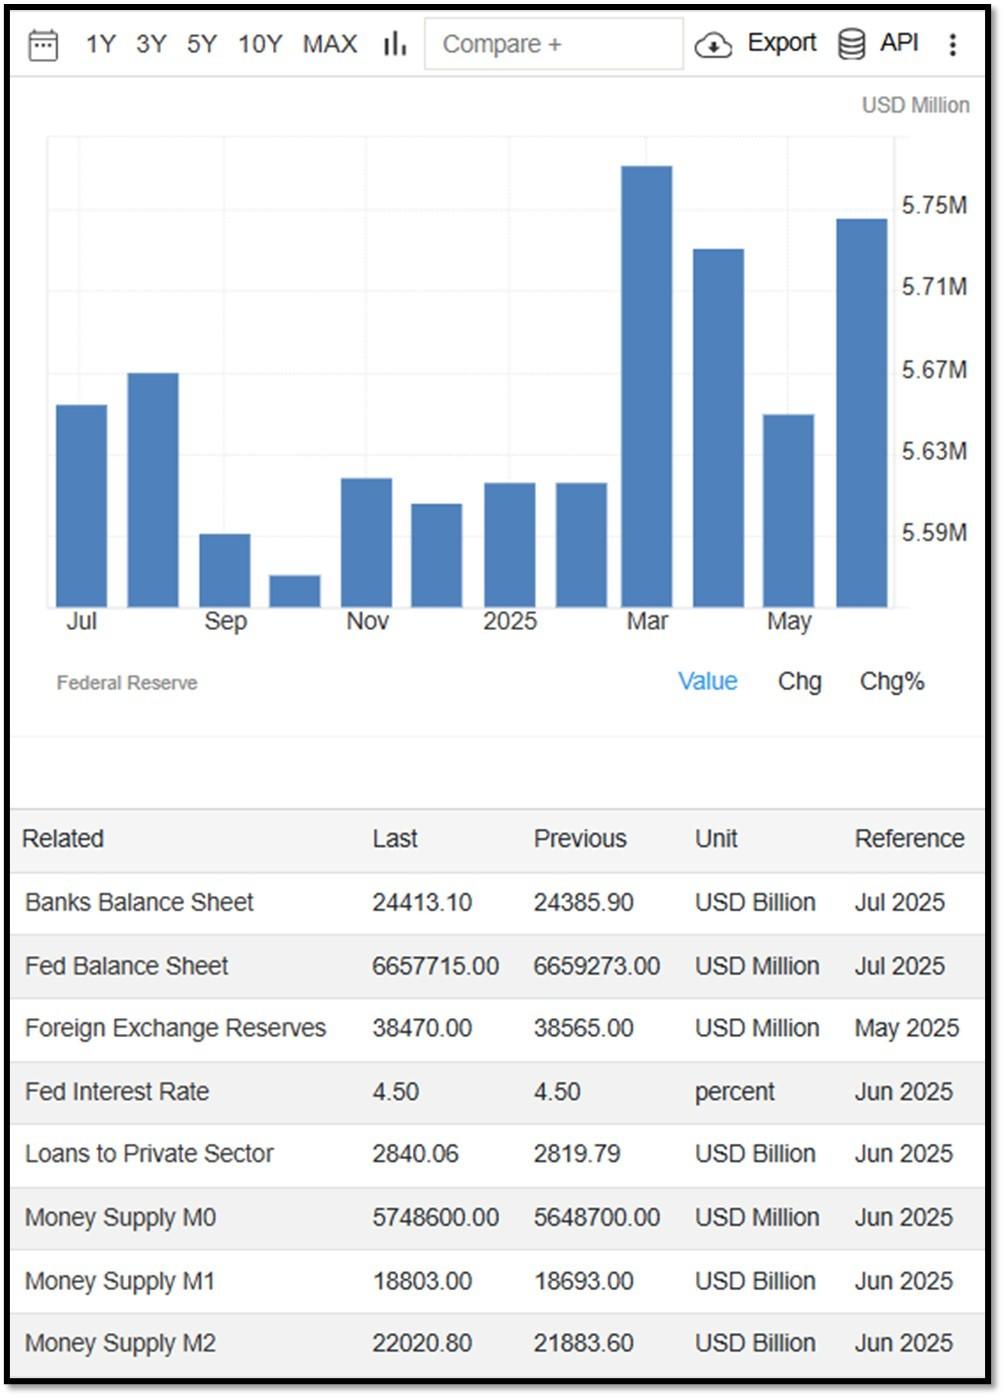
Money Supply M0 in the United States increased to 5,748,600 USD Million in June from 5,648,700 USD Million in May of 2025. Money Supply M0 in the United States averaged 1,200,279.70 USD Million from 1959 until 2025, reaching an all-time high of 6,413,100.00 USD Million in December of 2021 and a record low of 48,400.00 USD Million in February of 1961. REF: TradingEconomics, M0
5K. In July, the Consumer Price Index for All Urban Consumers rose 0.2 percent, seasonally adjusted, and rose 2.7 percent over the last 12 months, not seasonally adjusted. The index for all items less food and energy increased 0.3 percent in July (SA); up 3.1 percent over the year (NSA). August 2025 CPI data are scheduled to be released on September 11, 2025, at 8:30AM-ET. REF: BLS, BLS.GOV
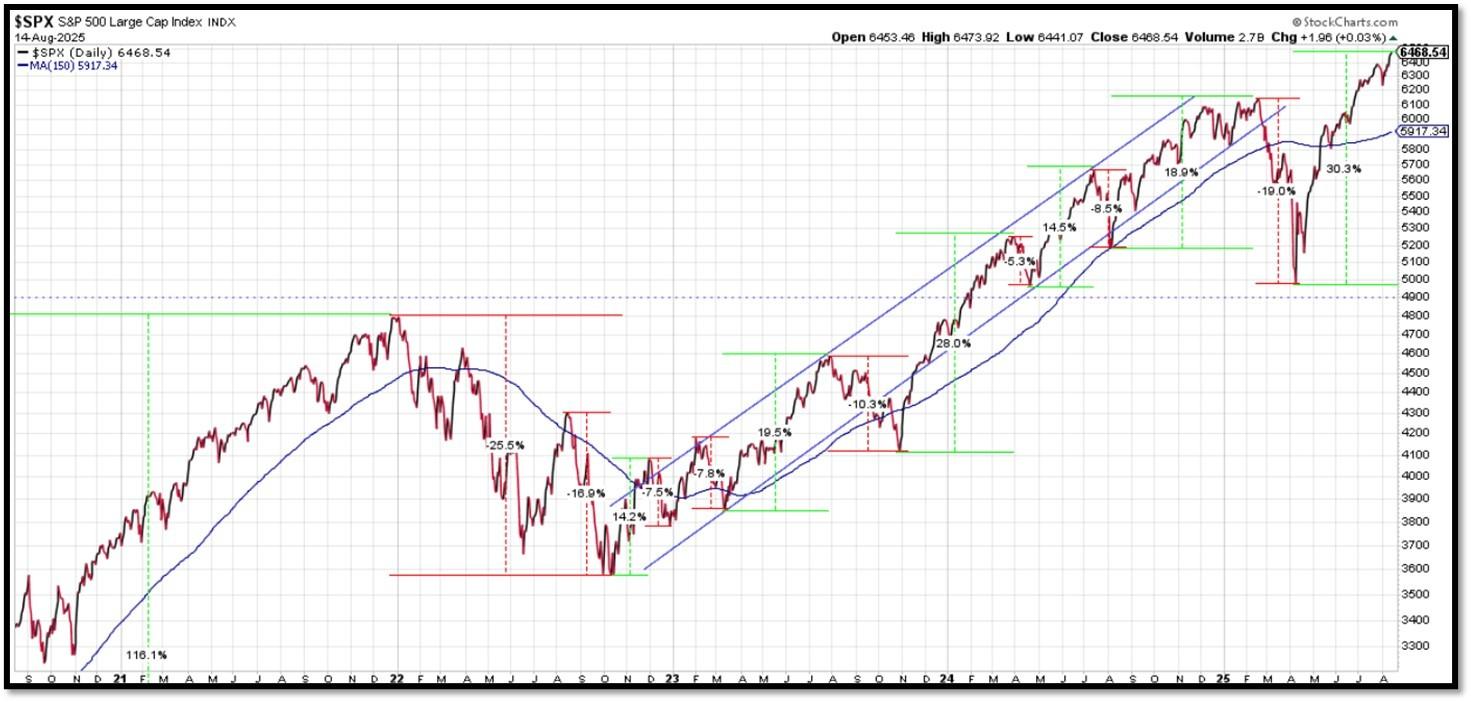
5L. Technical Analysis of the S&P500 Index. Click onto reference links below for images.
- Short-term Chart: Trend Bullish on 8/14/2025 – REF: Short-term S&P500 Chart by Marc Slavin (Click Here to Access Chart)
- Medium-term Chart: Trend Bearish to Bullish on 8/14/2025 – REF: Medium-term S&P500 Chart by Marc Slavin (Click Here to Access Chart)
- Market Timing Indicators – S&P500 Index as of 8/12/2025 – REF: S&P500 Charts (7 of them) by Joanne Klein’s Top 7 (Click Here to Access Updated Charts)
- The S&P500 is hitting all-time-high, rebounding from a V-shaped recovery. This is one of the ‘most-hated’ rallies. REF: Stockcharts
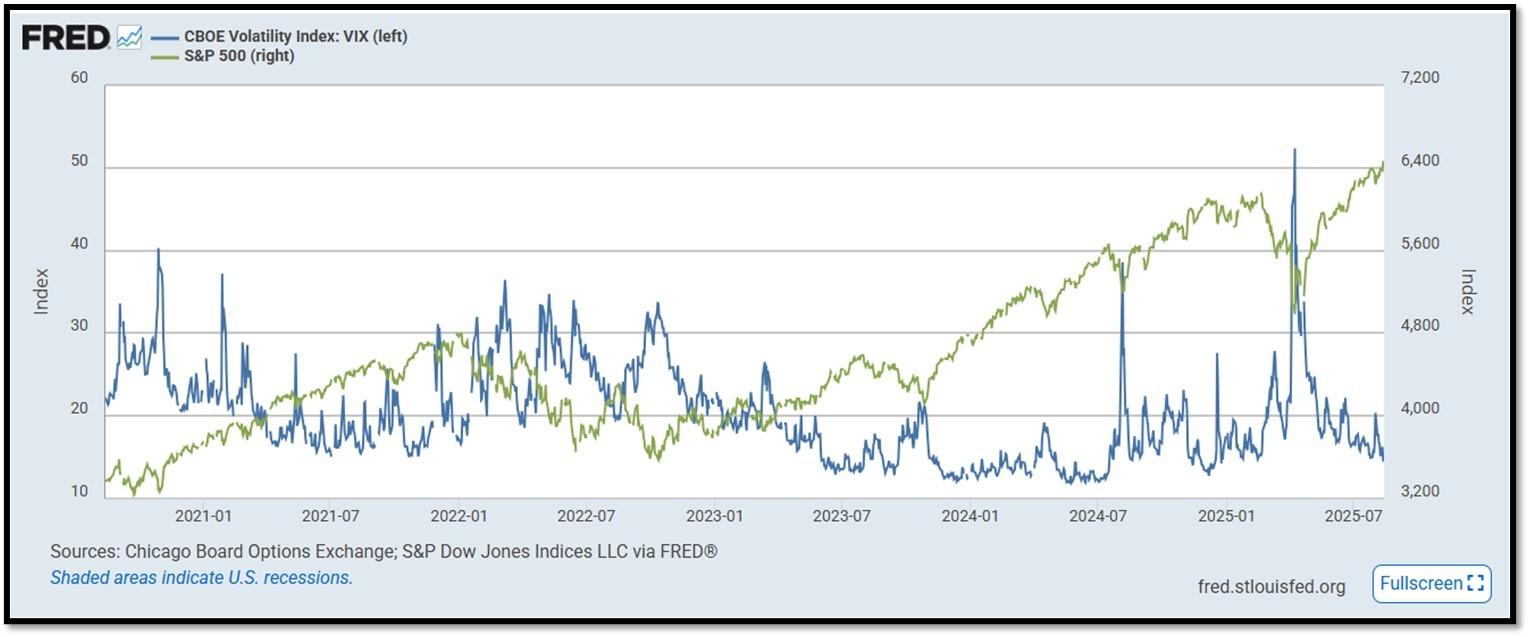
- S&P500 and CBOE Volatility Index (VIX) as of 8/14/2025. REF: FRED, Today’s Print
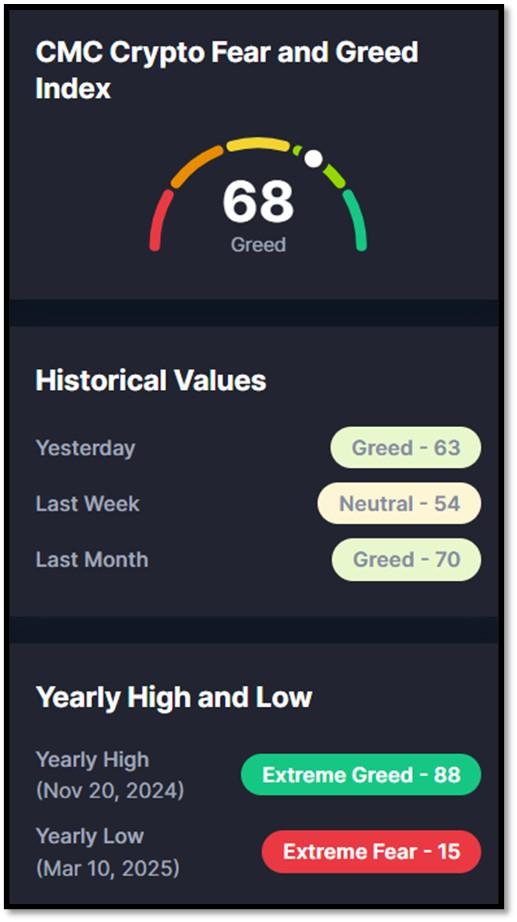
5M. Most recent read on the Crypto Fear & Greed Index with data as of 8/14/2025 is 68 (Greed). Last week’s data was 54 (Neutral) (1-100). Fear & Greed Index – A Contrarian Data. The crypto market behavior is very emotional. People tend to get greedy when the market is rising which results in FOMO (Fear of missing out). Also, people often sell their coins in irrational reaction of seeing red numbers. With the Crypto Fear and Greed Index, the data try to help save investors from their own emotional overreactions. There are two simple assumptions:
- Extreme fear can be a sign that investors are too worried. That could be a buying opportunity.
- When Investors are getting too greedy, that means the market is due for a correction.
Therefore, the program for this index analyzes the current sentiment of the Bitcoin market and crunch the numbers into a simple meter from 0 to 100. Zero means “Extreme Fear”, while 100 means “Extreme Greed”. REF: Coinmarketcap.com, Today’sReading
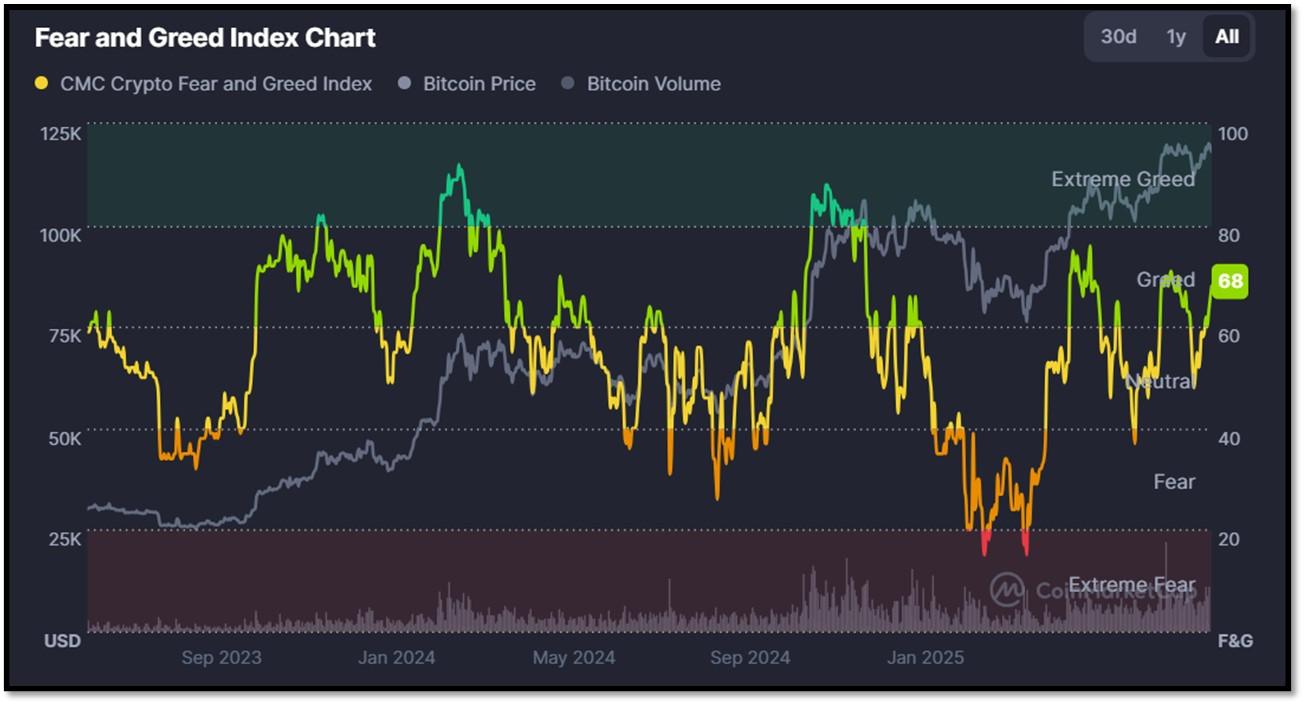
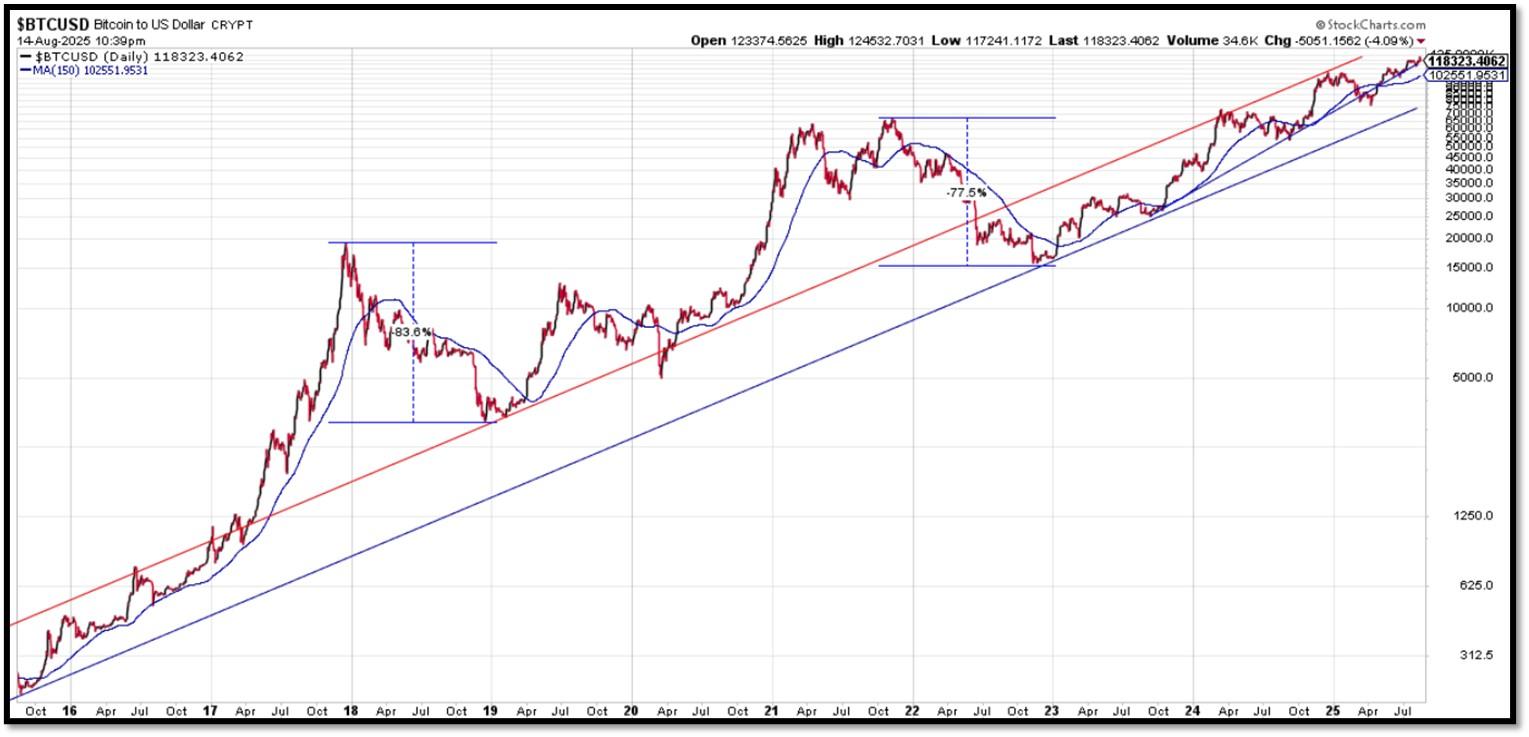
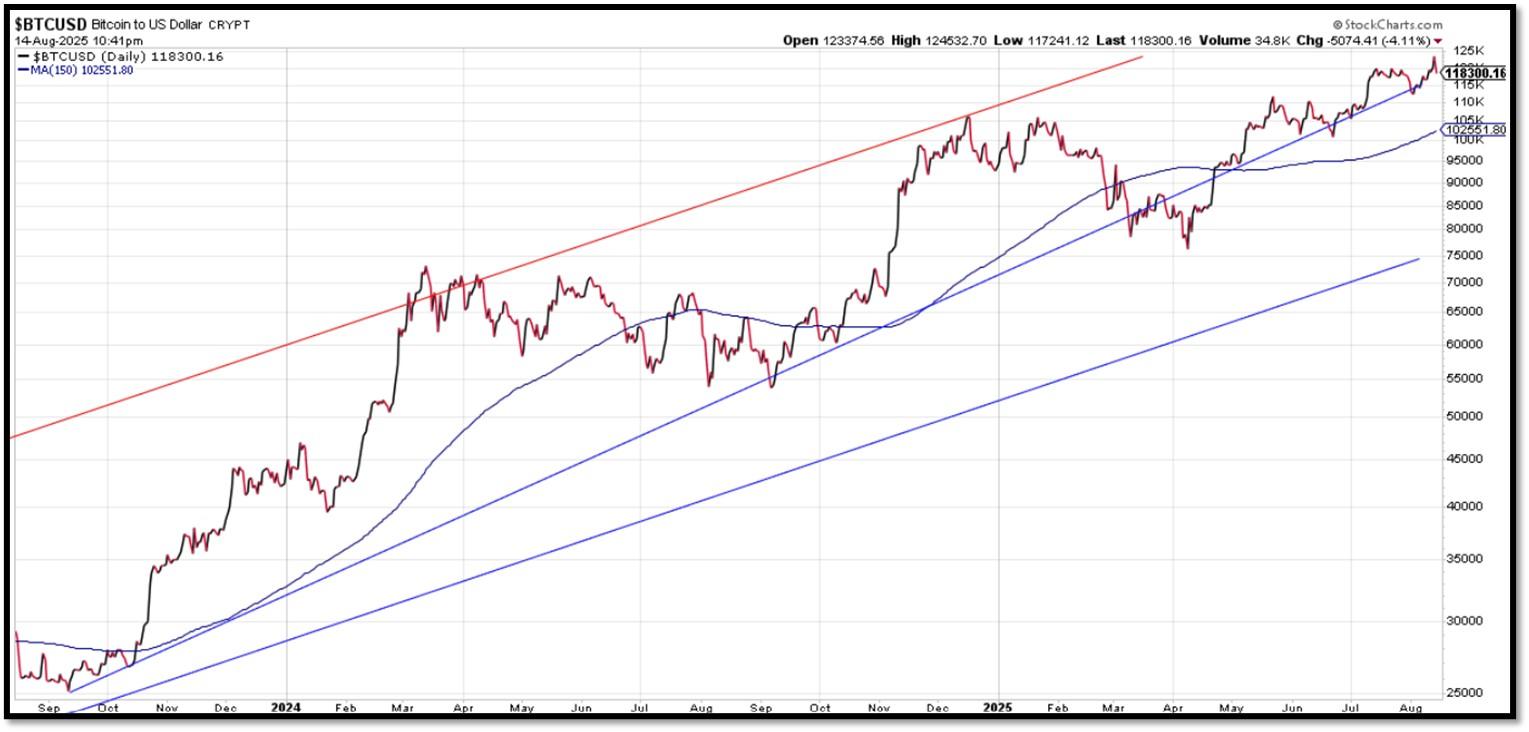
Bitcoin – 10-Year & 2-Year Charts. REF: Stockcharts10Y, Stockcharts2Y
From the desk of our Chief Investment Officer
As an investment professional with over twenty-six years of experience in the financial services industry, Andrew helps clients to protect, grow and transfer wealth during their lifetime with objective, unbiased, customized and efficient strategies.
Education, Professional Licenses Acquired & Affiliations
- Passed the Series 7, 63, 65 and 24 license examinations
- Currently holding Series 65 License
- BA in Economics – Boston University (Boston, MA) 1993
- Certificate in Commodities Trading – New York University (New York, NY) 1991
- Certificate in Financial Planning – New York University (New York, NY) April 2011
With extensive experience in the Financial Services Industry, Andrew Tang and Turner Financial Group provides disciplined wealth management with an intelligent caring approach to each and every client that compliments the Dedicated Financial offering.


Len writes much of his own content, and also shares helpful content from other trusted providers like Turner Financial Group (TFG).
The material contained herein is intended as a general market commentary, solely for informational purposes and is not intended to make an offer or solicitation for the sale or purchase of any securities. Such views are subject to change at any time without notice due to changes in market or economic conditions and may not necessarily come to pass. This information is not intended as a specific offer of investment services by Dedicated Financial and Turner Financial Group, Inc.
Dedicated Financial and Turner Financial Group, Inc., do not provide tax, legal or accounting advice. You should consult your own tax, legal and accounting advisors before engaging in any transaction.
Any hyperlinks in this document that connect to Web Sites maintained by third parties are provided for convenience only. Turner Financial Group, Inc. has not verified the accuracy of any information contained within the links and the provision of such links does not constitute a recommendation or endorsement of the company or the content by Dedicated Financial or Turner Financial Group, Inc. The prices/quotes/statistics referenced herein have been obtained from sources verified to be reliable for their accuracy or completeness and may be subject to change.
Past performance is no guarantee of future returns. Investing involves risk and possible loss of principal capital. The views and strategies described herein may not be suitable for all investors. To the extent referenced herein, real estate, hedge funds, and other private investments can present significant risks, including loss of the original amount invested. All indexes are unmanaged, and an individual cannot invest directly in an index. Index returns do not include fees or expenses.
Turner Financial Group, Inc. is an Investment Adviser registered with the United States Securities and Exchange Commission however, such registration does not imply a certain level of skill or training and no inference to the contrary should be made. Additional information about Turner Financial Group, Inc. is also available at www.adviserinfo.sec.gov. Advisory services are only offered to clients or prospective clients where Turner Financial Group, Inc. and its representatives are properly licensed or exempt from licensure. No advice may be rendered by Turner Financial Group, Inc. unless a client service agreement is in place.


