

- 1. This week’s economic data, reported through August 22, 2025, painted a mixed picture of the U.S. economy, with key indicators reflecting both resilience and challenges.
- 2. In his August 2025 Jackson Hole keynote, Federal Reserve Chairman Jerome Powell indicated a potential 25-basis-point rate cut in September, citing easing inflation near the Fed’s 2% target, with core PCE at 2.6%, and rising labor market concerns, including a 4.3% unemployment rate and slowing job growth.
- 3. ARK team members Frank Downing and Sam Korus tested Tesla’s newly launched robotaxi service in Austin, Texas, as part of their research into the rapidly advancing autonomous driving and robotaxi market.
- 4. World Watch
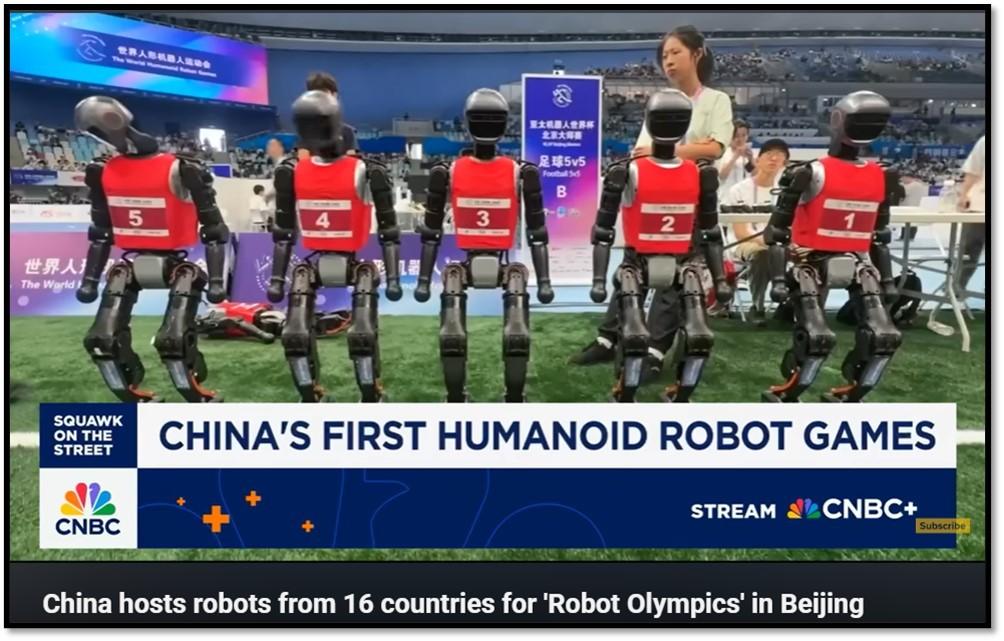
- 4A. China hosts robots from 16 countries for ‘Robot Olympics’ in Beijing – Beijing hosted the World Humanoid Robot Games in August, known as the “Robot Olympics,” a three-day event at the National Speed Skating Oval, a 2022 Winter Olympics venue.
- 4B. At the turn of the millennium, Honda unveiled Asimo in 2000, a pioneering humanoid robot that symbolized Japan’s leadership in robotics, captivating the world with its ability to walk, climb stairs, and perform basic tasks, reflecting decades of Japanese innovation in automation and a cultural affinity for robots as societal partners.
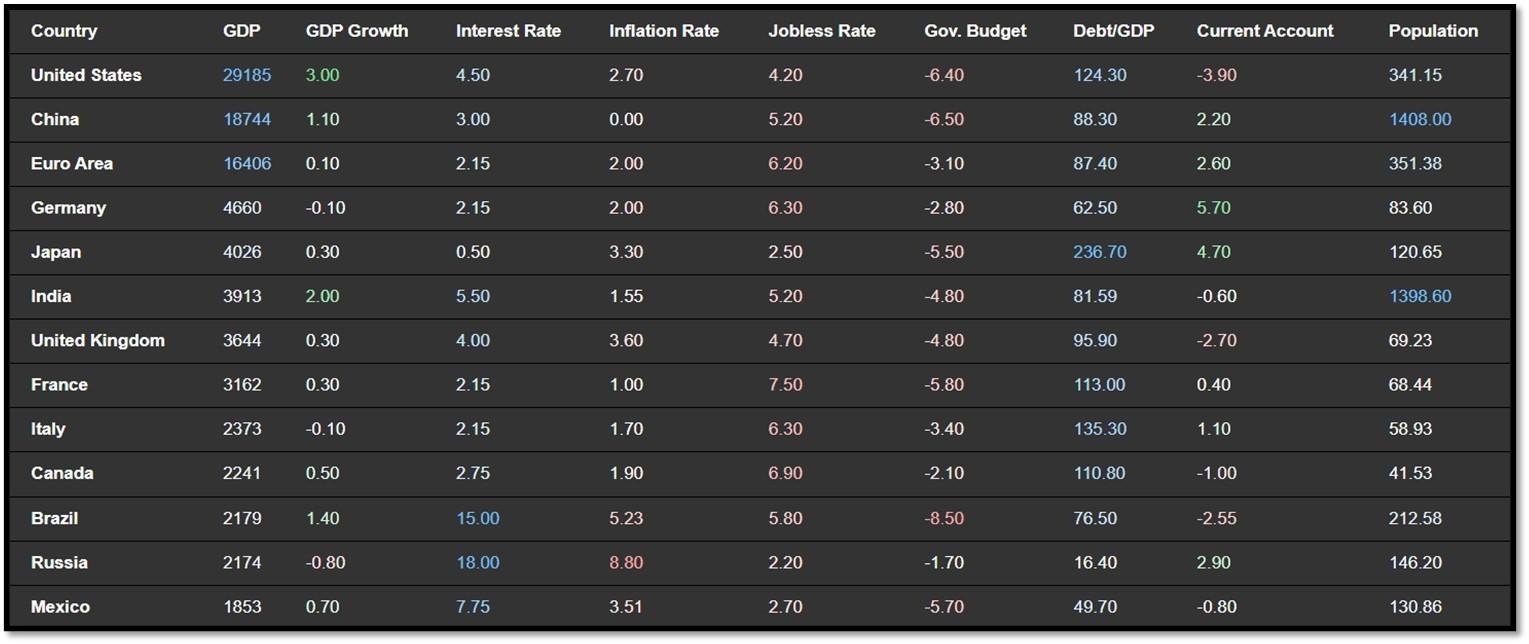
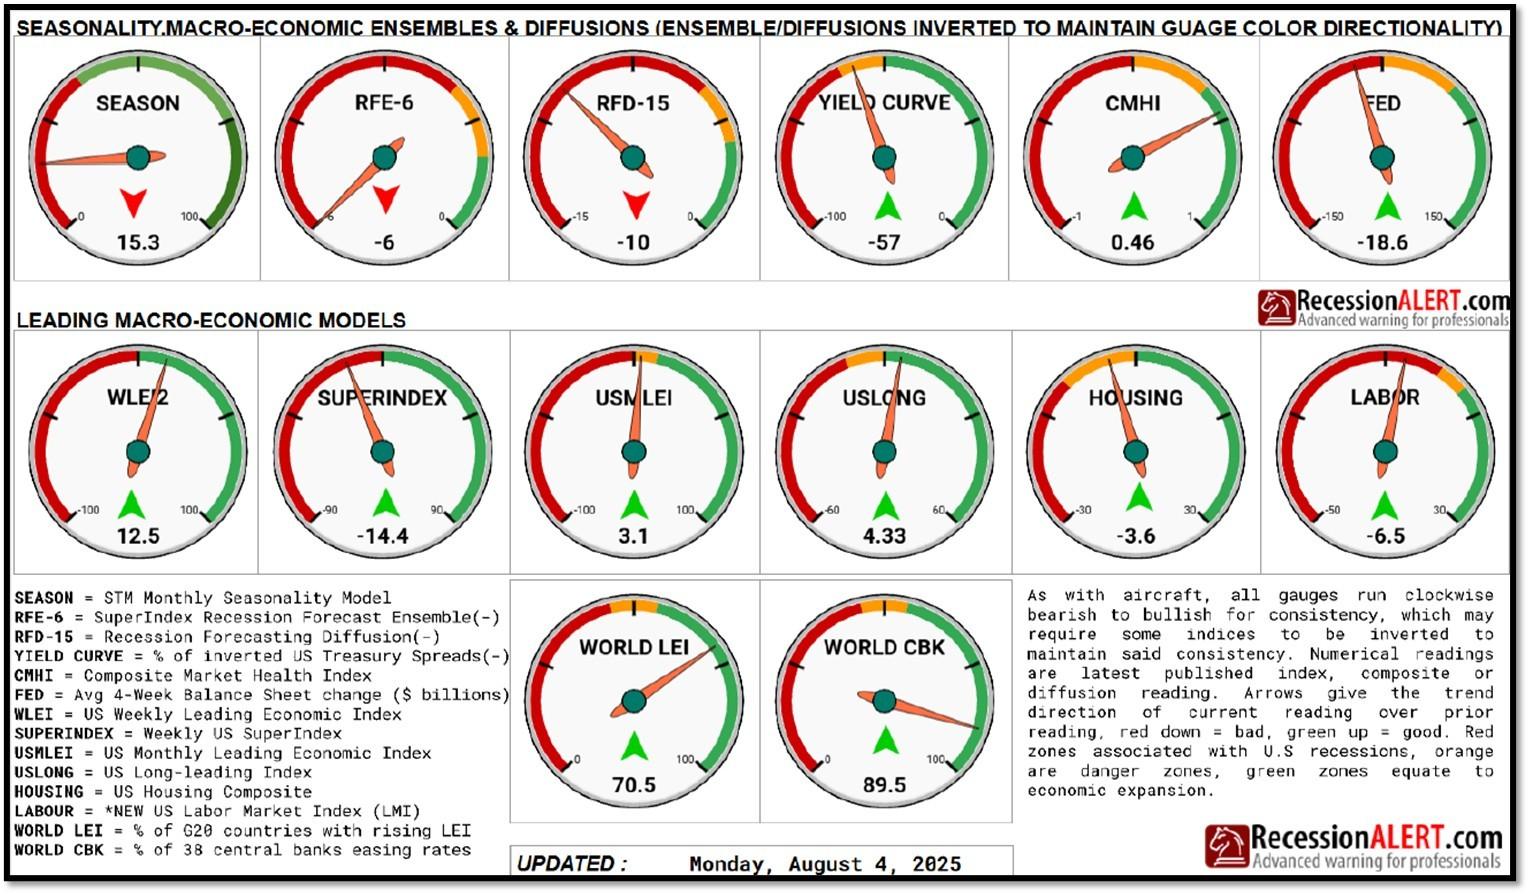
- 4C. An updated snapshot of the current global state of economy
- 5. Quant & Technical Corner – A selection of quantitative & technical data we monitor on a regular basis to help gauge the overall financial market conditions and the investment environment.
1. This week’s economic data, reported through August 22, 2025, painted a mixed picture of the U.S. economy, with key indicators reflecting both resilience and challenges.
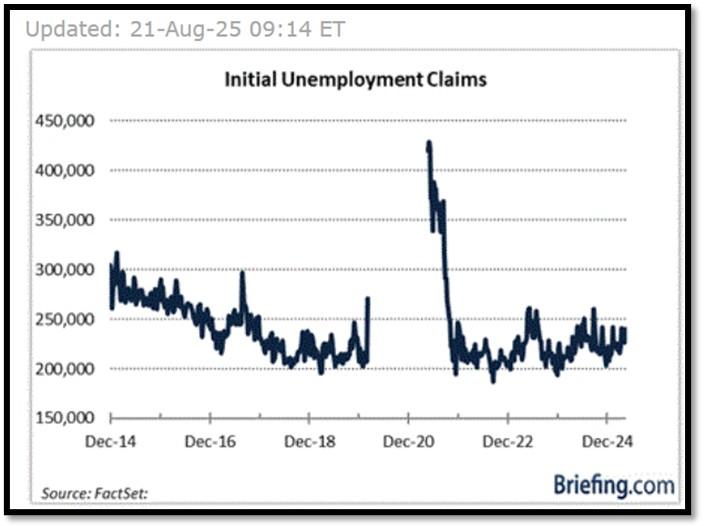
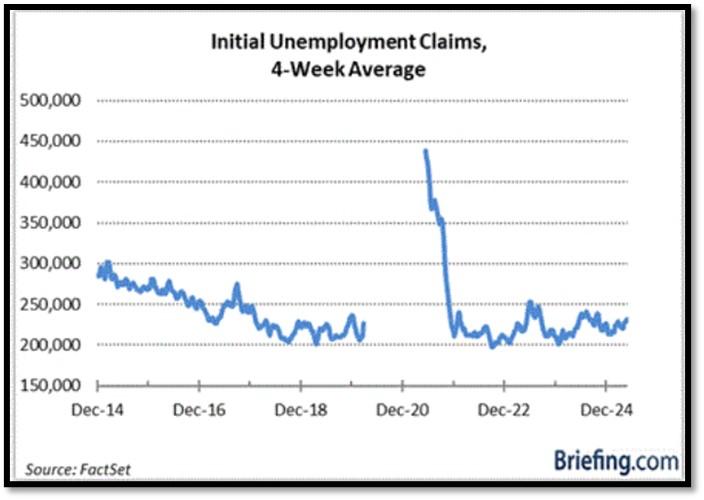
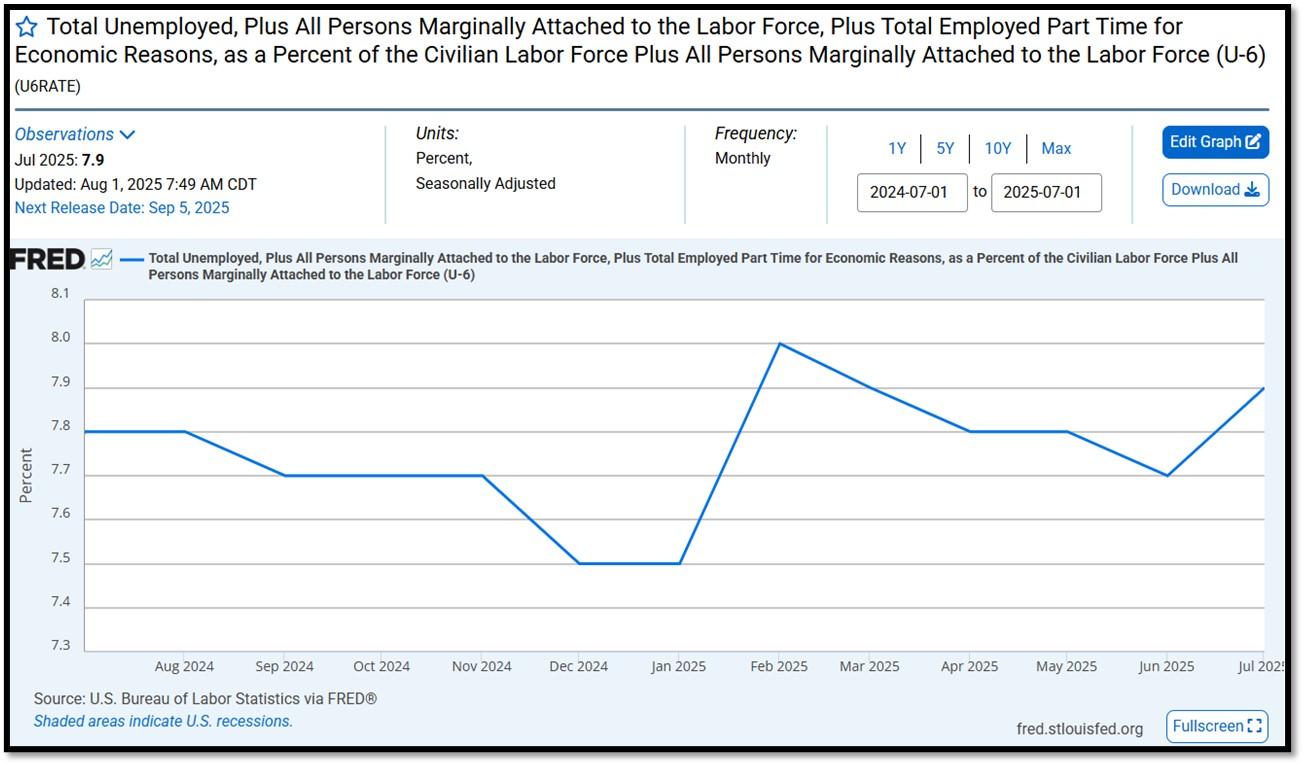
Housing starts surged to a seasonally adjusted annual rate of 1.428 million units in July, a 5.2% increase from June’s 1.358 million, exceeding forecasts of 1.350 million, driven by strong multifamily unit demand, though building permits dipped 2.8% to 1.354 million, below the expected 1.420 million, signaling potential slowdowns in future construction due to high mortgage rates and economic uncertainty. The MBA Mortgage Applications Index fell from 12.5% to 7.2%, reflecting reduced demand as 30-year fixed mortgage rates hovered near 7%, dampening homebuyer enthusiasm. Crude oil inventories, reported by the EIA, showed a significant drawdown, surpassing market expectations, which supported oil prices despite a drop below $63 per barrel, indicating tighter supply amid geopolitical tensions. Initial jobless claims rose to 235,000 for the week ending August 16, slightly above the forecast of 230,000, suggesting a modest labor market softening, though still at historically low levels. These trends, coupled with Federal Reserve Chairman Jerome Powell’s Jackson Hole speech signaling a potential 25-basis-point rate cut in September due to easing inflation (core PCE at 2.6%) and labor market concerns (unemployment at 4.3%), suggest a cautious monetary policy shift to stimulate growth, though persistent wage pressures and tariff-related uncertainties could temper optimism, potentially impacting consumer confidence and housing market recovery. REF: Briefing, U-6
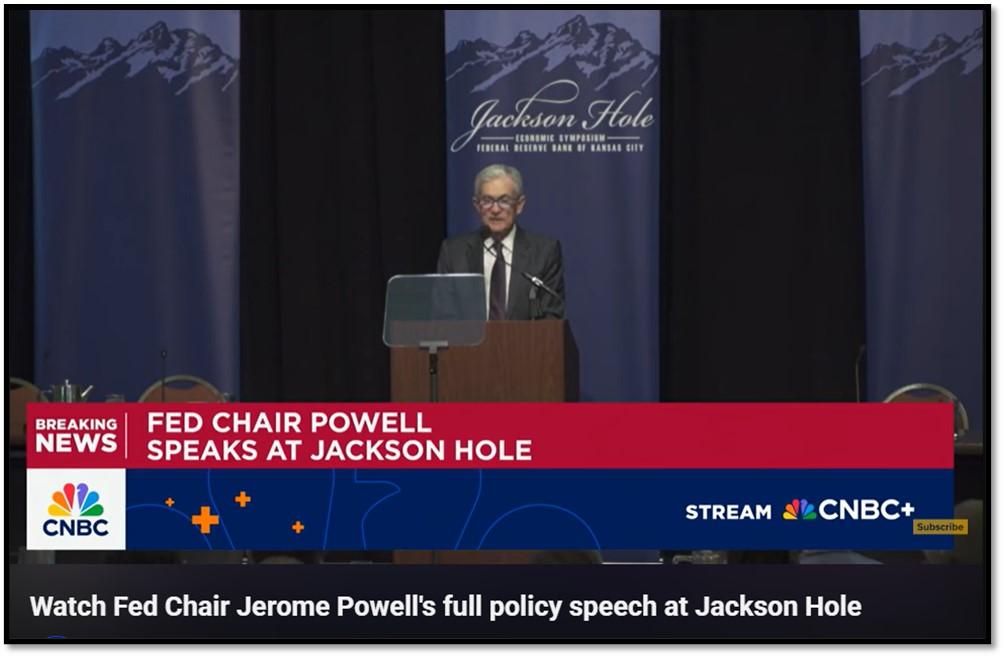
2. In his August 2025 Jackson Hole keynote, Federal Reserve Chairman Jerome Powell indicated a potential 25-basis-point rate cut in September, citing easing inflation near the Fed’s 2% target, with core PCE at 2.6%, and rising labor market concerns, including a 4.3% unemployment rate and slowing job growth.
This shift from the Fed’s 2022-2023 rate hikes, with the federal funds rate at 5.25-5.5%, reflects a response to softening economic demand and global uncertainties. Powell’s data-dependent stance balances growth stimulation against risks like wage pressures and geopolitical shocks, signaling a cautious approach to monetary policy adjustment. Click onto picture below to access video. REF: Bloomberg, CNBC
3. ARK team members Frank Downing and Sam Korus tested Tesla’s newly launched robotaxi service in Austin, Texas, as part of their research into the rapidly advancing autonomous driving and robotaxi market.
The invite-only pilot, utilizing 10-20 Model Y vehicles equipped with advanced Full Self-Driving (FSD) software, offered rides at a flat $4.20 rate, significantly undercutting competitors like Uber and Waymo. ARK’s analysis projects Tesla capturing a significant share of the $10 trillion global robotaxi market by 2029, leveraging its camera-only, AI-driven approach and data from over 5 million daily FSD miles. Tesla’s expansion plans include scaling the Austin service from 20 square miles to 85 square miles by August 2025, with validation vehicles spotted in areas like Kyle and Marble Falls, targeting a 450-square-mile geofence covering 10% of Austin’s metropolitan area. Tesla also secured a Texas permit in August 2025 to operate statewide without safety drivers and is pursuing regulatory approval for a San Francisco Bay Area launch by late Q3 2025, with further expansions planned for Houston, San Antonio, Arizona, and Florida by year-end. Click onto picture below to access video. ARK Invest ETFs and Venture Fund (ARKK, ARKQ, ARKF, ARKX, ARKG, and ARKVX) are part of our investment strategies covering innovations. REF: ARK, ARK-Research

NOTE: Not investment advice or recommendations. Investor should consider the investment objective, risks, charges and expenses carefully before investing. For additional information about securities mentioned above or in the video, please visit ARK Invest’s website of referenced securities mentioned above and in videos below. Read carefully before investing.
With the current macro-economic backdrop, below are areas we currently favor:
- Fixed Income – Short-term Corporates (Low-Beta)
- Fixed Income – (Corporates & Muni) High Yield as Opportunistic Allocation (Low-Beta)
- Businesses that contribute to and benefit from AI & Automation (Market-Risk)
- Fintech & Financials (Market-Risk)
- Digital Asset – Bitcoin (Market-Risk/Hedge)
- Cyber-Security & Software (Market-Risk)
- Cloud Computing (Market-Risk)
- Biotechnology (Market-Risk)
4. World Watch
4A. China hosts robots from 16 countries for ‘Robot Olympics’ in Beijing – Beijing hosted the World Humanoid Robot Games in August, known as the “Robot Olympics,” a three-day event at the National Speed Skating Oval, a 2022 Winter Olympics venue.
Over 450 humanoid robots from 250 teams across 16 countries, including China, the U.S., Germany, Japan, and Brazil, competed in 24 events, from soccer and track to practical tasks like medicine sorting and hotel cleaning. Supported by the Chinese government, the event highlighted China’s drive to lead in AI and robotics amid its rivalry with the U.S. The robots, often semi-autonomous, showcased both potential and flaws, with frequent stumbles revealing the gap between current capabilities and fully autonomous systems. This global stage underscored China’s technological ambitions and provided a testing ground for robotics innovation.
The Robot Olympics served as a laboratory for refining humanoid robots, reflecting China’s strategy to integrate AI into its economy to address labor shortages from an aging population. Universities like Tsinghua and companies like Unitree collaborated to advance robotics, with events designed to mimic real-world tasks. Despite glitches, such as robots falling or colliding, the games generated data to improve AI algorithms and autonomy. China’s massive AI investment, including a one trillion-yuan fund, positions it to dominate global robotics. Implications include accelerated AI development, potential economic shifts as robots replace human labor, and heightened geopolitical competition, particularly with the U.S., as China leverages such events to showcase technological superiority and attract global talent. However, the robots’ limitations highlight the need for further innovation to achieve reliable, widespread adoption. Click onto picture below to access video. REF: CNBC, NYT
4B. At the turn of the millennium, Honda unveiled Asimo in 2000, a pioneering humanoid robot that symbolized Japan’s leadership in robotics, captivating the world with its ability to walk, climb stairs, and perform basic tasks, reflecting decades of Japanese innovation in automation and a cultural affinity for robots as societal partners.
Twenty-five years later, by August 2025, China has taken center stage in humanoid robotics, dominating headlines with rapid advancements driven by substantial government investment and a strategic push to lead the global AI race. Events like the World Humanoid Robot Games in Beijing showcased over 450 robots from 16 countries competing in tasks from soccer to hospital logistics, highlighting China’s ambition to integrate advanced humanoid robots into its economy to address labor shortages and boost productivity. Supported by a reported one trillion-yuan fund for AI startups and collaborations between top universities like Tsinghua and companies like Unitree, China’s robots, though still prone to glitches like falls and collisions, demonstrate significant progress in AI-driven autonomy. This shift from Japan’s early dominance to China’s current prominence underscores a global race in robotics, with China leveraging its resources and scale to challenge the legacy of pioneers like Asimo while pushing the boundaries of practical humanoid applications. Click onto picture below to access video. REF: Bloomberg

4C. An updated snapshot of the current global state of economy
According to TradingEconomics as of 8/19/2025 (REF: TradingEconomics):
- China’s consumer prices were flat from a year earlier in July 2025, surpassing market expectations for a 0.1% drop and following a 0.1% gain in the previous month.
- China’s surveyed unemployment rate rose to 5.2% in July 2025, up from 5% in June and above market expectations of 5.1%.
- Japan’s GDP grew 0.3% qoq in Q2 2025, accelerating from an upwardly revised increase in Q1 and surpassing market expectations, both of which stood at 0.1%, preliminary data showed.
- The annual consumer price inflation rate in India fell to 1.55% in July of 2025 from 2.1% in the previous month, firmly below the market consensus of a 1.76%, to mark the ninth consecutive decrease in the inflation rate and only 1 basis point away from the series-low in June of 2017.
5. Quant & Technical Corner – A selection of quantitative & technical data we monitor on a regular basis to help gauge the overall financial market conditions and the investment environment.
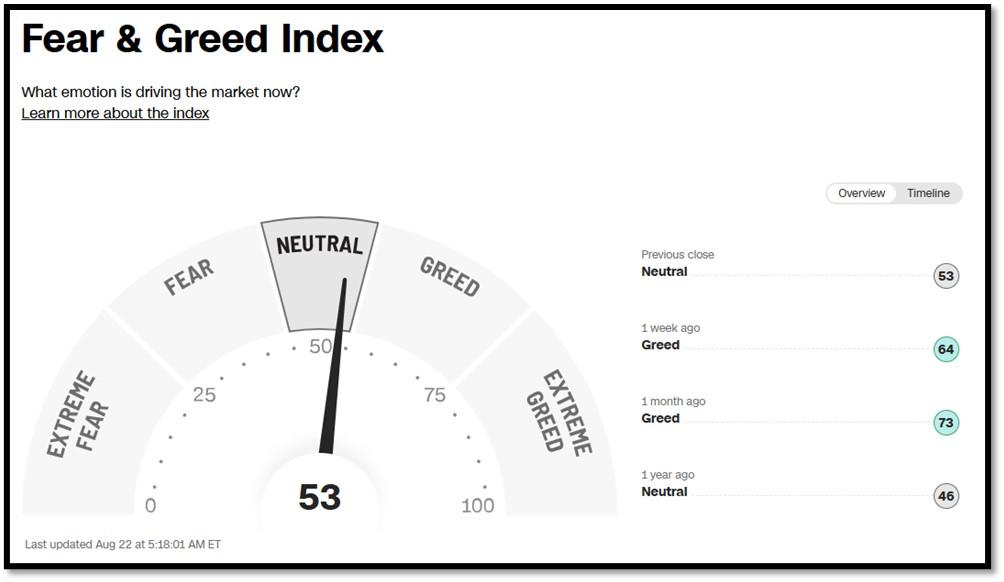
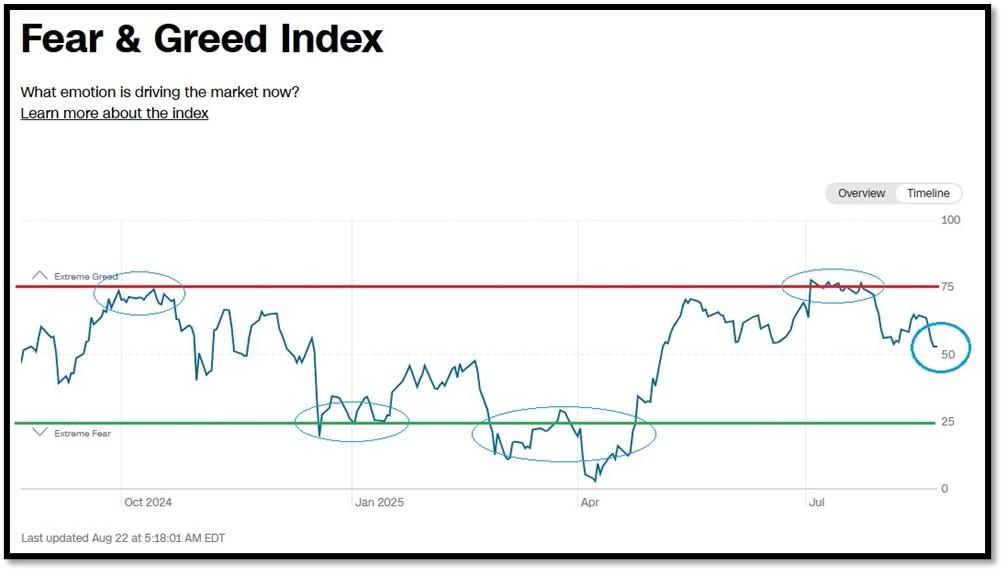
5A. Most recent read on the Fear & Greed Index with data as of 8/22/2025 – 5:19AM-ET is 53 (Neutral). Last week’s data was 64 (Greed) (1-100). CNNMoney’s Fear & Greed index looks at 7 indicators (Stock Price Momentum, Stock Price Strength, Stock Price Breadth, Put and Call Options, Junk Bond Demand, Market Volatility, and Safe Haven Demand). Keep in mind this is a contrarian indicator! REF: Fear&Greed via CNNMoney
5B. St. Louis Fed Financial Stress Index’s (STLFSI4) most recent read is at –0.5681 as of August 13, 2025. Previous week’s data was -0.7950. A big spike up from previous readings reflecting the turmoil in the banking sector back in 2023. This weekly index is not seasonally adjusted. The STLFSI4 measures the degree of financial stress in the markets and is constructed from 18 weekly data series: seven interest rate series, six yield spreads and five other indicators. Each of these variables captures some aspect of financial stress. Accordingly, as the level of financial stress in the economy changes, the data series are likely to move together. REF: St. Louis Fed

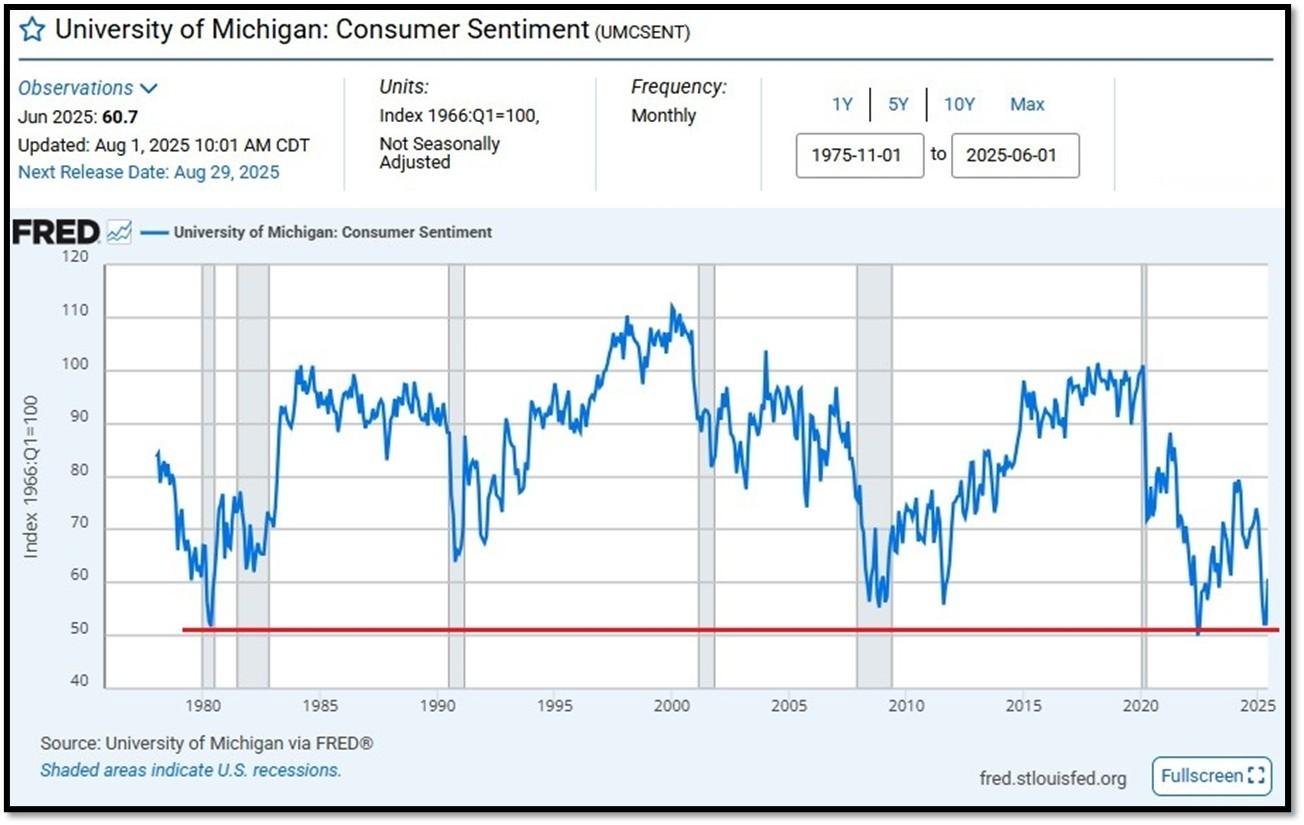
5C. University of Michigan, University of Michigan: Consumer Sentiment for February [UMCSENT] at 60.7, retrieved from FRED, Federal Reserve Bank of St. Louis, August 1, 2025. Back in June 2022, Consumer Sentiment hit a low point going back to April 1980. REF: UofM
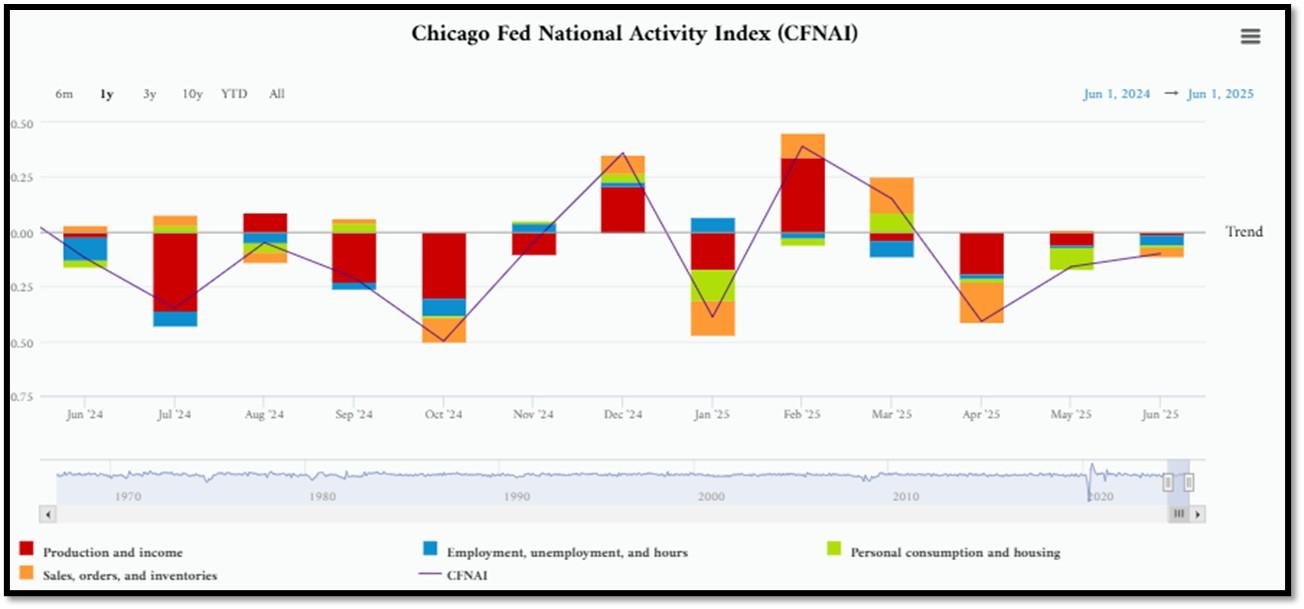
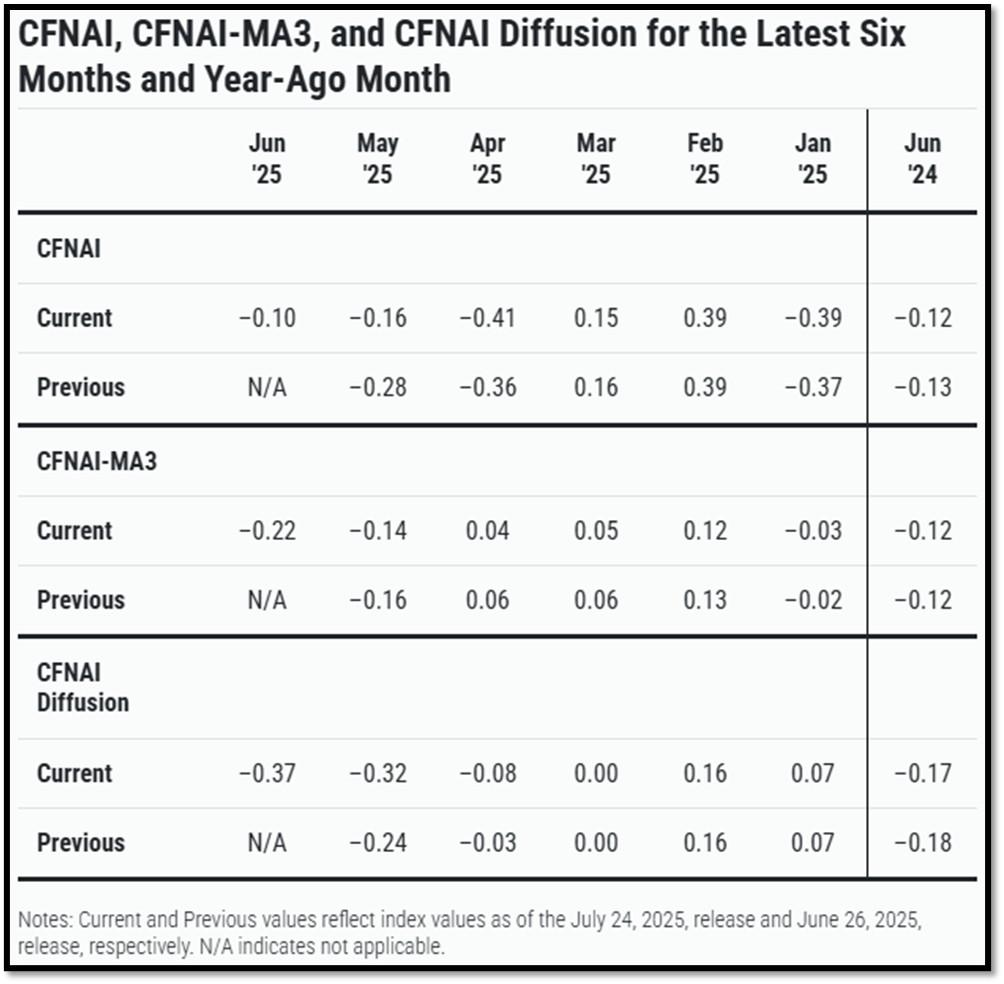
5D. The Chicago Fed National Activity Index (CFNAI) increased to –0.10 in June from –0.16 in May. Two of the four broad categories of indicators used to construct the index increased from May, but all four categories made negative contributions in June. The index’s three-month moving average, CFNAI-MA3, decreased to –0.22 in June from –0.14 in May. REF: ChicagoFed, June’s Report
5E. (7/21/2025) The Conference Board Leading Economic Index (LEI) for the US declined by 0.3% in June 2025 to 98.8 (2016=100), after no change in May (revised upward from –0.1% originally reported). As a result, the LEI fell by 2.8% over the first half of 2025, a substantially faster rate of decline than the –1.3% contraction over the second half of 2024. The composite economic indexes are the key elements in an analytic system designed to signal peaks and troughs in the business cycle. The indexes are constructed to summarize and reveal common turning points in the economy in a clearer and more convincing manner than any individual component. The CEI is highly correlated with real GDP. The LEI is a predictive variable that anticipates (or “leads”) turning points in the business cycle by around 7 months. Shaded areas denote recession periods or economic contractions. The dates above the shaded areas show the chronology of peaks and troughs in the business cycle. The ten components of The Conference Board Leading Economic Index® for the U.S. include: Average weekly hours in manufacturing; Average weekly initial claims for unemployment insurance; Manufacturers’ new orders for consumer goods and materials; ISM® Index of New Orders; Manufacturers’ new orders for nondefense capital goods excluding aircraft orders; Building permits for new private housing units; S&P 500® Index of Stock Prices; Leading Credit Index™; Interest rate spread (10-year Treasury bonds less federal funds rate); Average consumer expectations for business conditions. REF: ConferenceBoard, LEI Report for June (Released on 7/31/2025)
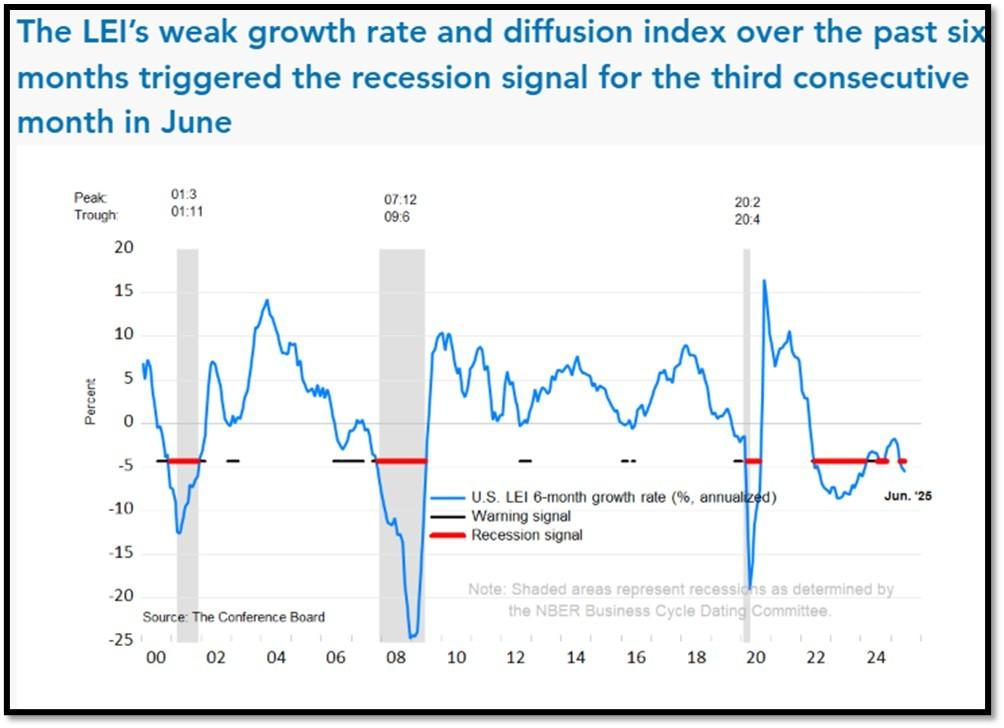
We have experienced a “rolling recession” since June 2022 and are only now emerging from it. However, authorities are not labeling it a recession due to high employment data.
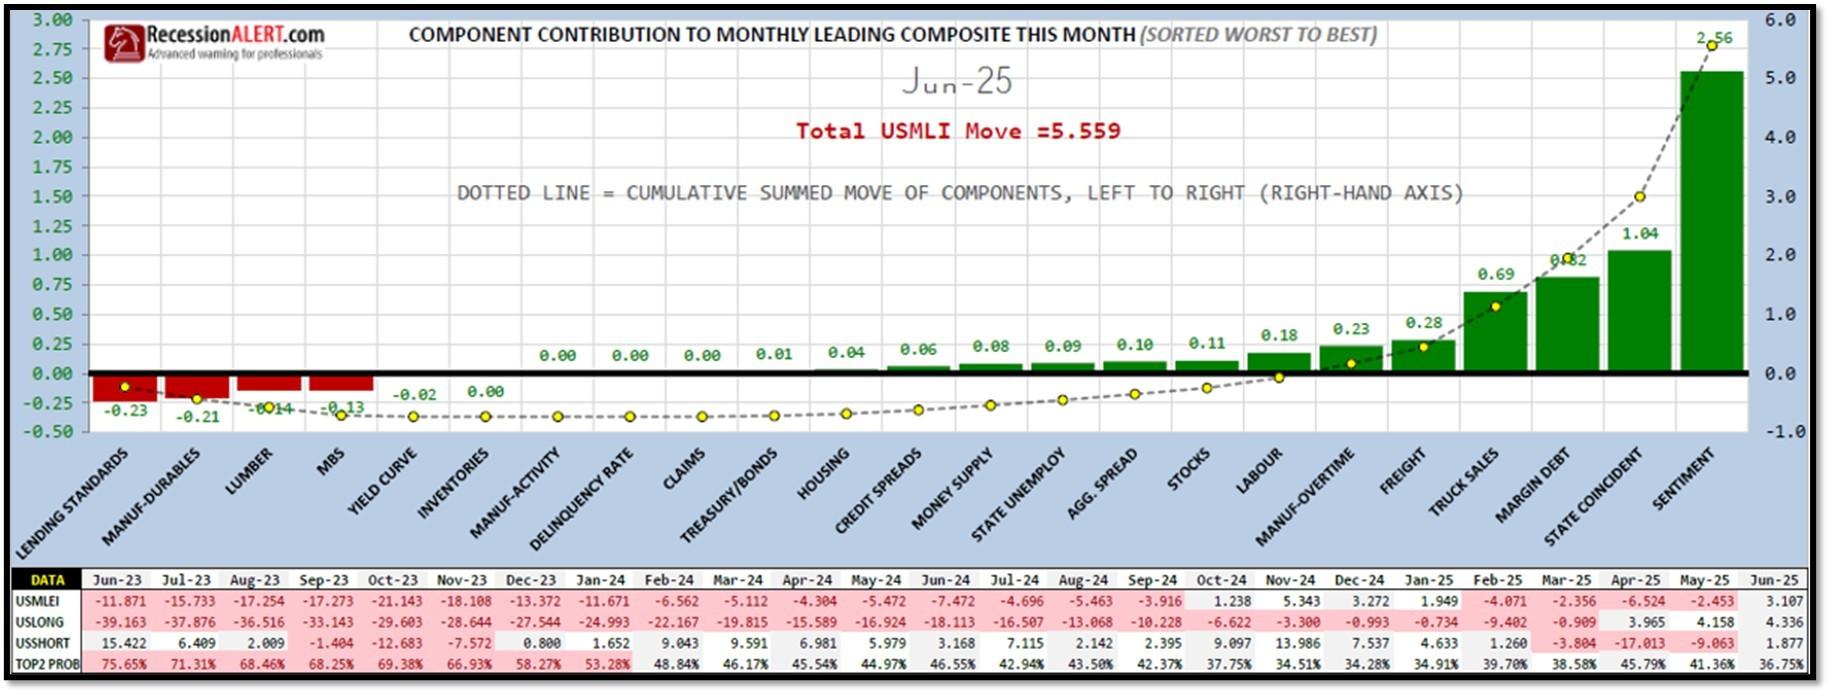
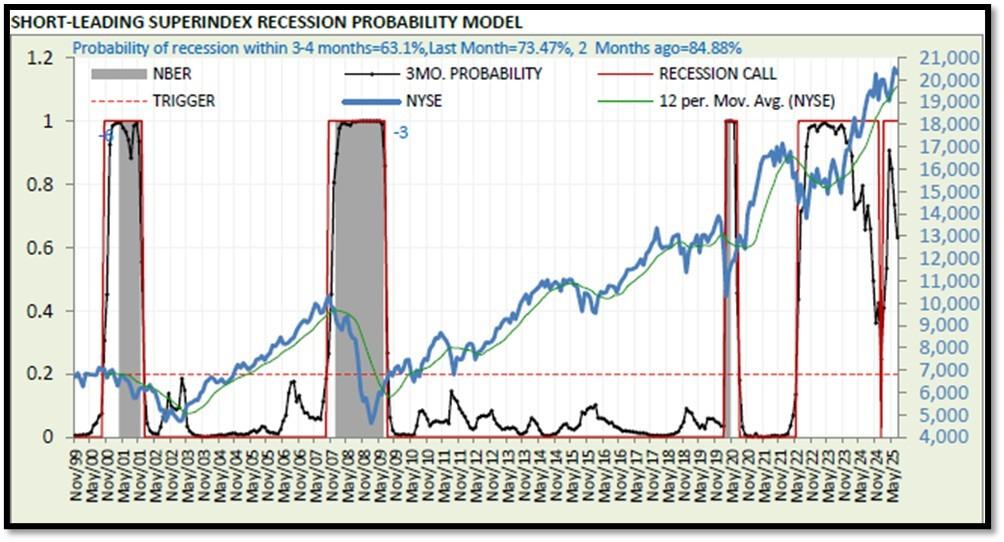
5F. Probability of U.S. falling into Recession within 3 to 4 months is currently at 63.1% (with data as of 08/4/2025 – Next Report 08/18/2025) according to RecessionAlert Research. Last release’s data was at 82.02%. This report is updated every two weeks. REF: RecessionAlertResearch
5G. Yield Curve as of 8/19/2025 is showing Normal. Spread on the 10-yr Treasury Yield (4.29%) minus yield on the 2-yr Treasury Yield (3.74%) is currently at 55bps. REF: Stockcharts The yield curve—specifically, the spread between the interest rates on the ten-year Treasury note and the three-month Treasury bill—is a valuable forecasting tool. It is simple to use and significantly outperforms other financial and macroeconomic indicators in predicting recessions two to six quarters ahead. REF: NYFED
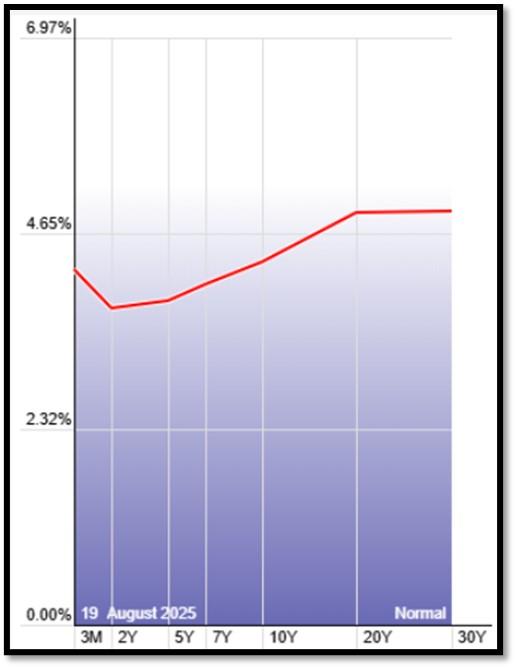
5H. Recent Yields in 10-Year Government Bonds. REF: Source is from Bloomberg.com, dated 8/19/2025, rates shown below are as of 8/19/2025, subject to change.
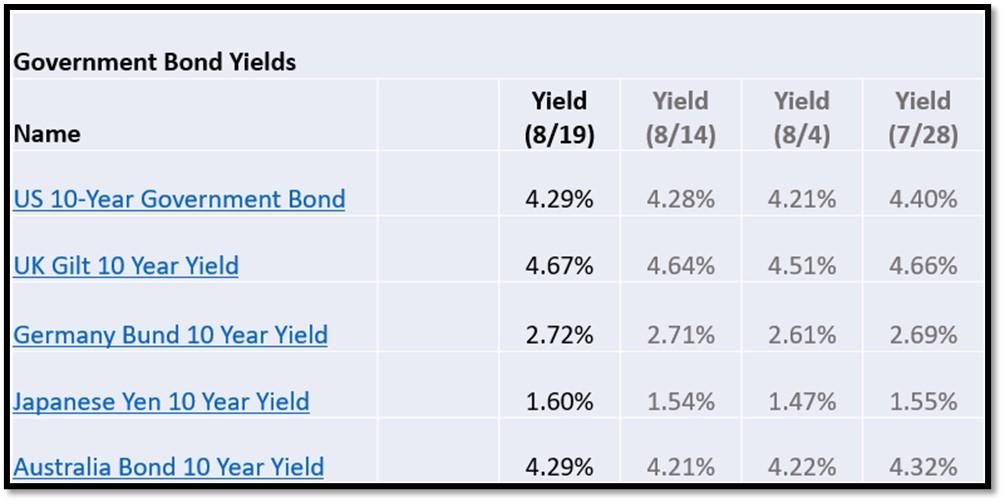
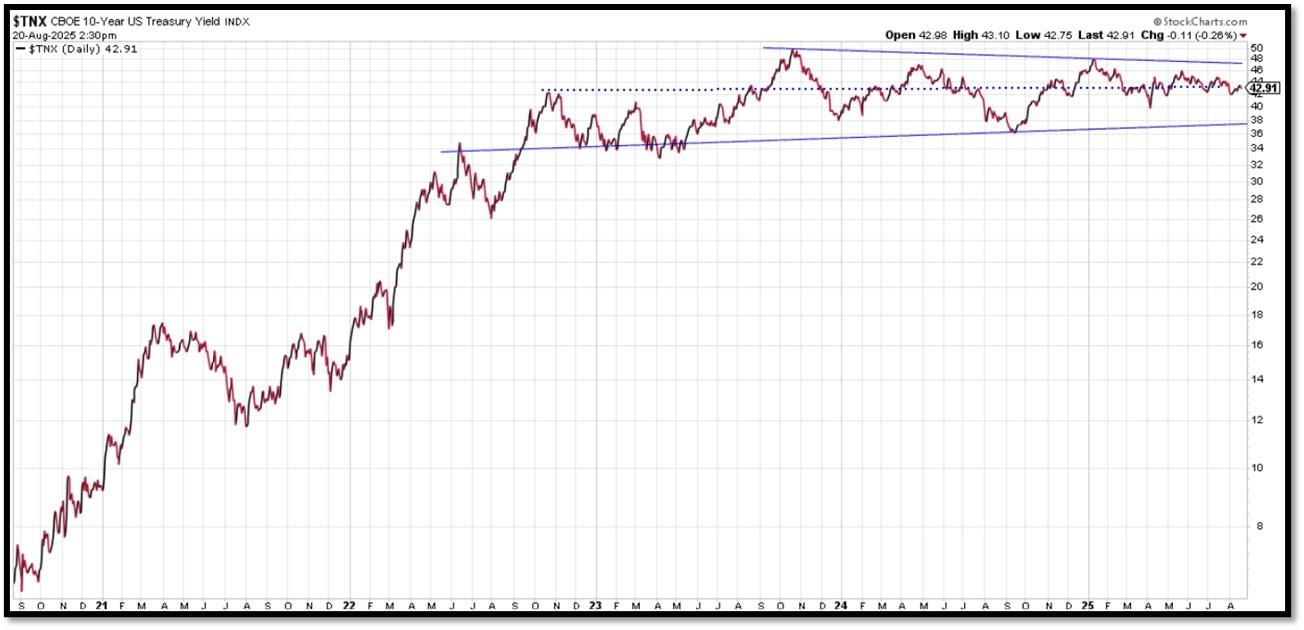
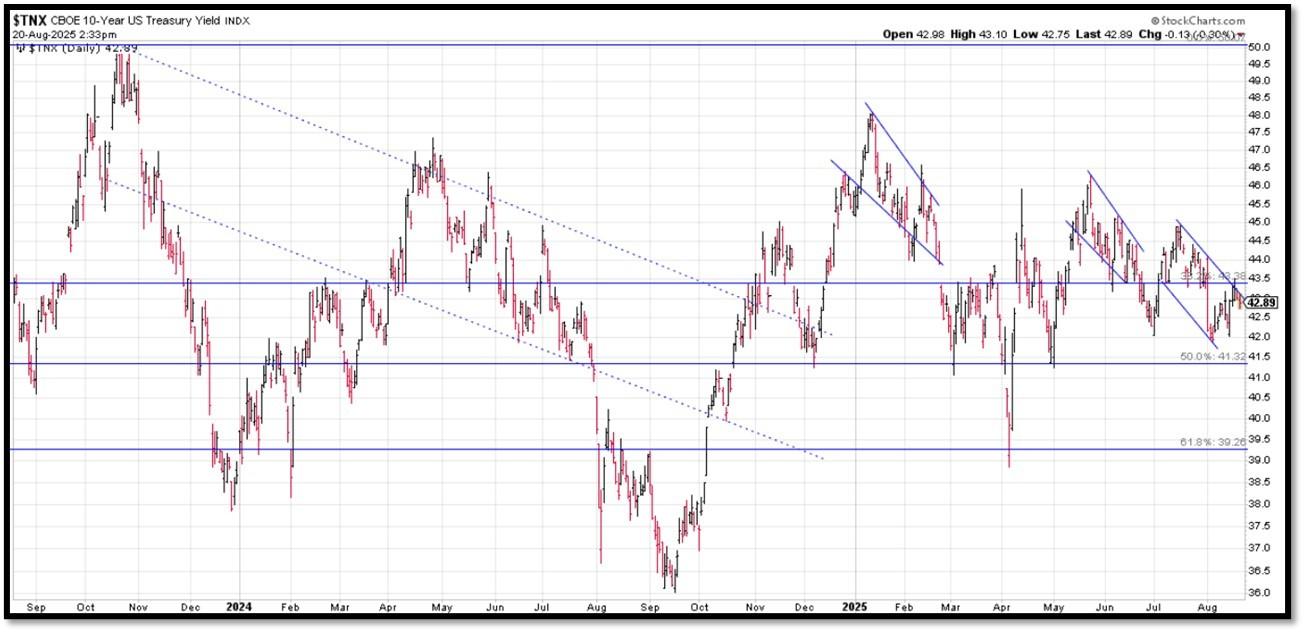
The 10-Year US Treasury Yield… The 10-Year Yield is indirectly related to inflation. I expect the 10-Year Yield to drop further as dis-inflation kicks in. REF: StockCharts1, StockCharts2
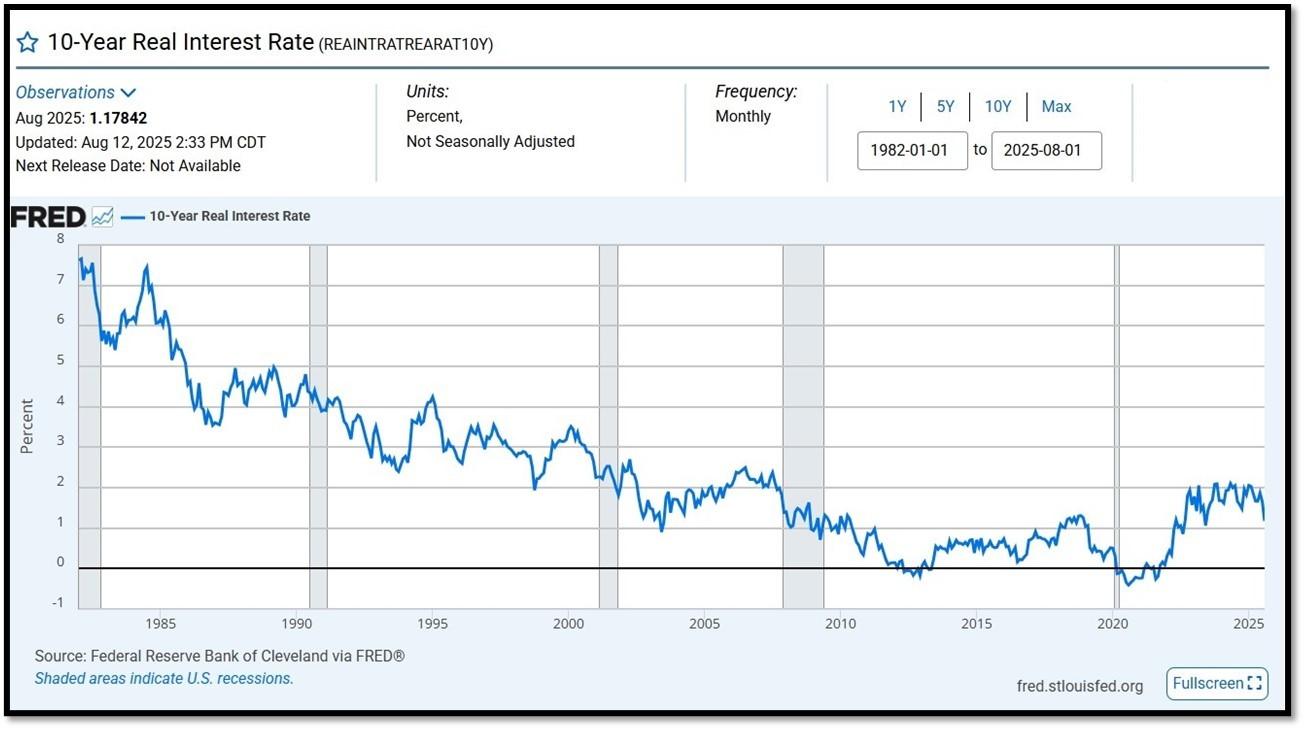
10-Year Real Interest Rate at 1.17842% as of 8/12/25. Last month’s data was 1.64906%. REF: REAINTRATREARAT10Y
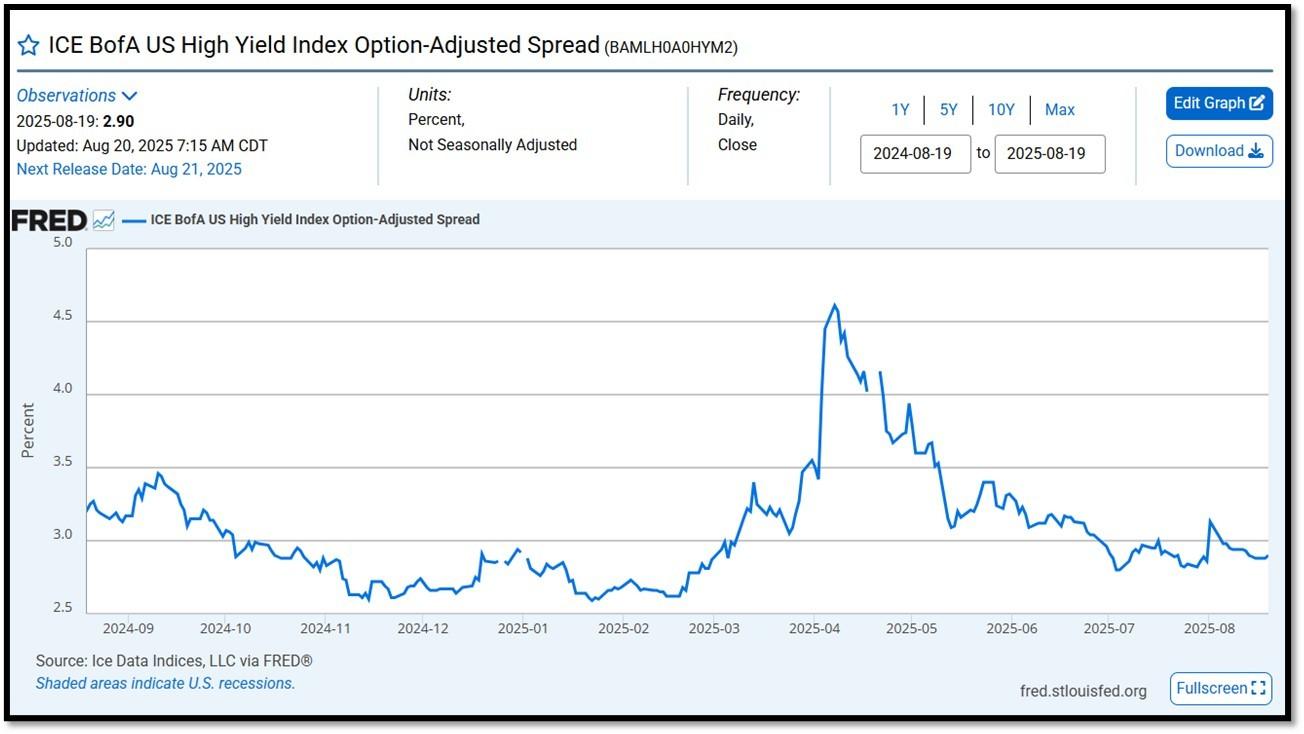
ICE BofA US High Yield Index Option-Adjusted Spread (BAMLH0A0HYM2) currently at 2.90 as of August 20, 2025. This is a key indicator of market sentiment, particularly regarding risk and economic health. At its core, the spread reflects the extra return investors demand to hold riskier corporate debt over safer government securities. High-yield bonds are issued by companies with lower credit ratings (below investment grade, like BB or lower), meaning they carry a higher chance of default. The spread compensates for this risk. When the spread is narrow—say, around 2.5% to 3%, as seen recently—it suggests investors are confident, willing to accept less extra yield because they perceive lower default risk or a strong economy. Narrow spreads often align with bullish markets, where cash is flowing, growth is steady, and fear is low. REF: FRED-BAMLH0A0HYM2
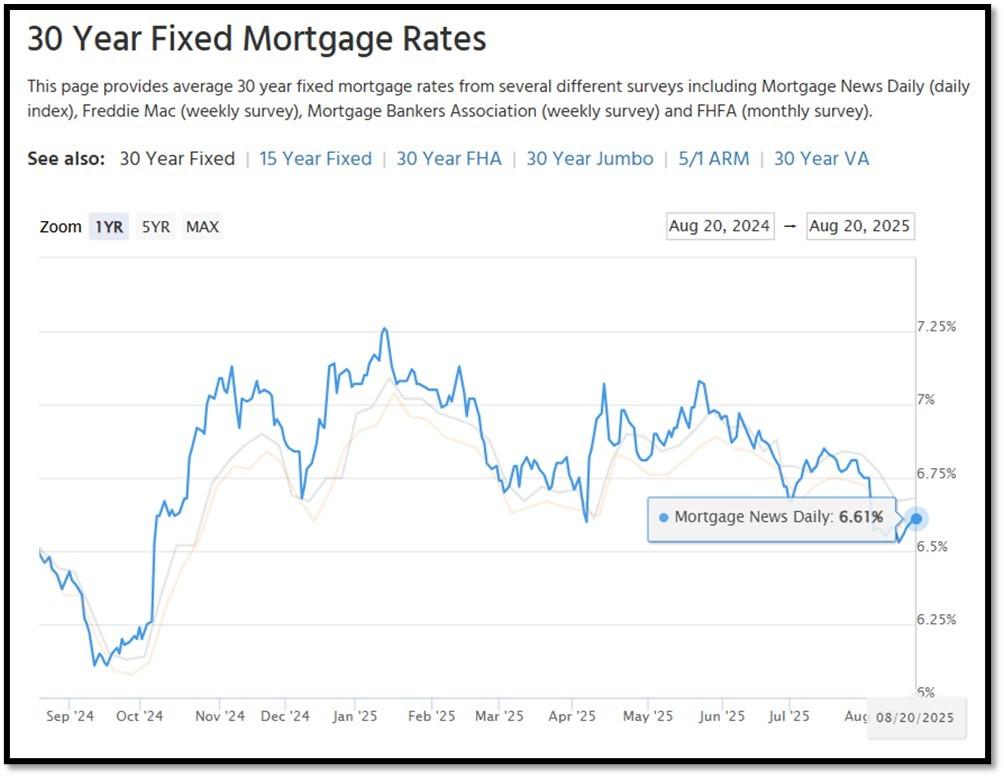
5I. (8/20/2025) Today’s National Average 30-Year Fixed Mortgage Rate is 6.61% (All Time High was 8.03% on 10/19/23). Last week’s data was 6.56%. This rate is the average 30-year fixed mortgage rates from several different surveys including Mortgage News Daily (daily index), Freddie Mac (weekly survey), Mortgage Bankers Association (weekly survey) and FHFA (monthly survey). REF: MortgageNewsDaily, Today’s Average Rate
The recent spike in the 30-year fixed-rate jumbo mortgage to 6.61%, compared to Freddie Mac’s rate at 6.58% and the Mortgage Bankers Association (MBA) rate at 6.68%, highlights key differences in the mortgage market. Jumbo mortgages, which exceed the conforming loan limits set by government agencies like Freddie Mac, typically carry higher interest rates because they are riskier for lenders. These loans are not backed by government entities, which increases the risk for lenders and, consequently, leads to higher rates. In contrast, Freddie Mac and MBA provide averages for conforming loans, which meet federal guidelines and have lower risk due to government backing, keeping their rates lower.
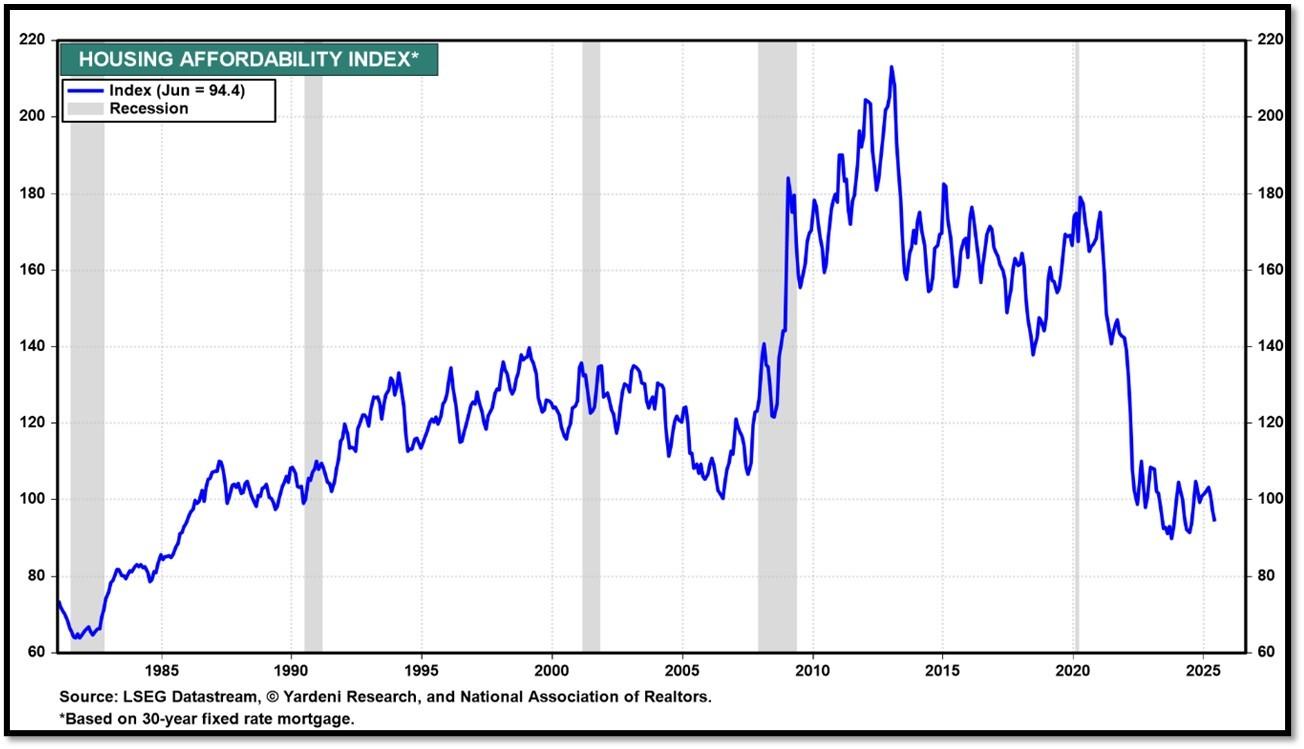
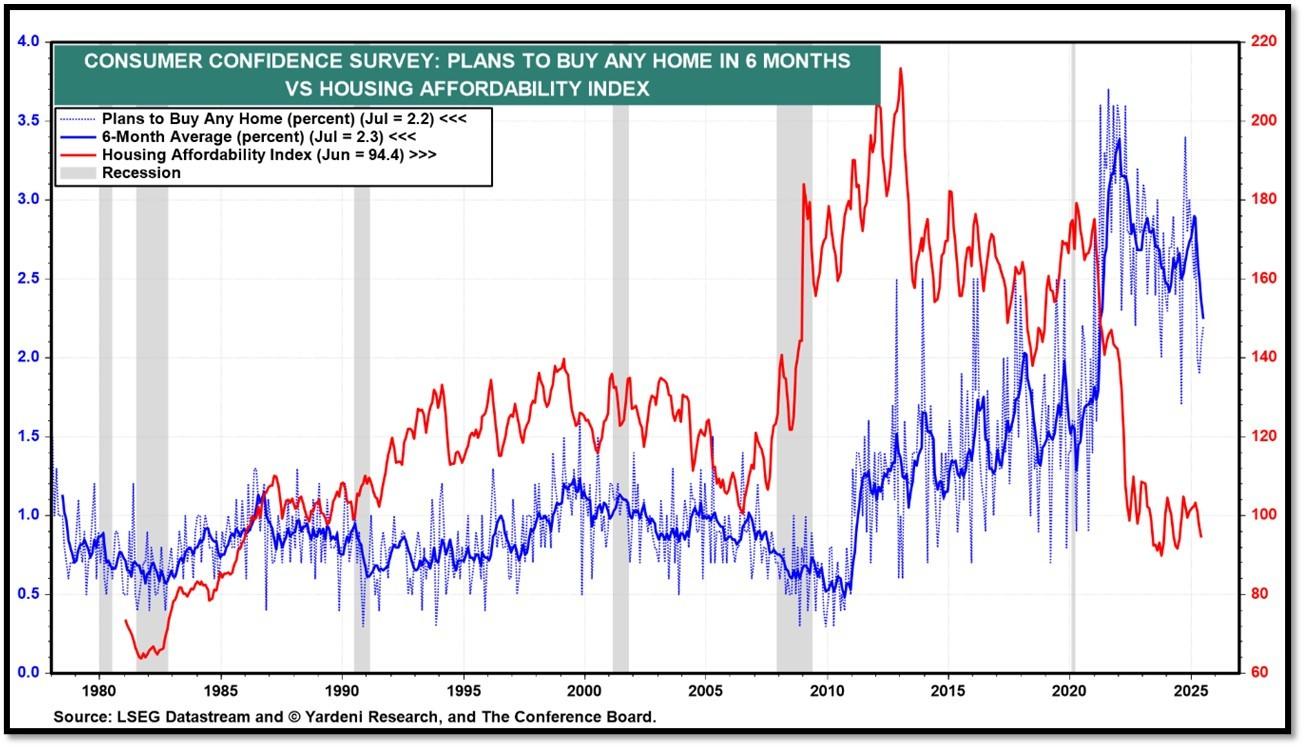
Housing Affordability Index for Jun = 94.4 // May = 97.2 // Apr = 101.0 // Mar = 103.2 // Feb = 102.2 // Jan = 100.7 // Dec = 100.7 // Nov = 99 // Oct = 102.3. Data provided by Yardeni Research. REF: Yardeni
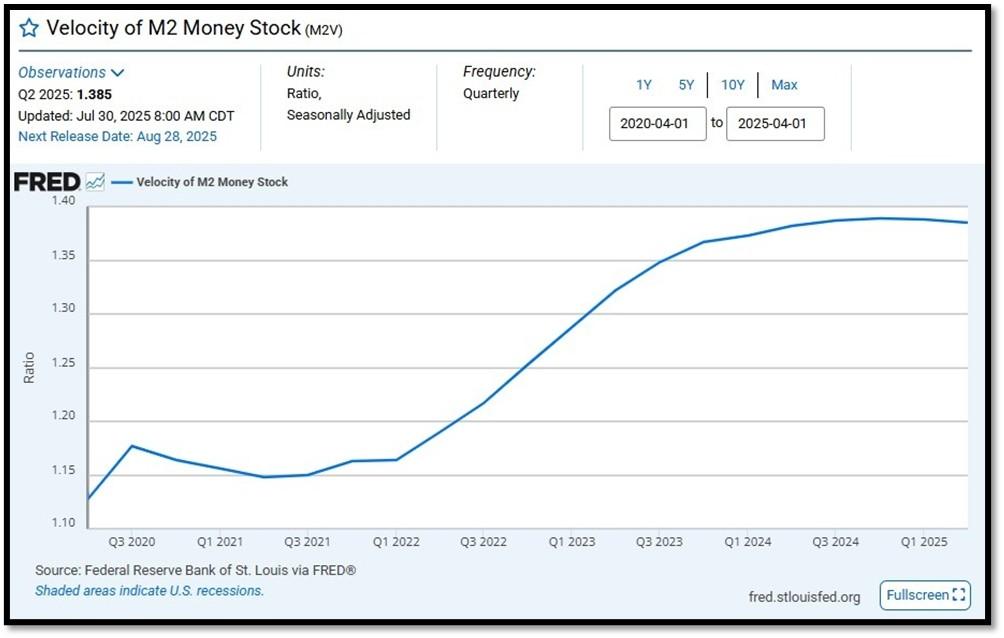
5J. Velocity of M2 Money Stock (M2V) with current read at 1.385 as of (Q2-2025 updated 7/30/2025). Previous quarter’s data was 1.386. The velocity of money is the frequency at which one unit of currency is used to purchase domestically- produced goods and services within a given time period. In other words, it is the number of times one dollar is spent to buy goods and services per unit of time. If the velocity of money is increasing, then more transactions are occurring between individuals in an economy. Current Money Stock (M2) report can be viewed in the reference link. REF: St.LouisFed-M2V
M2 consists of M1 plus (1) small-denomination time deposits (time deposits in amounts of less than $100,000) less IRA and Keogh balances at depository institutions; and (2) balances in retail MMFs less IRA and Keogh balances at MMFs. Seasonally adjusted M2 is constructed by summing savings deposits (before May 2020), small-denomination time deposits, and retail MMFs, each seasonally adjusted separately, and adding this result to seasonally adjusted M1. Board of Governors of the Federal Reserve System (US), M2 [M2SL], retrieved from FRED, Federal Reserve Bank of St. Louis; Updated on July 22, 2025. REF: St.LouisFed-M2
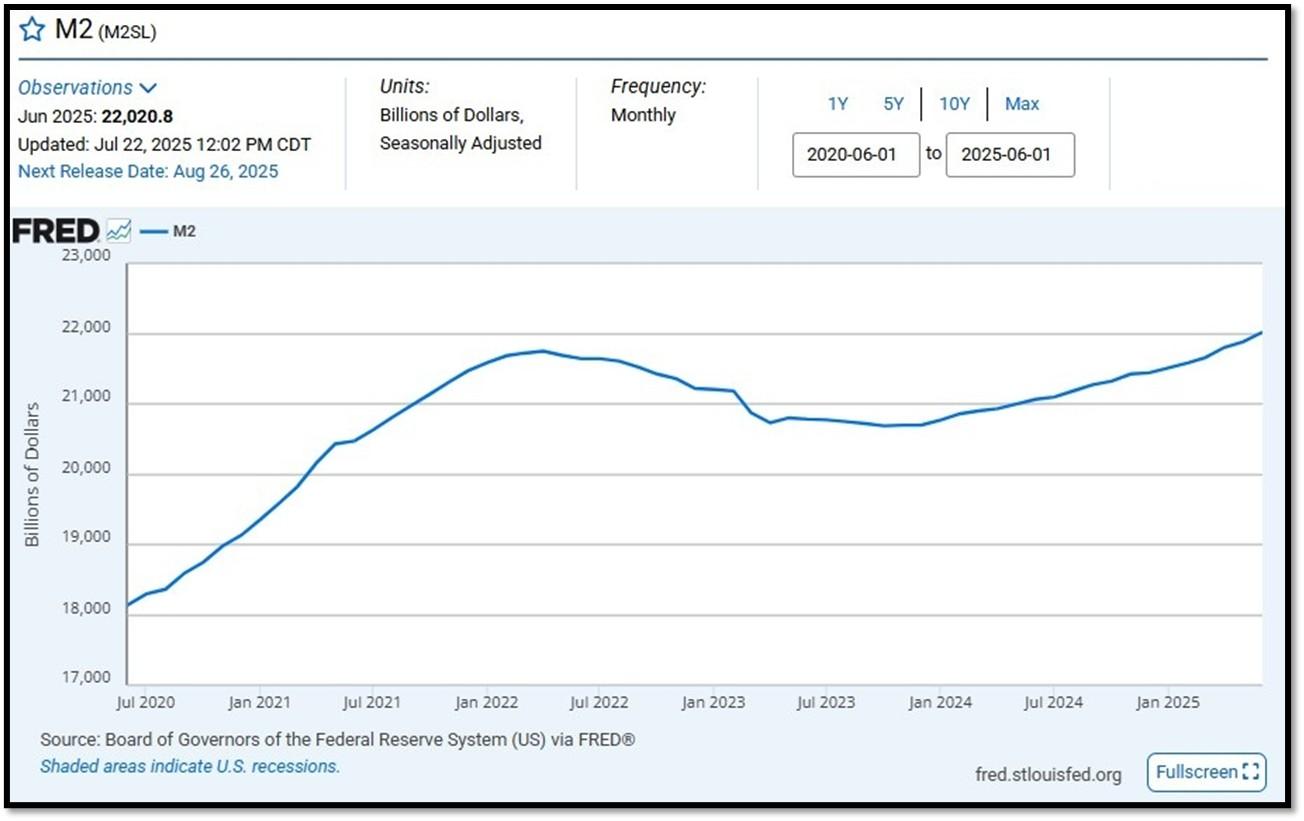
Money Supply M0 in the United States increased to 5,748,600 USD Million in June from 5,648,700 USD Million in May of 2025. Money Supply M0 in the United States averaged 1,200,279.70 USD Million from 1959 until 2025, reaching an all-time high of 6,413,100.00 USD Million in December of 2021 and a record low of 48,400.00 USD Million in February of 1961. REF: TradingEconomics, M0

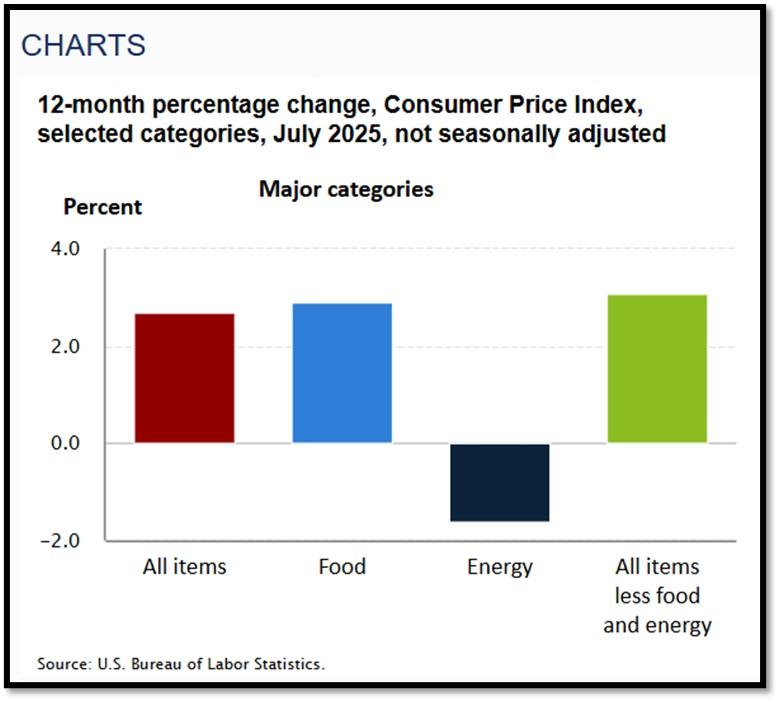
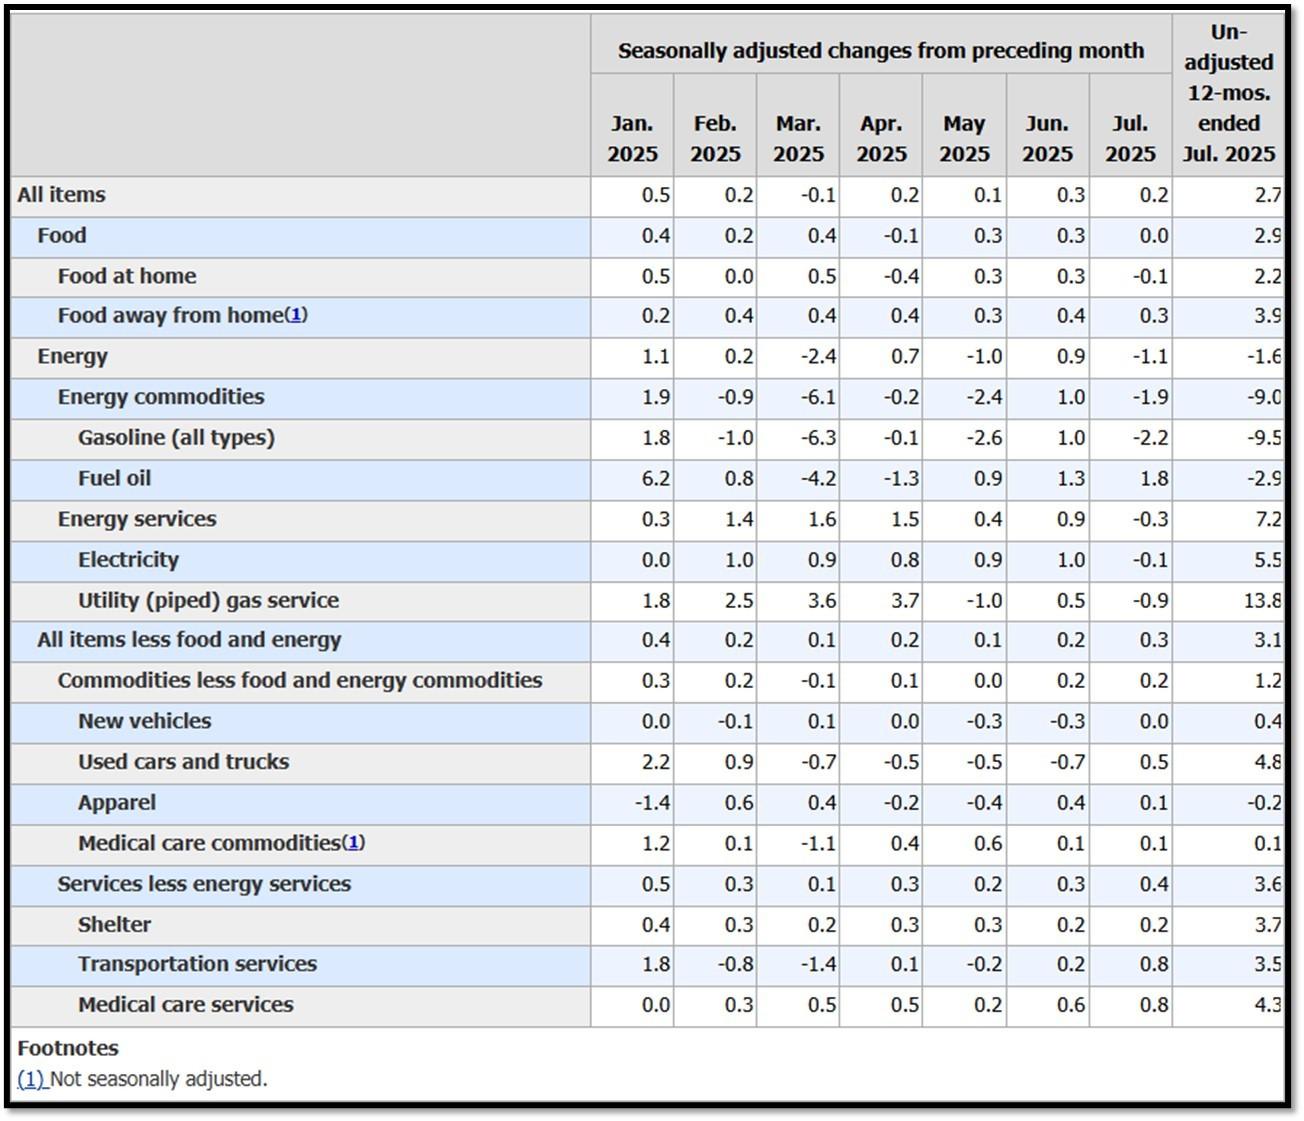
5K. In July, the Consumer Price Index for All Urban Consumers rose 0.2 percent, seasonally adjusted, and rose 2.7 percent over the last 12 months, not seasonally adjusted. The index for all items less food and energy increased 0.3 percent in July (SA); up 3.1 percent over the year (NSA). August 2025 CPI data are scheduled to be released on September 11, 2025, at 8:30AM-ET. REF: BLS, BLS.GOV
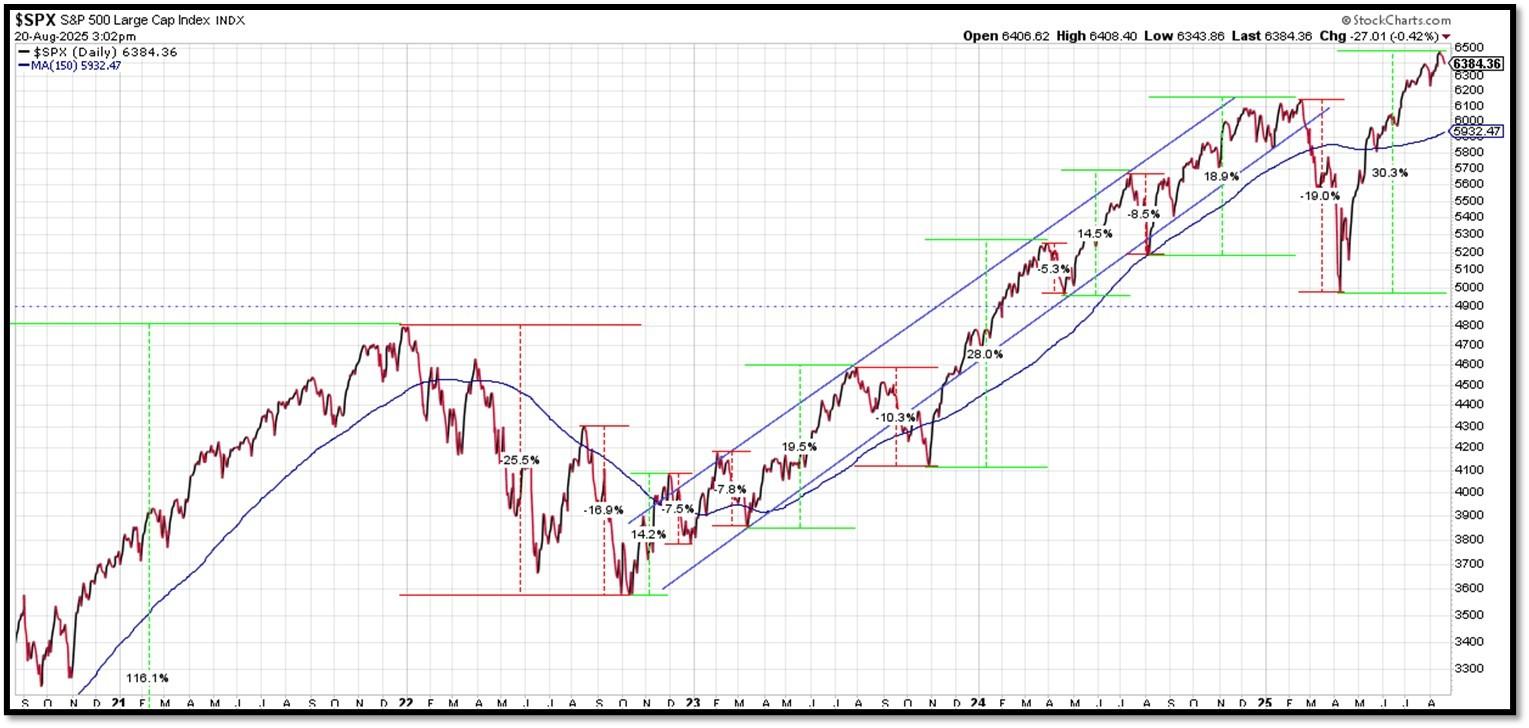
5L. Technical Analysis of the S&P500 Index. Click onto reference links below for images.
- Short-term Chart: Trend Bullish on 8/19/2025 – REF: Short-term S&P500 Chart by Marc Slavin (Click Here to Access Chart)
- Medium-term Chart: Trend Bearish to Bullish on 8/19/2025 – REF: Medium-term S&P500 Chart by Marc Slavin (Click Here to Access Chart)
- Market Timing Indicators – S&P500 Index as of 8/20/2025 – REF: S&P500 Charts (7 of them) by Joanne Klein’s Top 7 (Click Here to Access Updated Charts)
- The S&P500 is hitting all-time-high, rebounding from a V-shaped recovery. This is one of the ‘most-hated’ rallies. REF: Stockcharts
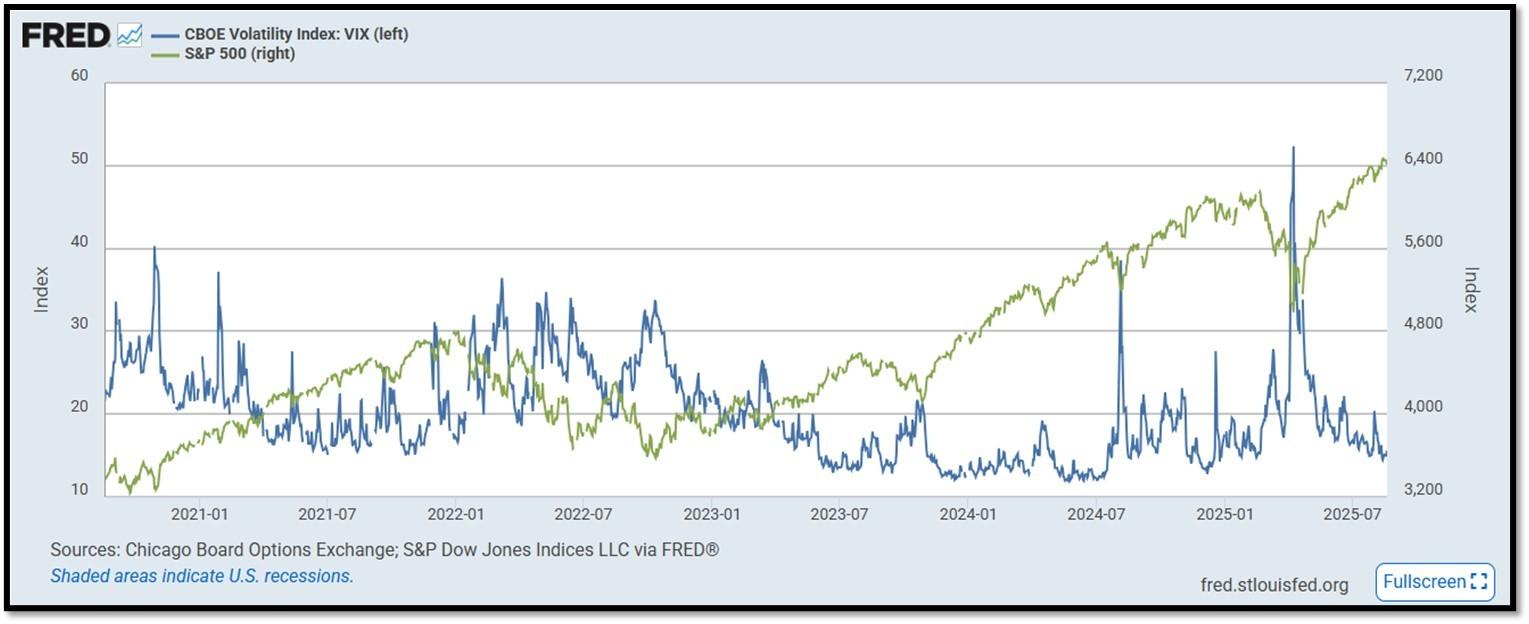
- S&P500 and CBOE Volatility Index (VIX) as of 8/19/2025. REF: FRED, Today’s Print
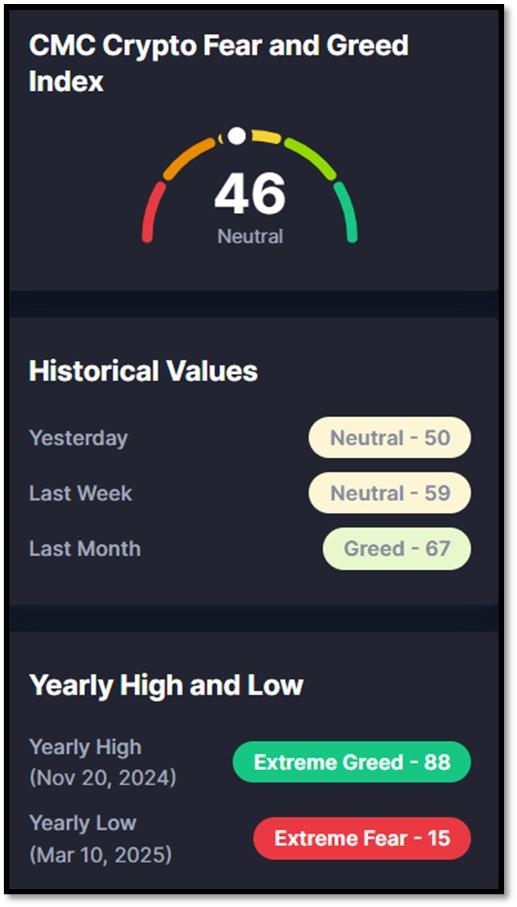
5M. Most recent read on the Crypto Fear & Greed Index with data as of 8/22/2025 is 46 (Neutral). Last week’s data was 59 (Neutral) (1-100). Fear & Greed Index – A Contrarian Data. The crypto market behavior is very emotional. People tend to get greedy when the market is rising which results in FOMO (Fear of missing out). Also, people often sell their coins in irrational reaction of seeing red numbers. With the Crypto Fear and Greed Index, the data try to help save investors from their own emotional overreactions. There are two simple assumptions:
- Extreme fear can be a sign that investors are too worried. That could be a buying opportunity.
- When Investors are getting too greedy, that means the market is due for a correction.
Therefore, the program for this index analyzes the current sentiment of the Bitcoin market and crunch the numbers into a simple meter from 0 to 100. Zero means “Extreme Fear”, while 100 means “Extreme Greed”. REF: Coinmarketcap.com, Today’sReading
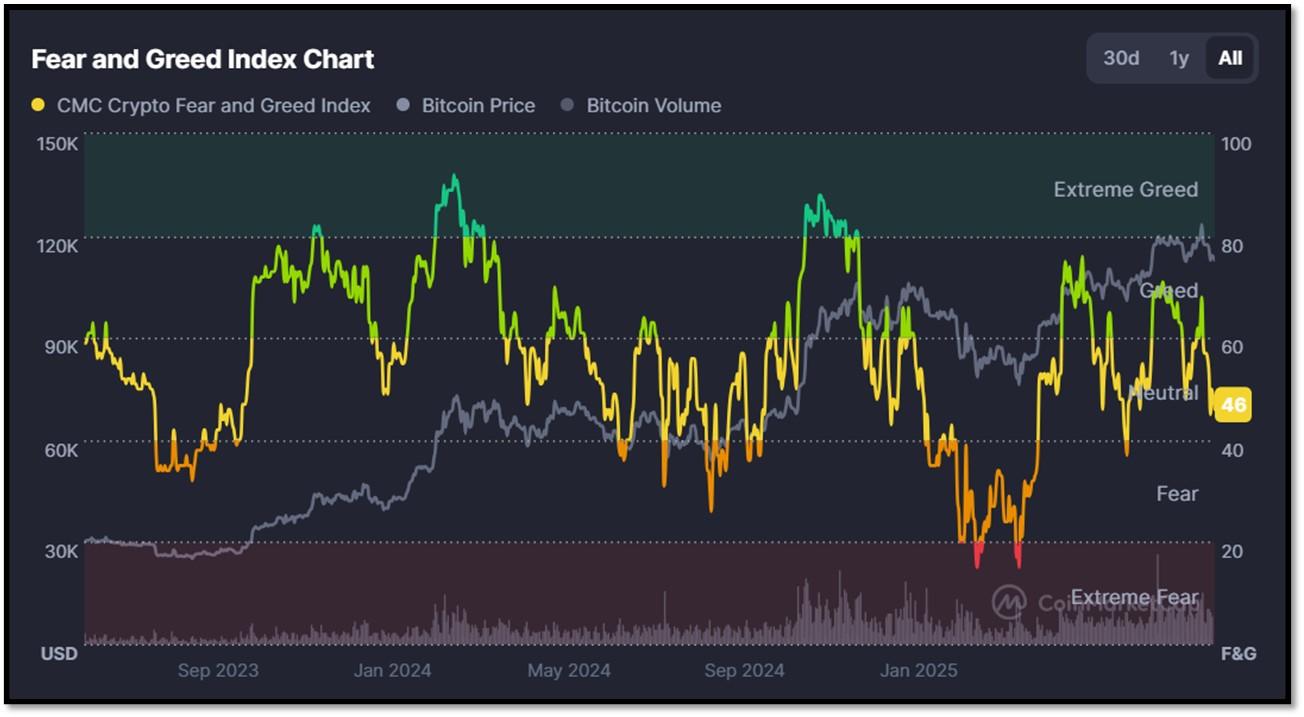
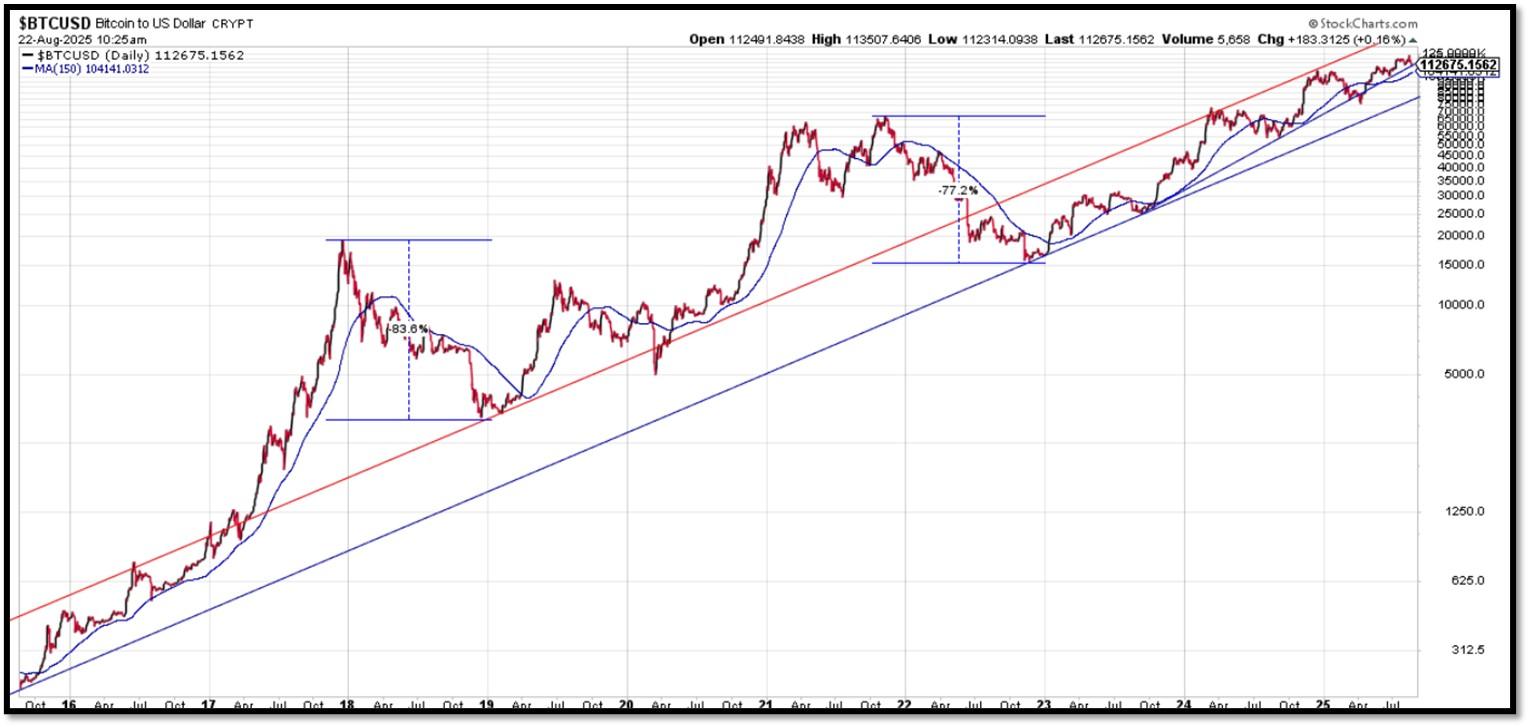
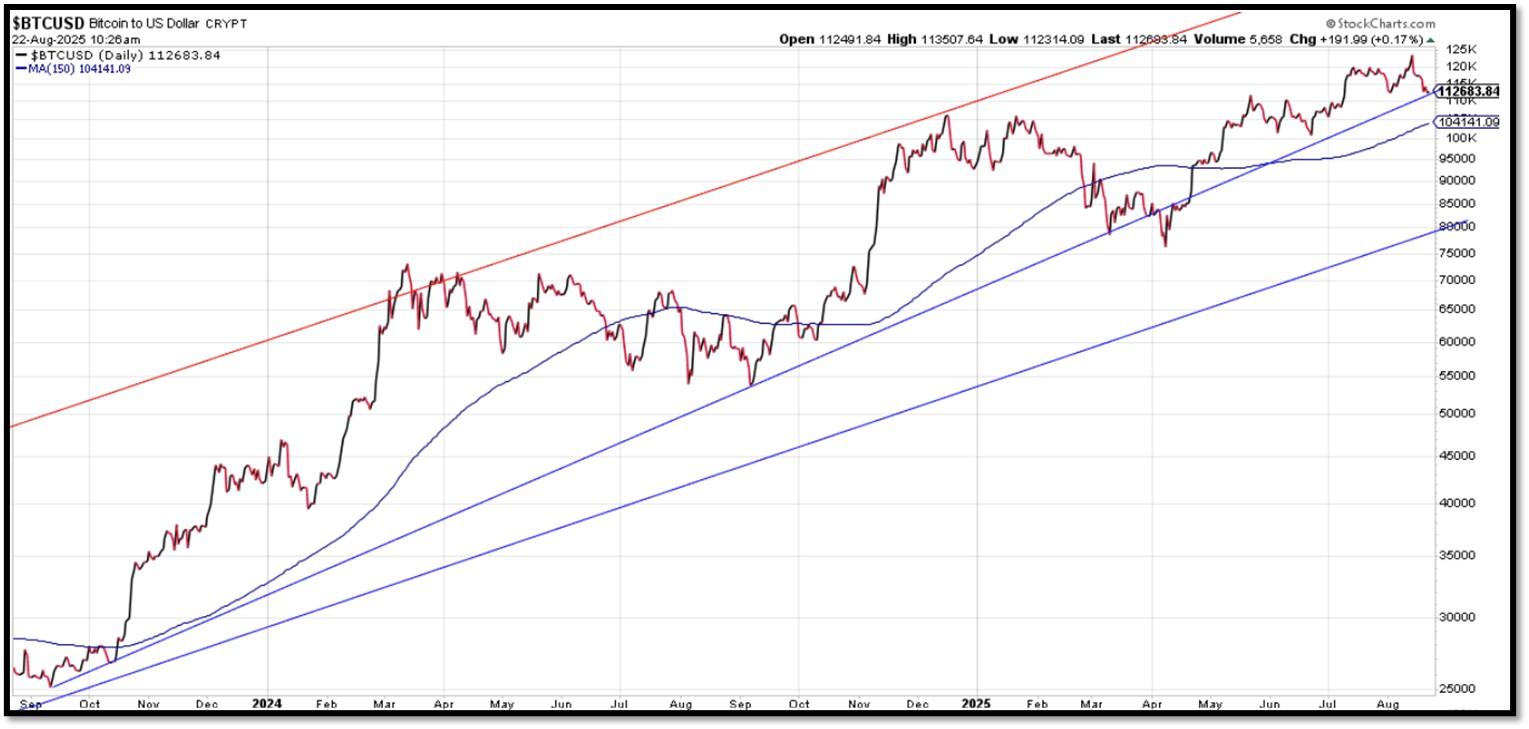
Bitcoin – 10-Year & 2-Year Charts. REF: Stockcharts10Y, Stockcharts2Y
From the desk of our Chief Investment Officer
As an investment professional with over twenty-six years of experience in the financial services industry, Andrew helps clients to protect, grow and transfer wealth during their lifetime with objective, unbiased, customized and efficient strategies.
Education, Professional Licenses Acquired & Affiliations
- Passed the Series 7, 63, 65 and 24 license examinations
- Currently holding Series 65 License
- BA in Economics – Boston University (Boston, MA) 1993
- Certificate in Commodities Trading – New York University (New York, NY) 1991
- Certificate in Financial Planning – New York University (New York, NY) April 2011
With extensive experience in the Financial Services Industry, Andrew Tang and Turner Financial Group provides disciplined wealth management with an intelligent caring approach to each and every client that compliments the Dedicated Financial offering.


Len writes much of his own content, and also shares helpful content from other trusted providers like Turner Financial Group (TFG).
The material contained herein is intended as a general market commentary, solely for informational purposes and is not intended to make an offer or solicitation for the sale or purchase of any securities. Such views are subject to change at any time without notice due to changes in market or economic conditions and may not necessarily come to pass. This information is not intended as a specific offer of investment services by Dedicated Financial and Turner Financial Group, Inc.
Dedicated Financial and Turner Financial Group, Inc., do not provide tax, legal or accounting advice. You should consult your own tax, legal and accounting advisors before engaging in any transaction.
Any hyperlinks in this document that connect to Web Sites maintained by third parties are provided for convenience only. Turner Financial Group, Inc. has not verified the accuracy of any information contained within the links and the provision of such links does not constitute a recommendation or endorsement of the company or the content by Dedicated Financial or Turner Financial Group, Inc. The prices/quotes/statistics referenced herein have been obtained from sources verified to be reliable for their accuracy or completeness and may be subject to change.
Past performance is no guarantee of future returns. Investing involves risk and possible loss of principal capital. The views and strategies described herein may not be suitable for all investors. To the extent referenced herein, real estate, hedge funds, and other private investments can present significant risks, including loss of the original amount invested. All indexes are unmanaged, and an individual cannot invest directly in an index. Index returns do not include fees or expenses.
Turner Financial Group, Inc. is an Investment Adviser registered with the United States Securities and Exchange Commission however, such registration does not imply a certain level of skill or training and no inference to the contrary should be made. Additional information about Turner Financial Group, Inc. is also available at www.adviserinfo.sec.gov. Advisory services are only offered to clients or prospective clients where Turner Financial Group, Inc. and its representatives are properly licensed or exempt from licensure. No advice may be rendered by Turner Financial Group, Inc. unless a client service agreement is in place.


