

- 1. The first week of August 2025 delivered high-impact economic data but Nvidia’s (NVDA) Q2 earnings on Wednesday (8/27/25), overshadowed these releases in driving stock market movements.
- 2. What is an AI Agent? AI agent is a computer program or system that uses artificial intelligence to perform tasks or make decisions independently, often by learning from data or interacting with its environment.
- 3. Tesla remains a majority position in our tactical overweight allocation.
- 4. World Watch
- 4A. China’s ambassador to India, Xu Feihong, stated that “China will firmly stand with India to uphold the multilateral trading system, with the WTO at its core,” a claim steeped in irony given China’s history with the World Trade Organization (WTO) and U.S.-India trade tensions.
- 4B. This year, Germany and Italy, key pillars of the European Union’s economy, face GDP contractions, amplifying Europe’s sluggish growth.
- 4C. An updated snapshot of the current global state of economy.
- 5. Quant & Technical Corner – A selection of quantitative & technical data we monitor on a regular basis to help gauge the overall financial market conditions and the investment environment.
1. The first week of August 2025 delivered high-impact economic data but Nvidia’s (NVDA) Q2 earnings on Wednesday (8/27/25), overshadowed these releases in driving stock market movements.
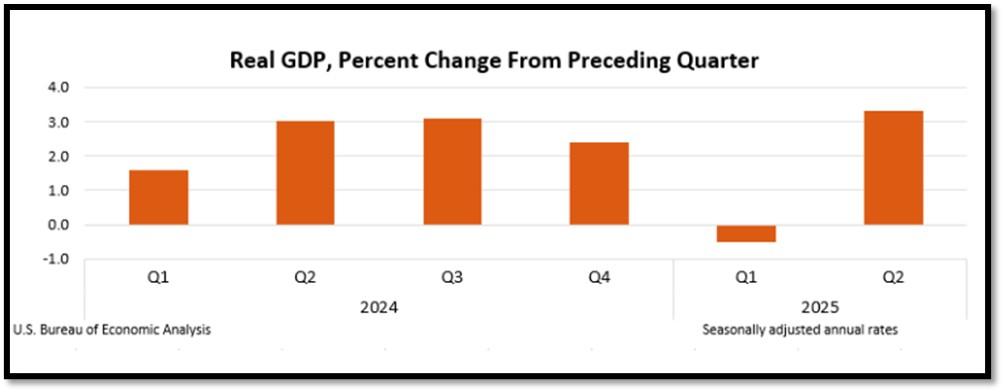
The U.S. Q2 2025 GDP Preliminary Report, released on August 28, showed annualized growth of 2.5%, exceeding expectations of 2.0% but below the advanced estimate of 2.8%. Fueled by robust consumer spending (up 2.9%) and business investment, the report’s GDP Price Index rose 2.3%, slightly below forecasts, reinforcing expectations of a Federal Reserve rate cut in September, with a 75% probability of a 25-basis-point reduction. While this bolstered equities, Nvidia’s earnings had a greater impact, with its $46.7 billion revenue (up 56% year-over-year) and $1.05 adjusted EPS slightly missing lofty data center expectations ($41.1 billion vs. $41.2 billion), causing a 2% stock dip in after-hours trading. Given Nvidia’s 8% weighting in the S&P 500, options pricing anticipated a 0.9% index move, surpassing typical reactions to economic data, as its AI-driven growth narrative dominated market sentiment.
Jensen Huang, Nvidia’s CEO, expressed strong confidence in Nvidia’s earnings outlook for upcoming quarters, emphasizing robust demand for its Blackwell AI chips, which generated $11 billion in Q2 2025 revenue and are projected to drive $54 billion in Q3 revenue, despite no H20 chip sales to China. As a bellwether for AI and tech, Nvidia’s performance reflects soaring AI inference demand, fueled by advanced reasoning models like DeepSeek’s R1, with Huang anticipating leadership in a $3–4 trillion AI infrastructure market, improved gross margins in the mid-70% range by year-end, and resilience amid U.S.-China trade uncertainties. Click onto picture below to access video. REF: DAM, Briefing, BEA
2. What is an AI Agent? AI agent is a computer program or system that uses artificial intelligence to perform tasks or make decisions independently, often by learning from data or interacting with its environment.
Think of it as a smart assistant that can understand instructions, process information, and take actions to achieve a goal, like answering questions, controlling a self-driving car, or managing a schedule, without needing constant human guidance. It’s designed to mimic human-like problem-solving but relies on algorithms and data to work efficiently. Click onto the reference link to access a well-written and easy to understand paper on the introduction of AI Agents by Roi Lipman. REF: Intro_To_AI_Agents
- An AI assistant is a program designed to help users with specific tasks by responding to commands or queries, often in a reactive and limited way, like answering questions (e.g., Siri or Alexa) or scheduling appointments. It typically follows predefined scripts or patterns and doesn’t act independently.
- An AI agent, on the other hand, is more advanced, capable of autonomous reasoning, planning, and decision-making to achieve goals without constant human input. It learns from data, adapts to new situations, and can execute complex tasks, like managing a self-driving car or optimizing workflows. In short, assistants react to instructions, while agents proactively think and act to solve problems.
In ARK Invest’s 2025 mid-year update from “Big Ideas 2025,” Frank Downing, Director of Research, underscores the rapid evolution of AI agents, highlighting their transformative role in consumer and business ecosystems. Frank emphasizes that AI agents are driving digital application adoption by enhancing natural language processing, reasoning, and learning to optimize tasks like search, e-commerce, and software development. Downing forecasts that by 2030, AI agents could capture over 54% of the $1.1 trillion digital ad market and enable nearly $9 trillion in global online consumption, with AI-driven digital wallets managing 72% of e-commerce transactions. In enterprises, these agents are set to boost productivity by automating tasks, shortening software development cycles, and cutting costs, potentially reshaping industries with software spending growth accelerating to 18-48% annually through 2030. Below is a summary of topics in video. Click onto picture below to access video. REF: ARK-Invest, Big Ideas 2025
- The shift from simple AI assistants to more capable, context-aware agents
- OpenAI’s recent agent launch inside ChatGPT
- AI-native development tools like Cursor and Replit
- Early signs of monetization through enterprise integrations and premium subscriptions
- The intensifying open-source AI rivalry between the US and China
- The race for AI Agents in productivity tools like Microsoft Excel is on…
3. Tesla remains a majority position in our tactical overweight allocation.
This week, we take a deep dive into several reasons why this company’s competitive edge with Adrian Balfour, a seasoned auto executive specializes in helping companies leverage software and technologies like AI, cloud, and IoT for digital transformation, particularly in the automotive and financial services sectors.
Adrian Balfour, founder of Envorso, contends that legacy automakers are lagging due to their focus on engine-based manufacturing, while software-driven Tesla and Rivian are set to lead the future of mobility. Tesla’s RoboTaxi dominance is driven by its advanced AI, extensive vehicle data, and integrated software ecosystem, positioning it to transform autonomous transport. Rivian will endure through its agile software platform, innovative EV designs, and key partnerships like Amazon. However, Balfour warns that Detroit’s automakers, hindered by outdated systems, slow software adoption, and bureaucratic inertia, risk irrelevance in a decade as the industry pivots to autonomous, electric, software-defined vehicles, potentially leaving them unable to compete without drastic change. Below are key points discussed in the video. Click onto picture below to access video. It’s a long one but will be well worth your time. REF: AdrianBalfour, Envorso, Video
- 00:00 Tesla’s Business Challenges
- 02:14 Tesla’s Software-First Edge
- 12:53 Ford’s Next-Gen Platform
- 30:28 Rivian & Lucid Rise
- 35:43 Tesla’s Software Focus
- 41:18 Tesla’s Competitive Edge
- 50:10 Software’s Role in Auto


NOTE: Not investment advice or recommendations. Investor should consider the investment objective, risks, charges and expenses carefully before investing. For additional information about securities mentioned above or in the video, please visit referenced securities mentioned above and in videos. Read carefully before investing.
With the current macro-economic backdrop, below are areas we currently favor:
- Fixed Income – Short-term Corporates (Low-Beta)
- Fixed Income – (Corporates & Muni) High Yield as Opportunistic Allocation (Low-Beta)
- Businesses that contribute to and benefit from AI & Automation (Market-Risk)
- Fintech & Financials (Market-Risk)
- Digital Asset – Bitcoin (Market-Risk/Hedge)
- Cyber-Security & Software (Market-Risk)
- Cloud Computing (Market-Risk)
- Biotechnology (Market-Risk)
4. World Watch
4A. China’s ambassador to India, Xu Feihong, stated that “China will firmly stand with India to uphold the multilateral trading system, with the WTO at its core,” a claim steeped in irony given China’s history with the World Trade Organization (WTO) and U.S.-India trade tensions.
In August 2025, the Trump administration imposed tariffs of up to 50% on Indian goods, including a 25% penalty for India’s Russian oil purchases, effective August 27, 2025, targeting sectors like textiles and pharmaceuticals to curb India’s energy reliance. China, which reaped significant WTO benefits since 2001—such as expanded market access and export growth—has often undermined the WTO with protectionist policies, subsidies, and intellectual property violations. Its support for India appears as a strategic move to exploit U.S.-India friction and bolster its Global South leadership, not a true commitment to multilateral trade.
The irony grows as China criticizes U.S. tariffs as bullying while employing similar tactics, like leveraging rare-earth mineral control and imposing retaliatory tariffs, often bypassing WTO rules. China’s alignment with India, strengthened by recent diplomacy and Modi’s planned visit to China for the Shanghai Cooperation Organization summit, reflects a pragmatic counter to U.S. pressure rather than WTO loyalty. Critics, like former U.S. trade official Kate Kalutkiewicz, call China’s WTO defense hollow, given its prioritization of national interests. Thus, China’s statement is less about upholding the WTO and more about seizing a geopolitical opportunity, leveraging its WTO-enabled economic rise to mask self-interest with multilateral rhetoric. Click onto pictures below to access videos. REF: WSJ, Bloomberg, WSJ_Video


4B. This year, Germany and Italy, key pillars of the European Union’s economy, face GDP contractions, amplifying Europe’s sluggish growth.
Germany, the EU’s largest economy, saw a 0.3% GDP decline in Q2 2025, following a 0.2% drop in 2024, driven by U.S. tariffs of up to 15% on European goods, with threats of 27.5% on automotive exports. These tariffs hit Germany’s export-reliant economy hard, with exports down 1.9%, compounded by weak consumer sentiment, tight financing, and competition from China in electric vehicles. Forecasts from the European Commission and institutes like IfW Kiel predict stagnation in 2025 (-0.2% to +0.4%), with a modest 0.9–1.6% rebound in 2026, supported by infrastructure spending. Italy, the EU’s third-largest economy, contracted by 0.1% in Q2 2025, reversing a 0.3% Q1 gain, due to weak domestic demand and the end of housing renovation incentives. Recovery and Resilience Facility (RRF) grants bolster construction, projecting 0.7% growth in 2025 and 0.9% in 2026, but U.S. tariffs remain a threat. Both nations face structural issues, including aging populations and declining industrial competitiveness, limiting recovery prospects.
Europe’s broader economy is anemic, with EU GDP growth forecast at 1.1% and the euro area at 0.9% in 2025, down from earlier estimates due to trade tensions. The euro area grew just 0.1% in Q2 2025, dragged by Germany and Italy, though Spain (0.7%) and Portugal (0.6%) show resilience. Manufacturing weakens, with low capacity and layoffs at firms like Bosch. Disinflation (1.7% by 2026) and a strong euro ease pressures, but trade fragmentation and geopolitical risks curb exports. The EU’s neutral fiscal stance, bolstered by RRF funds and defense initiatives like “ReArm Europe,” supports southern economies. However, Germany’s fiscal tightening and Italy’s high debt (138.2% of GDP in 2026) constrain growth. A projected 1.5% EU growth in 2026 hinges on resolving trade disputes, but Germany and Italy’s contractions highlight the fragility of Europe’s uneven recovery. Click onto to picture below to access video. REF: EuropeanCommission, REUTERS, Deloitte,

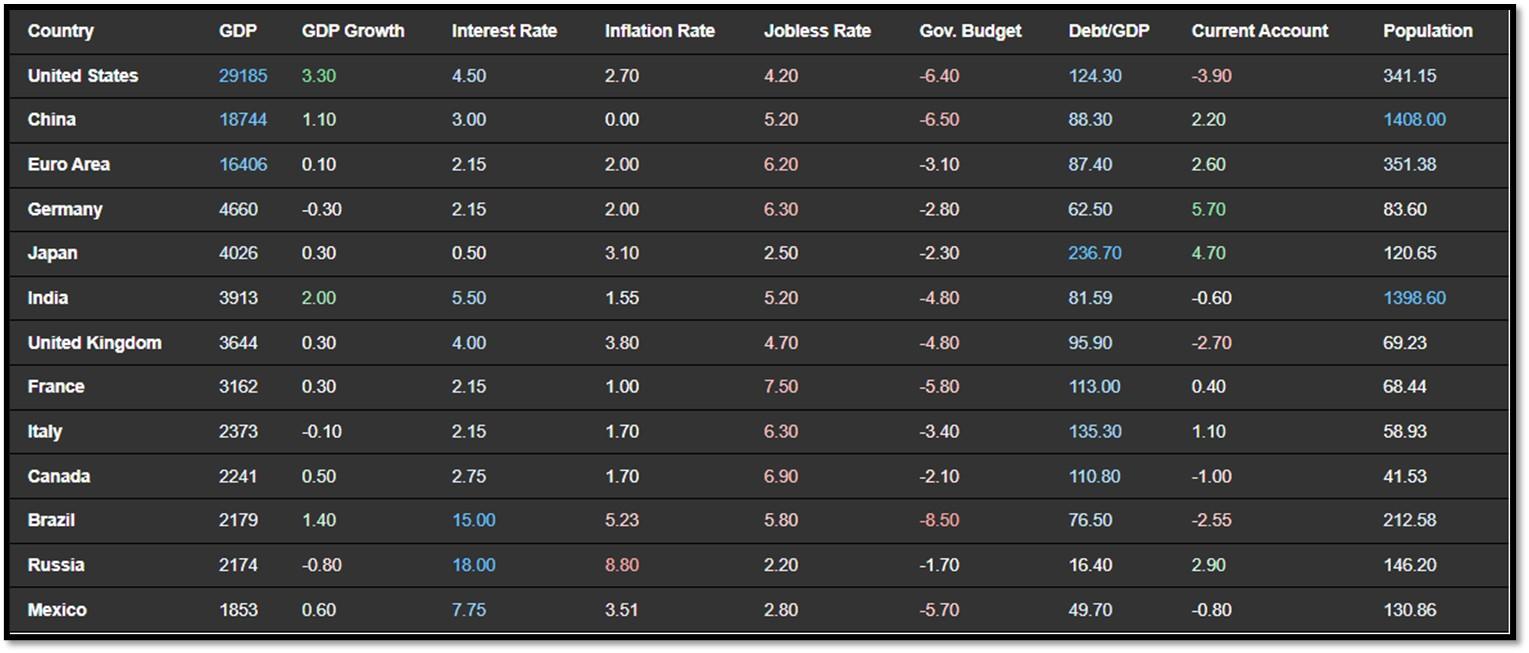
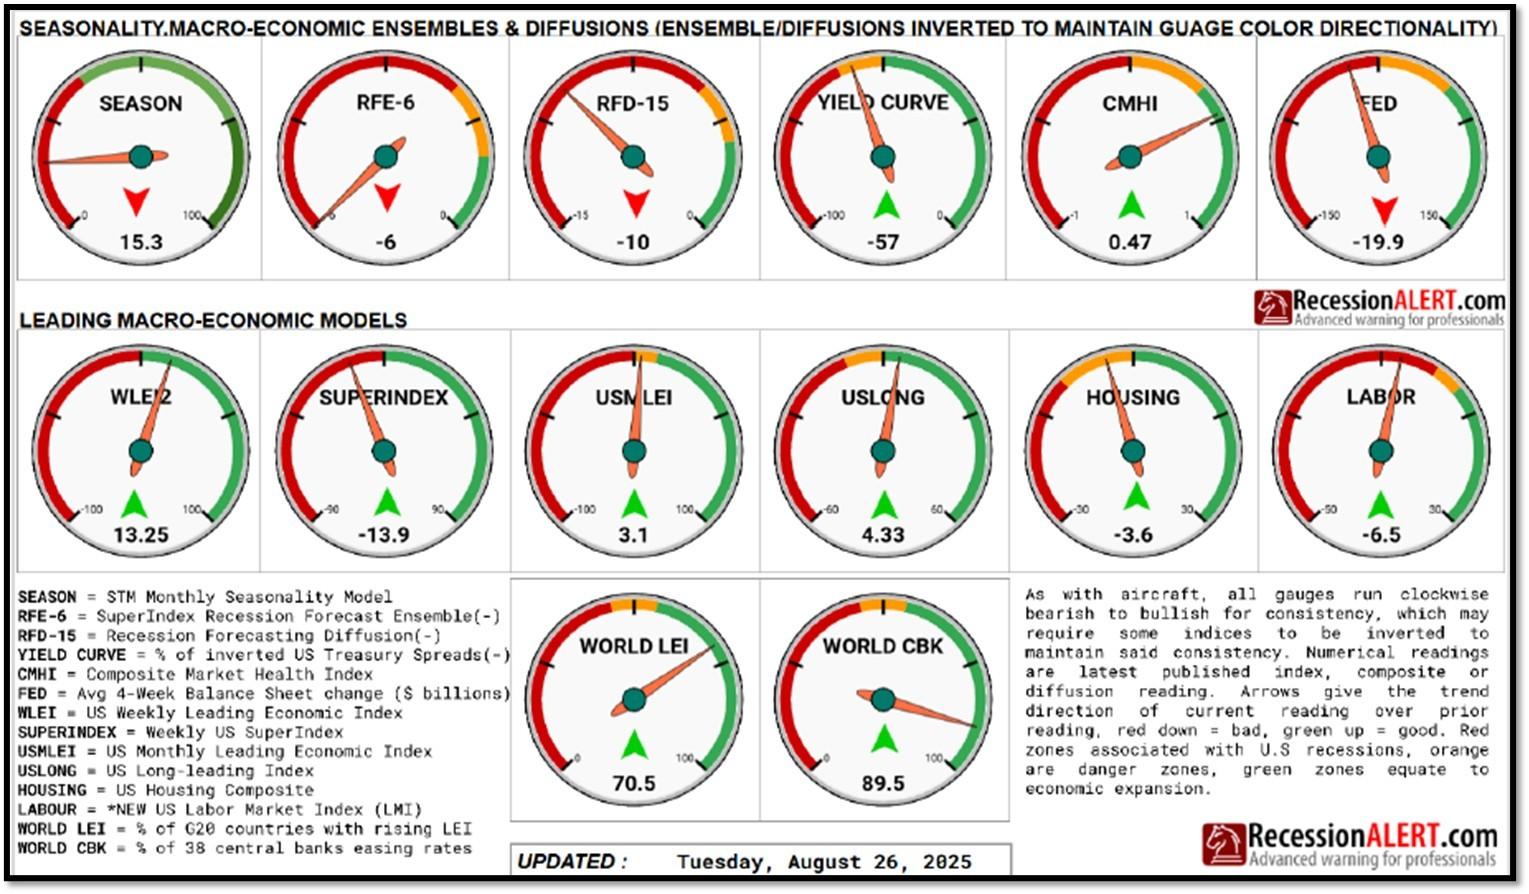
4C. An updated snapshot of the current global state of economy.
According to TradingEconomics as of 8/29/2025 (REF: TradingEconomics):
- Germany’s economy contracted 0.3% qoq in Q2 2025, sharper than the preliminary estimate of a 0.1% drop and reversing the 0.3% growth seen in the previous period.
- Japan’s annual inflation rate eased to 3.1% in July 2025 from 3.3% in the previous month, marking the lowest reading since November 2024.
- The annual inflation rate in the UK jumped to 3.8% in July 2025, the highest since January 2024, up from 3.6% in June and above market expectations of 3.7%.
- The annual inflation rate in Canada eased to 1.7% in July 2025, from 1.9% in June and below market forecasts of 1.8%, staying beneath the BoC’s 2% mid-point for a fourth consecutive month.
5. Quant & Technical Corner – A selection of quantitative & technical data we monitor on a regular basis to help gauge the overall financial market conditions and the investment environment.
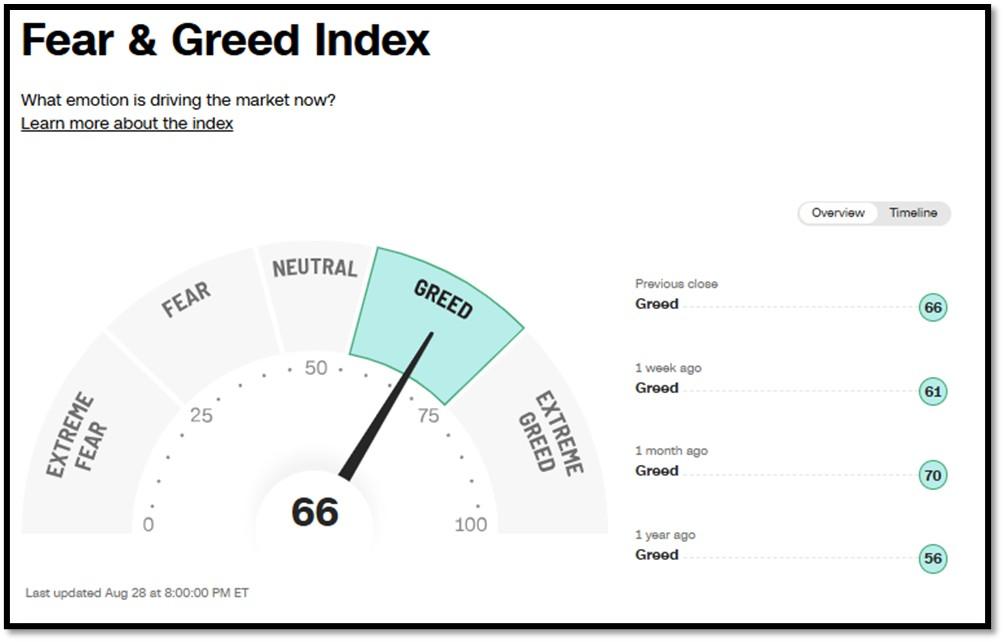
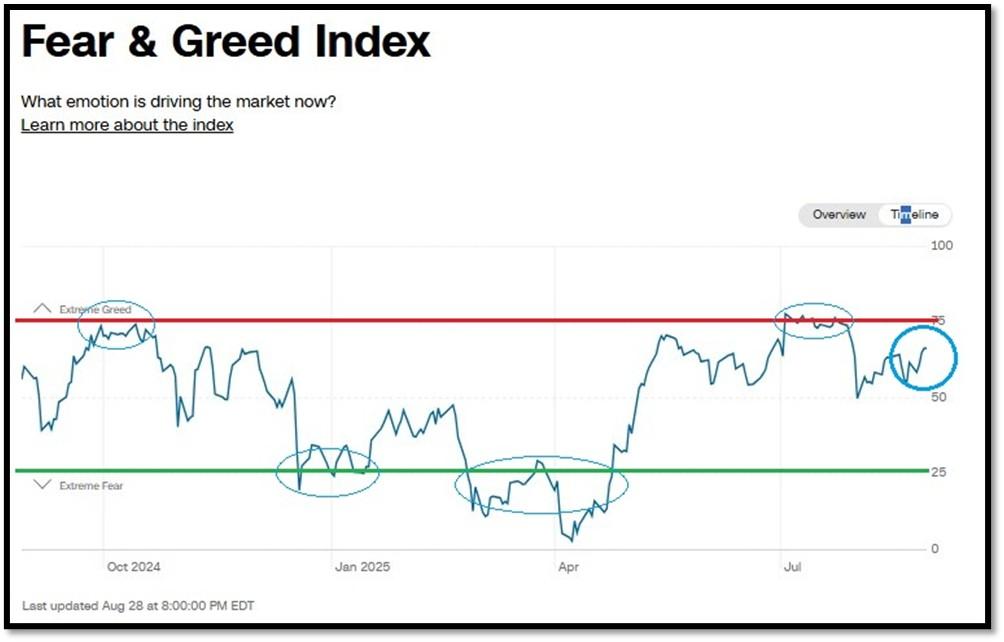
5A. Most recent read on the Fear & Greed Index with data as of 8/28/2025 – 8:00 PM-ET is 66 (Greed). Last week’s data was 61 (Greed) (1-100). CNNMoney’s Fear & Greed index looks at 7 indicators (Stock Price Momentum, Stock Price Strength, Stock Price Breadth, Put and Call Options, Junk Bond Demand, Market Volatility, and Safe Haven Demand). Keep in mind this is a contrarian indicator! REF: Fear&Greed via CNNMoney
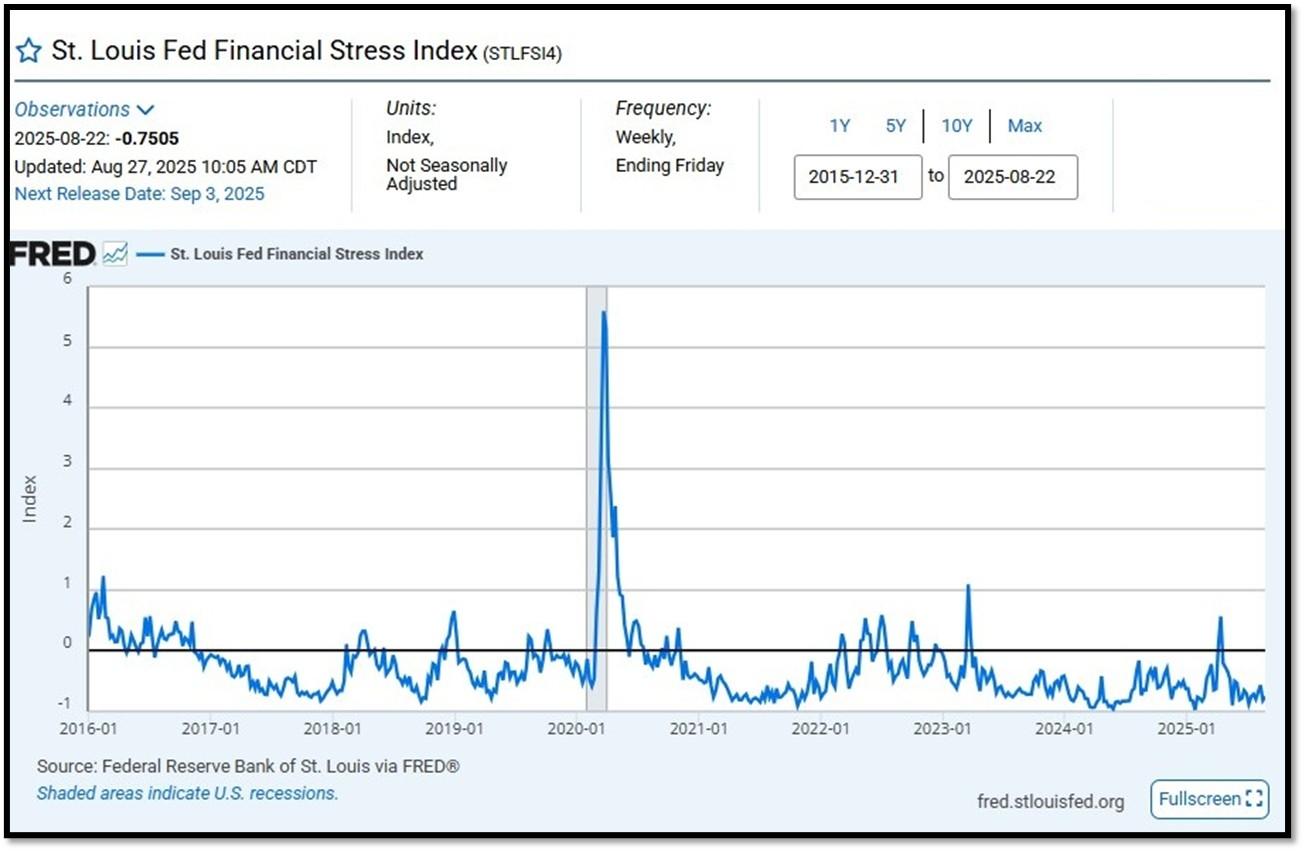
5B. St. Louis Fed Financial Stress Index’s (STLFSI4) most recent read is at –0.7505 as of August 27, 2025. Previous week’s data was -0.5681. A big spike up from previous readings reflecting the turmoil in the banking sector back in 2023. This weekly index is not seasonally adjusted. The STLFSI4 measures the degree of financial stress in the markets and is constructed from 18 weekly data series: seven interest rate series, six yield spreads and five other indicators. Each of these variables captures some aspect of financial stress. Accordingly, as the level of financial stress in the economy changes, the data series are likely to move together. REF: St. Louis Fed
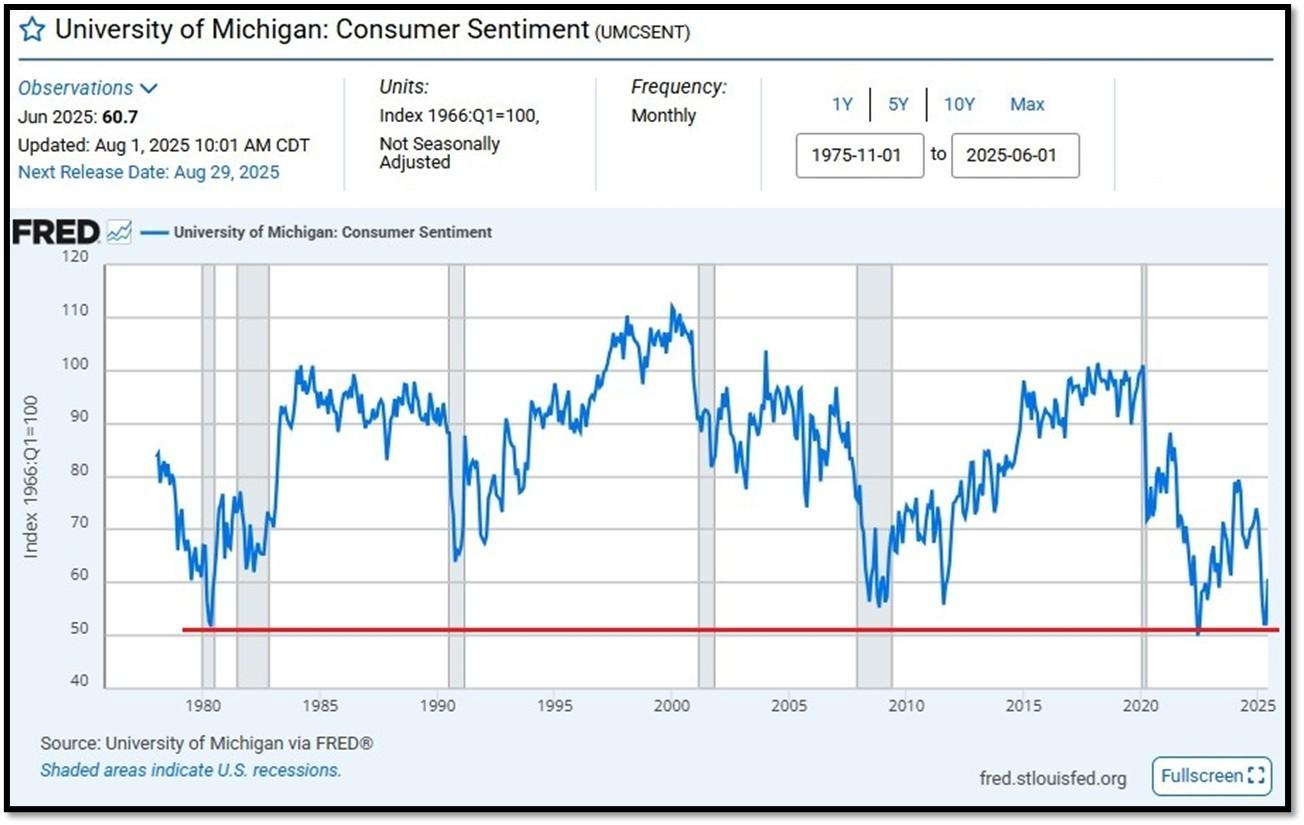
5C. University of Michigan, University of Michigan: Consumer Sentiment for February [UMCSENT] at 60.7, retrieved from FRED, Federal Reserve Bank of St. Louis, August 1, 2025. Back in June 2022, Consumer Sentiment hit a low point going back to April 1980. REF: UofM
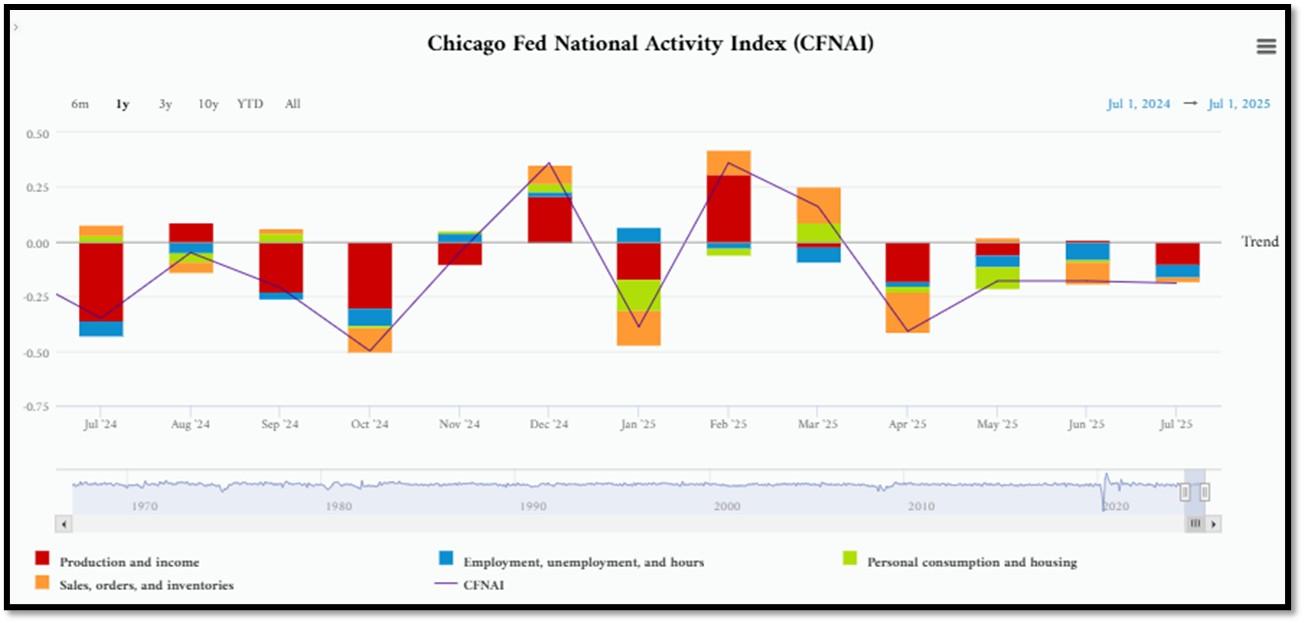
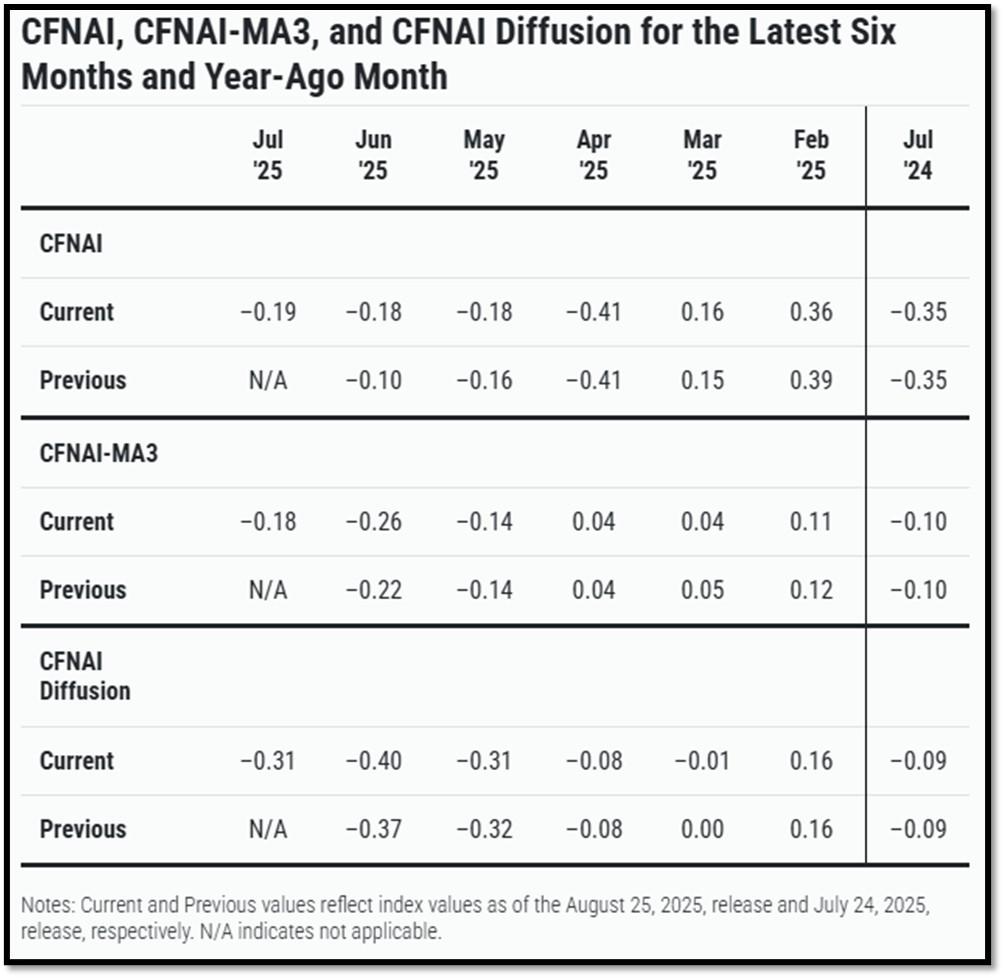
5D. The Chicago Fed National Activity Index (CFNAI) decreased to –0.19 in July from –0.18 in June. One of the four broad categories of indicators used to construct the index decreased from June, and three categories made negative contributions in July. The index’s three-month moving average, CFNAI-MA3, increased to –0.18 in July from –0.26 in June. REF: ChicagoFed, June’s Report
5E. (8/21/2025) The Conference Board Leading Economic Index (LEI) for the US inched down by 0.1% in July 2025 to 98.7 (2016=100), after declining by 0.3% in June. The LEI fell by 2.7% over the six months between January and July 2025, a faster rate of decline than its –1.0% contraction over the previous six-month period (July 2024 to January 2025. The composite economic indexes are the key elements in an analytic system designed to signal peaks and troughs in the business cycle. The indexes are constructed to summarize and reveal common turning points in the economy in a clearer and more convincing manner than any individual component. The CEI is highly correlated with real GDP. The LEI is a predictive variable that anticipates (or “leads”) turning points in the business cycle by around 7 months. Shaded areas denote recession periods or economic contractions. The dates above the shaded areas show the chronology of peaks and troughs in the business cycle. The ten components of The Conference Board Leading Economic Index® for the U.S. include: Average weekly hours in manufacturing; Average weekly initial claims for unemployment insurance; Manufacturers’ new orders for consumer goods and materials; ISM® Index of New Orders; Manufacturers’ new orders for nondefense capital goods excluding aircraft orders; Building permits for new private housing units; S&P 500® Index of Stock Prices; Leading Credit Index™; Interest rate spread (10-year Treasury bonds less federal funds rate); Average consumer expectations for business conditions. REF: ConferenceBoard, LEI Report for June (ReceesionAlert) (Released on 7/31/2025)
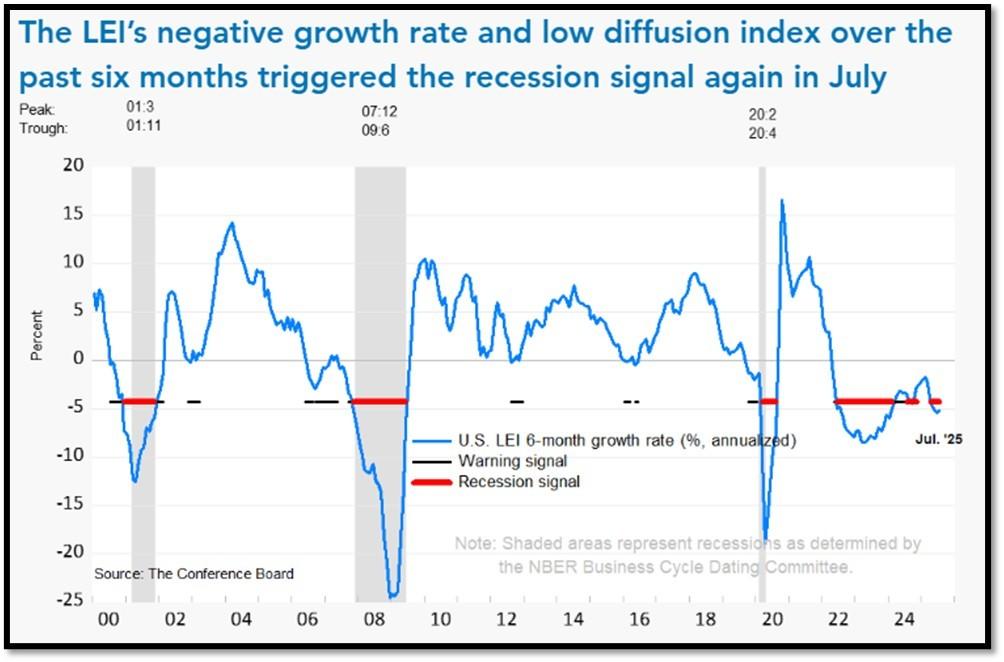
We have experienced a “rolling recession” since June 2022 and are only now emerging from it. However, authorities are not labeling it a recession due to high employment data.
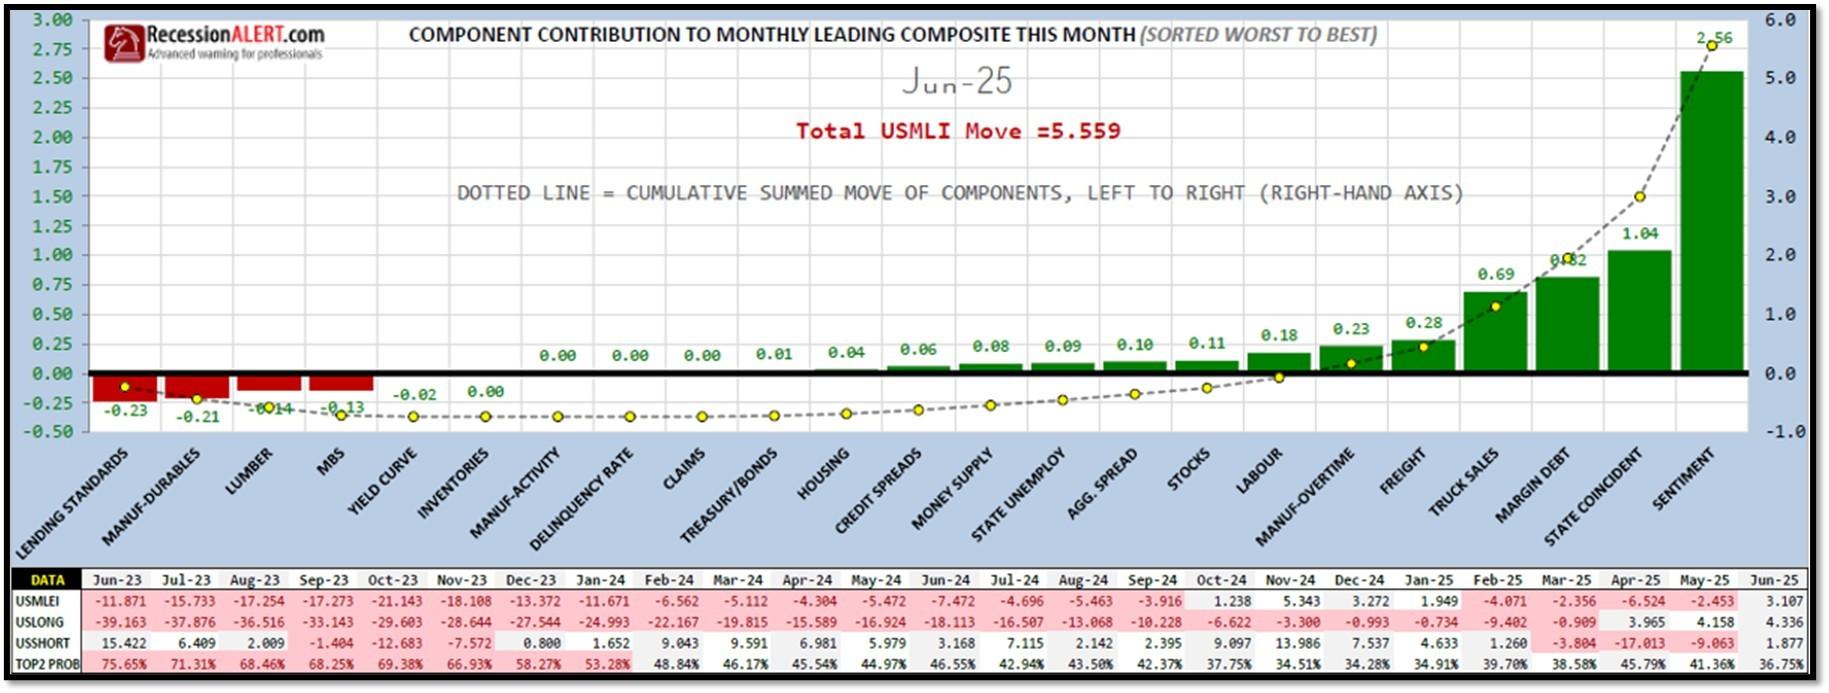
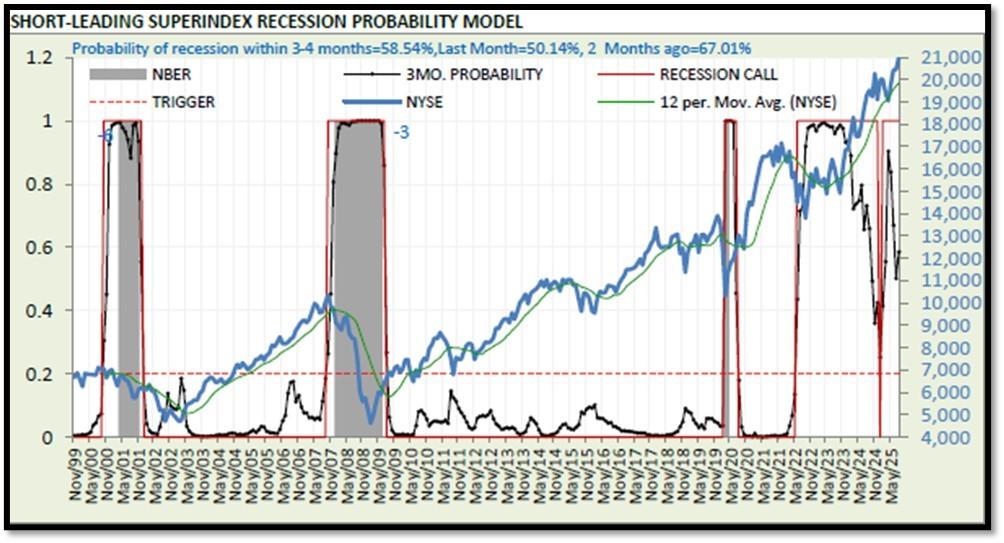
5F. Probability of U.S. falling into Recession within 3 to 4 months is currently at 58.54% (with data as of 08/26/2025 – Next Report 09/09/2025) according to RecessionAlert Research. Last release’s data was at 63.1%. This report is updated every two weeks. REF: RecessionAlertResearch
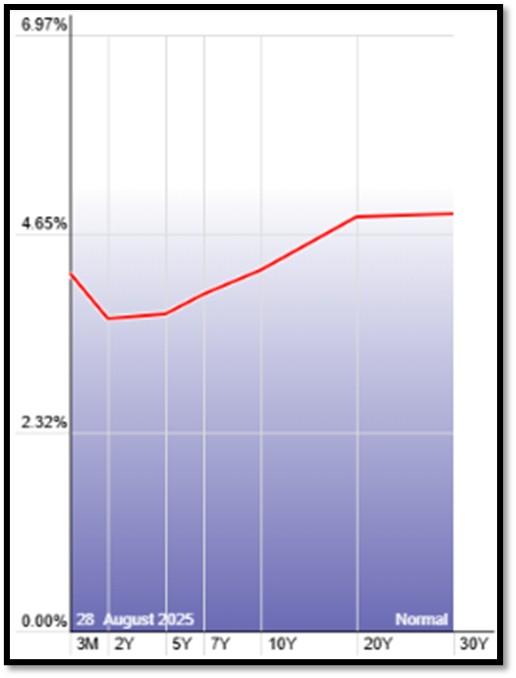
5G. Yield Curve as of 8/28/2025 is showing Normal. Spread on the 10-yr Treasury Yield (4.21%) minus yield on the 2-yr Treasury Yield (3.63%) is currently at 58bps. REF: Stockcharts The yield curve—specifically, the spread between the interest rates on the ten-year Treasury note and the three-month Treasury bill—is a valuable forecasting tool. It is simple to use and significantly outperforms other financial and macroeconomic indicators in predicting recessions two to six quarters ahead. REF: NYFED
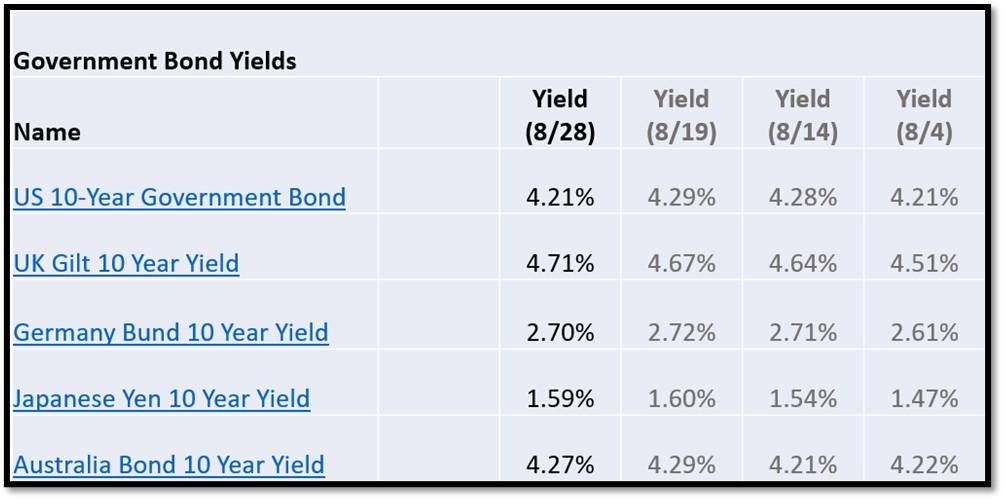
5H. Recent Yields in 10-Year Government Bonds. REF: Source is from Bloomberg.com, dated 8/28/2025, rates shown below are as of 8/28/2025, subject to change.
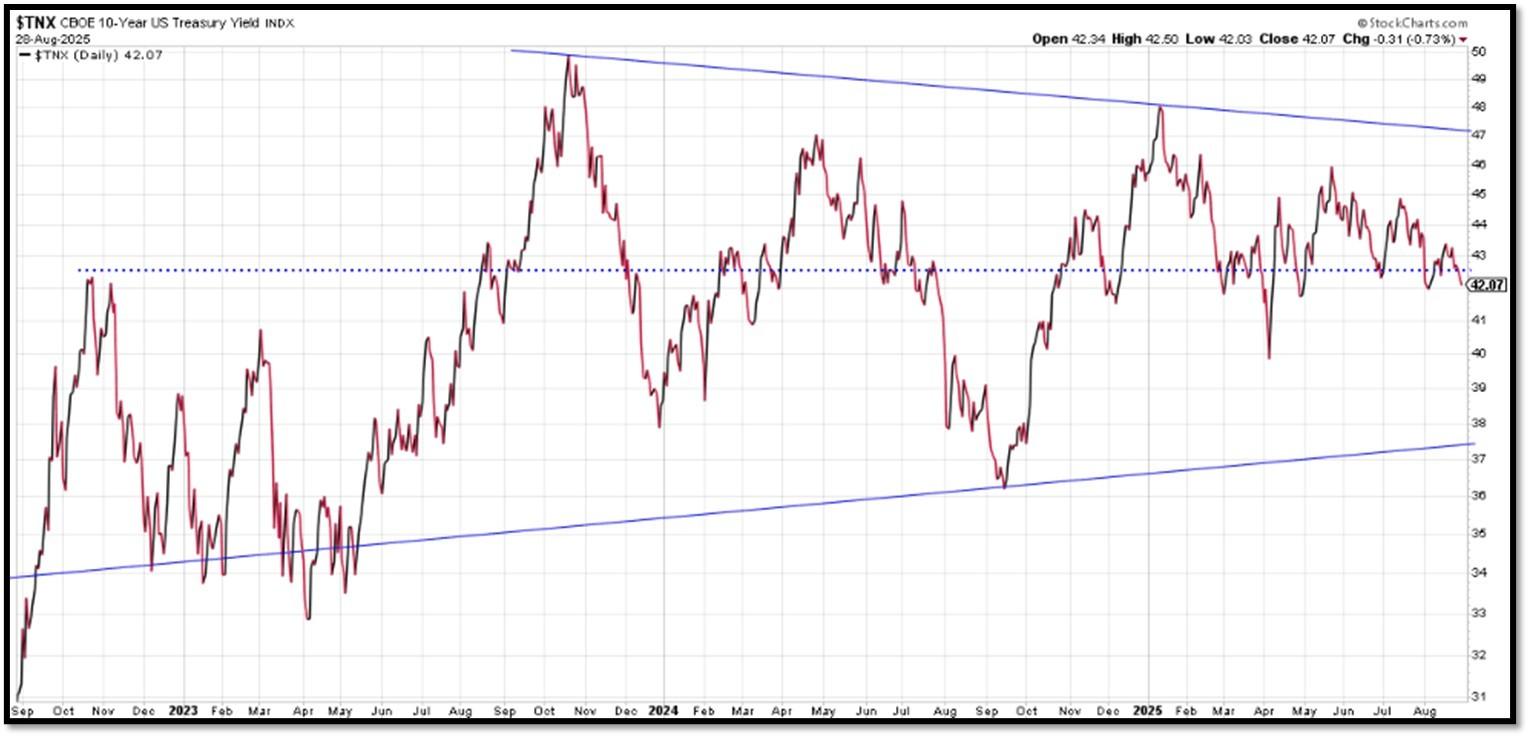
The 10-Year US Treasury Yield… The 10-Year Yield is indirectly related to inflation. I expect the 10-Year Yield to drop further as dis-inflation kicks in. REF: StockCharts1
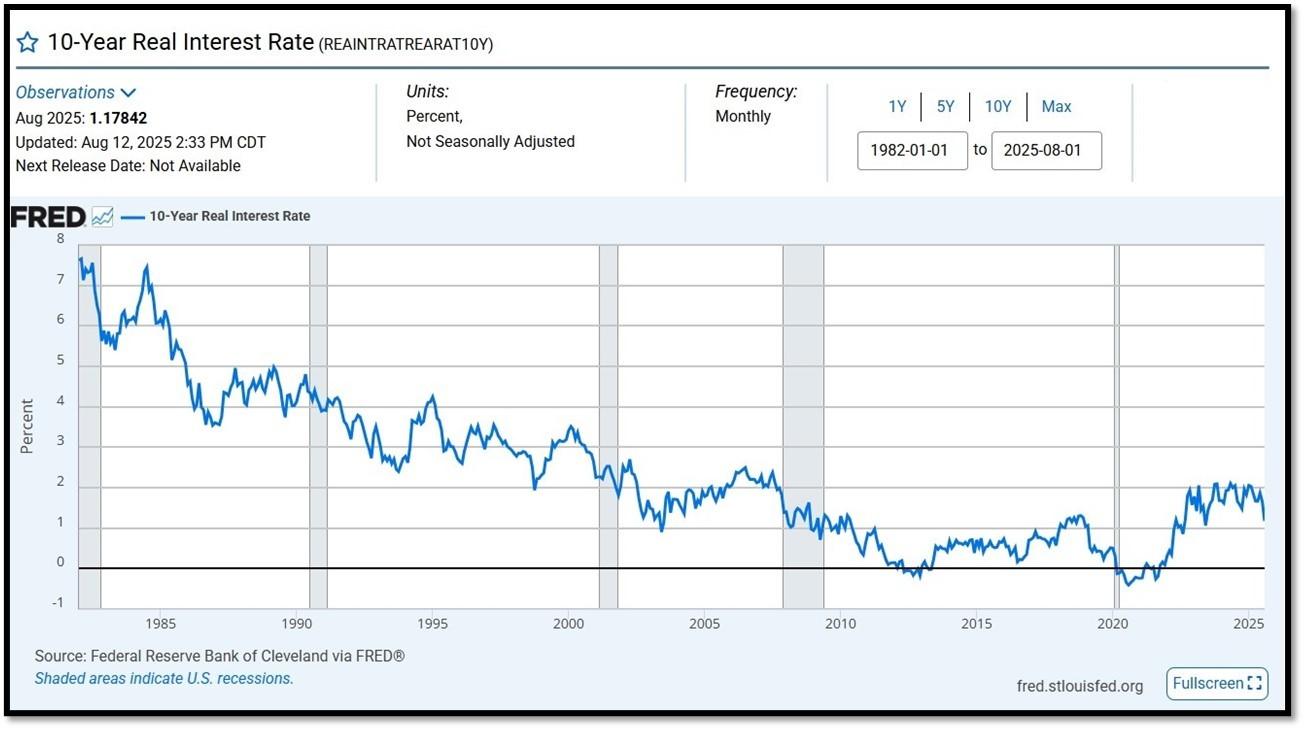
10-Year Real Interest Rate at 1.17842% as of 8/12/25. Last month’s data was 1.64906%. REF: REAINTRATREARAT10Y
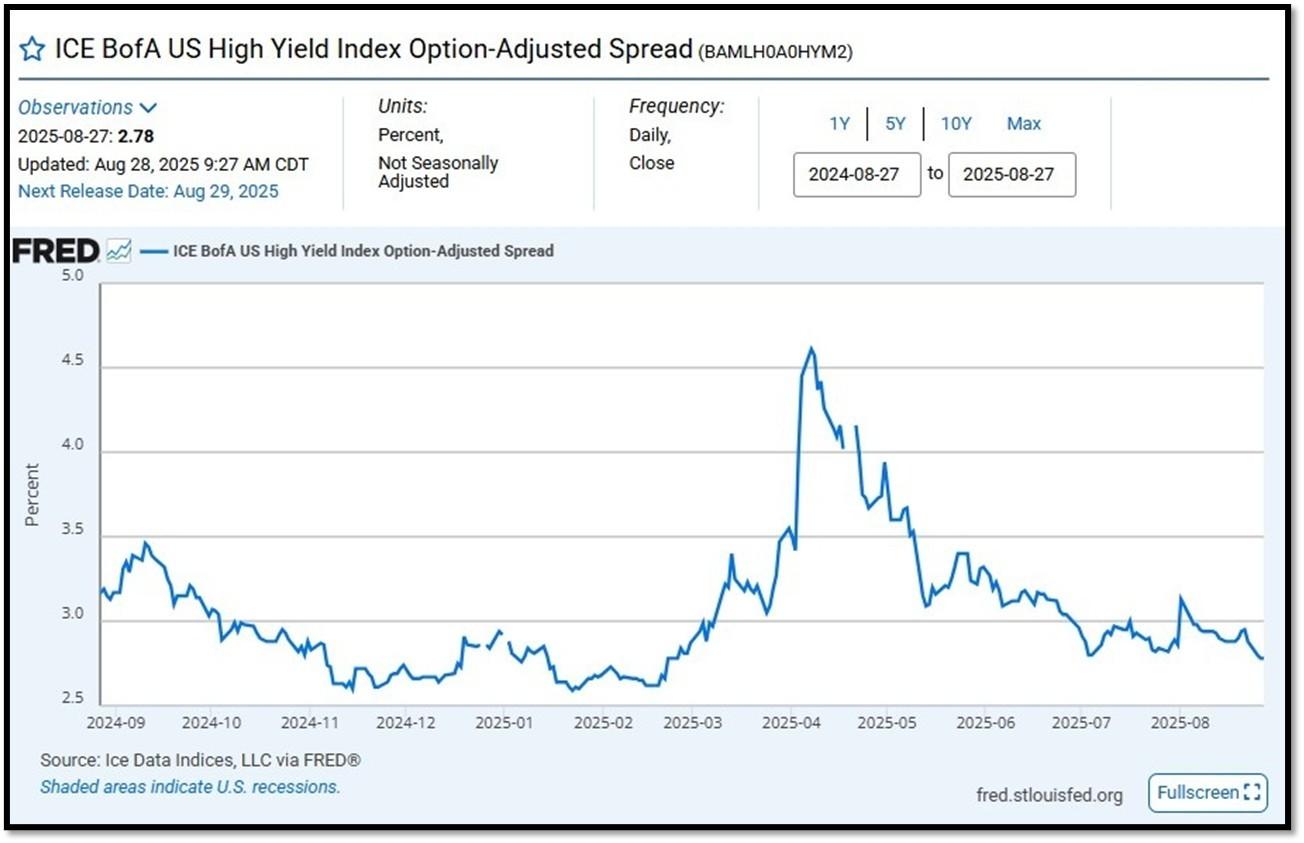
ICE BofA US High Yield Index Option-Adjusted Spread (BAMLH0A0HYM2) currently at 2.78 as of August 28, 2025. This is a key indicator of market sentiment, particularly regarding risk and economic health. At its core, the spread reflects the extra return investors demand to hold riskier corporate debt over safer government securities. High-yield bonds are issued by companies with lower credit ratings (below investment grade, like BB or lower), meaning they carry a higher chance of default. The spread compensates for this risk. When the spread is narrow—say, around 2.5% to 3%, as seen recently—it suggests investors are confident, willing to accept less extra yield because they perceive lower default risk or a strong economy. Narrow spreads often align with bullish markets, where cash is flowing, growth is steady, and fear is low. REF: FRED-BAMLH0A0HYM2
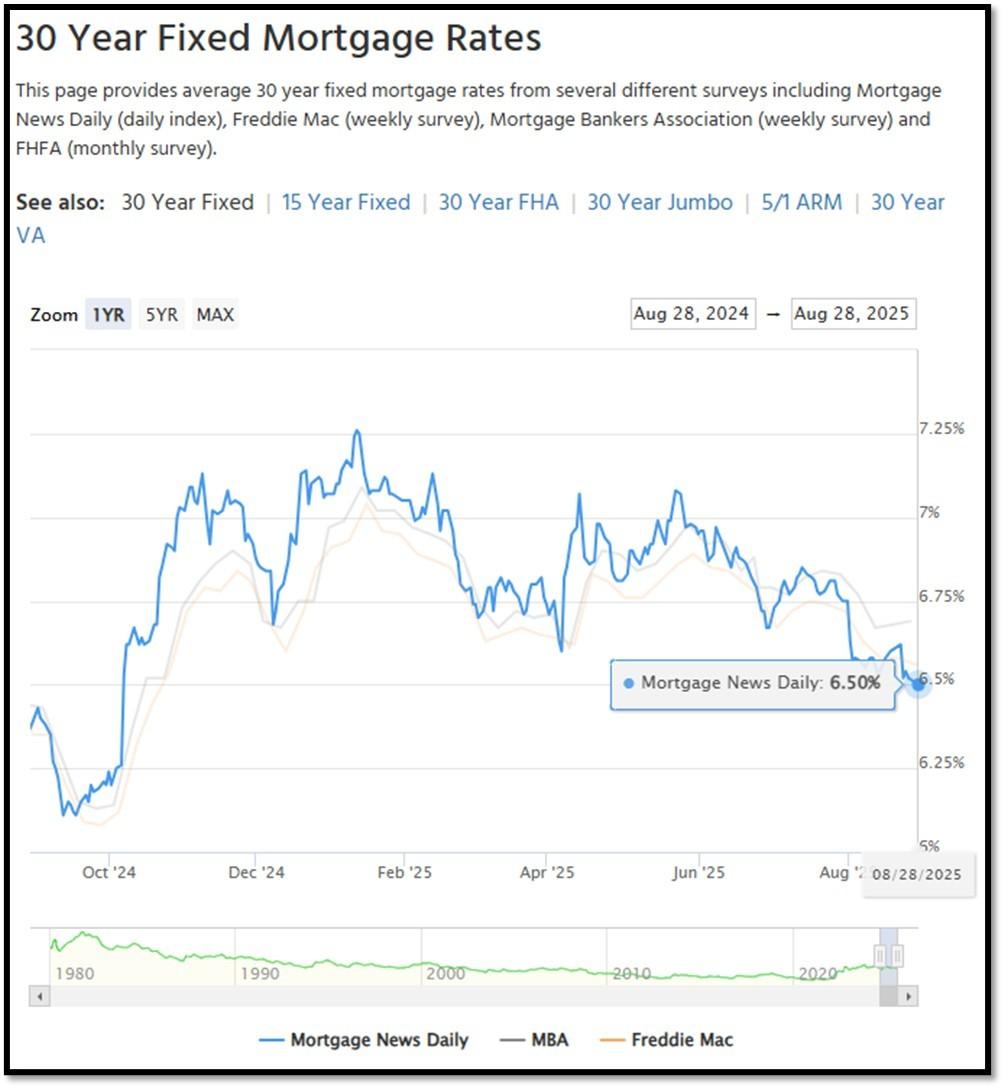
5I. (8/28/2025) Today’s National Average 30-Year Fixed Mortgage Rate is 6.50% (All Time High was 8.03% on 10/19/23). Last week’s data was 6.61%. This rate is the average 30-year fixed mortgage rates from several different surveys including Mortgage News Daily (daily index), Freddie Mac (weekly survey), Mortgage Bankers Association (weekly survey) and FHFA (monthly survey). REF: MortgageNewsDaily, Today’s Average Rate
The recent spike in the 30-year fixed-rate jumbo mortgage to 6.50%, compared to Freddie Mac’s rate at 6.56% and the Mortgage Bankers Association (MBA) rate at 6.69%, highlights key differences in the mortgage market. Jumbo mortgages, which exceed the conforming loan limits set by government agencies like Freddie Mac, typically carry higher interest rates because they are riskier for lenders. These loans are not backed by government entities, which increases the risk for lenders and, consequently, leads to higher rates. In contrast, Freddie Mac and MBA provide averages for conforming loans, which meet federal guidelines and have lower risk due to government backing, keeping their rates lower.
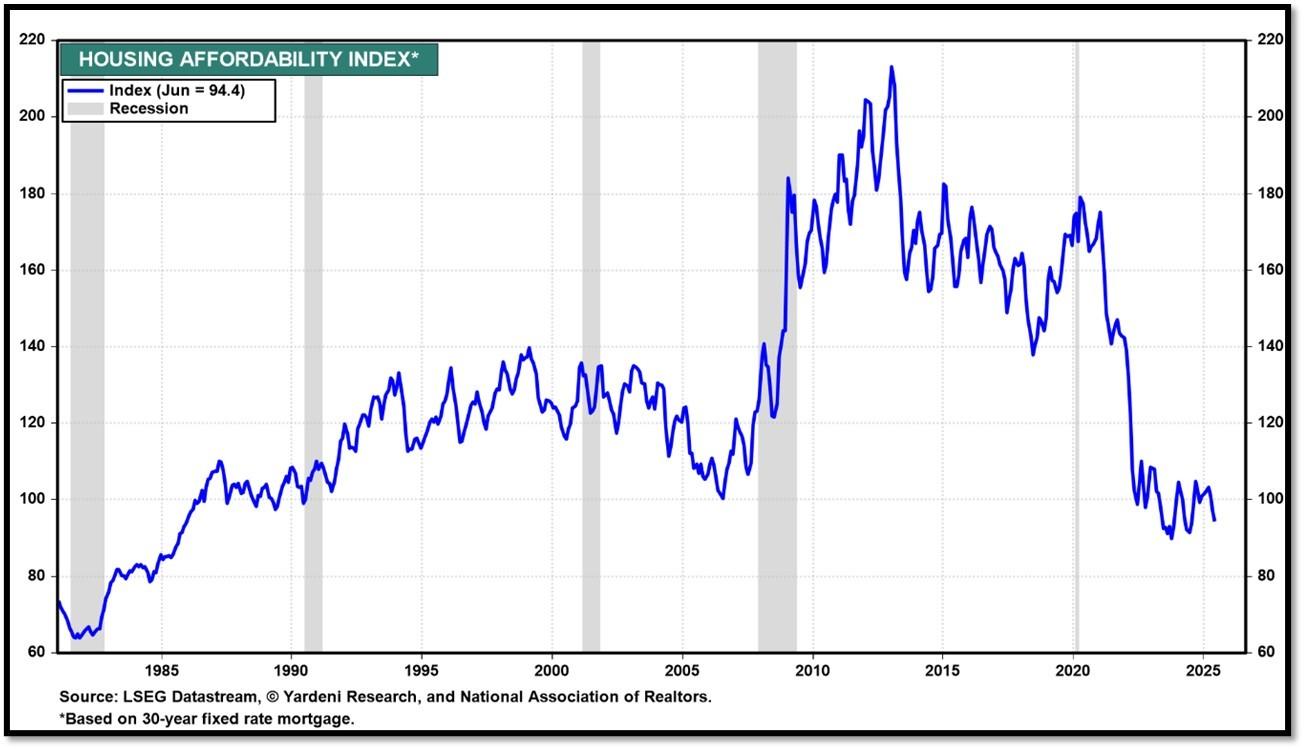
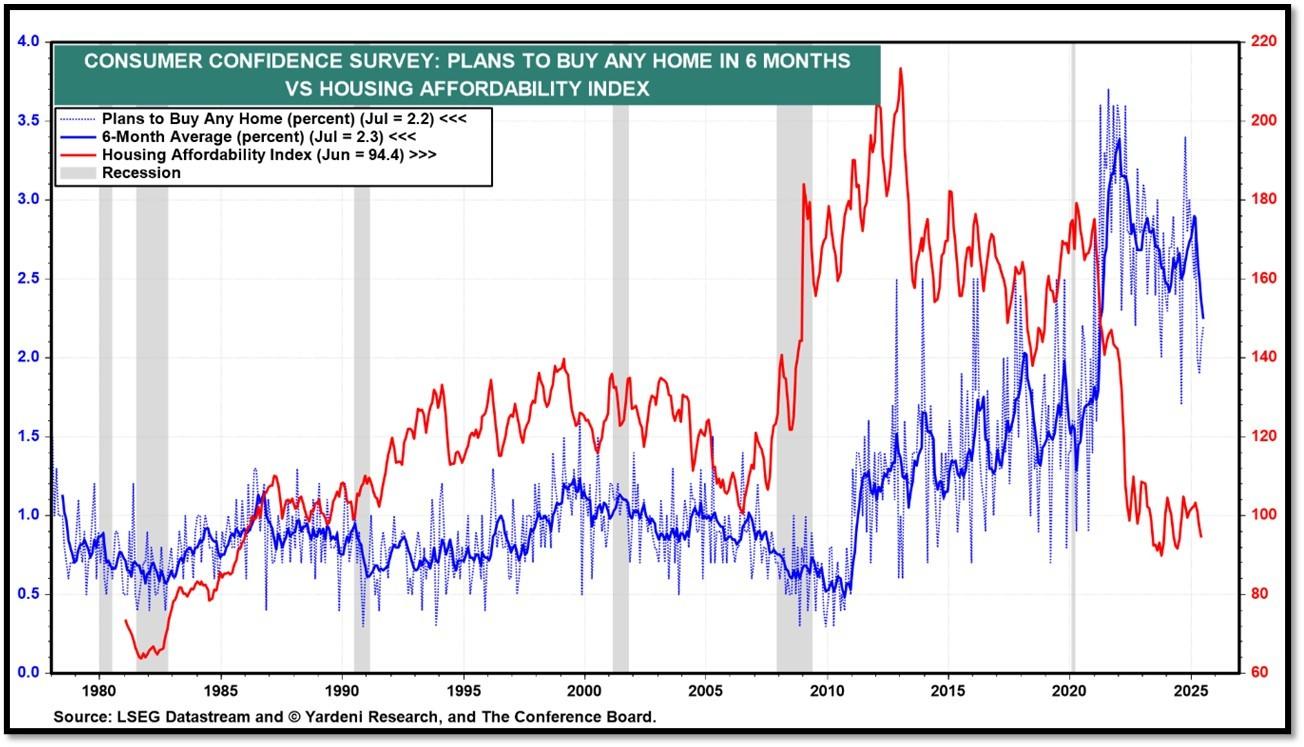
Housing Affordability Index for Jun = 94.4 // May = 97.2 // Apr = 101.0 // Mar = 103.2 // Feb = 102.2 // Jan = 100.7 // Dec = 100.7 // Nov = 99 // Oct = 102.3. Data provided by Yardeni Research. REF: Yardeni
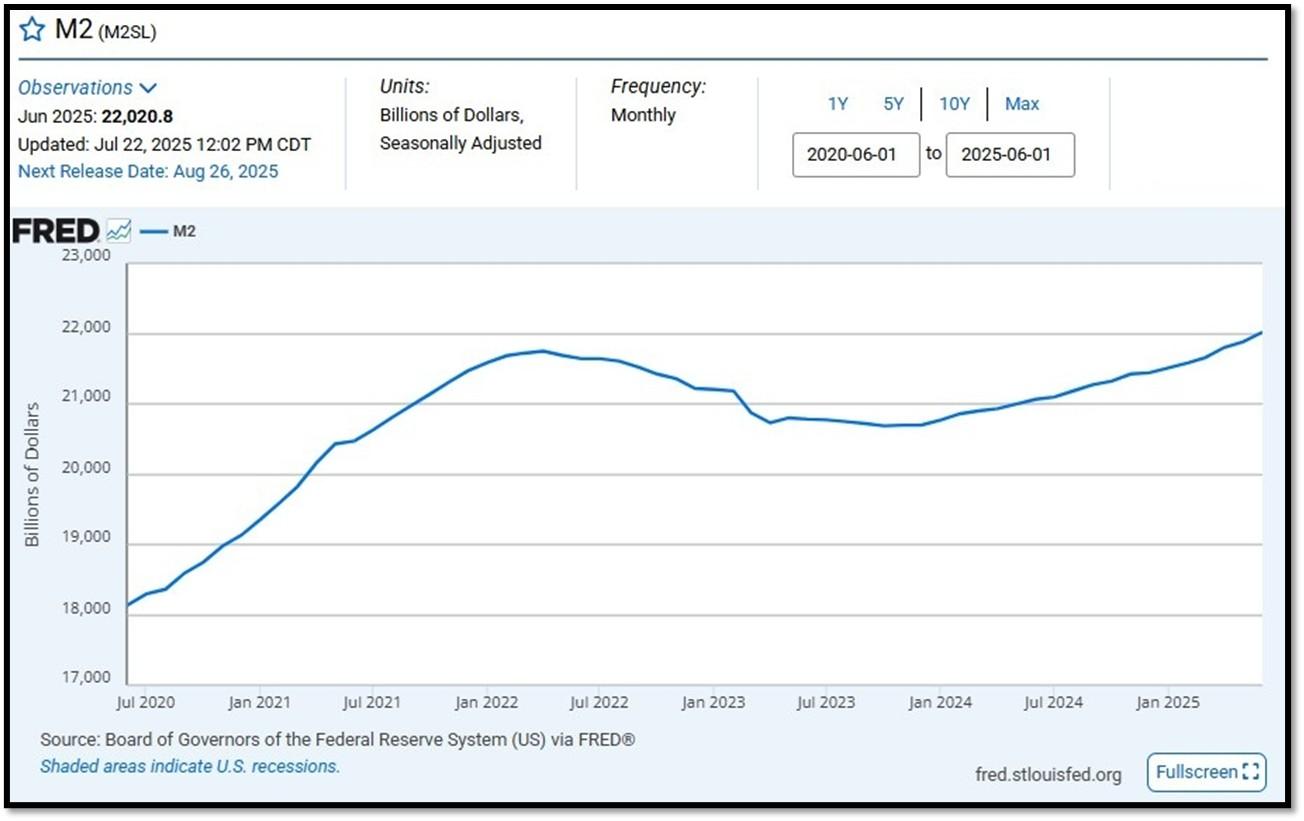
5J. Velocity of M2 Money Stock (M2V) with current read at 1.386 as of (Q2-2025 updated August 28, 2025). Previous quarter’s data was 1.386. The velocity of money is the frequency at which one unit of currency is used to purchase domestically- produced goods and services within a given time period. In other words, it is the number of times one dollar is spent to buy goods and services per unit of time. If the velocity of money is increasing, then more transactions are occurring between individuals in an economy. Current Money Stock (M2) report can be viewed in the reference link. REF: St.LouisFed-M2V
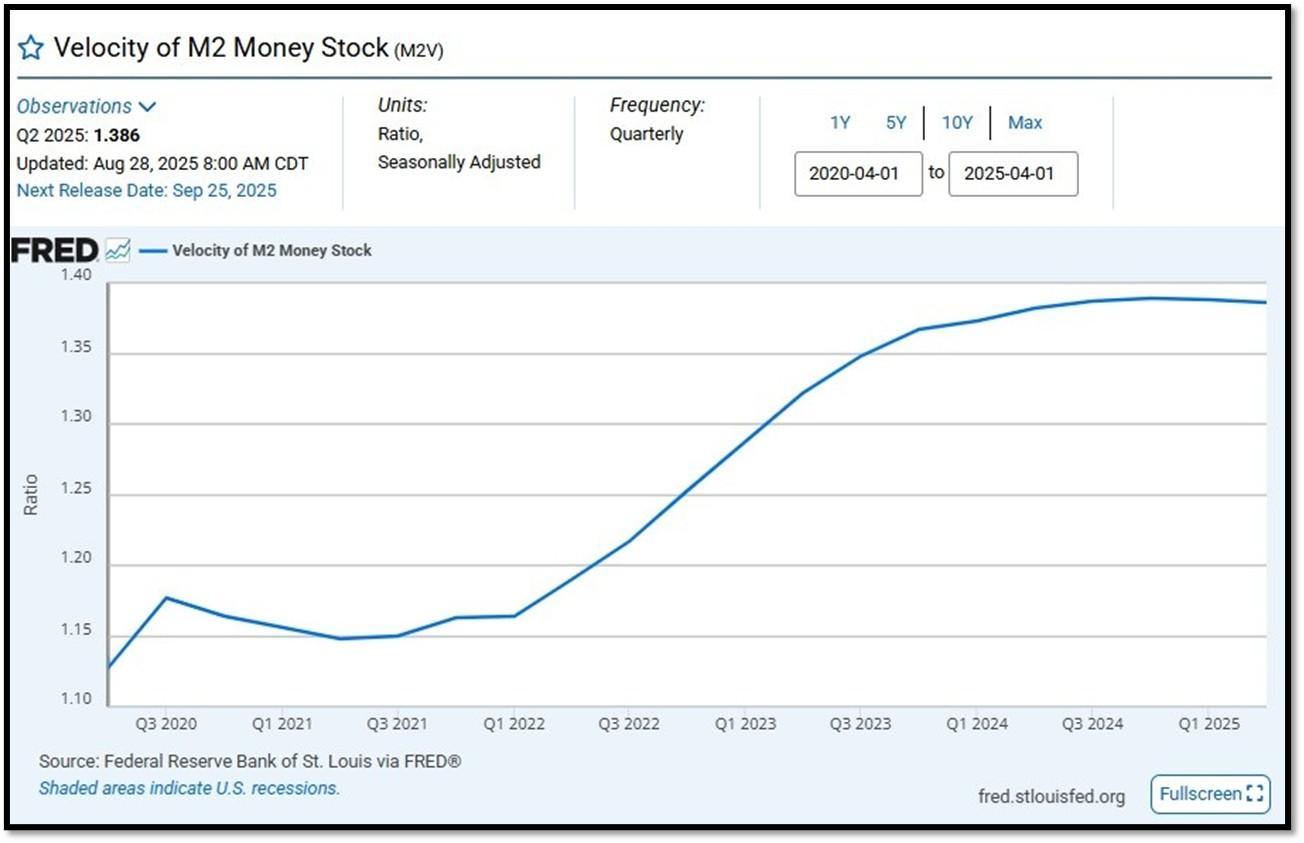
M2 consists of M1 plus (1) small-denomination time deposits (time deposits in amounts of less than $100,000) less IRA and Keogh balances at depository institutions; and (2) balances in retail MMFs less IRA and Keogh balances at MMFs. Seasonally adjusted M2 is constructed by summing savings deposits (before May 2020), small-denomination time deposits, and retail MMFs, each seasonally adjusted separately, and adding this result to seasonally adjusted M1. Board of Governors of the Federal Reserve System (US), M2 [M2SL], retrieved from FRED, Federal Reserve Bank of St. Louis; Updated on July 22, 2025. REF: St.LouisFed-M2
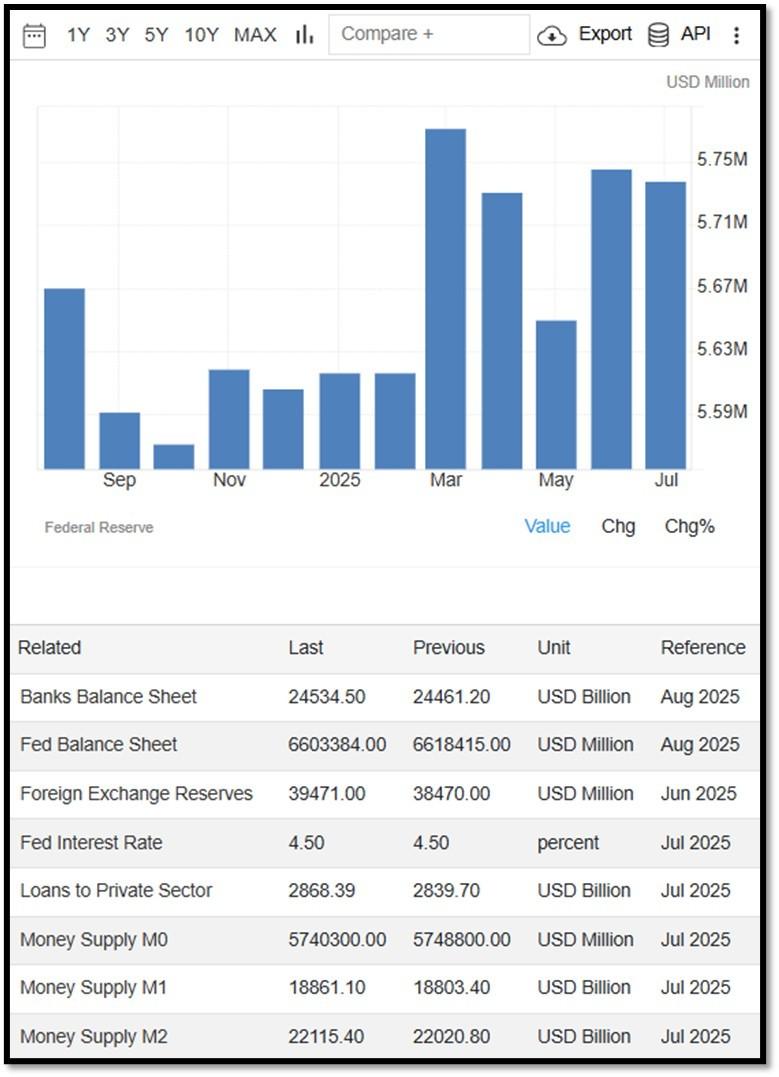
Money Supply M0 in the United States decreased to 5,740,300 USD Million in July from 5,748,800 USD Million in June of 2025. Money Supply M0 in the United States averaged 1,205,962.08 USD Million from 1959 until 2025, reaching an all-time high of 6,413,100.00 USD Million in December of 2021 and a record low of 48,400.00 USD Million in February of 1961. REF: TradingEconomics, M0
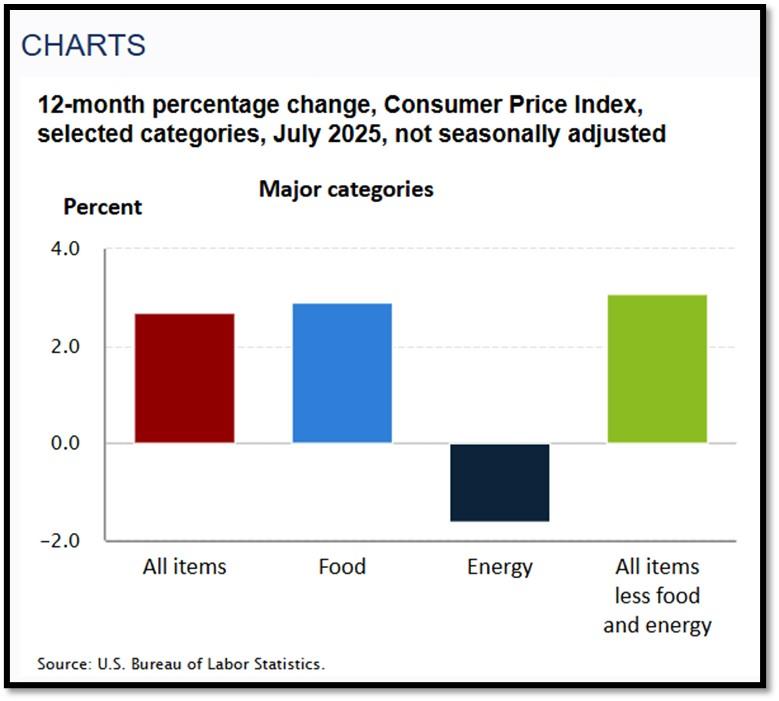
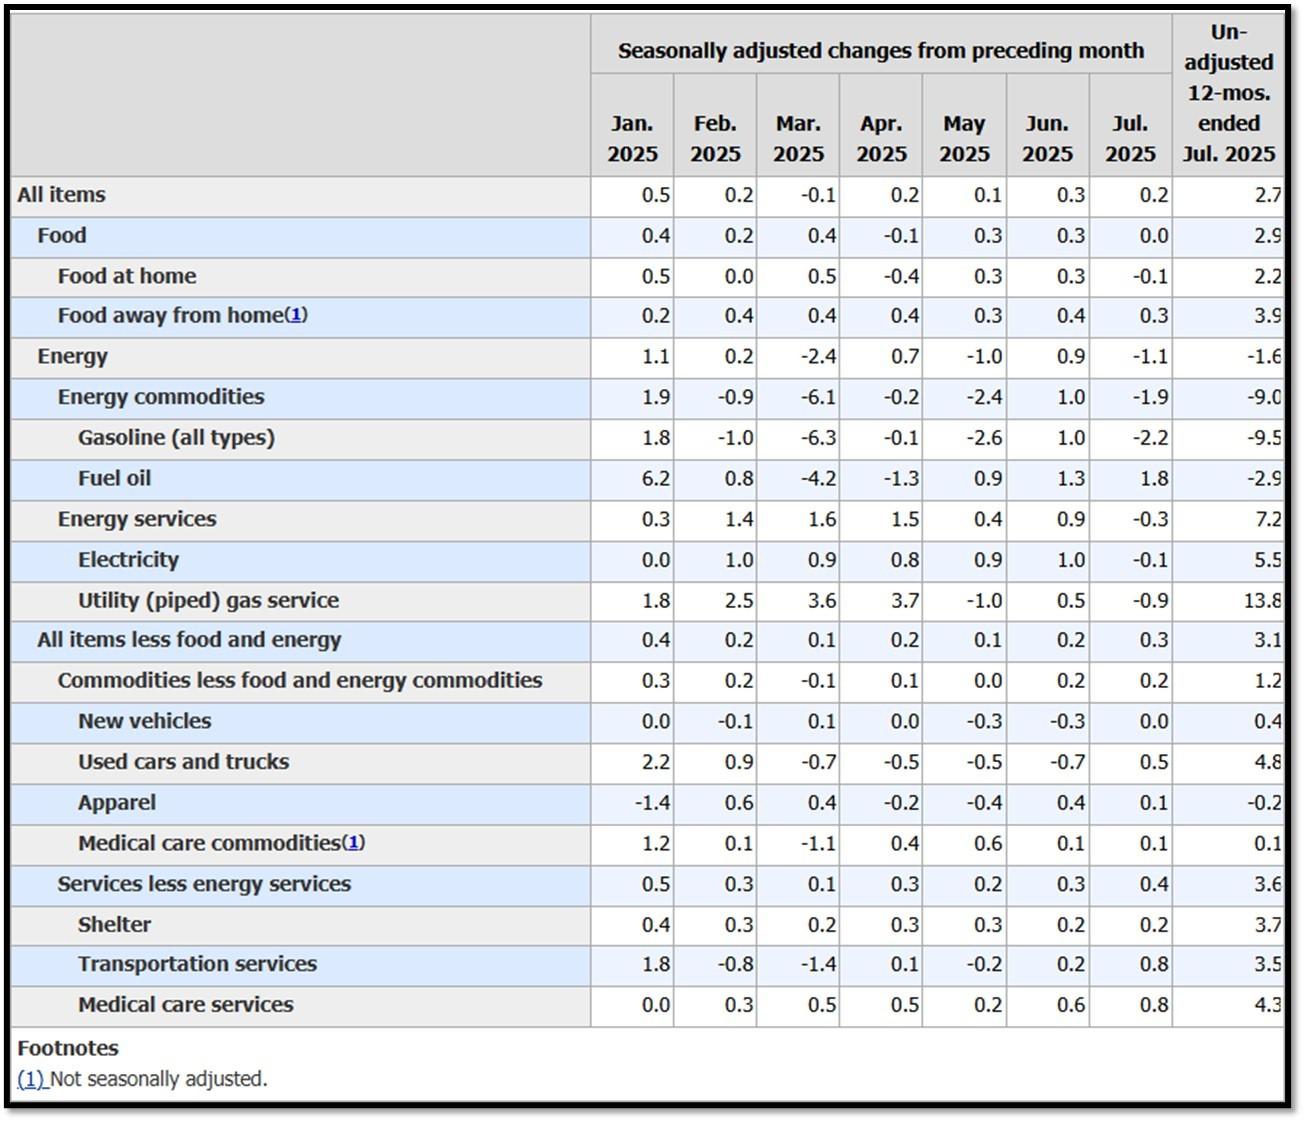
5K. In July, the Consumer Price Index for All Urban Consumers rose 0.2 percent, seasonally adjusted, and rose 2.7 percent over the last 12 months, not seasonally adjusted. The index for all items less food and energy increased 0.3 percent in July (SA); up 3.1 percent over the year (NSA). August 2025 CPI data are scheduled to be released on September 11, 2025, at 8:30AM-ET. REF: BLS, BLS.GOV
5L. Technical Analysis of the S&P500 Index. Click onto reference links below for images.
- Short-term Chart: Trend Bullish on 8/28/2025 – REF: Short-term S&P500 Chart by Marc Slavin (Click Here to Access Chart)
- Medium-term Chart: Trend Bearish to Bullish on 8/28/2025 – REF: Medium-term S&P500 Chart by Marc Slavin (Click Here to Access Chart)
- Market Timing Indicators – S&P500 Index as of 8/28/2025 – REF: S&P500 Charts (7 of them) by Joanne Klein’s Top 7 (Click Here to Access Updated Charts)
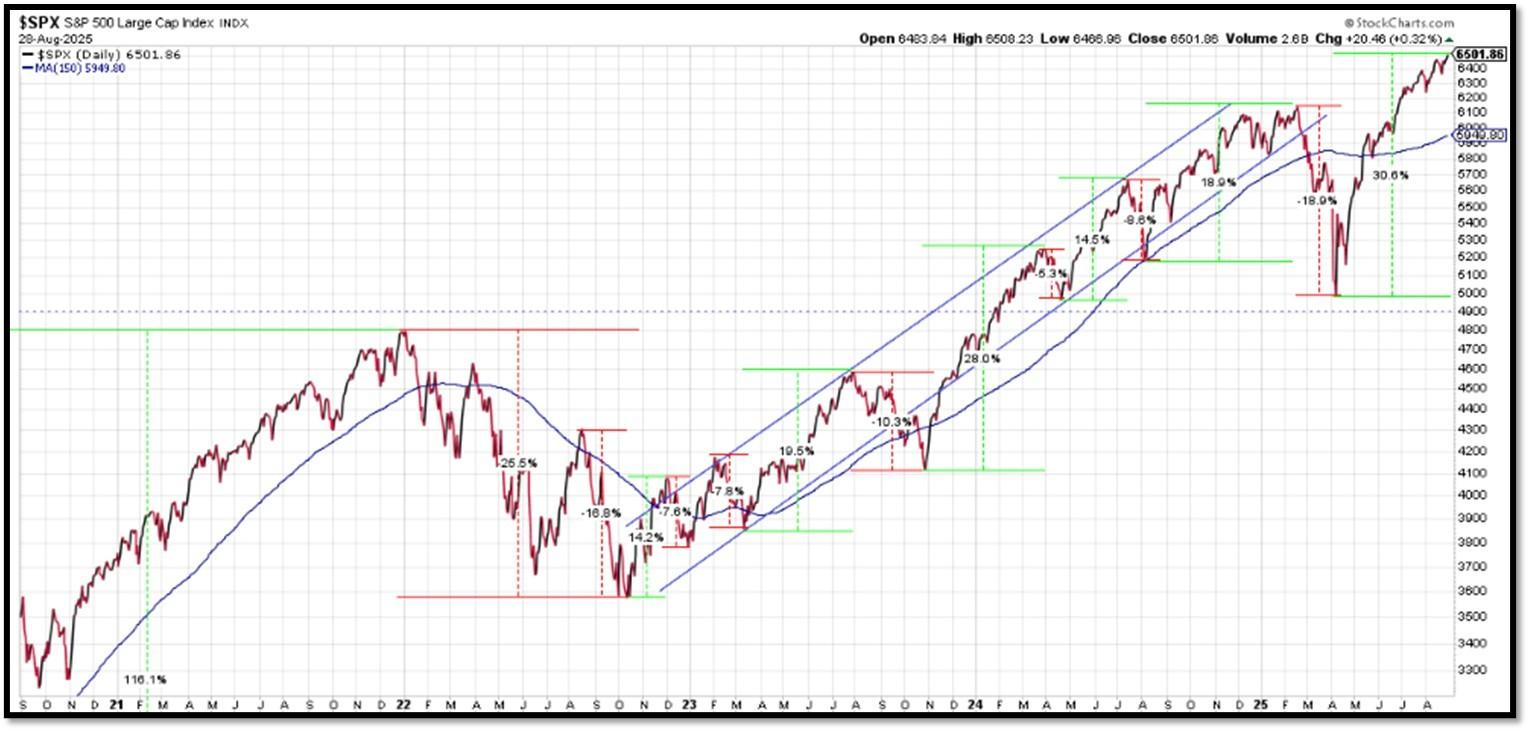
- The S&P500 is hitting all-time-high, rebounding from a V-shaped recovery. This is one of the ‘most-hated’ rallies. REF: Stockcharts
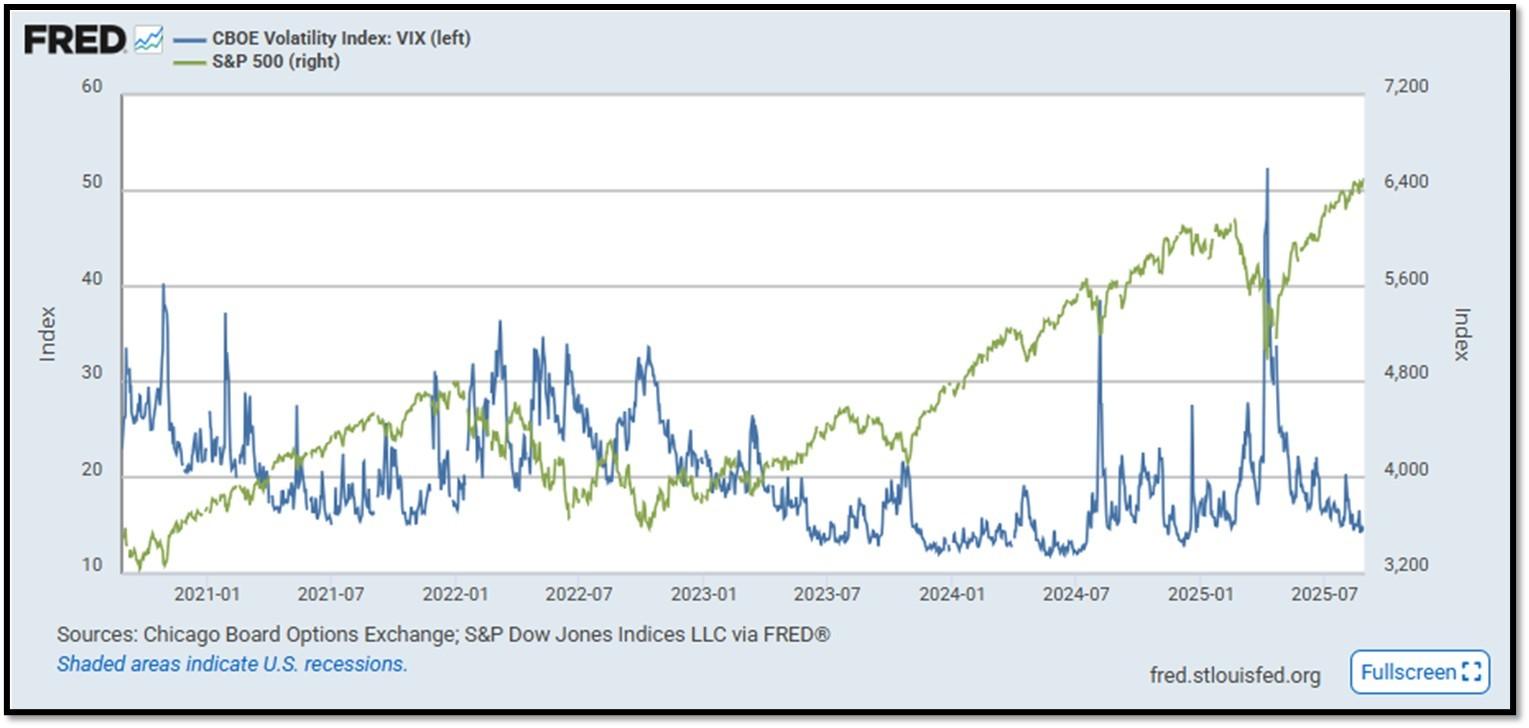
- S&P500 and CBOE Volatility Index (VIX) as of 8/28/2025. REF: FRED, Today’s Print
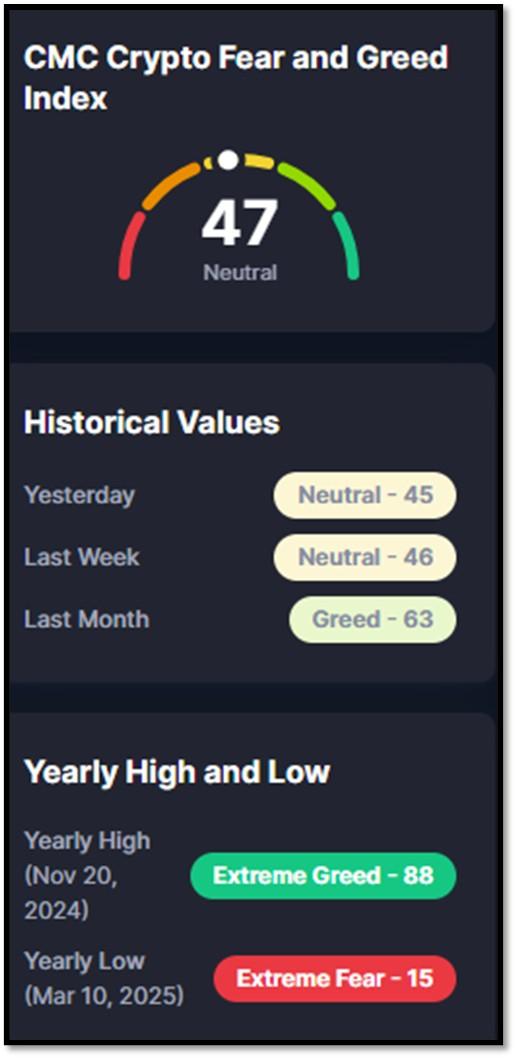
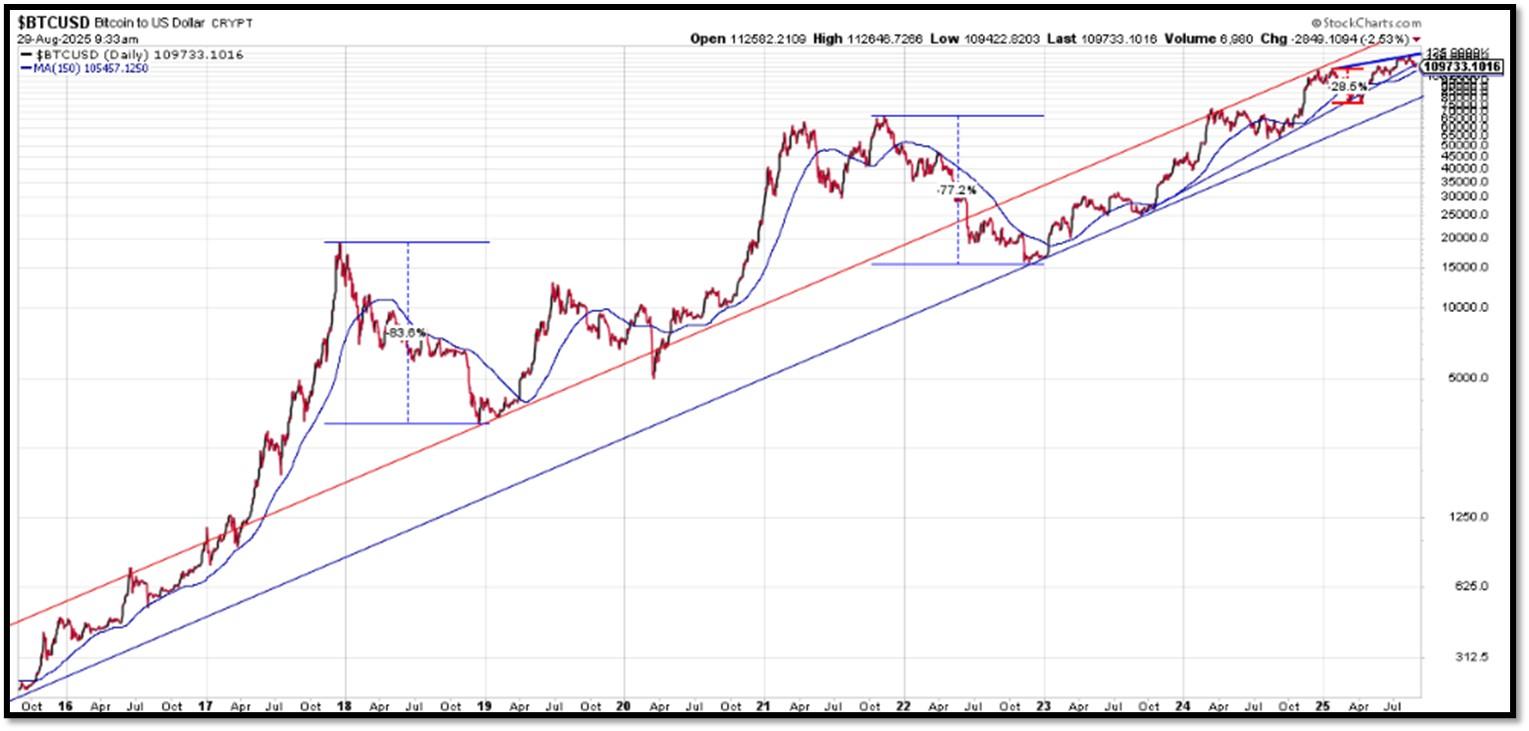
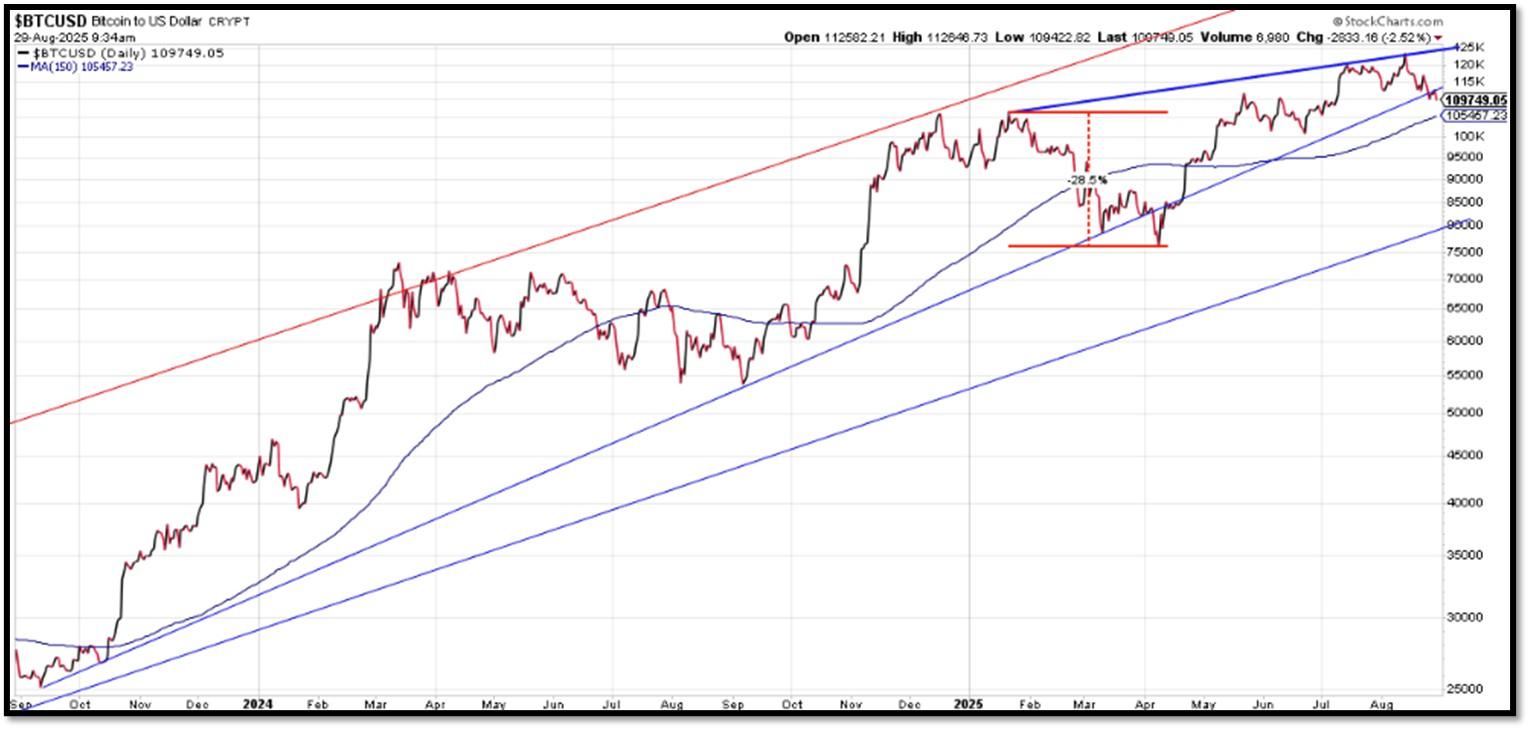
5M. Most recent read on the Crypto Fear & Greed Index with data as of 8/28/2025 is 47 (Neutral). Last week’s data was 46 (Neutral) (1-100). Fear & Greed Index – A Contrarian Data. The crypto market behavior is very emotional. People tend to get greedy when the market is rising which results in FOMO (Fear of missing out). Also, people often sell their coins in irrational reaction of seeing red numbers. With the Crypto Fear and Greed Index, the data try to help save investors from their own emotional overreactions. There are two simple assumptions:
- Extreme fear can be a sign that investors are too worried. That could be a buying opportunity.
- When Investors are getting too greedy, that means the market is due for a correction.
Therefore, the program for this index analyzes the current sentiment of the Bitcoin market and crunch the numbers into a simple meter from 0 to 100. Zero means “Extreme Fear”, while 100 means “Extreme Greed”. REF: Coinmarketcap.com, Today’sReading
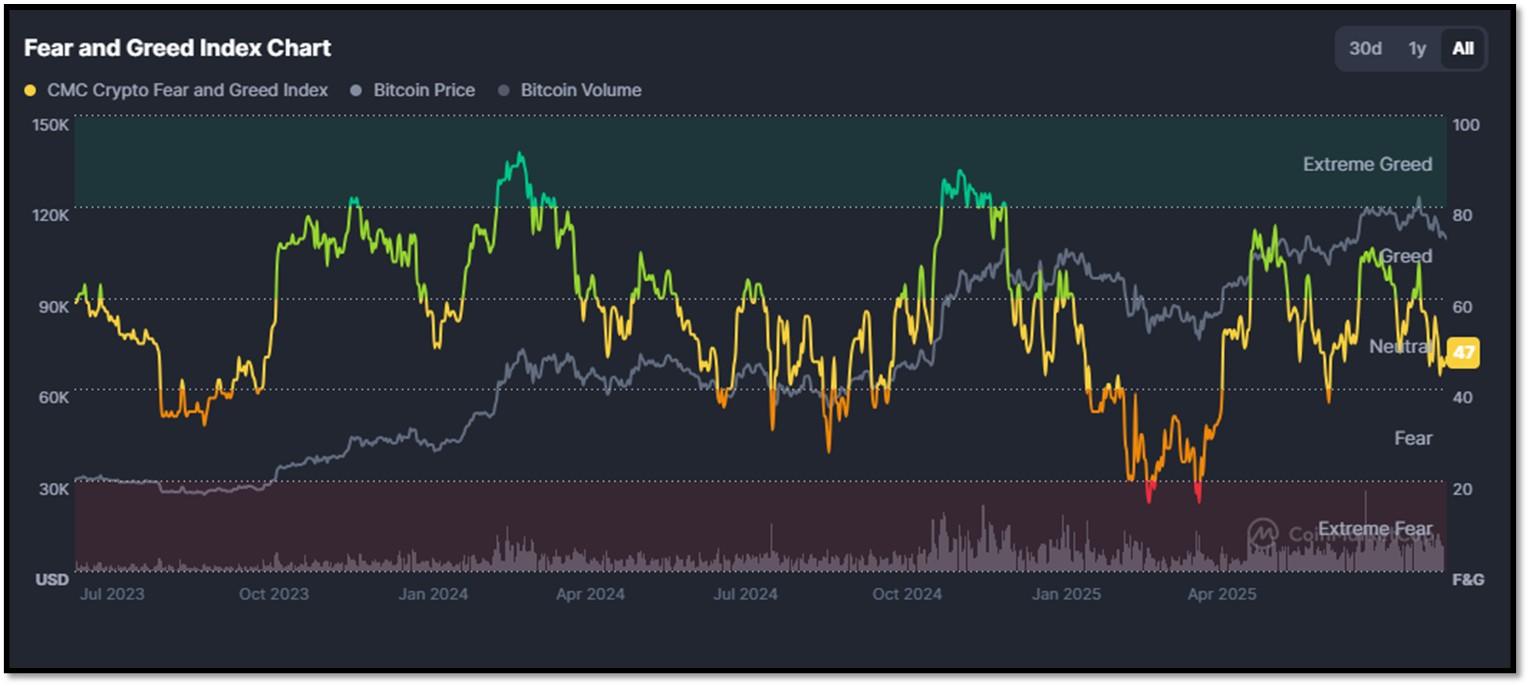
Bitcoin – 10-Year & 2-Year Charts. REF: Stockcharts10Y, Stockcharts2Y
From the desk of our Chief Investment Officer
As an investment professional with over twenty-six years of experience in the financial services industry, Andrew helps clients to protect, grow and transfer wealth during their lifetime with objective, unbiased, customized and efficient strategies.
Education, Professional Licenses Acquired & Affiliations
- Passed the Series 7, 63, 65 and 24 license examinations
- Currently holding Series 65 License
- BA in Economics – Boston University (Boston, MA) 1993
- Certificate in Commodities Trading – New York University (New York, NY) 1991
- Certificate in Financial Planning – New York University (New York, NY) April 2011
With extensive experience in the Financial Services Industry, Andrew Tang and Turner Financial Group provides disciplined wealth management with an intelligent caring approach to each and every client that compliments the Dedicated Financial offering.


Len writes much of his own content, and also shares helpful content from other trusted providers like Turner Financial Group (TFG).
The material contained herein is intended as a general market commentary, solely for informational purposes and is not intended to make an offer or solicitation for the sale or purchase of any securities. Such views are subject to change at any time without notice due to changes in market or economic conditions and may not necessarily come to pass. This information is not intended as a specific offer of investment services by Dedicated Financial and Turner Financial Group, Inc.
Dedicated Financial and Turner Financial Group, Inc., do not provide tax, legal or accounting advice. You should consult your own tax, legal and accounting advisors before engaging in any transaction.
Any hyperlinks in this document that connect to Web Sites maintained by third parties are provided for convenience only. Turner Financial Group, Inc. has not verified the accuracy of any information contained within the links and the provision of such links does not constitute a recommendation or endorsement of the company or the content by Dedicated Financial or Turner Financial Group, Inc. The prices/quotes/statistics referenced herein have been obtained from sources verified to be reliable for their accuracy or completeness and may be subject to change.
Past performance is no guarantee of future returns. Investing involves risk and possible loss of principal capital. The views and strategies described herein may not be suitable for all investors. To the extent referenced herein, real estate, hedge funds, and other private investments can present significant risks, including loss of the original amount invested. All indexes are unmanaged, and an individual cannot invest directly in an index. Index returns do not include fees or expenses.
Turner Financial Group, Inc. is an Investment Adviser registered with the United States Securities and Exchange Commission however, such registration does not imply a certain level of skill or training and no inference to the contrary should be made. Additional information about Turner Financial Group, Inc. is also available at www.adviserinfo.sec.gov. Advisory services are only offered to clients or prospective clients where Turner Financial Group, Inc. and its representatives are properly licensed or exempt from licensure. No advice may be rendered by Turner Financial Group, Inc. unless a client service agreement is in place.


