

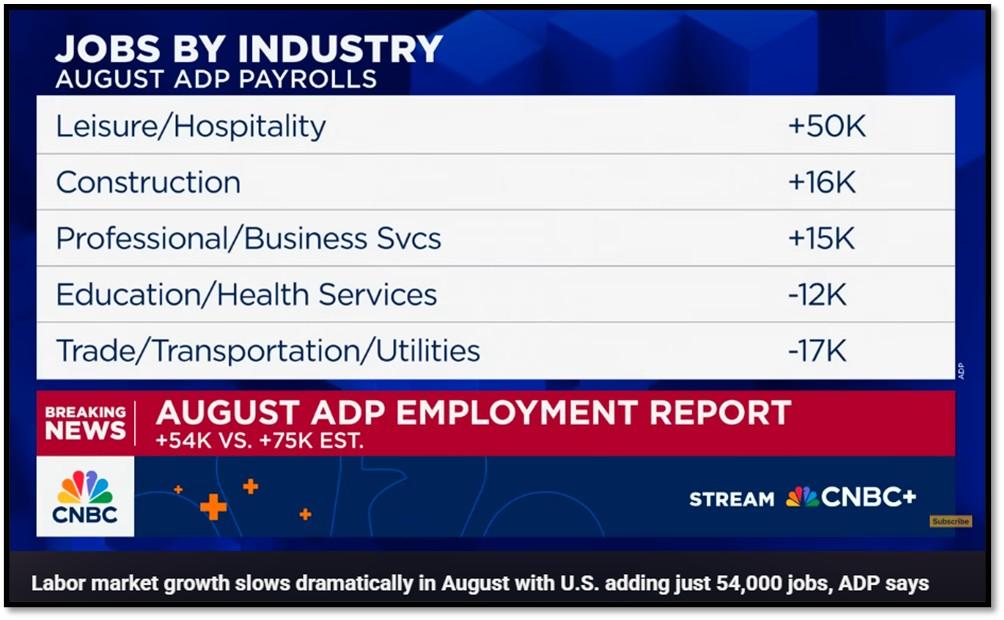
- 1. This week’s data confirmed a softening economic backdrop, with the ISM manufacturing index stuck in contraction at 48.7 and services barely expanding above 50, while jobless claims ticked higher to 237,000 even as continuing claims eased, signaling a labor market that is gradually loosening; meanwhile, crude oil inventories surprised with a 2.4 million-barrel build, weighing on energy markets.
- 2. This week, we would like to shine a spotlight on two items that are healthcare/life-science related.
- 3. This week, I want to highlight another bright spot for our tactical allocation of Tesla.
- 4. World Watch
- 4A. Chinese President Xi Jinping hosted a grand military parade in Beijing’s Tiananmen Square to mark the 80th anniversary of Japan’s World War II surrender, showcasing China’s advanced military arsenal, including hypersonic missiles and stealth fighters.
- 4B. A Bloomberg report from 9/4/25, highlights the resilience of Asia’s export hubs, such as Thailand, Vietnam, and South Korea, despite U.S. “reciprocal tariffs” imposed in April 2025.
- 4C. An updated snapshot of the current global state of economy.
- 5. Quant & Technical Corner – A selection of quantitative & technical data we monitor on a regular basis to help gauge the overall financial market conditions and the investment environment.
1. This week’s data confirmed a softening economic backdrop, with the ISM manufacturing index stuck in contraction at 48.7 and services barely expanding above 50, while jobless claims ticked higher to 237,000 even as continuing claims eased, signaling a labor market that is gradually loosening; meanwhile, crude oil inventories surprised with a 2.4 million-barrel build, weighing on energy markets.
Stock indices failed to break out on the heels of these releases, instead signaling a likely sideways phase or retracement of up to 10%, which would be a healthy consolidation in the context of the year’s rally. Bond spreads remain extremely thin even as economic momentum grinds lower, suggesting markets are priced for perfection. We remain cautious on the market in a broad sense given valuations at historically elevated levels – especially with the magnificent seven and the high-fliers, though there are still select stocks that appear attractive within this backdrop. Click onto picture below to access video. REF: Briefing.com
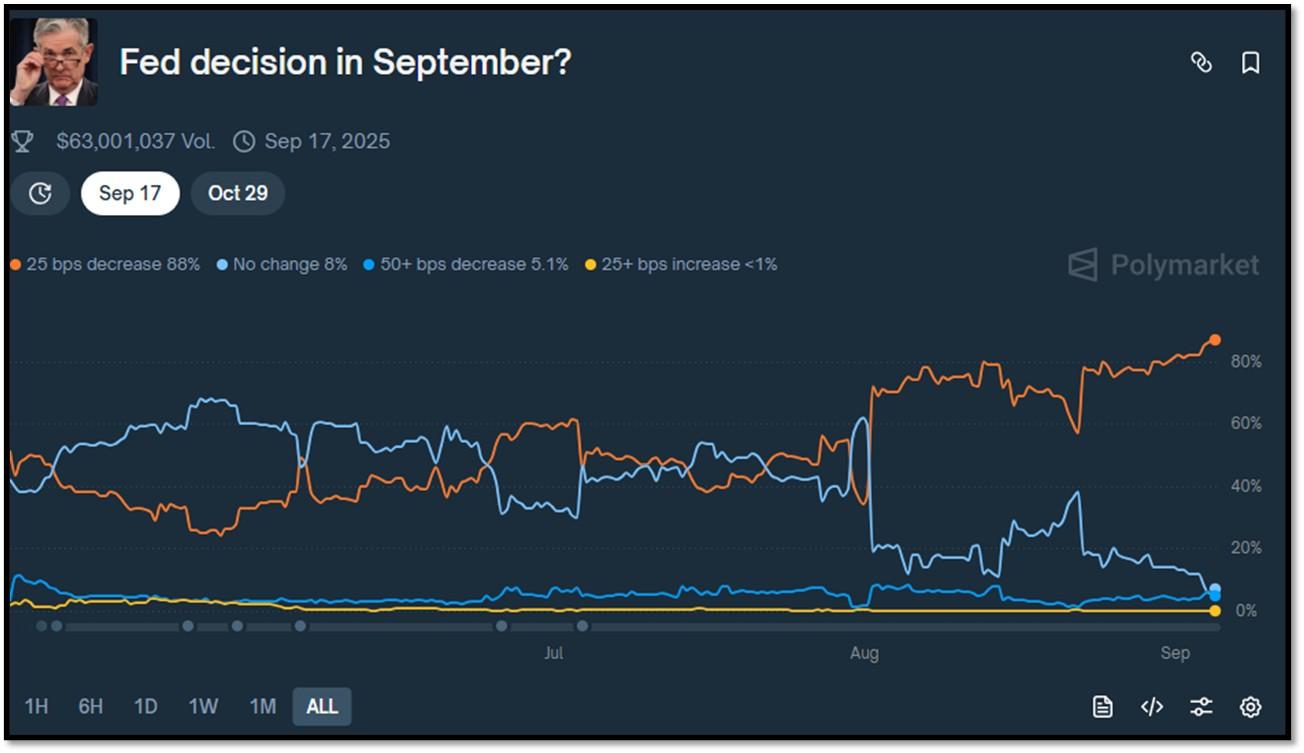
- Probability of a September Fed interest rate cut by 25bps is at 88% according to Polymarket.
2. This week, we would like to shine a spotlight on two items that are healthcare/life-science related.
First is the world’s first smart stethoscope. Researchers at Imperial College London, partnered with Eko Health, have created an AI-powered stethoscope that detects heart failure, valve disease, and atrial fibrillation in 15 seconds. Tested in the TRICORDER study across over 200 UK GP surgeries, this device uses a small module with a microphone and single-lead ECG sensor to capture subtle heart sounds and an electrocardiogram. Data is analyzed in the cloud by AI trained on thousands of patient records, identifying abnormalities with high accuracy. The study showed patients were 2.3 times more likely to be diagnosed with heart failure, 3.5 times for atrial fibrillation, and nearly twice for valve disease within a year, enabling earlier interventions. Click onto picture below to access video. REF: BBC, WION, Eko Health

Second is the unveiling of GenoMAS, a new agentic AI system designed as a specific software framework for the automated analysis of gene expression datasets using multi-agent systems. GenoMAS, which stands for Genomic Molecular Architecture System, autonomously built the first comprehensive molecular architecture of over 1,300 diseases by analyzing transcriptomic data and identifying shared genetic pathways. This breakthrough revealed over 1,000 previously hidden connections (such as links between Alzheimer’s and eye cancer), redefining disease classification beyond symptoms to focus on molecular similarities. This could revolutionize drug repurposing, personalized medicine, and healthcare. By leveraging multi-agent systems, GenoMAS demonstrates AI’s evolution from a tool to an autonomous researcher, potentially accelerating medical discoveries by orders of magnitude. While other advancements, like xAI’s Grok 2.5 open-sourcing and Microsoft’s MAI model launches, are notable, none match GenoMAS’s transformative potential for global health and scientific progress. REF: GenoMAS Imp. Paper by Liu, Li & Wang, GenoMAS_Linkedin, GenoMAS_Github

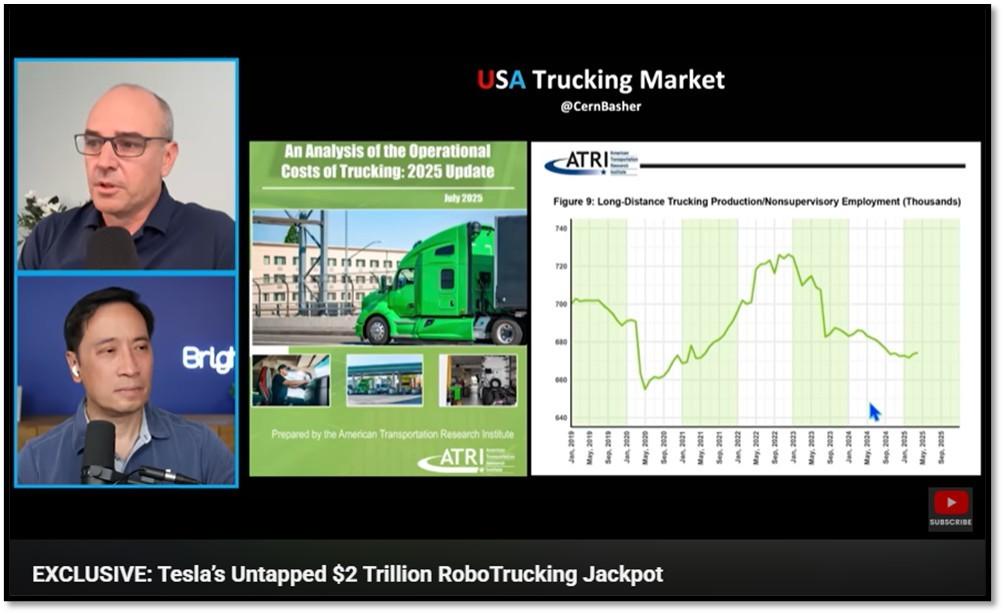
3. This week, I want to highlight another bright spot for our tactical allocation of Tesla.
On Texas’ I-45 corridor, a critical freight route between Dallas and Houston, companies like Aurora Innovations, Kodiak Robotics, PlusAI, and Bot Auto are testing autonomous trucks, or “robotrucks,” with safety drivers onboard, marking a significant step toward driverless logistics. These trials leverage Texas’ favorable regulations and predictable highways to refine SAE Level 4 autonomous systems, which promise to address driver shortages, reduce costs, and enhance safety in the trucking industry. Despite their transformative potential, these tests receive little mainstream media attention, overshadowed by flashier technologies like robotaxis. However, rapid advancements in AI and sensor technology suggest that fully autonomous trucking could soon revolutionize supply chains, making robotrucking’s arrival imminent.
Financial expert Cern Basher CFA® outlined a compelling forecast model for Tesla’s robotrucking venture, highlighting its potential to unlock significant value for the company if it overcomes technical and regulatory hurdles. Basher’s model, adapted from his earlier work on Tesla’s robotaxi and Optimus robot initiatives, suggests that autonomous electric semis could generate substantial profits, potentially surpassing the revenue of Tesla’s robotaxi business due to higher utilization rates (80–90% for trucks versus 35–55% for robotaxis) and the ability to operate nearly 24/7 without driver rest requirements. Each robo-truck could yield $770,000–$870,000 annually, with net profits of $380,000–$430,000, offering a payback period of under a year. This model assumes Tesla achieves full autonomy, leveraging its vision-based AI and vast data collection to navigate complex driving scenarios, and secures regulatory approval, which could be facilitated by a favorable political climate under a Trump administration. Despite challenges like charging infrastructure and regulatory barriers in states like California, Basher’s projections indicate that Tesla’s robotrucking could tap into the $800 billion–$1 trillion U.S. trucking market, creating an autonomous logistics ecosystem with massive upside potential for Tesla’s valuation. Click onto pictures below to access video. Try to watch video1 first. REF: Video1, Video2, CernBasher

NOTE: Not investment advice or recommendations. Investor should consider the investment objective, risks, charges and expenses carefully before investing. For additional information about securities mentioned above or in the video, please visit referenced securities mentioned above and in videos. Read carefully before investing. REF: https://ir.tesla.com/
With the current macro-economic backdrop, below are areas we currently favor:
- Fixed Income – Short-term Corporates (Low-Beta)
- Fixed Income – (Corporates & Muni) High Yield as Opportunistic Allocation (Low-Beta)
- Businesses that contribute to and benefit from AI & Automation (Market-Risk)
- Fintech & Financials (Market-Risk)
- Digital Asset – Bitcoin (Market-Risk/Hedge)
- Cloud Computing (Market-Risk)
- Biotechnology (Market-Risk)
- Cyber-Security & Software (Market-Risk)
4. World Watch
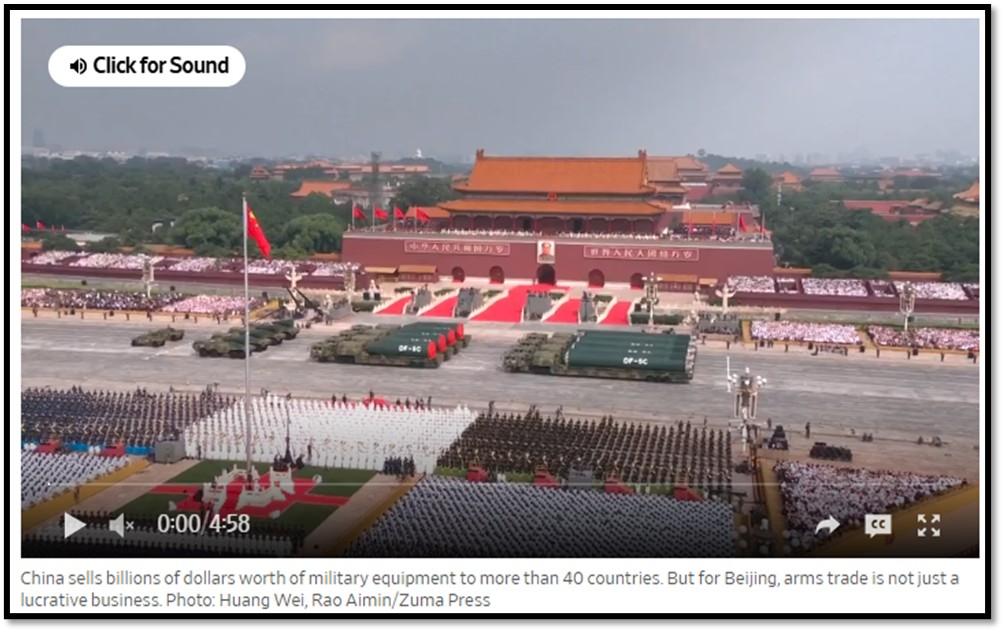
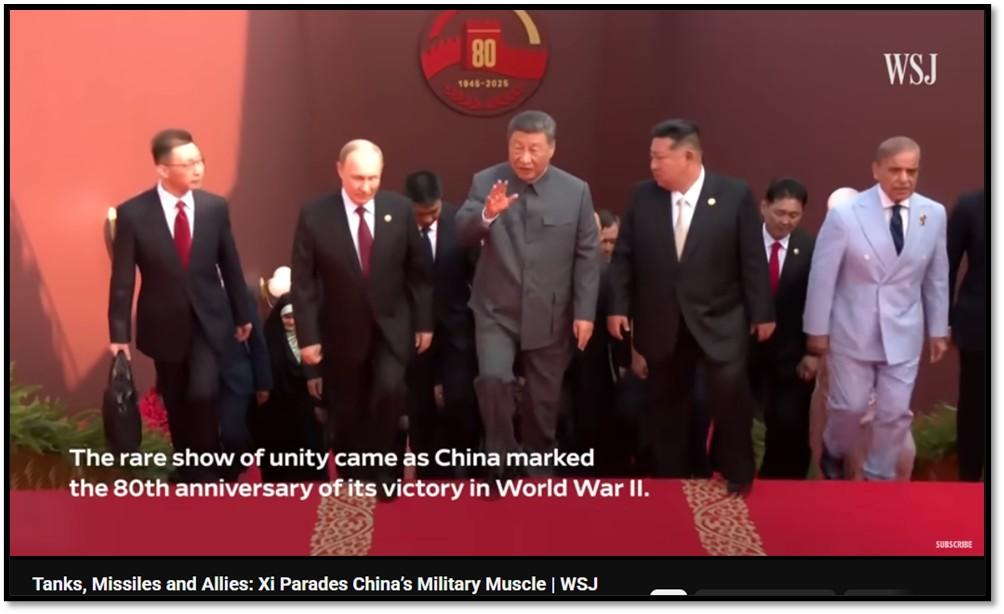
4A. Chinese President Xi Jinping hosted a grand military parade in Beijing’s Tiananmen Square to mark the 80th anniversary of Japan’s World War II surrender, showcasing China’s advanced military arsenal, including hypersonic missiles and stealth fighters.
The presence of Russian President Vladimir Putin and North Korean leader Kim Jong Un underscored deepening ties among U.S. adversaries, positioning Xi as a leader of a new global order challenging Western dominance. Xi’s speech framed a choice between “peace and war,” while the absence of major Western leaders highlighted global divisions. The parade, attended by 26 heads of state, including Iran’s and Myanmar’s, emphasized China’s military modernization and its role as a hub for authoritarian alliances.
The implications of this event are significant for global and regional stability. The alignment of Xi, Putin, and Kim signals stronger military and economic cooperation among China, Russia, and North Korea, potentially shifting Asia-Pacific dynamics. Russia’s energy deals with China and North Korea’s support in Ukraine, bolstered by Beijing’s economic aid despite sanctions, challenge U.S. influence. This could embolden China’s stance on Taiwan and support Kim’s nuclear ambitions, escalating tensions with the U.S. and allies. U.S. President Trump’s claim of a “conspiracy” against America, though dismissed by Russia, risks worsening U.S.-China relations amid tariff disputes. Xi’s vision of a Beijing-led order may deepen global polarization and complicate Western efforts to counter these alliances. Click onto pictures below to access videos. REF: WSJ, Video1, Video2
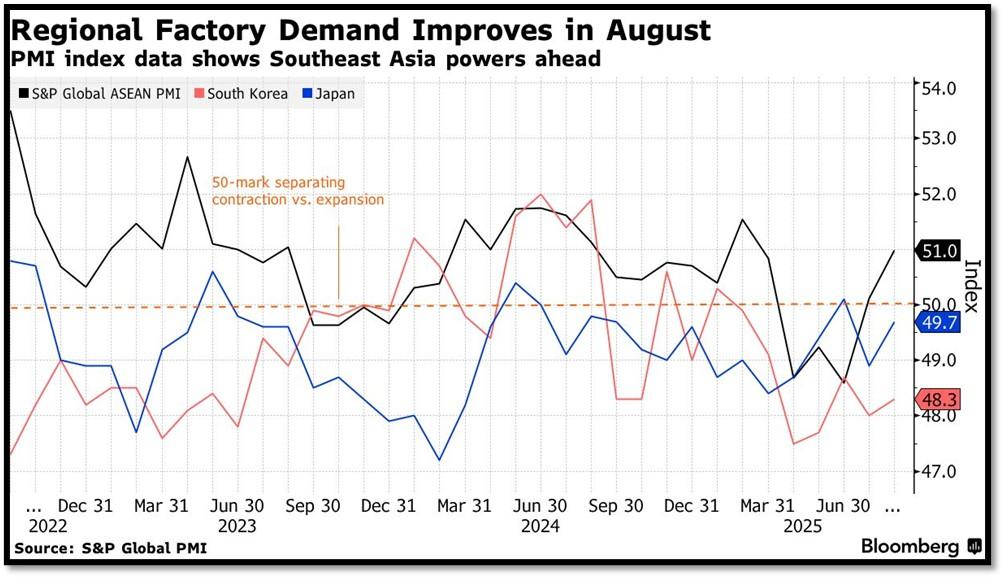
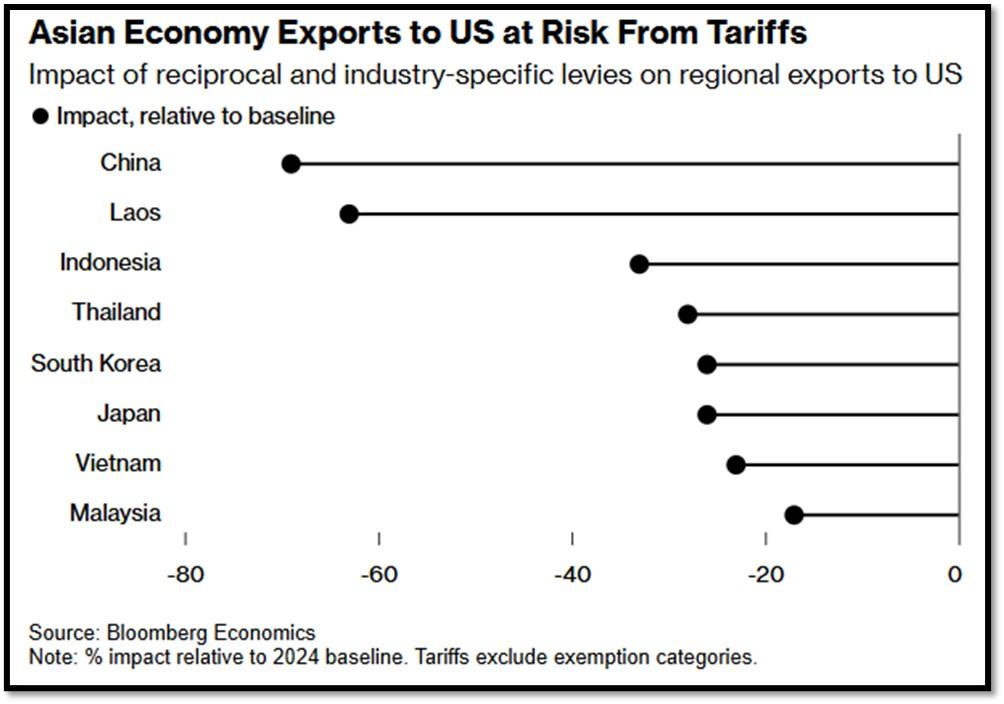
4B. A Bloomberg report from 9/4/25, highlights the resilience of Asia’s export hubs, such as Thailand, Vietnam, and South Korea, despite U.S. “reciprocal tariffs” imposed in April 2025.
Initially, these tariffs sparked fears of economic slowdown, with regional central banks issuing warnings and economists revising growth forecasts downward. However, recent data shows robust manufacturing activity, with Thailand and Sri Lanka reporting double-digit export growth in July and South Korea sustaining steady exports in August. This strength stems from strong global demand, inventory drawdowns, and supply chain diversification. For instance, Vietnam’s exports to China surged 18% year-on-year, indicating a shift away from U.S. markets. Asian economies are adapting effectively, leveraging their export-driven models to maintain growth despite tariff pressures.
The implications of this resilience are significant for global trade and U.S.-Asia relations. Asian hubs’ ability to sustain activity may reduce dependence on the U.S., strengthening intra-Asian trade networks. However, this could heighten U.S.-China trade tensions, potentially prompting stricter tariffs or prolonged talks. China’s record $586 billion trade surplus in June 2025 underscores its adaptability, but ongoing disputes risk disruptions. While Mexico and Canada’s stock markets rose over 20% in 2025, global growth forecasts remain cautious, with a possible rebound in 2026 if trade tensions ease, urging Asia to further diversify supply chains. REF: Bloomberg, Trump’s Tariffs
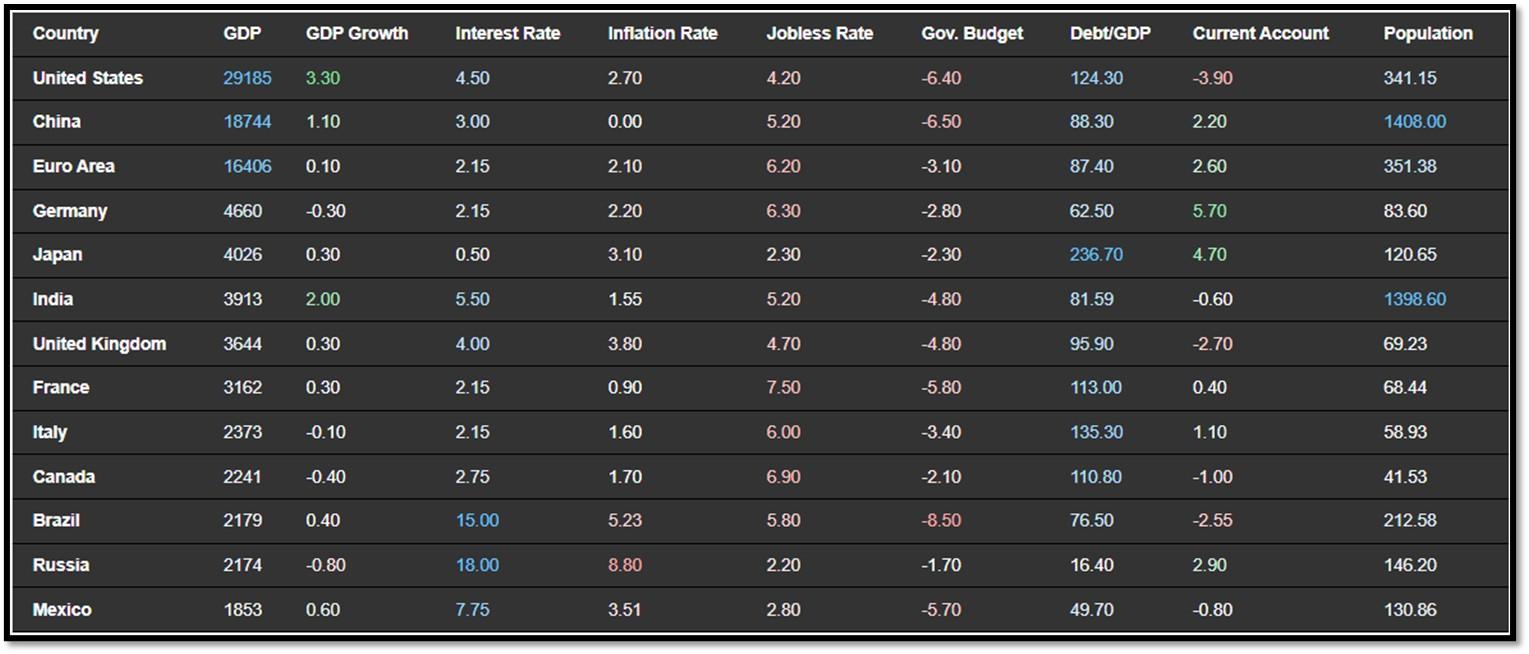
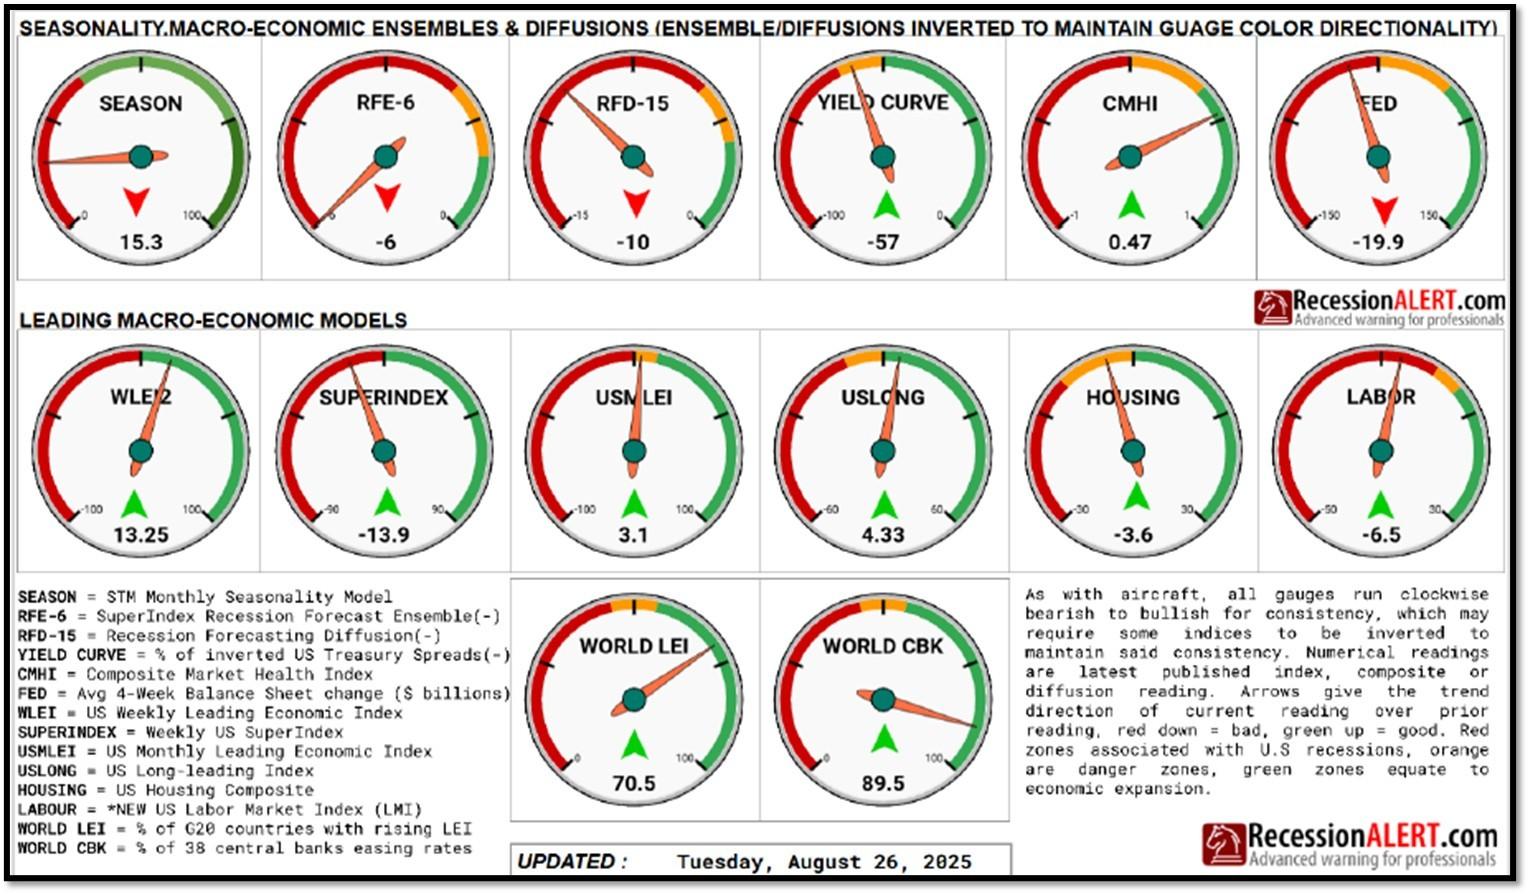
4C. An updated snapshot of the current global state of economy.
According to TradingEconomics as of 9/3/2025, REF: TradingEconomics
- Germany’s annual consumer price inflation quickened to 2.2% in July 2025, up from 2% in June and above market expectations of 2.1%, a preliminary estimate showed.
- Japan’s unemployment rate dropped to 2.3% in July 2025, below market expectations of 2.5% and down from the same level in the previous four months.
- France’s annual inflation rate eased to 0.9% in August 2025, below market expectations of holding steady at July’s 1%, according to a preliminary estimate.
- The annual consumer price inflation in Italy inched lower to 1.6% in August of 2025 from 1.7% in the previous month, below market expectations of 1.7% to mark the softest increase since May, according to a preliminary estimate.
5. Quant & Technical Corner – A selection of quantitative & technical data we monitor on a regular basis to help gauge the overall financial market conditions and the investment environment.
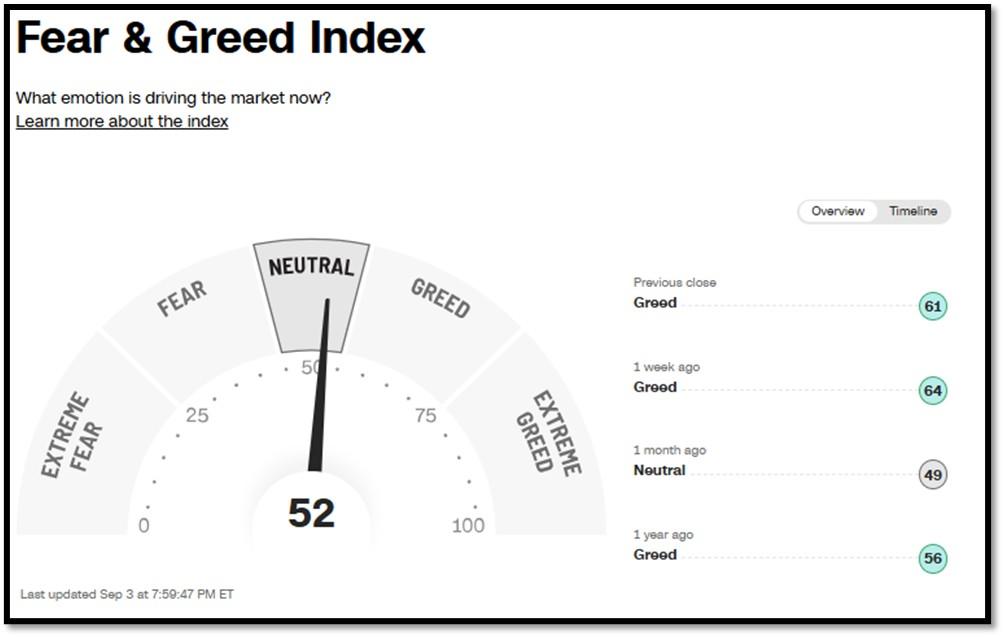
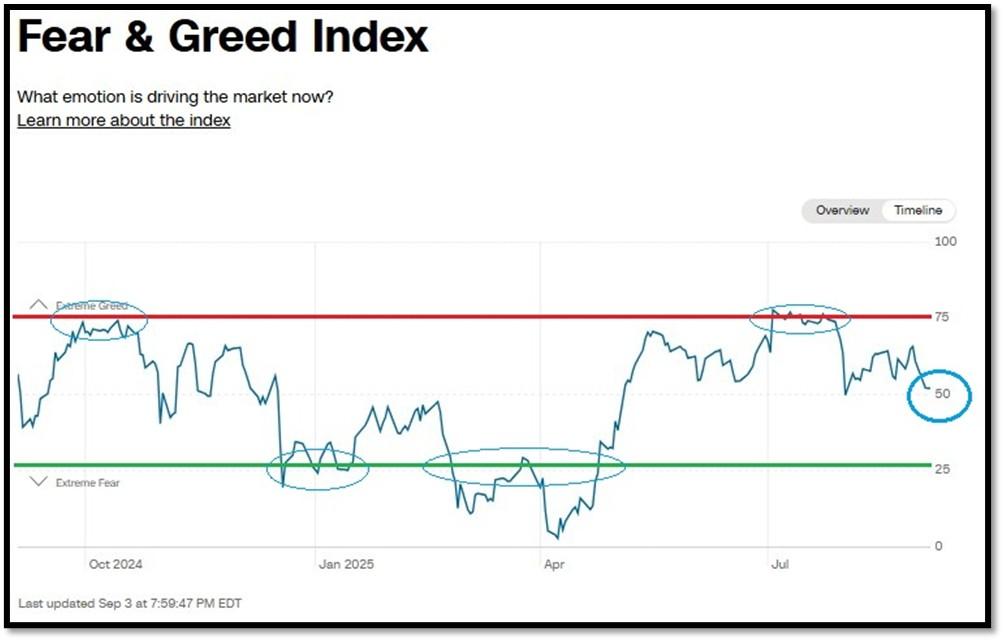
5A. Most recent read on the Fear & Greed Index with data as of 9/3/2025 – 7:59 PM-ET is 52 (Neutral). Last week’s data was 64 (Greed) (1-100). CNNMoney’s Fear & Greed index looks at 7 indicators (Stock Price Momentum, Stock Price Strength, Stock Price Breadth, Put and Call Options, Junk Bond Demand, Market Volatility, and Safe Haven Demand). Keep in mind this is a contrarian indicator! REF: Fear&Greed via CNNMoney
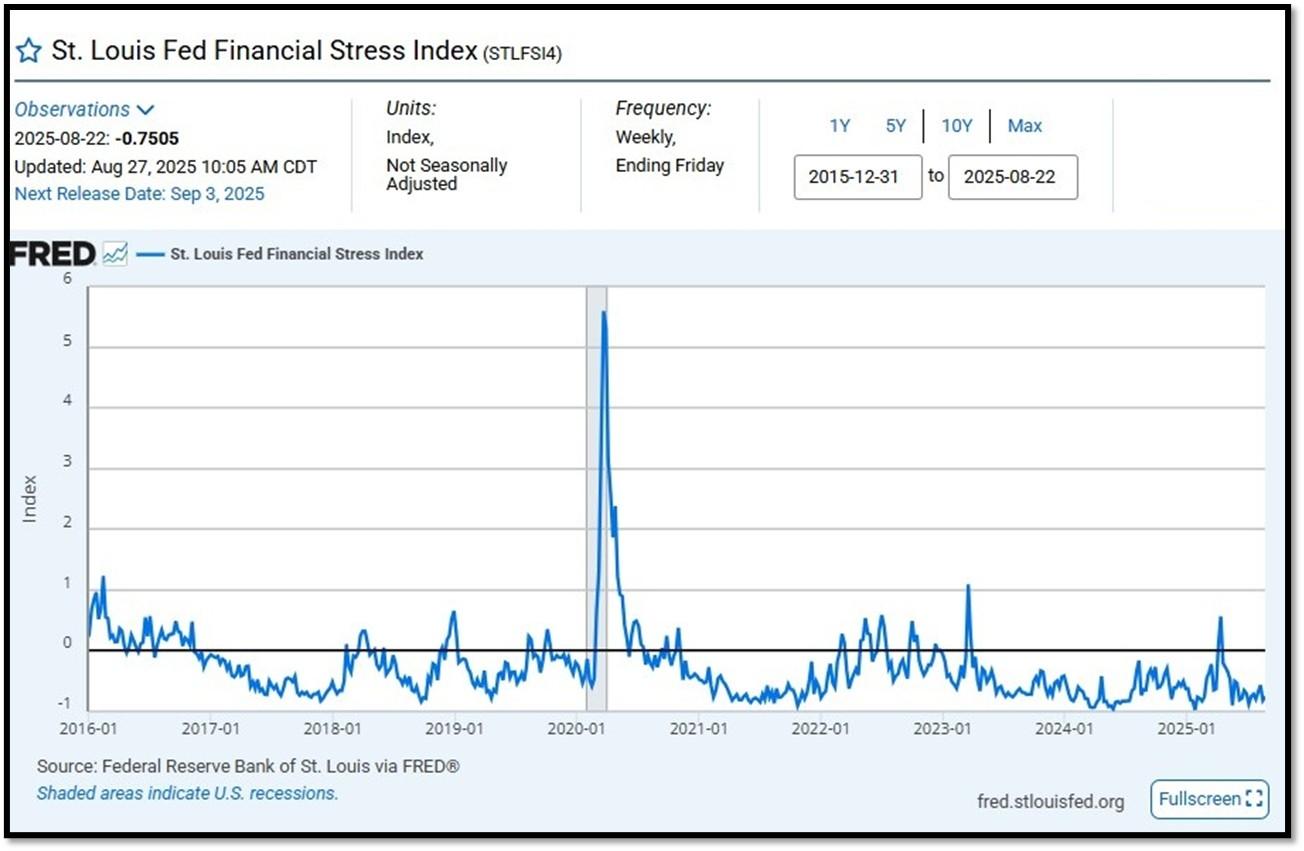
5B. St. Louis Fed Financial Stress Index’s (STLFSI4) most recent read is at –0.7505 as of August 27, 2025. Previous week’s data was -0.5681. A big spike up from previous readings reflecting the turmoil in the banking sector back in 2023. This weekly index is not seasonally adjusted. The STLFSI4 measures the degree of financial stress in the markets and is constructed from 18 weekly data series: seven interest rate series, six yield spreads and five other indicators. Each of these variables captures some aspect of financial stress. Accordingly, as the level of financial stress in the economy changes, the data series are likely to move together. REF: St. Louis Fed
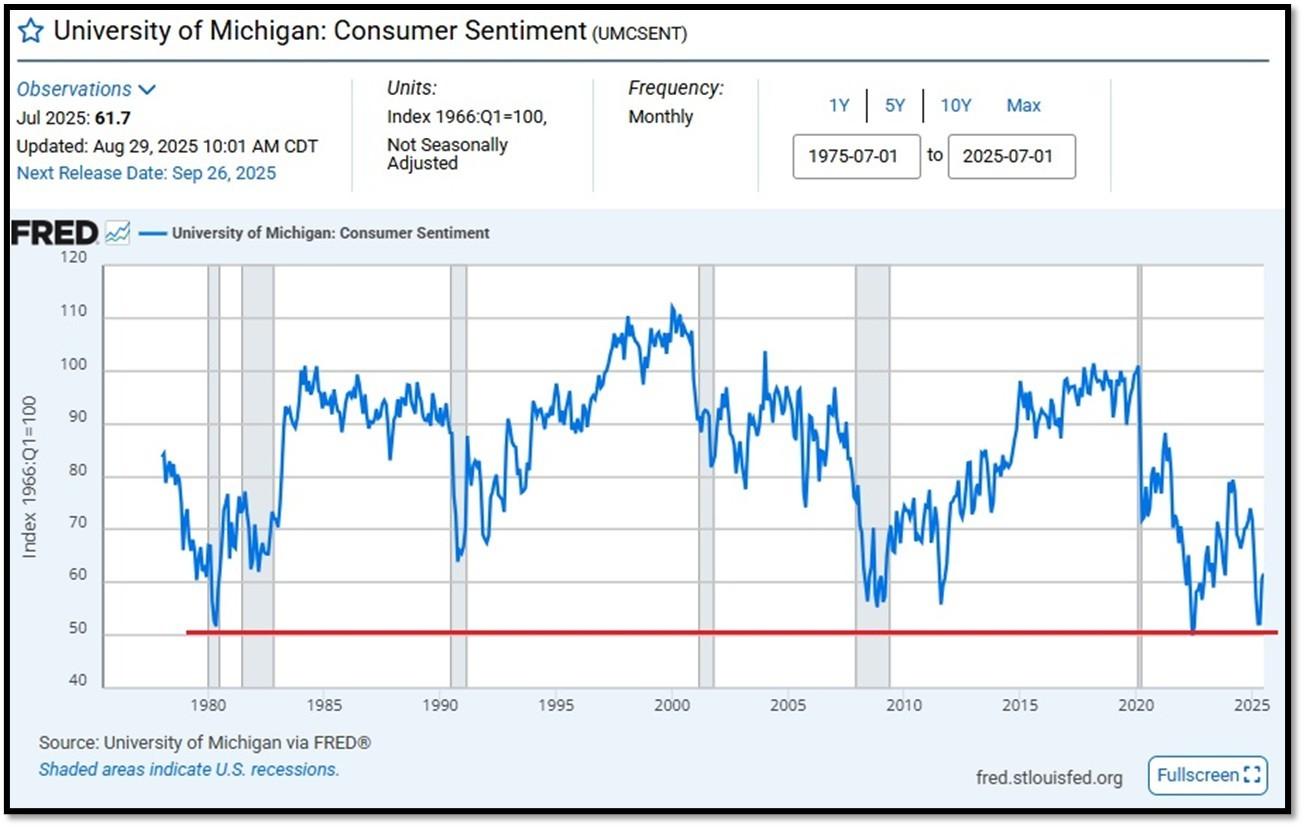
5C. University of Michigan, University of Michigan: Consumer Sentiment for February [UMCSENT] at 61.7, retrieved from FRED, Federal Reserve Bank of St. Louis, August 29, 2025. Back in June 2022, Consumer Sentiment hit a low point going back to April 1980. REF: UofM
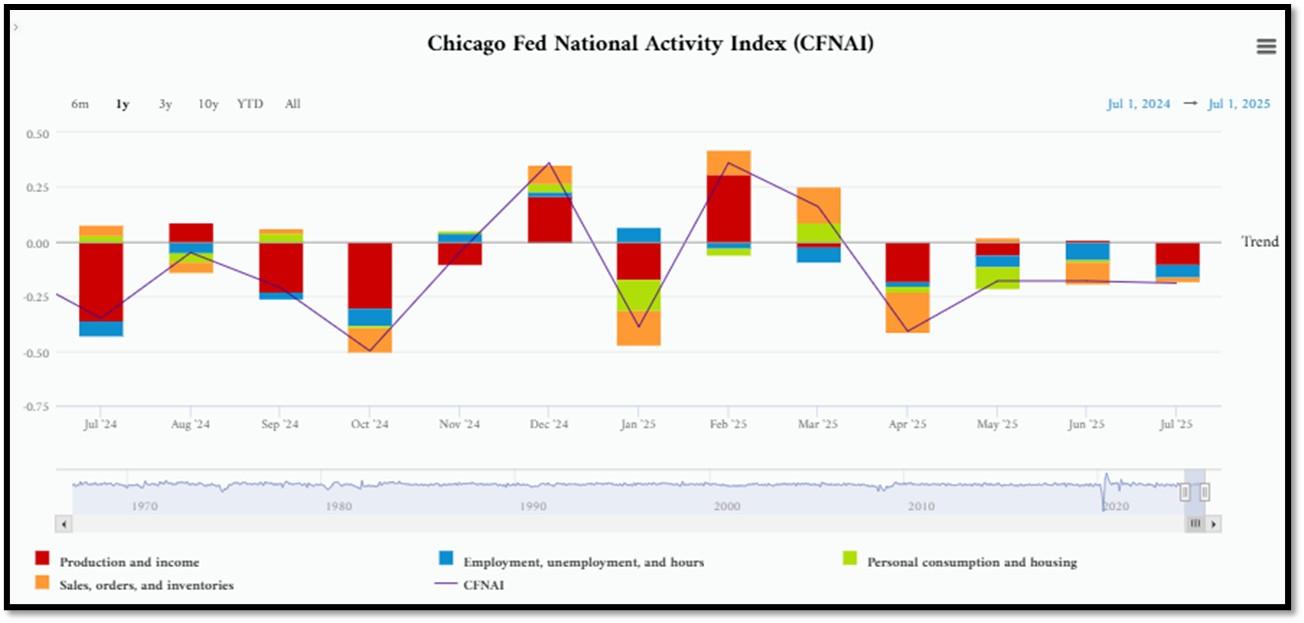
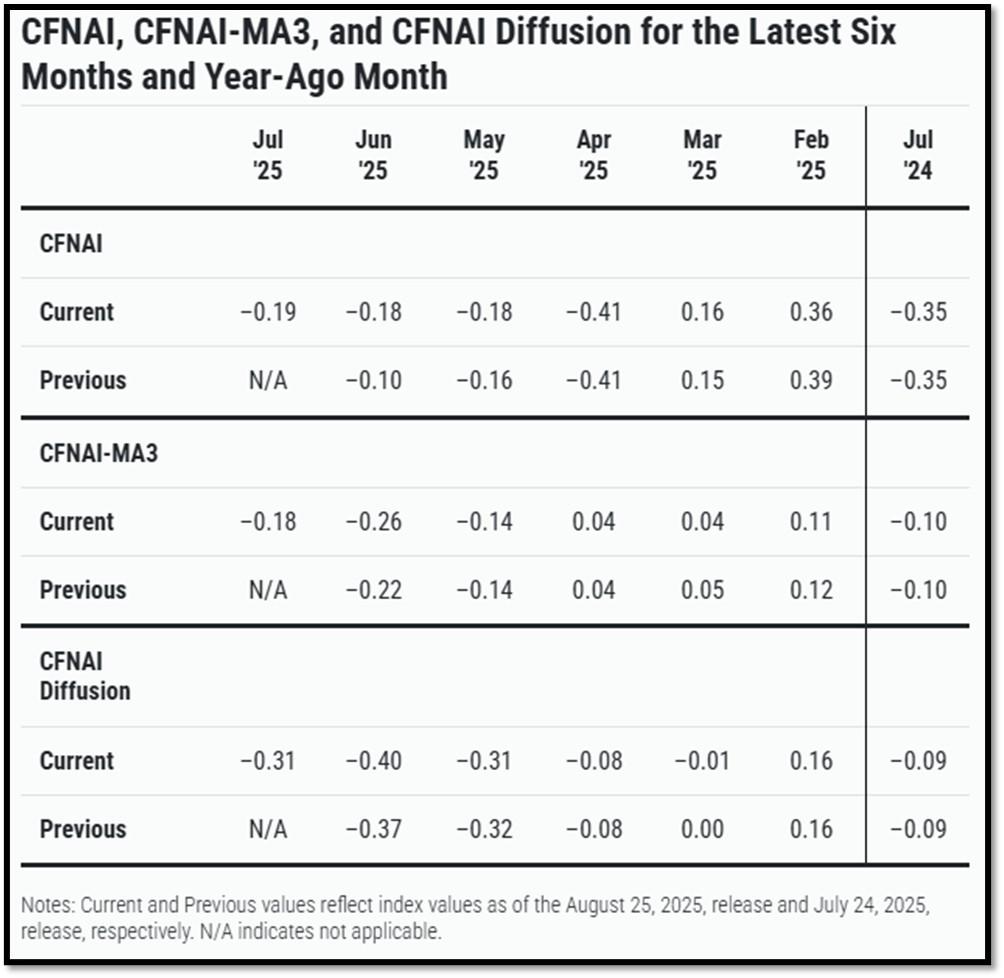
5D. The Chicago Fed National Activity Index (CFNAI) decreased to –0.19 in July from –0.18 in June. One of the four broad categories of indicators used to construct the index decreased from June, and three categories made negative contributions in July. The index’s three-month moving average, CFNAI-MA3, increased to –0.18 in July from –0.26 in June. REF: ChicagoFed, June’s Report
5E. (8/21/2025) The Conference Board Leading Economic Index (LEI) for the US inched down by 0.1% in July 2025 to 98.7 (2016=100), after declining by 0.3% in June. The LEI fell by 2.7% over the six months between January and July 2025, a faster rate of decline than its –1.0% contraction over the previous six-month period (July 2024 to January 2025. The composite economic indexes are the key elements in an analytic system designed to signal peaks and troughs in the business cycle. The indexes are constructed to summarize and reveal common turning points in the economy in a clearer and more convincing manner than any individual component. The CEI is highly correlated with real GDP. The LEI is a predictive variable that anticipates (or “leads”) turning points in the business cycle by around 7 months. Shaded areas denote recession periods or economic contractions. The dates above the shaded areas show the chronology of peaks and troughs in the business cycle. The ten components of The Conference Board Leading Economic Index® for the U.S. include: Average weekly hours in manufacturing; Average weekly initial claims for unemployment insurance; Manufacturers’ new orders for consumer goods and materials; ISM® Index of New Orders; Manufacturers’ new orders for nondefense capital goods excluding aircraft orders; Building permits for new private housing units; S&P 500® Index of Stock Prices; Leading Credit Index™; Interest rate spread (10-year Treasury bonds less federal funds rate); Average consumer expectations for business conditions. REF: ConferenceBoard, LEI Report for July (ReceesionAlert) (Released on 9/1/2025)
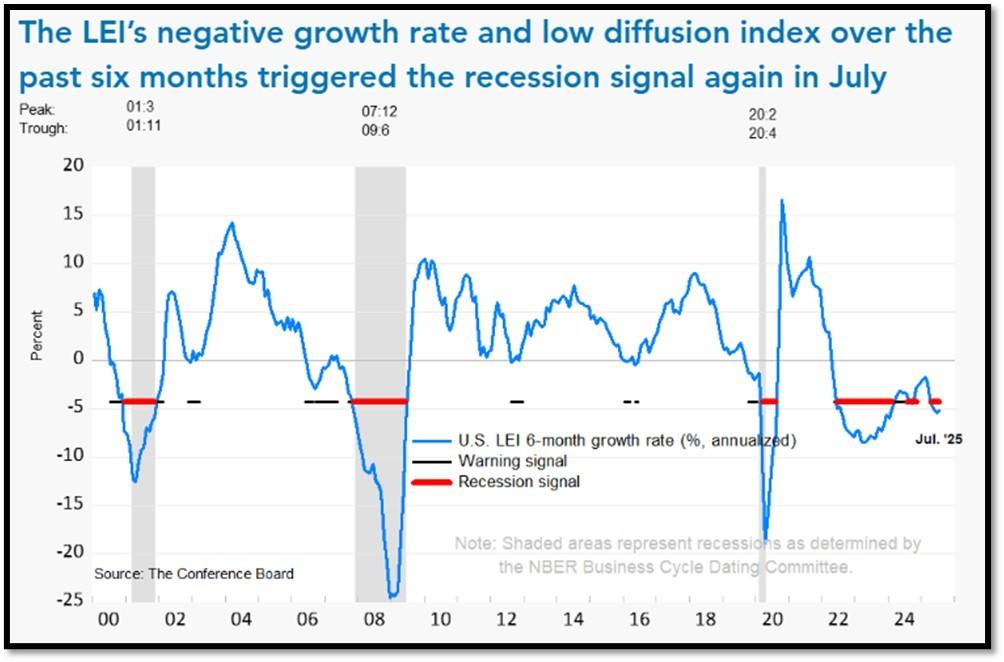
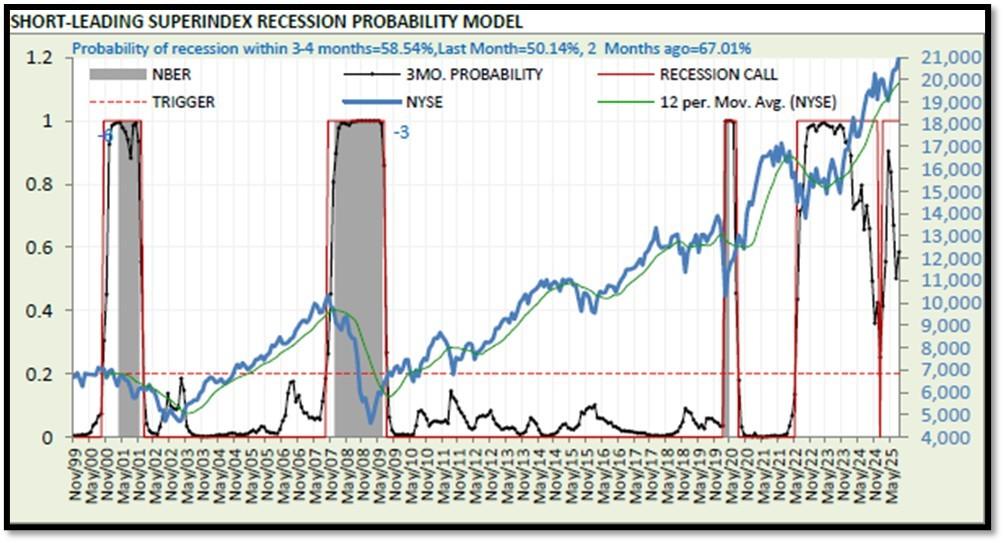
We have experienced a “rolling recession” since June 2022 and are only now emerging from it. However, authorities are not labeling it a recession due to high employment data.
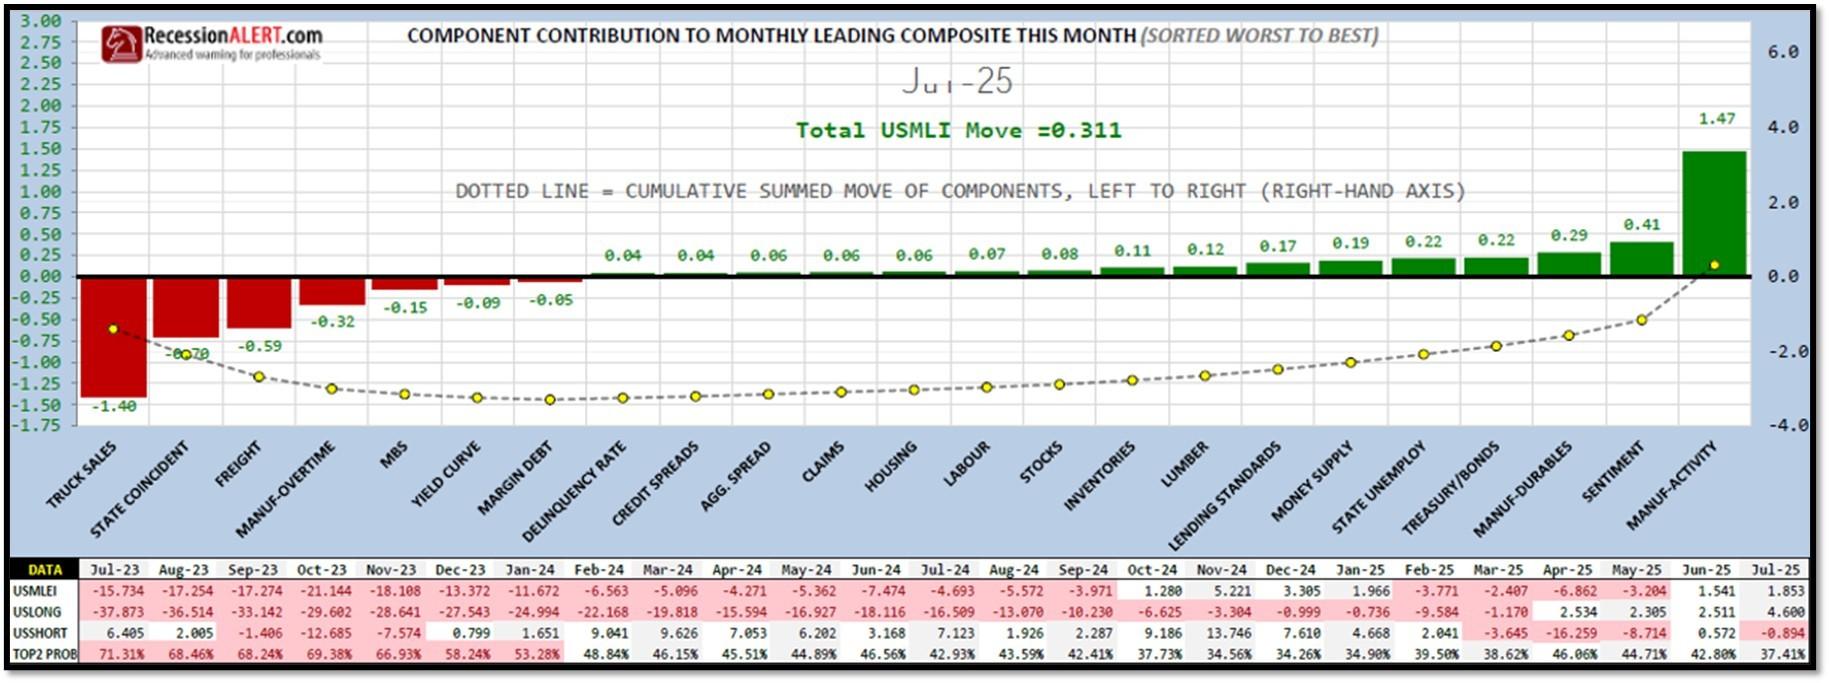
5F. Probability of U.S. falling into Recession within 3 to 4 months is currently at 58.54% (with data as of 08/26/2025 – Next Report 09/09/2025) according to RecessionAlert Research. Last release’s data was at 63.1%. This report is updated every two weeks. REF: RecessionAlertResearch
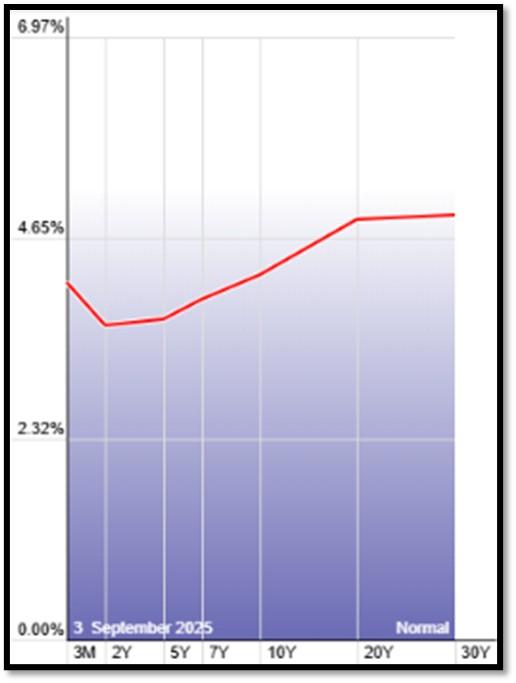
5G. Yield Curve as of 9/3/2025 is showing Normal. Spread on the 10-yr Treasury Yield (4.22%) minus yield on the 2-yr Treasury Yield (3.61%) is currently at 61bps. REF: Stockcharts The yield curve—specifically, the spread between the interest rates on the ten-year Treasury note and the three-month Treasury bill—is a valuable forecasting tool. It is simple to use and significantly outperforms other financial and macroeconomic indicators in predicting recessions two to six quarters ahead. REF: NYFED
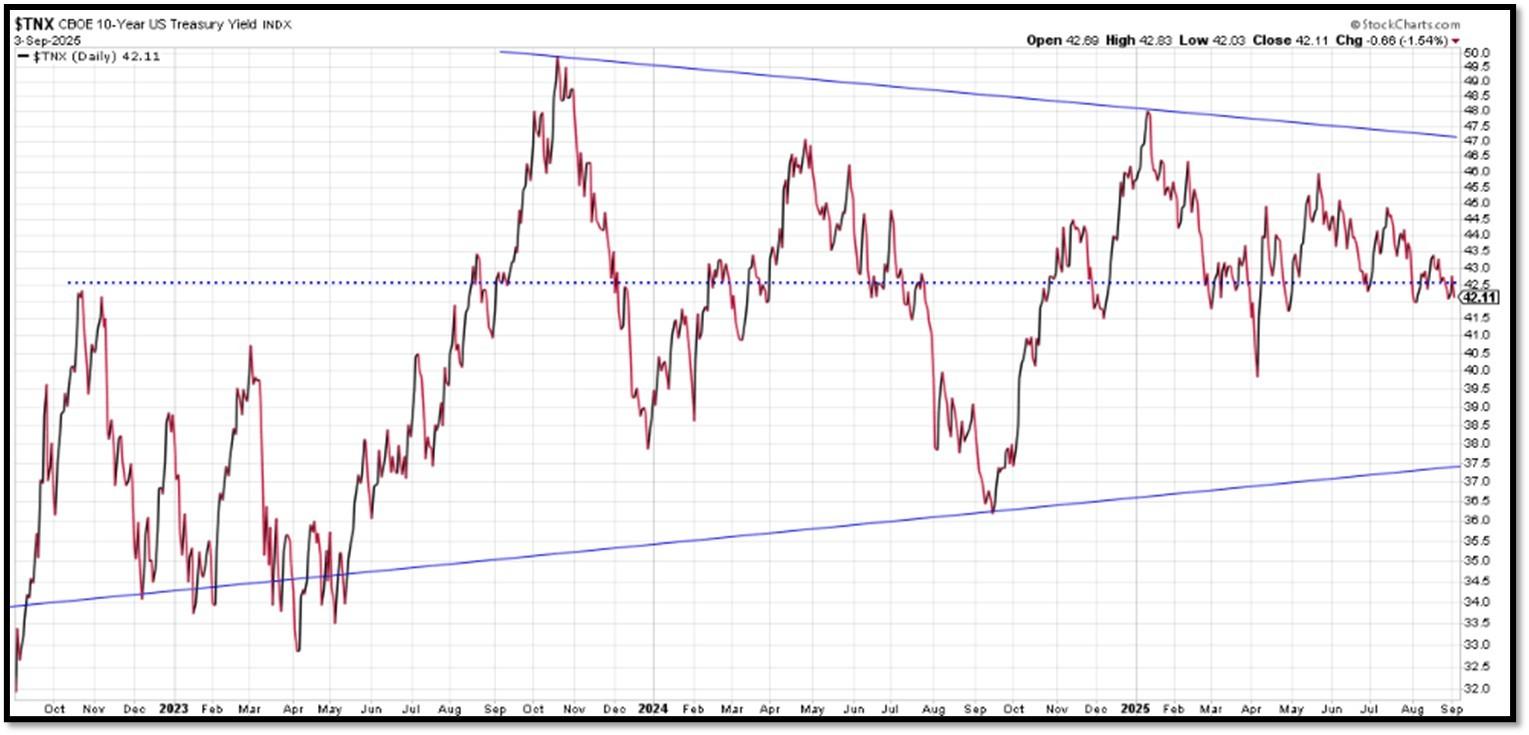
5H. Recent Yields in 10-Year Government Bonds. REF: Source is from Bloomberg.com, dated 9/1/2025, rates shown below are as of 9/1/2025, subject to change.
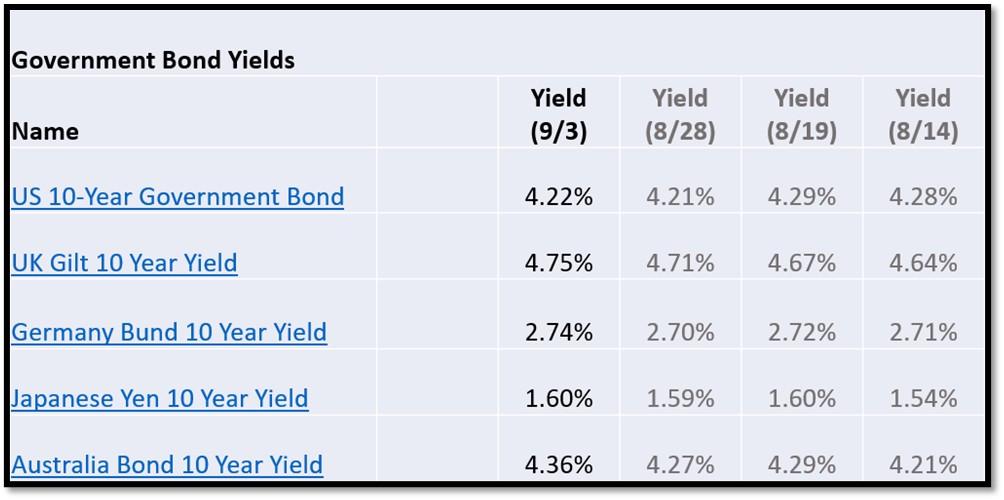
The 10-Year US Treasury Yield… The 10-Year Yield is indirectly related to inflation. I expect the 10-Year Yield to drop further as dis-inflation kicks in. REF: StockCharts1
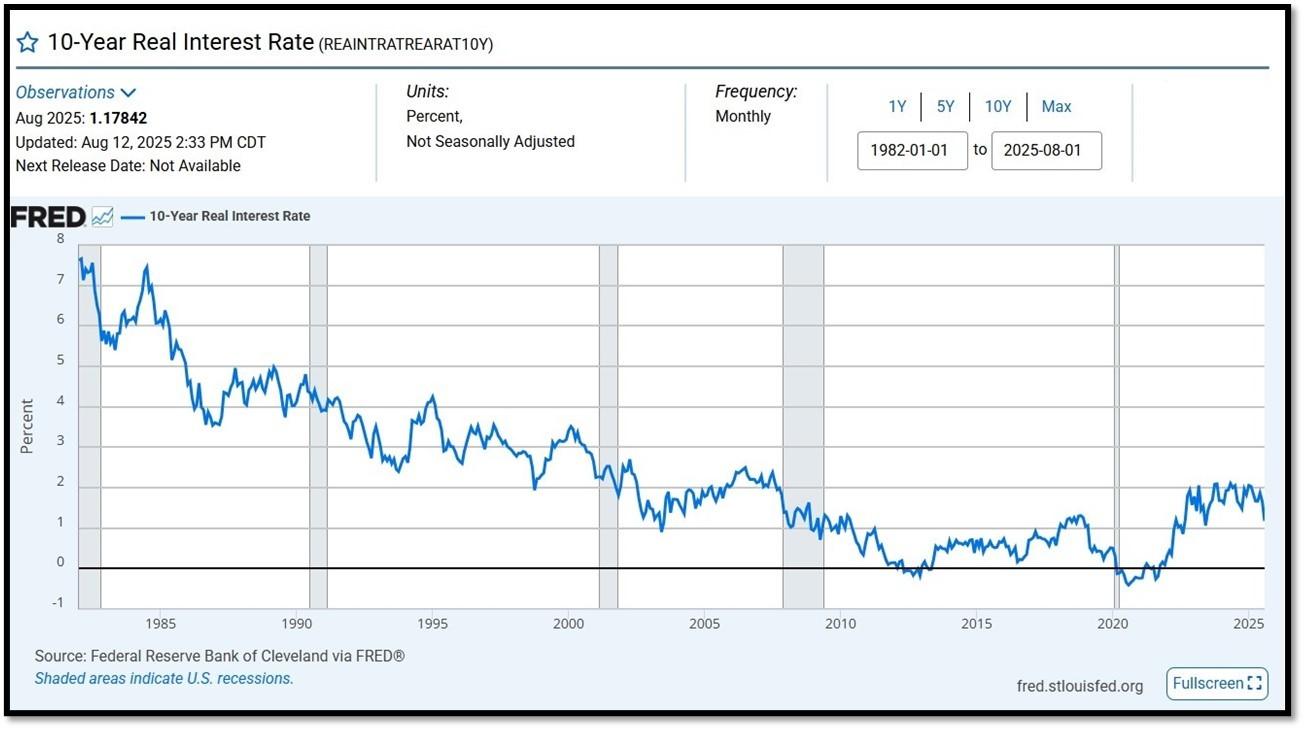
10-Year Real Interest Rate at 1.17842% as of 8/12/25. Last month’s data was 1.64906%. REF: REAINTRATREARAT10Y
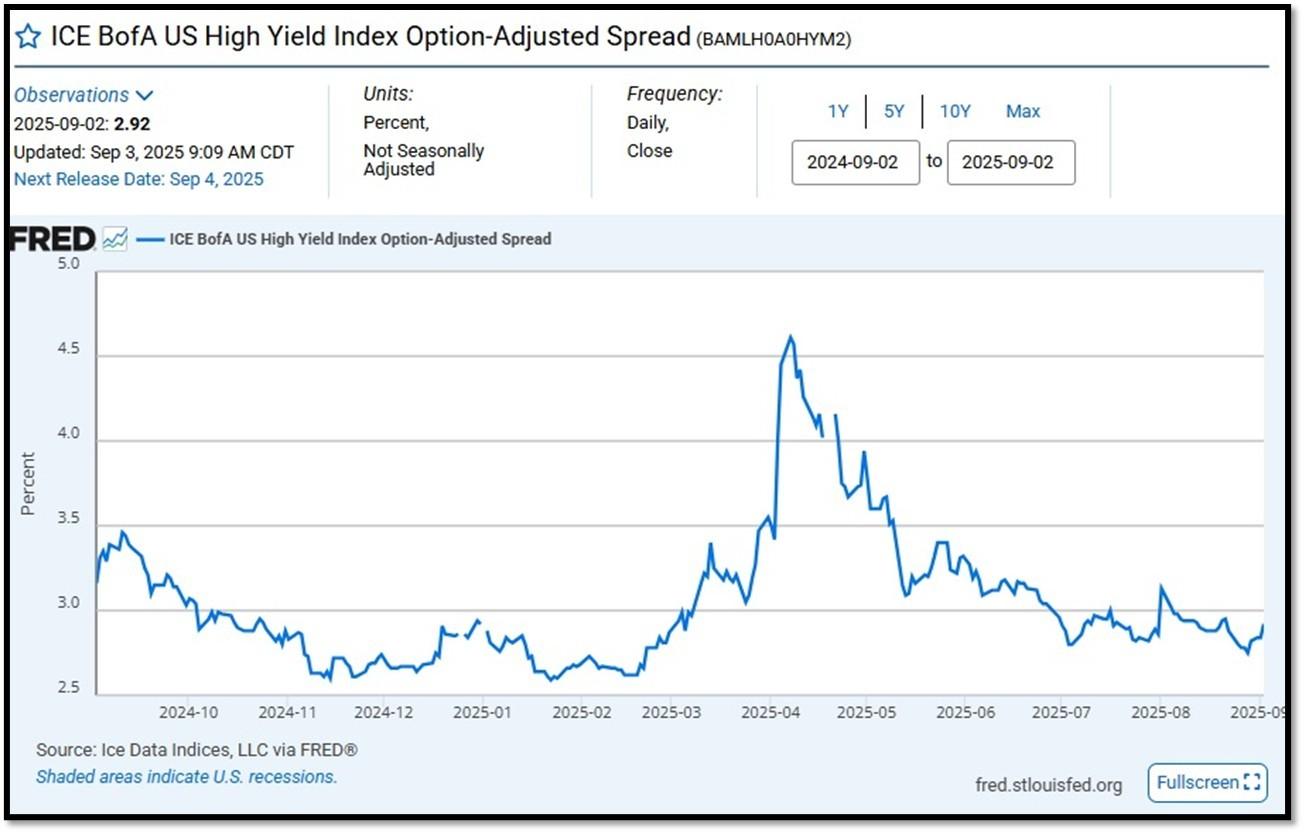
ICE BofA US High Yield Index Option-Adjusted Spread (BAMLH0A0HYM2) currently at 2.92 as of September 3, 2025. This is a key indicator of market sentiment, particularly regarding risk and economic health. At its core, the spread reflects the extra return investors demand to hold riskier corporate debt over safer government securities. High-yield bonds are issued by companies with lower credit ratings (below investment grade, like BB or lower), meaning they carry a higher chance of default. The spread compensates for this risk. When the spread is narrow—say, around 2.5% to 3%, as seen recently—it suggests investors are confident, willing to accept less extra yield because they perceive lower default risk or a strong economy. Narrow spreads often align with bullish markets, where cash is flowing, growth is steady, and fear is low. REF: FRED-BAMLH0A0HYM2
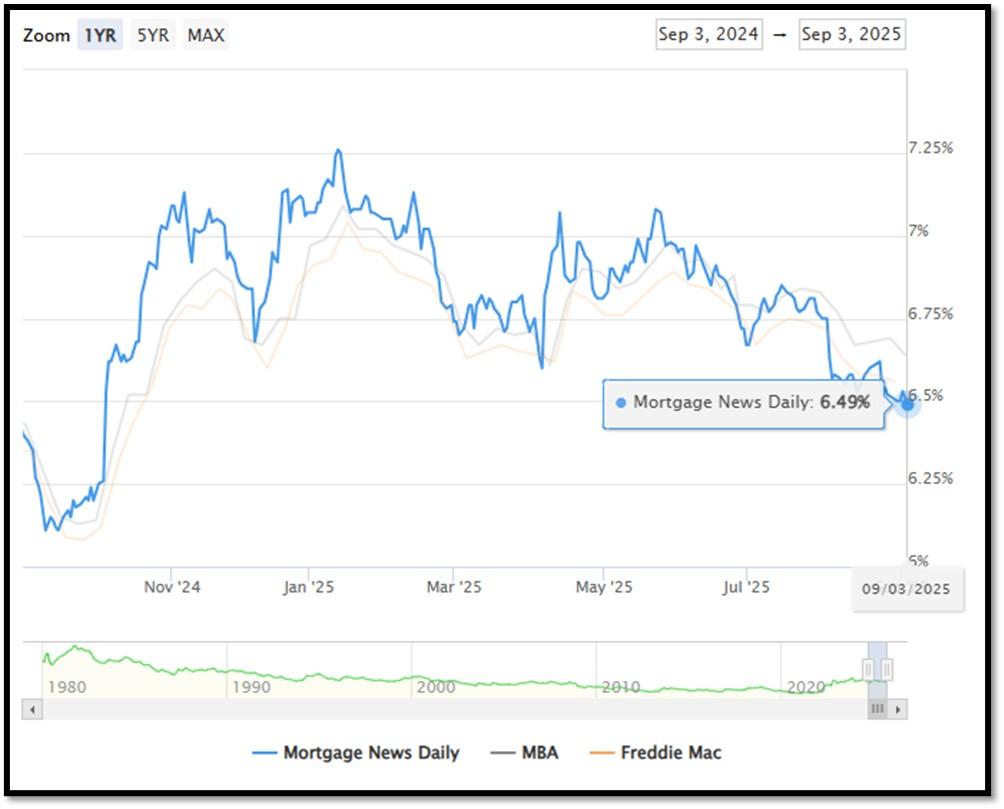
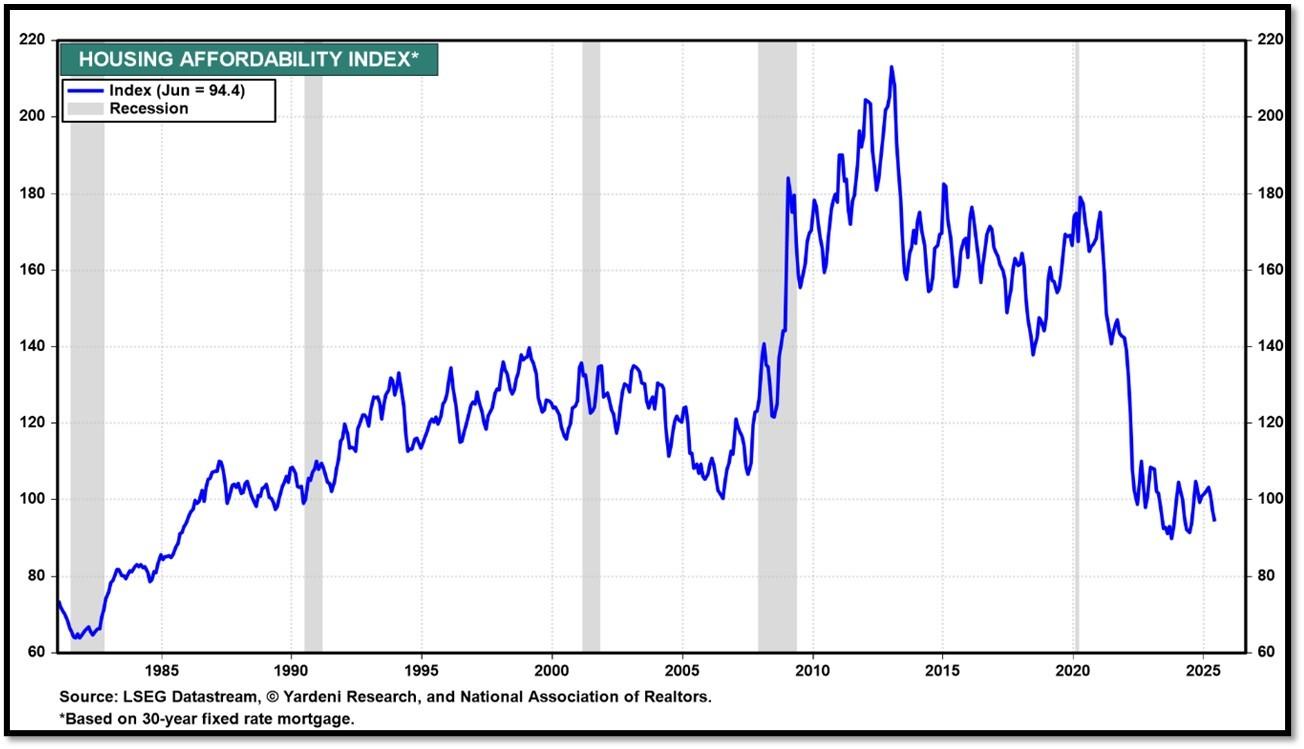
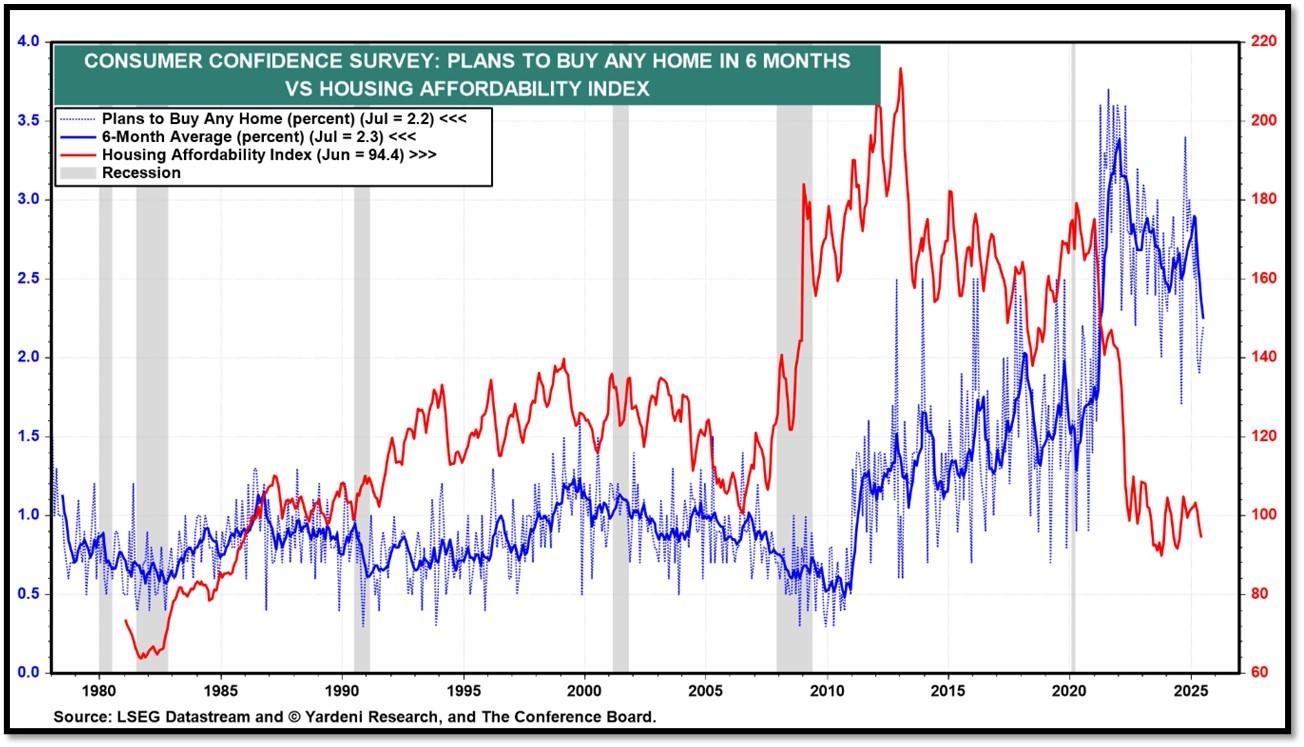
5I. (9/3/2025) Today’s National Average 30-Year Fixed Mortgage Rate is 6.49% (All Time High was 8.03% on 10/19/23). Last week’s data was 6.61%. This rate is the average 30-year fixed mortgage rates from several different surveys including Mortgage News Daily (daily index), Freddie Mac (weekly survey), Mortgage Bankers Association (weekly survey) and FHFA (monthly survey). REF: MortgageNewsDaily, Today’s Average Rate
The recent spike in the 30-year fixed-rate jumbo mortgage to 6.49%, compared to Freddie Mac’s rate at 6.56% and the Mortgage Bankers Association (MBA) rate at 6.64%, highlights key differences in the mortgage market. Jumbo mortgages, which exceed the conforming loan limits set by government agencies like Freddie Mac, typically carry higher interest rates because they are riskier for lenders. These loans are not backed by government entities, which increases the risk for lenders and, consequently, leads to higher rates. In contrast, Freddie Mac and MBA provide averages for conforming loans, which meet federal guidelines and have lower risk due to government backing, keeping their rates lower.
Housing Affordability Index for Jun = 94.4 // May = 97.2 // Apr = 101.0 // Mar = 103.2 // Feb = 102.2 // Jan = 100.7 // Dec = 100.7 // Nov = 99 // Oct = 102.3. Data provided by Yardeni Research. REF: Yardeni
5J. Velocity of M2 Money Stock (M2V) with current read at 1.386 as of (Q2-2025 updated August 28, 2025). Previous quarter’s data was 1.386. The velocity of money is the frequency at which one unit of currency is used to purchase domestically- produced goods and services within a given time period. In other words, it is the number of times one dollar is spent to buy goods and services per unit of time. If the velocity of money is increasing, then more transactions are occurring between individuals in an economy. Current Money Stock (M2) report can be viewed in the reference link. REF: St.LouisFed-M2V
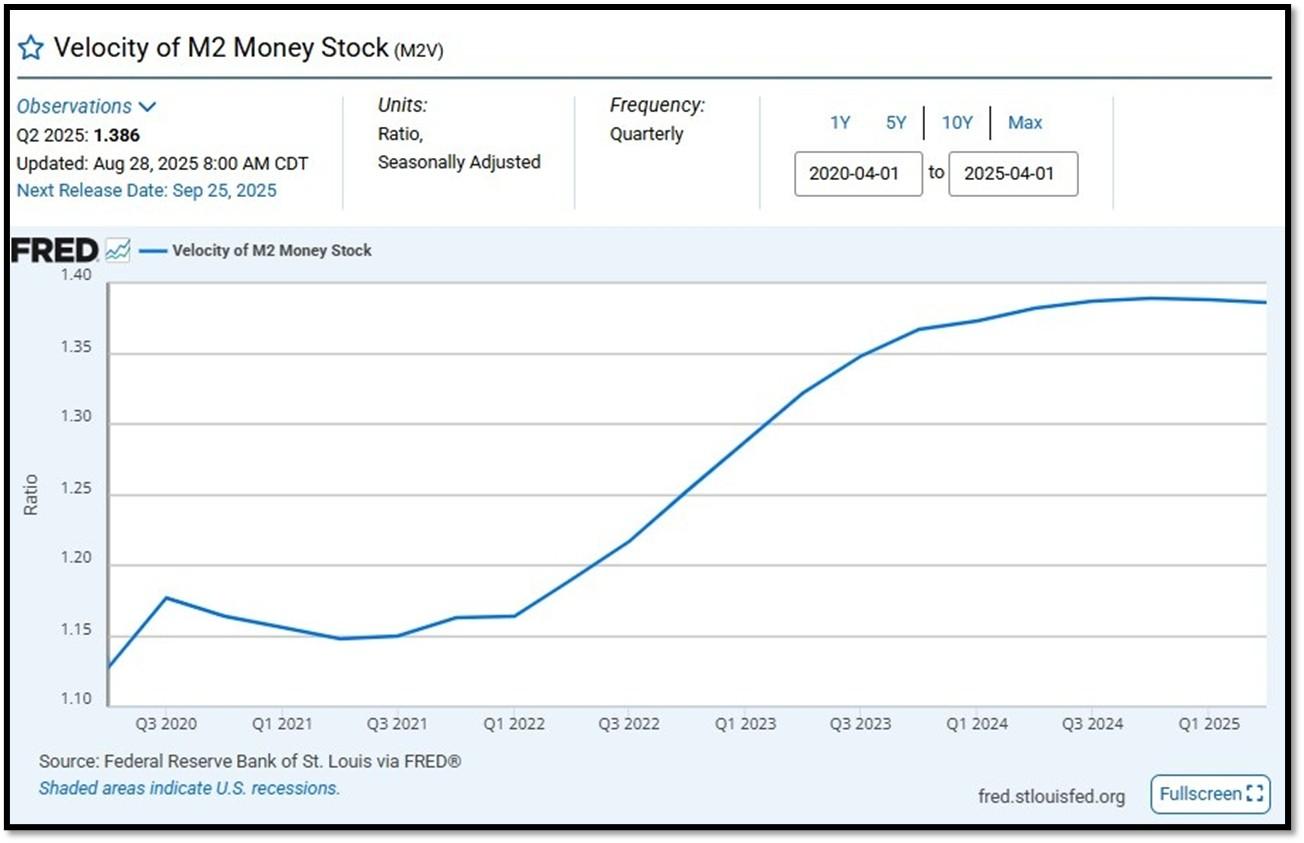
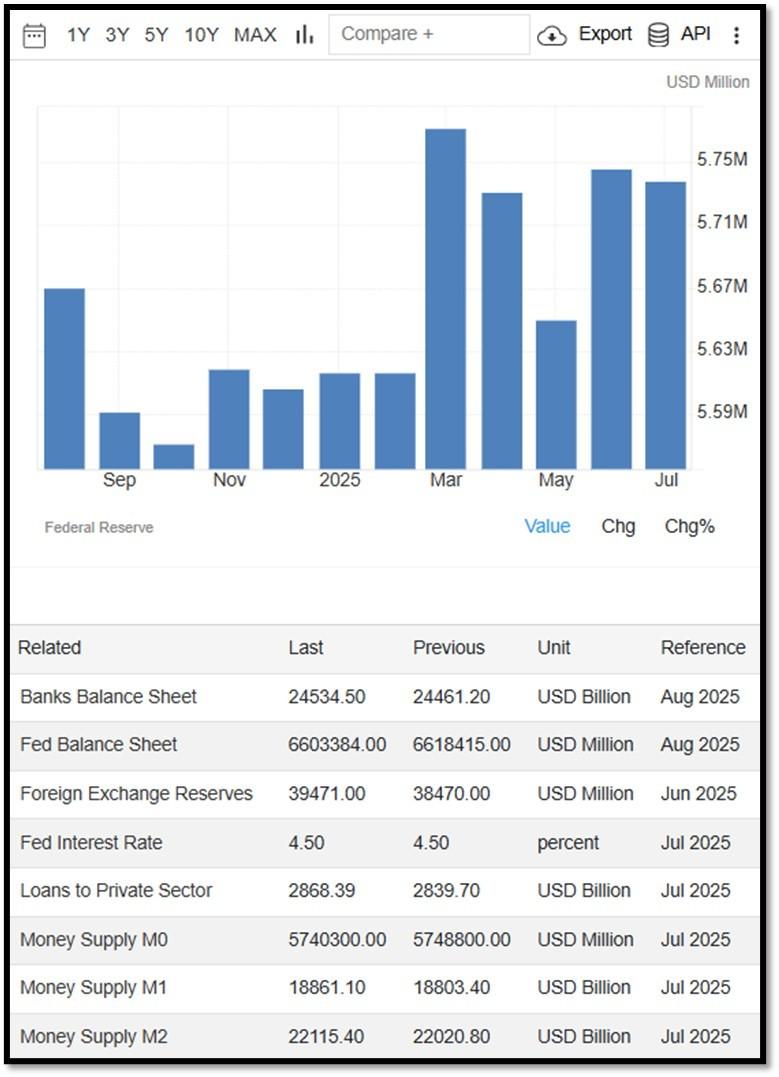
M2 consists of M1 plus (1) small-denomination time deposits (time deposits in amounts of less than $100,000) less IRA and Keogh balances at depository institutions; and (2) balances in retail MMFs less IRA and Keogh balances at MMFs. Seasonally adjusted M2 is constructed by summing savings deposits (before May 2020), small-denomination time deposits, and retail MMFs, each seasonally adjusted separately, and adding this result to seasonally adjusted M1. Board of Governors of the Federal Reserve System (US), M2 [M2SL], retrieved from FRED, Federal Reserve Bank of St. Louis; Updated on July 22, 2025. REF: St.LouisFed-M2
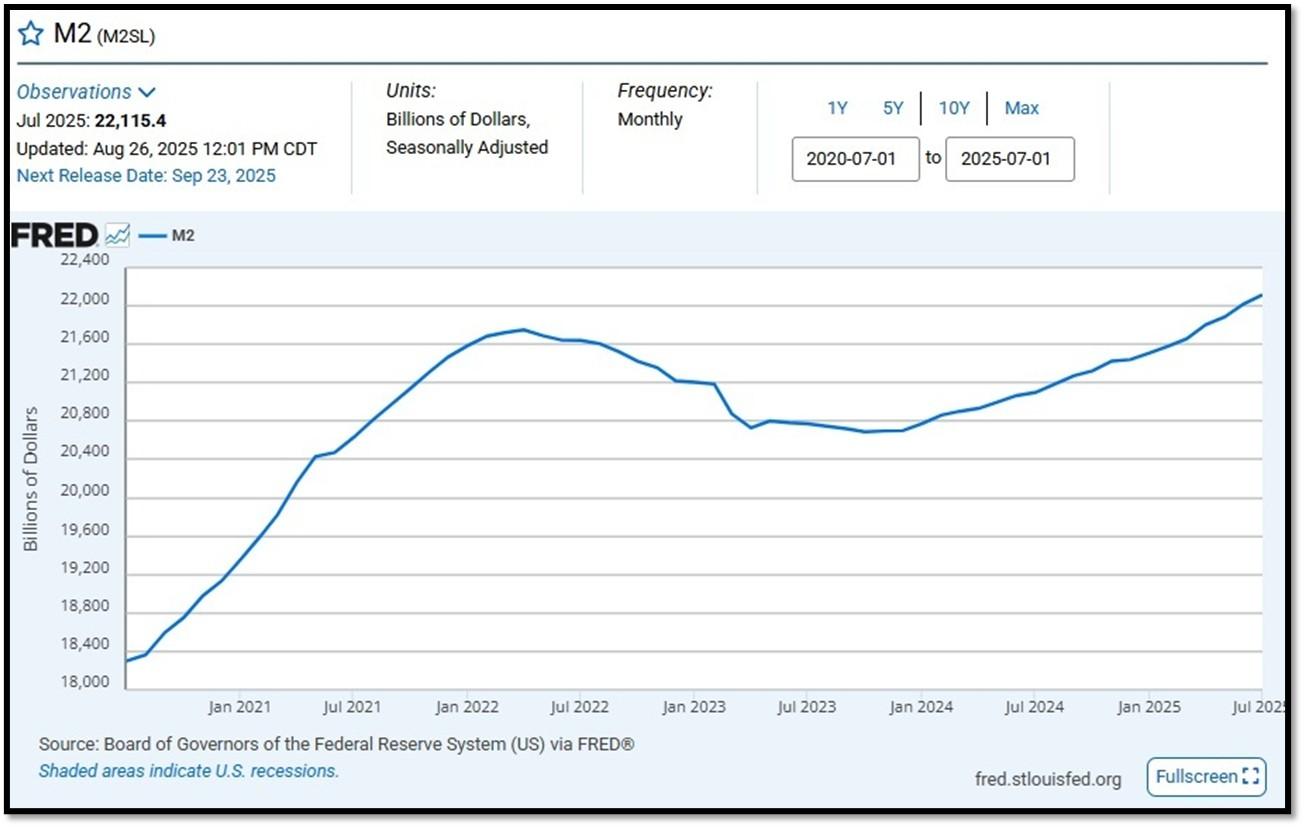
Money Supply M0 in the United States decreased to 5,740,300 USD Million in July from 5,748,800 USD Million in June of 2025. Money Supply M0 in the United States averaged 1,205,962.08 USD Million from 1959 until 2025, reaching an all-time high of 6,413,100.00 USD Million in December of 2021 and a record low of 48,400.00 USD Million in February of 1961. REF: TradingEconomics, M0
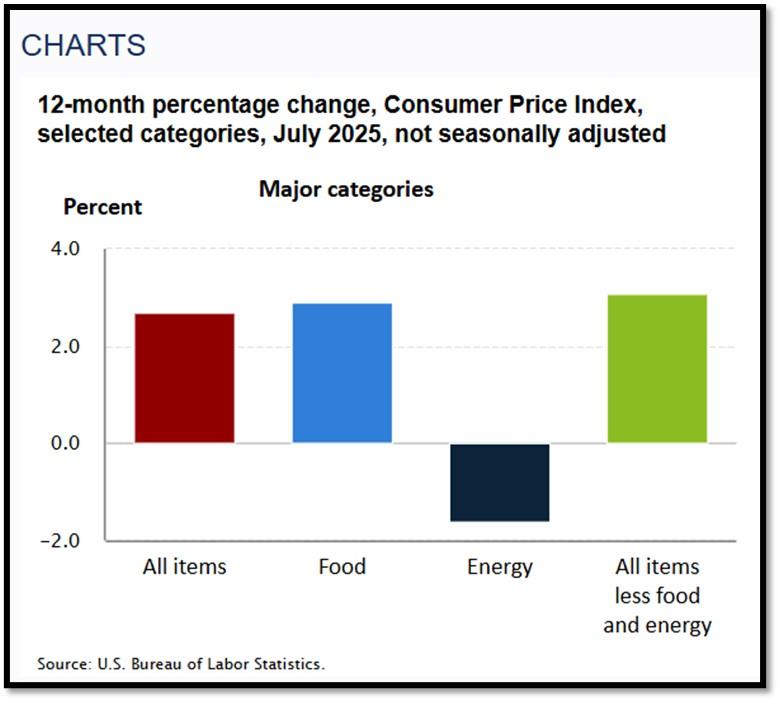
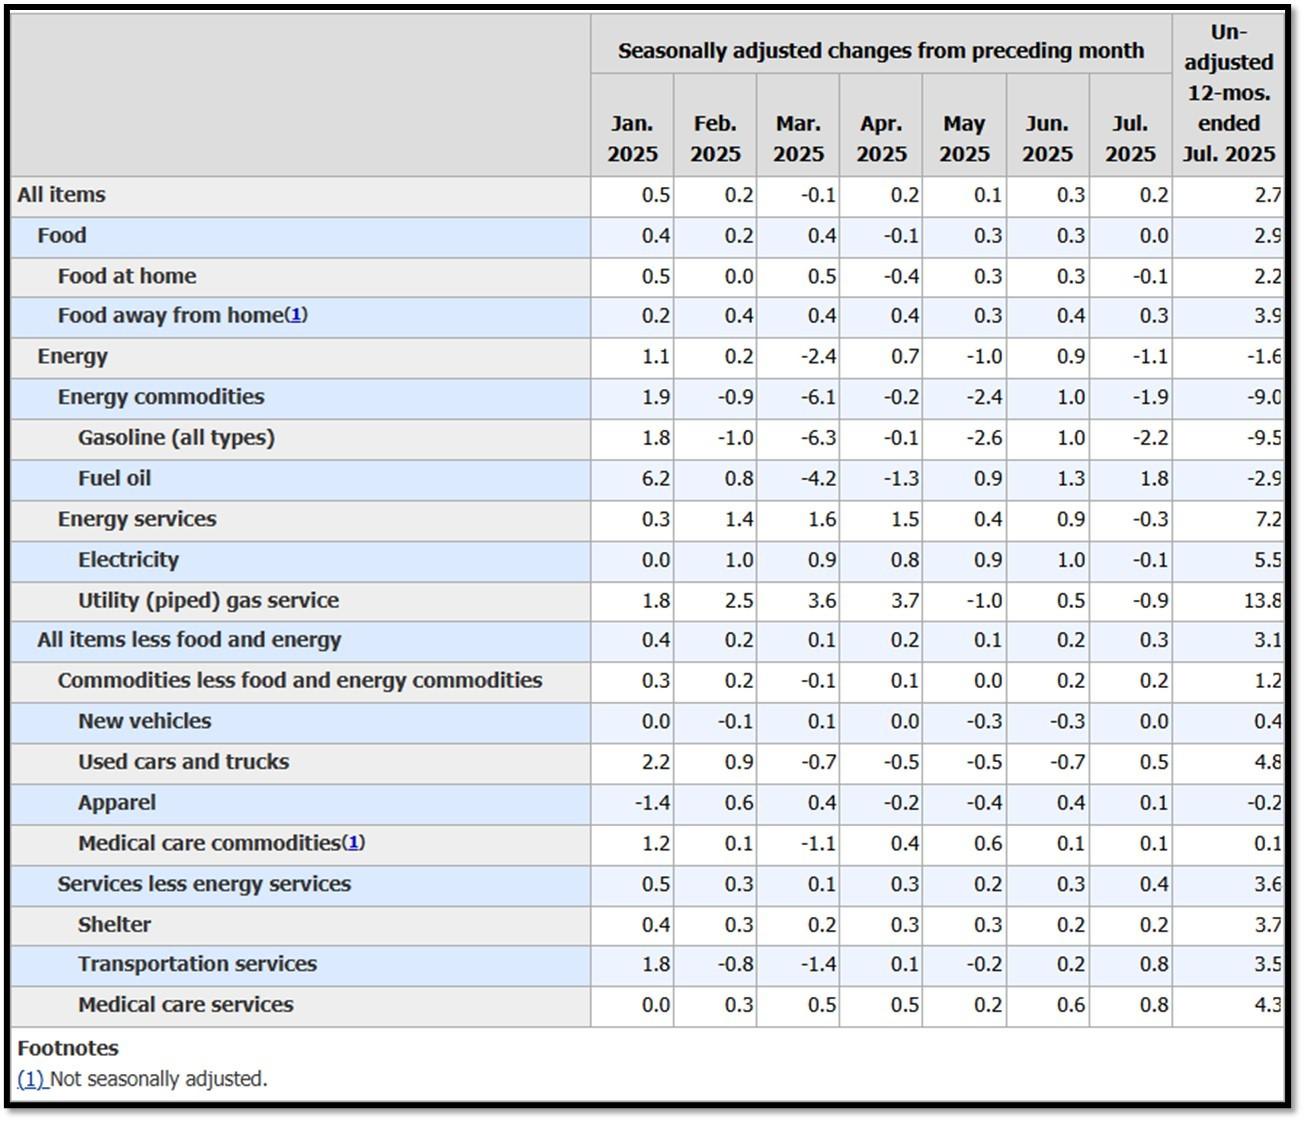
5K. In July, the Consumer Price Index for All Urban Consumers rose 0.2 percent, seasonally adjusted, and rose 2.7 percent over the last 12 months, not seasonally adjusted. The index for all items less food and energy increased 0.3 percent in July (SA); up 3.1 percent over the year (NSA). August 2025 CPI data are scheduled to be released on September 11, 2025, at 8:30AM-ET. REF: BLS, BLS.GOV
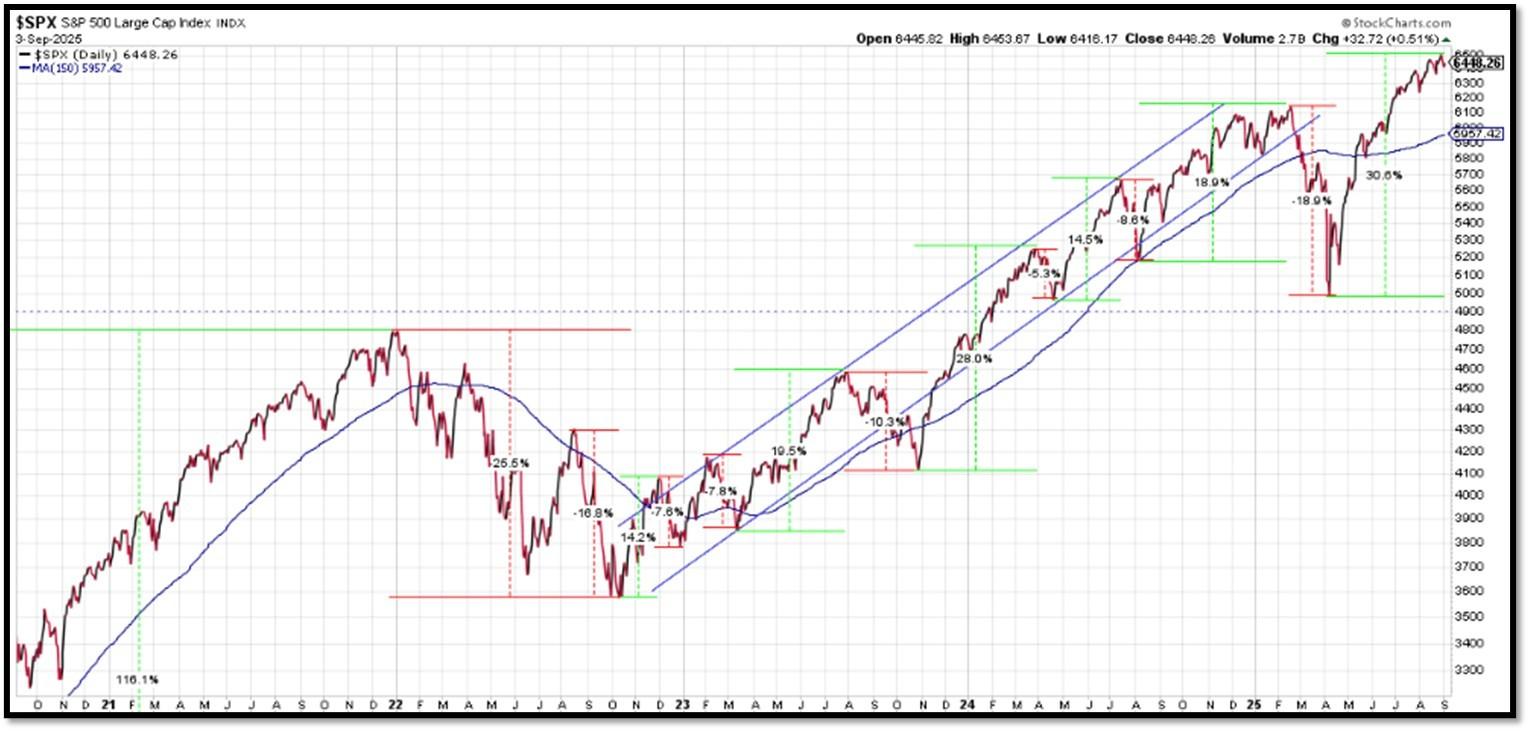
5L. Technical Analysis of the S&P500 Index. Click onto reference links below for images.
- Short-term Chart: Trend Bullish on 9/3/2025 – REF: Short-term S&P500 Chart by Marc Slavin (Click Here to Access Chart)
- Medium-term Chart: Trend Bearish to Bullish on 9/3/2025 – REF: Medium-term S&P500 Chart by Marc Slavin (Click Here to Access Chart)
- Market Timing Indicators – S&P500 Index as of 9/3/2025 – REF: S&P500 Charts (7 of them) by Joanne Klein’s Top 7 (Click Here to Access Updated Charts)
- The S&P500 is hitting all-time-high, rebounding from a V-shaped recovery. REF: Stockcharts
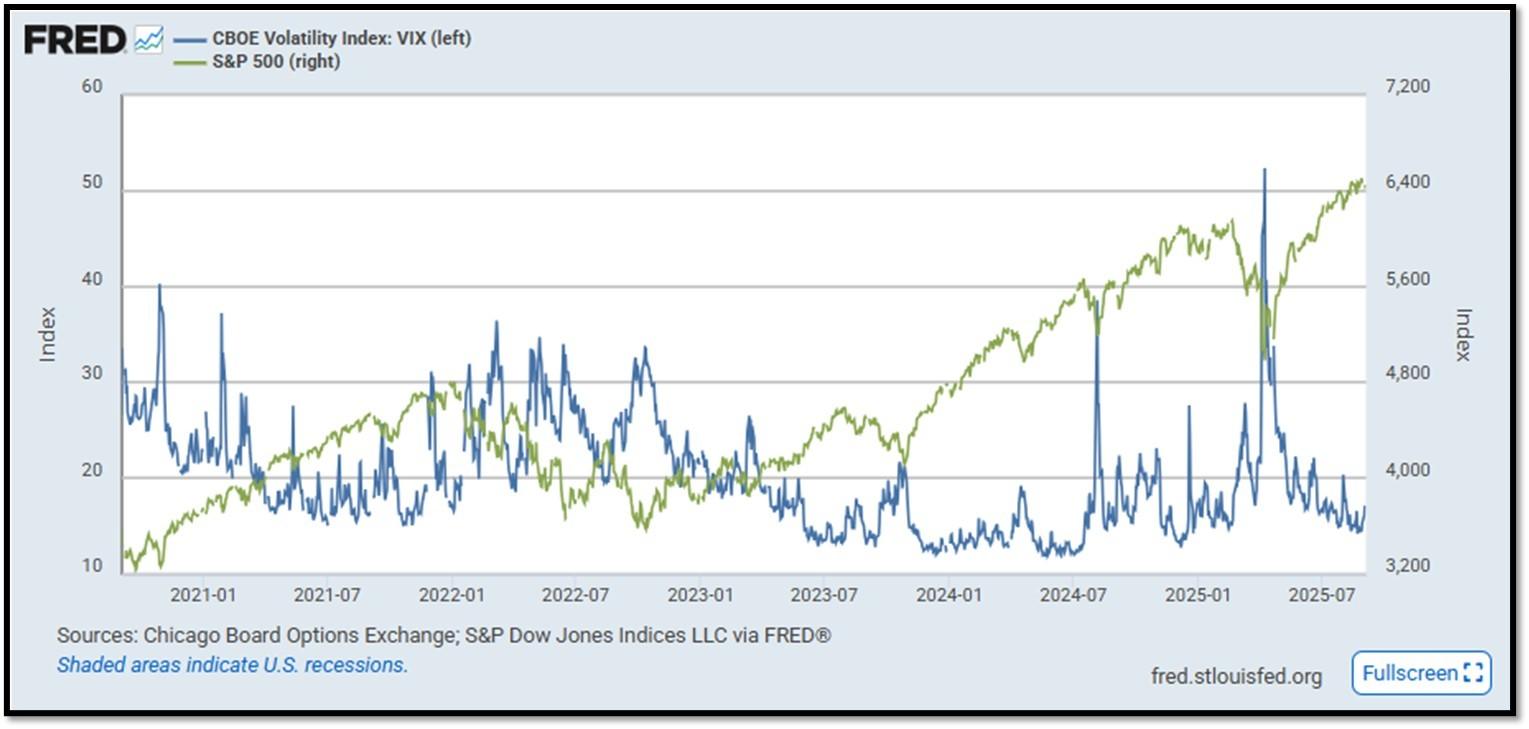
- S&P500 and CBOE Volatility Index (VIX) as of 9/3/2025. REF: FRED, Today’s Print
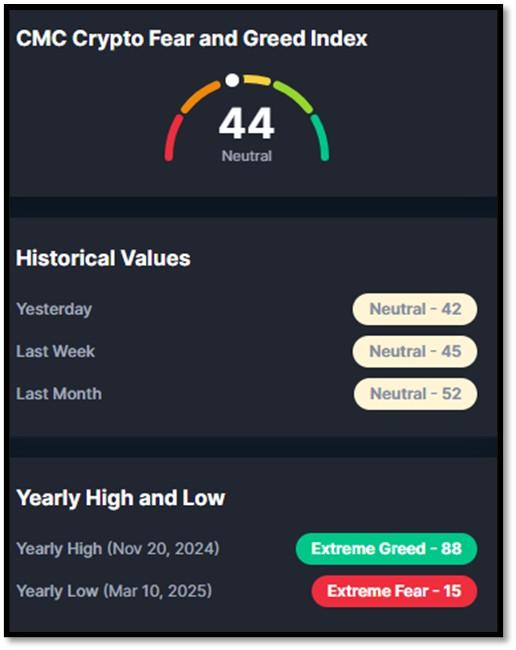
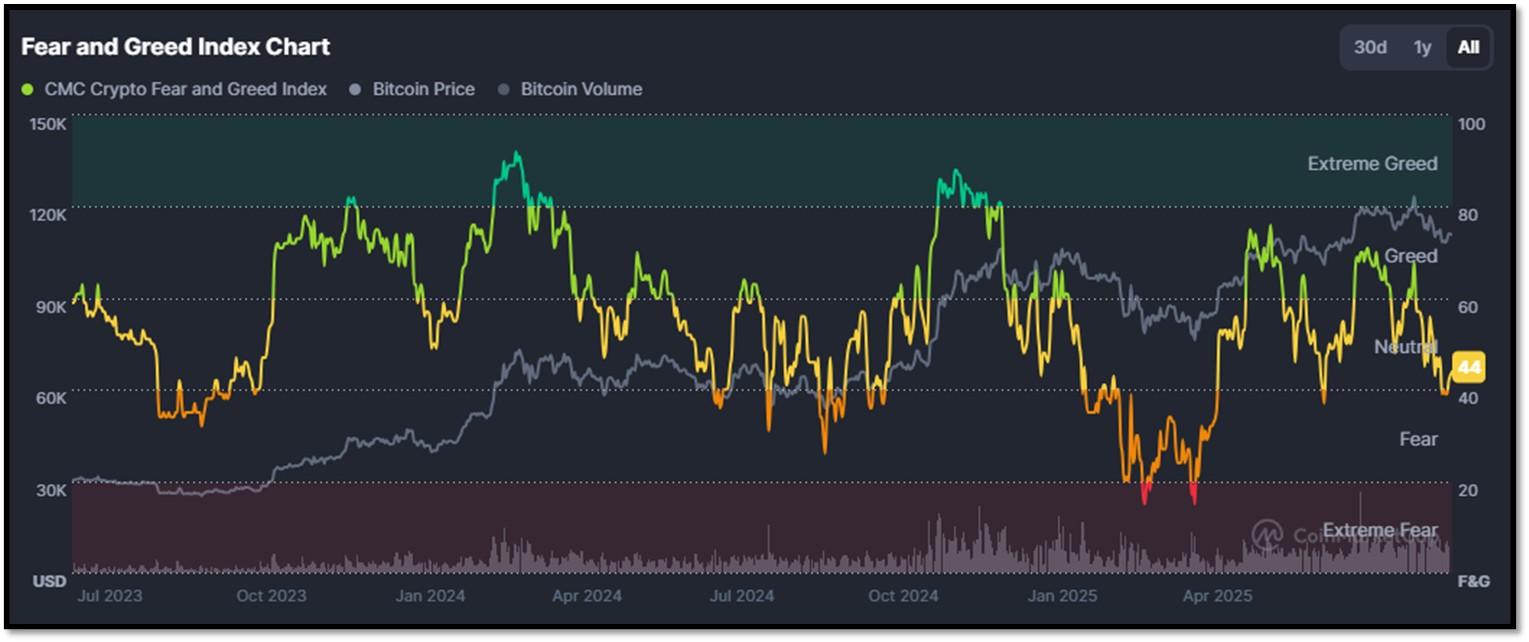
5M. Most recent read on the Crypto Fear & Greed Index with data as of 9/3/2025 is 44 (Neutral). Last week’s data was 45 (Neutral) (1-100). Fear & Greed Index – A Contrarian Data. The crypto market behavior is very emotional. People tend to get greedy when the market is rising which results in FOMO (Fear of missing out). Also, people often sell their coins in irrational reaction of seeing red numbers. With the Crypto Fear and Greed Index, the data try to help save investors from their own emotional overreactions. There are two simple assumptions:
- Extreme fear can be a sign that investors are too worried. That could be a buying opportunity.
- When Investors are getting too greedy, that means the market is due for a correction.
Therefore, the program for this index analyzes the current sentiment of the Bitcoin market and crunch the numbers into a simple meter from 0 to 100. Zero means “Extreme Fear”, while 100 means “Extreme Greed”. REF: Coinmarketcap.com, Today’sReading
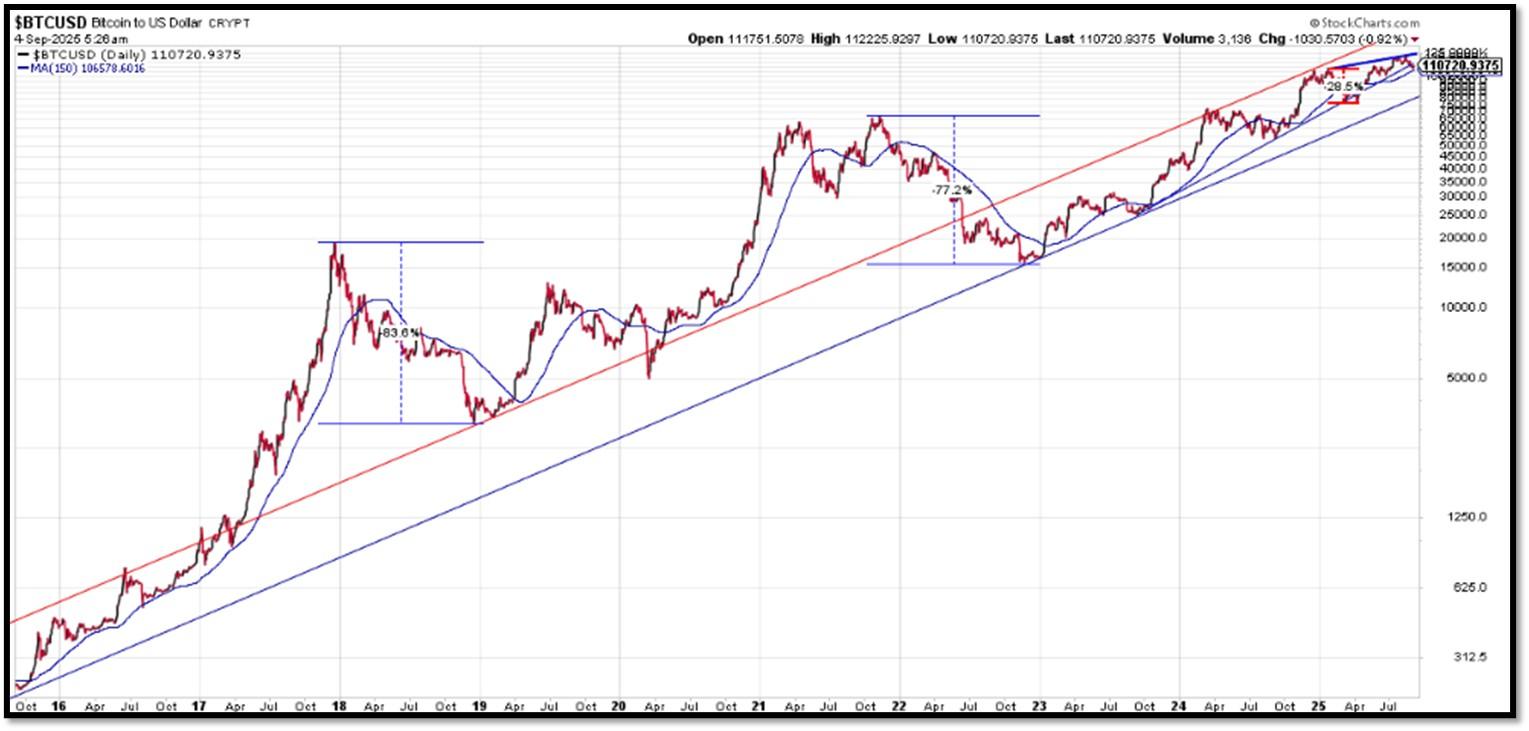
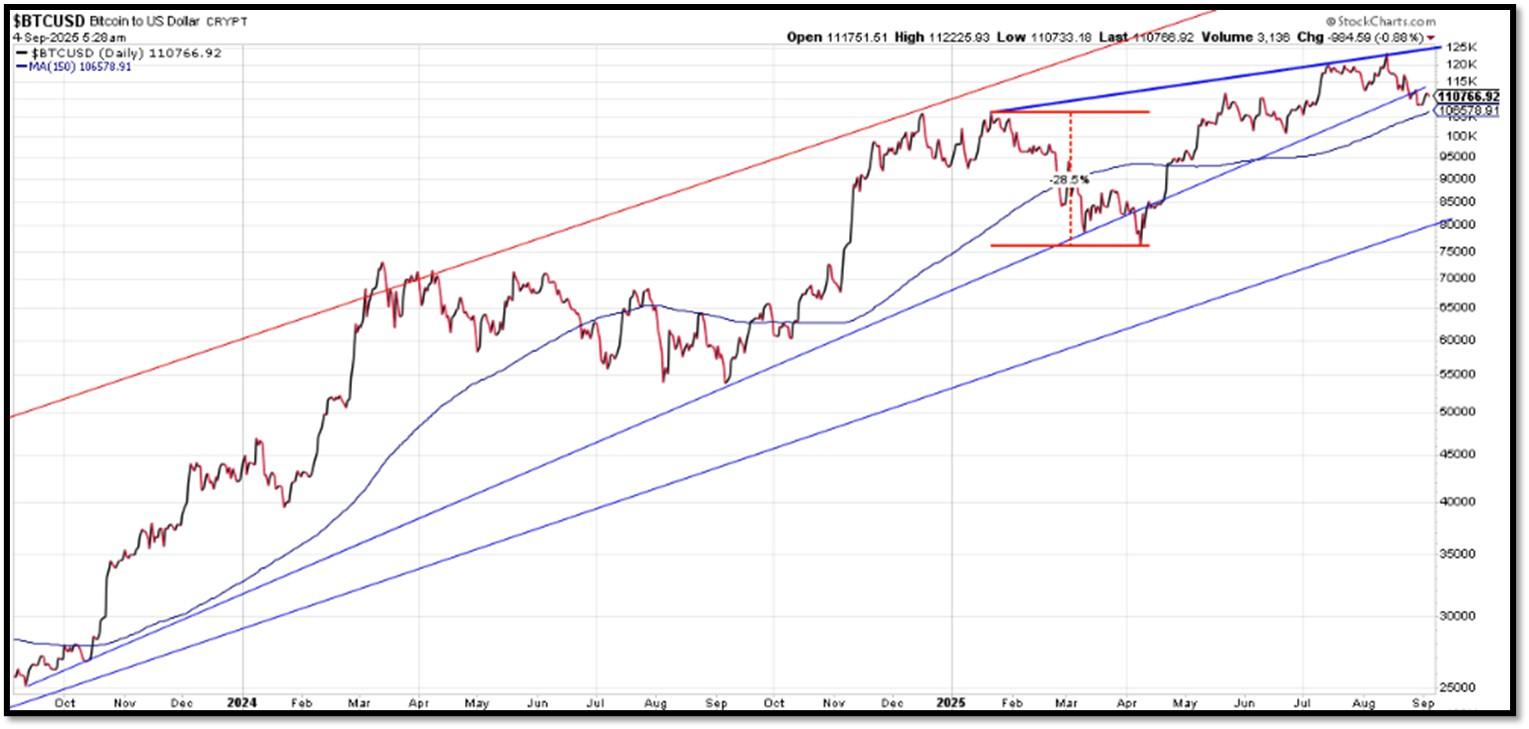
Bitcoin – 10-Year & 2-Year Charts. REF: Stockcharts10Y, Stockcharts2Y
From the desk of our Chief Investment Officer
As an investment professional with over twenty-six years of experience in the financial services industry, Andrew helps clients to protect, grow and transfer wealth during their lifetime with objective, unbiased, customized and efficient strategies.
Education, Professional Licenses Acquired & Affiliations
- Passed the Series 7, 63, 65 and 24 license examinations
- Currently holding Series 65 License
- BA in Economics – Boston University (Boston, MA) 1993
- Certificate in Commodities Trading – New York University (New York, NY) 1991
- Certificate in Financial Planning – New York University (New York, NY) April 2011
With extensive experience in the Financial Services Industry, Andrew Tang and Turner Financial Group provides disciplined wealth management with an intelligent caring approach to each and every client that compliments the Dedicated Financial offering.


Len writes much of his own content, and also shares helpful content from other trusted providers like Turner Financial Group (TFG).
The material contained herein is intended as a general market commentary, solely for informational purposes and is not intended to make an offer or solicitation for the sale or purchase of any securities. Such views are subject to change at any time without notice due to changes in market or economic conditions and may not necessarily come to pass. This information is not intended as a specific offer of investment services by Dedicated Financial and Turner Financial Group, Inc.
Dedicated Financial and Turner Financial Group, Inc., do not provide tax, legal or accounting advice. You should consult your own tax, legal and accounting advisors before engaging in any transaction.
Any hyperlinks in this document that connect to Web Sites maintained by third parties are provided for convenience only. Turner Financial Group, Inc. has not verified the accuracy of any information contained within the links and the provision of such links does not constitute a recommendation or endorsement of the company or the content by Dedicated Financial or Turner Financial Group, Inc. The prices/quotes/statistics referenced herein have been obtained from sources verified to be reliable for their accuracy or completeness and may be subject to change.
Past performance is no guarantee of future returns. Investing involves risk and possible loss of principal capital. The views and strategies described herein may not be suitable for all investors. To the extent referenced herein, real estate, hedge funds, and other private investments can present significant risks, including loss of the original amount invested. All indexes are unmanaged, and an individual cannot invest directly in an index. Index returns do not include fees or expenses.
Turner Financial Group, Inc. is an Investment Adviser registered with the United States Securities and Exchange Commission however, such registration does not imply a certain level of skill or training and no inference to the contrary should be made. Additional information about Turner Financial Group, Inc. is also available at www.adviserinfo.sec.gov. Advisory services are only offered to clients or prospective clients where Turner Financial Group, Inc. and its representatives are properly licensed or exempt from licensure. No advice may be rendered by Turner Financial Group, Inc. unless a client service agreement is in place.


