

- 1. This week’s economic data for the period ending September 12, 2025, presented a nuanced view of the U.S. economy, with inflation ticking higher and labor market signals weakening, setting the stage for the Federal Reserve’s upcoming policy decisions.
- 2. India has become a prime destination for data center investments, with global and domestic companies capitalizing on its digital boom.
- 3. Several actively managed mutual funds and ETFs focus on investing in Indian equities, offering investors exposure to the country’s growing economy through professional stock selection and portfolio management.
- 4. World Watch
- 4A. The recent downgrade of France’s credit rating by Fitch underscores deep concerns over the country’s worsening fiscal trajectory and political instability.
- 4B. The divergence between Wall Street and Main Street has rarely been as stark as it is today. Investor sentiment remains near all-time highs, with stock market indices hovering close to record levels, valuations stretched, and capital markets displaying resilience amid hopes of a technology-driven expansion.
- 4C.An updated snapshot of the current global state of economy.
- 5. Quant & Technical Corner – A selection of quantitative & technical data we monitor on a regular basis to help gauge the overall financial market conditions and the investment environment.
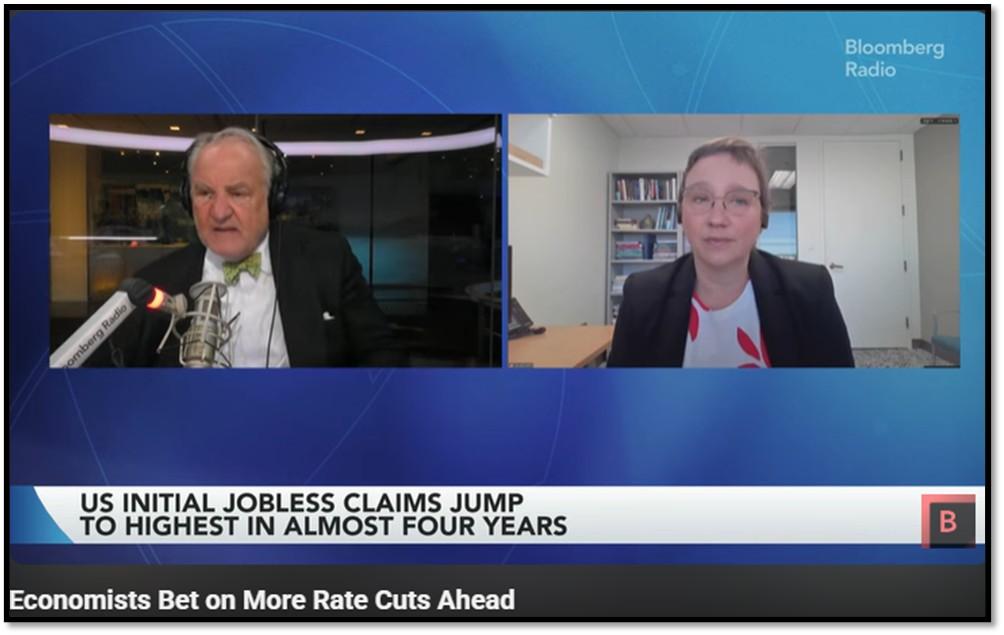
1. This week’s economic data for the period ending September 12, 2025, presented a nuanced view of the U.S. economy, with inflation ticking higher and labor market signals weakening, setting the stage for the Federal Reserve’s upcoming policy decisions.
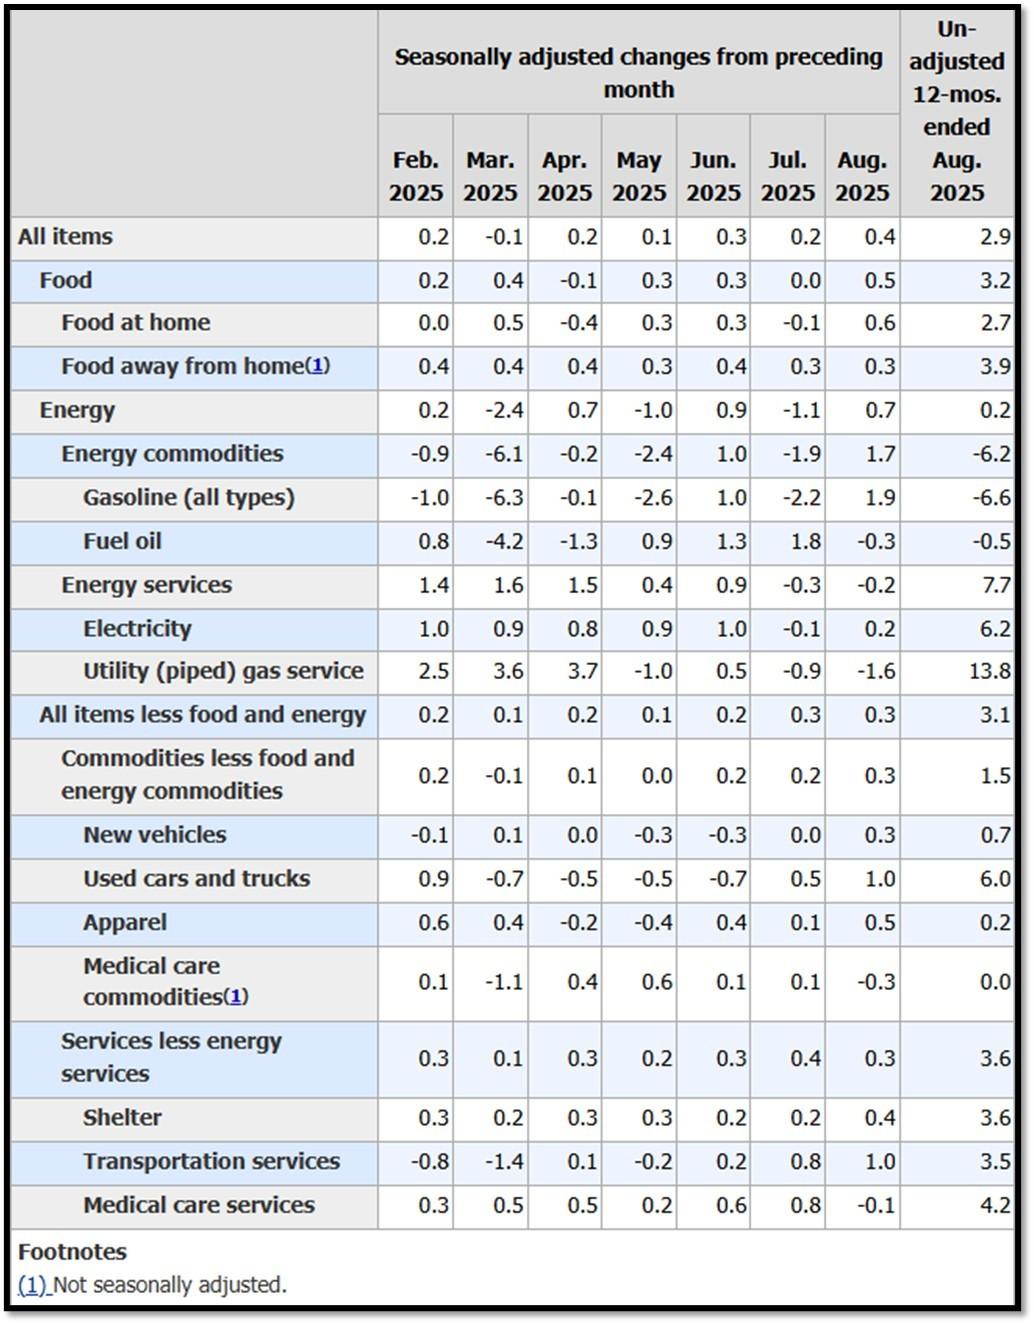
The Producer Price Index (PPI) for August rose 0.2% month-over-month, slightly below the expected 0.3%, while core PPI, excluding food and energy, met forecasts at 0.3% monthly and 3.2% annually, indicating steady wholesale pressures. The Consumer Price Index (CPI) climbed 0.4% month-over-month, above the anticipated 0.3%, reaching 2.9% year-over-year, the fastest since early 2025, while core CPI held at 3.1% annually as expected, driven by shelter and travel costs. Labor market data showed initial jobless claims jumping to 263,000, exceeding forecasts of 240,000 and nearing a four-year high, with continuing claims at 1.88 million, above the expected 1.85 million, signaling rising layoffs and slower hiring. These figures bolstered expectations for a 25-basis-point rate cut at the Fed’s September 18 meeting, though persistent inflation tempered hopes for more aggressive easing.
In my view, the shelter component of the Consumer Price Index (CPI) does not accurately reflect current market conditions. Data from Apartments.com, which provides near real-time insights, shows that rent decreased by 0.23% month-over-month in August, translating to an annualized decline of approximately 2.7% when compounded. Additionally, the 1.9% rise in gasoline prices was driven by temporary refinery disruptions along the Gulf Coast due to a hurricane, but with all units now operational, I do not expect sustained energy price increases. Click onto picture below to access video. REF: Apartments.com, GIS, OPIS, Briefing
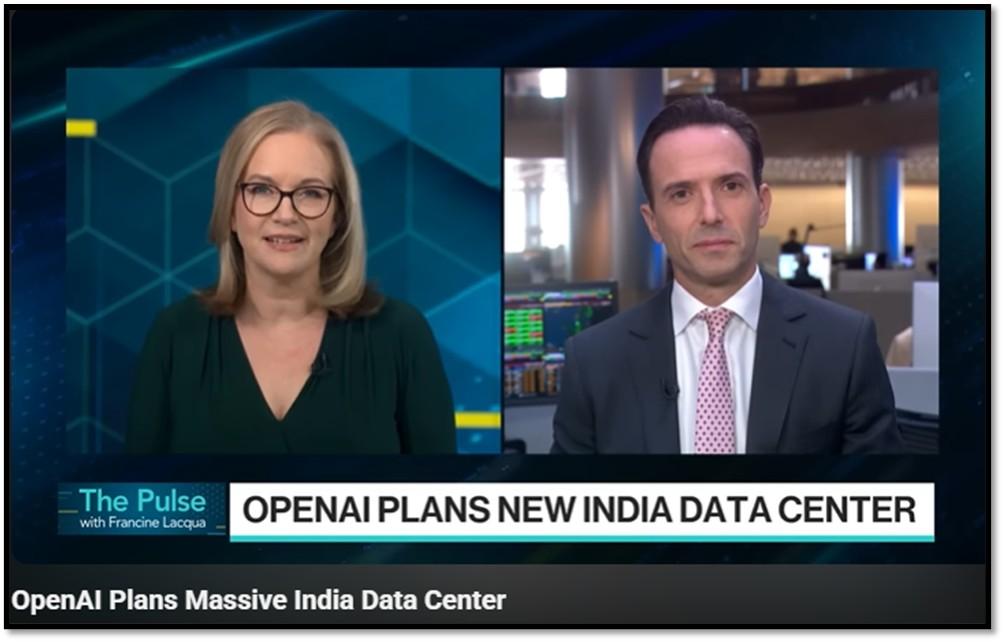
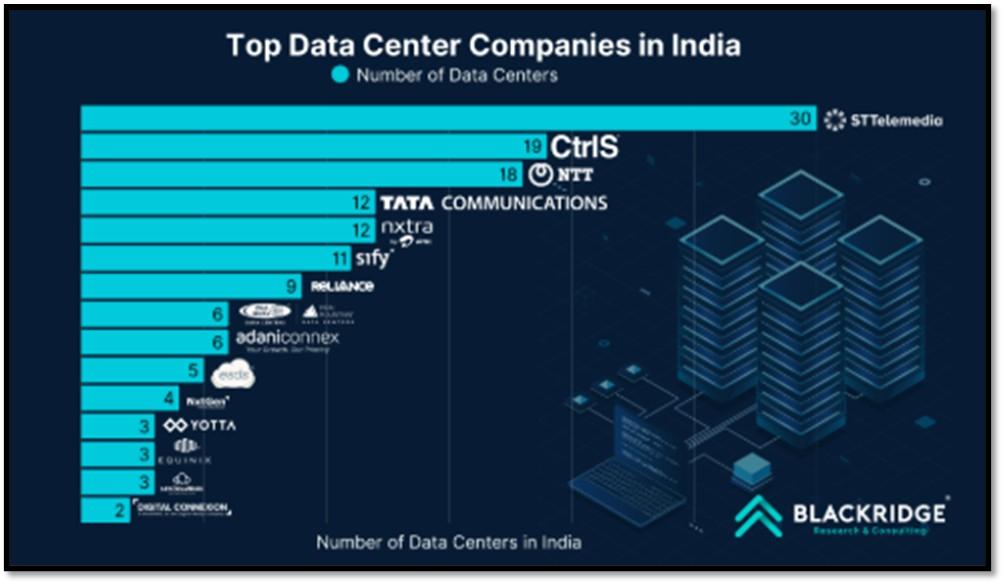
2. India has become a prime destination for data center investments, with global and domestic companies capitalizing on its digital boom.
Major players like Amazon Web Services, Microsoft Azure, and Google Cloud are investing billions, with Google planning an 8-storey facility in Navi Mumbai by 2025 and Microsoft expanding in Mumbai. OpenAI is exploring a 1 GW AI data center, while domestic firms like CtrlS Datacenters, AdaniConneX, and Reliance Industries are developing hyperscale sites in cities like Chennai, Noida, and Jamnagar, with Reliance targeting a 3 GW AI-ready complex. India’s appeal lies in its massive data generation—20% of the global total—yet only 3% of global capacity, creating vast growth potential. Its strategic location, with submarine cables in Mumbai and Chennai, ensures low-latency connectivity, while a skilled IT workforce, low construction costs ($6.60 per watt in Mumbai), and government incentives like the Data Centre Incentivization Scheme make it economically and geopolitically attractive for data localization and compliance.
India’s electricity grid, with a capacity of 485 GW as of June 2025, is among the world’s largest, with 50% from non-fossil sources like solar and hydro, supporting a peak demand of 273 GW. Data centers, currently under 1% of consumption, are projected to hit 3% by 2030 as capacity grows to 9 GW, potentially straining local grids in hubs like Maharashtra. Instead of building independent power facilities, most companies rely on renewable energy procurement, on-site backups like diesel generators or batteries, and utility partnerships. For instance, Reliance and AdaniConneX prioritize green energy, while AWS and Microsoft integrate solar and storage, aligning with India’s 50% non-fossil target and mitigating risks through hybrid power models rather than standalone plants. Click onto picture below to access video. REF: Bloomberg, BlackridgeResearch, Research&Markets
3. Several actively managed mutual funds and ETFs focus on investing in Indian equities, offering investors exposure to the country’s growing economy through professional stock selection and portfolio management.
For mutual funds, the Matthews India Fund (MINDX) is a prominent option, investing at least 80% of its assets in stocks of companies located in India, with a bottom-up approach targeting entrepreneurial firms with sustainable growth and competitive edges across market caps. Another well-regarded choice is the Wasatch Emerging India Fund (WAINX), which emphasizes small- and mid-cap Indian companies poised for long-term expansion in sectors like consumer goods and technology. On the ETF side, the Matthews India Active ETF (INDE) provides similar unconstrained all-cap exposure, focusing on companies with pricing power and resilience across economic cycles, while the Global X India Active ETF (NDIA) screens for quality business models and management teams to capture domestic-driven growth over a 4–5-year horizon, supported by a Mumbai-based team.

NOTE: Not investment advice or recommendations. Investors should carefully consider the investment objectives, risks, charges, and expenses before investing. For additional information about the securities mentioned above or in the video, please visit the respective companies’ investor relations pages or the websites of the funds discussed. Please read all materials carefully before investing.
- Matthews India Fund (MINDX)
- Wasatch Emerging India Fund (WAINX)
- Matthews India Active ETF (INDE)
- Global X India Active ETF (NDIA)
With the current macro-economic backdrop, below are areas we currently favor:
- Fixed Income – Short-term Corporates (Low-Beta)
- Fixed Income – (Corporates & Muni) High Yield as Opportunistic Allocation (Low-Beta)
- Businesses that contribute to and benefit from AI & Automation (Market-Risk)
- India (Market-Risk)
- Fintech & Financials (Market-Risk)
- Digital Asset – Bitcoin (Market-Risk/Hedge)
- Cloud Computing (Market-Risk)
- Cyber-Security & Software (Market-Risk)
4. World Watch
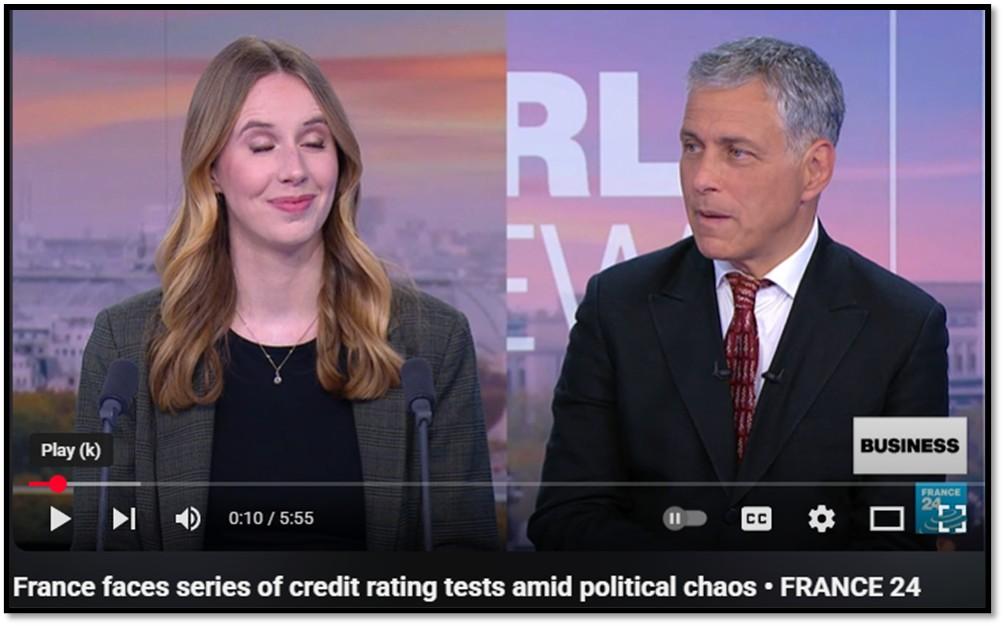
4A. The recent downgrade of France’s credit rating by Fitch underscores deep concerns over the country’s worsening fiscal trajectory and political instability.
The move came just days after the ousting of France’s prime minister, who failed to enact meaningful measures to rein in the ballooning budget deficit. This sequence of events highlights a dual challenge: on one hand, the inability of political leadership to implement fiscal reforms, and on the other, the structural imbalances in France’s public finances that continue to strain confidence. A downgrade not only signals higher borrowing costs for the French government, but also risks undermining investor sentiment at a time when fiscal discipline is critical.
Beyond France’s borders, these fiscal problems could reverberate across the European Union. As the eurozone’s second-largest economy, France’s deteriorating financial position represents a potential pain point for the stability of the broader bloc. Mounting deficits and political gridlock threaten to weaken the EU’s credibility in enforcing budgetary rules, especially as other member states also grapple with post-pandemic debt loads and rising social spending demands. If unchecked, France’s fiscal slippage could heighten tensions with Germany and other fiscally conservative countries, strain the cohesion of EU policymaking, and weigh on the euro. Ultimately, Fitch’s downgrade serves not just as a critique of France’s current governance, but also as a warning to the EU that one of its key pillars is faltering at a precarious moment for the region. Click onto picture below to access video. REF: WSJ, FRANCE24
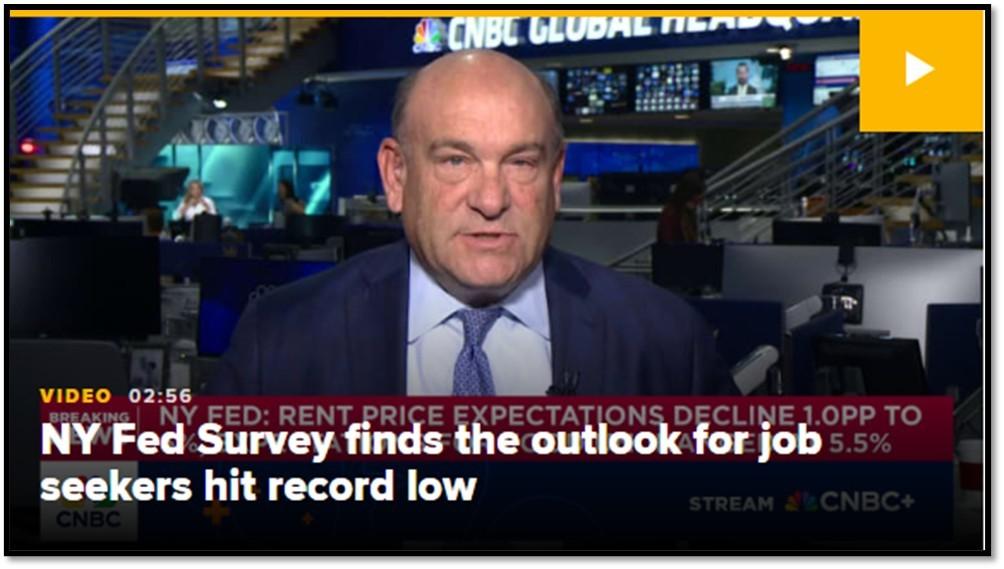
4B. The divergence between Wall Street and Main Street has rarely been as stark as it is today. Investor sentiment remains near all-time highs, with stock market indices hovering close to record levels, valuations stretched, and capital markets displaying resilience amid hopes of a technology-driven expansion.
Yet, at the same time, the New York Fed’s latest Survey of Consumer Expectations paints a far gloomier picture for workers and households. According to the survey, the probability of finding another job after losing one fell to just 44.9%—the lowest level in the survey’s history—underscoring the growing fragility in labor market confidence. Compounding this, consumer expectations that the unemployment rate will rise a year from now climbed to 39.1%, up 1.7 percentage points from July, reflecting a deepening anxiety among households about economic stability.
This split reveals a troubling imbalance: investors, buoyed by liquidity, innovation, and market optimism, are embracing risk, while workers and consumers are bracing for harder times ahead. On Main Street, the loss of confidence in job security and future economic prospects signals strain beneath the surface, even as financial markets project strength. The coexistence of nearly record-high investor confidence with near record-low worker and consumer confidence highlights the disconnect between financial markets and the real economy. Ultimately, this divergence raises questions about the durability of the rally on Wall Street if the foundation of household sentiment and labor market stability continues to weaken. Click onto picture below to access video. REF: CNBC
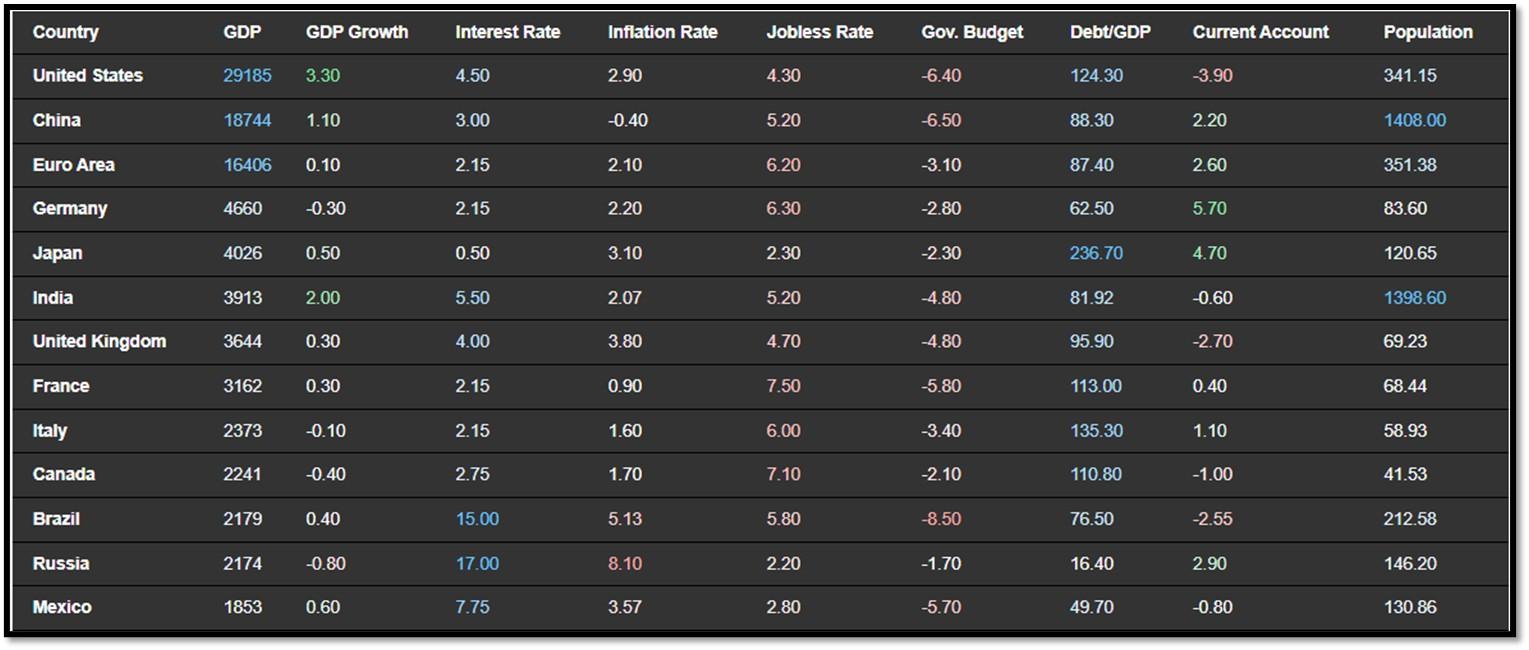
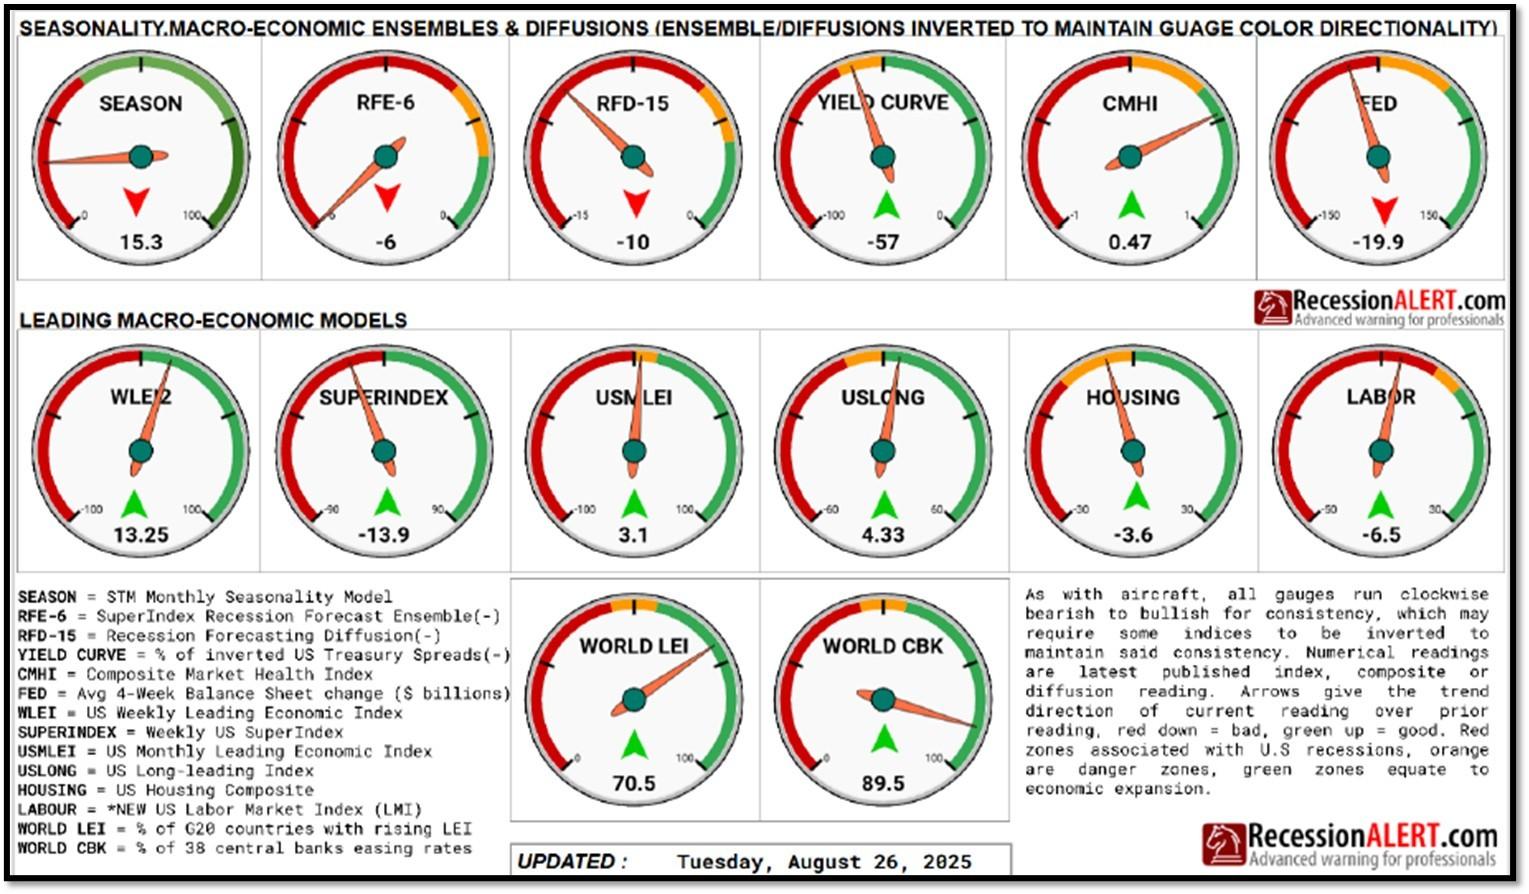
4C.An updated snapshot of the current global state of economy.
According to TradingEconomics as of 9/12/2025 ( REF: TradingEconomics):
- The US annual inflation rate accelerated to 2.9% in August 2025, the highest since January, after holding at 2.7% in both June and July, in line with market expectations.
- The US unemployment rate rose to 4.3% in August of 2025 from 4.2% in the previous month, aligning with market expectations to reflect the highest proportion of joblessness since October of 2021.
- China’s consumer prices dropped 0.4% yoy in August 2025, after being flat in the previous month and missing market expectations of a 0.2% fall. It was the fifth time of consumer deflation this year and the sharpest pace since February.
- Japan’s GDP expanded 0.5% qoq in Q2 2025, beating a flash estimate of 0.3% and picking up from an upwardly revised 0.1% in Q1.
5. Quant & Technical Corner – A selection of quantitative & technical data we monitor on a regular basis to help gauge the overall financial market conditions and the investment environment.
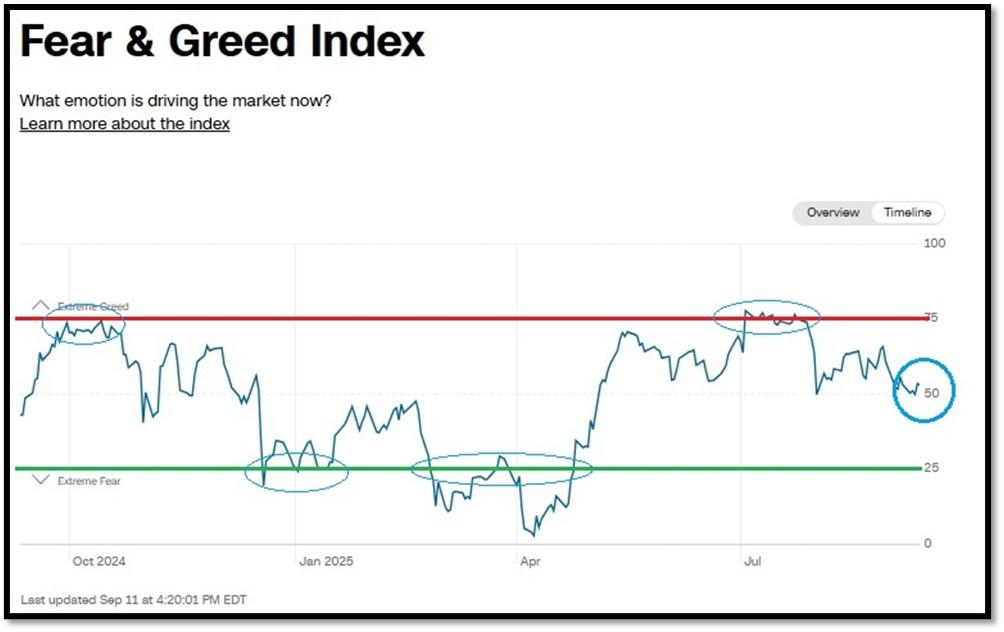
5A. Most recent read on the Fear & Greed Index with data as of 9/11/2025 – 4:20 PM-ET is 53 (Neutral). Last week’s data was 55 (Greed) (1-100). CNNMoney’s Fear & Greed index looks at 7 indicators (Stock Price Momentum, Stock Price Strength, Stock Price Breadth, Put and Call Options, Junk Bond Demand, Market Volatility, and Safe Haven Demand). Keep in mind this is a contrarian indicator! REF: Fear&Greed via CNNMoney

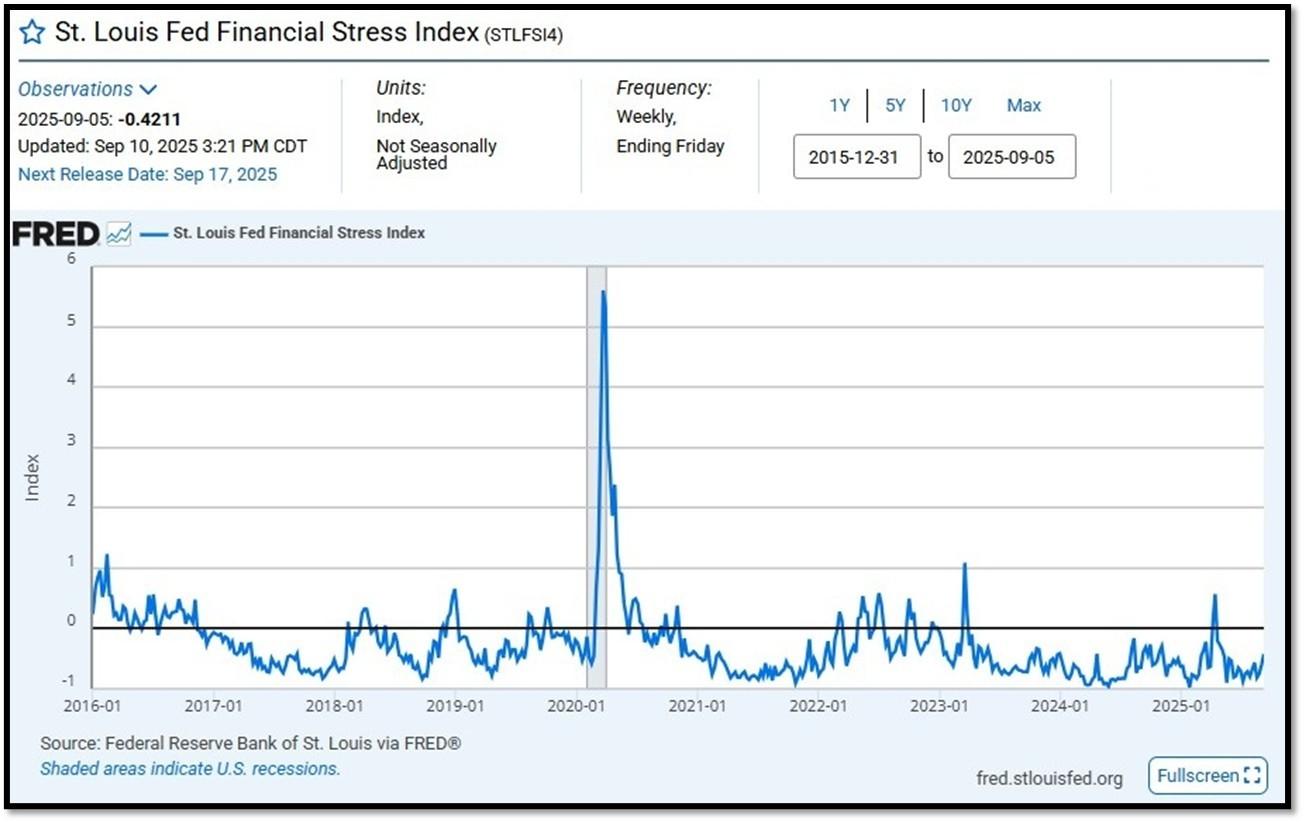
5B. St. Louis Fed Financial Stress Index’s (STLFSI4) most recent read is at –0.4211 as of September 10, 2025. Previous week’s data was -0.7505. A big spike up from previous readings reflecting the turmoil in the banking sector back in 2023. This weekly index is not seasonally adjusted. The STLFSI4 measures the degree of financial stress in the markets and is constructed from 18 weekly data series: seven interest rate series, six yield spreads and five other indicators. Each of these variables captures some aspect of financial stress. Accordingly, as the level of financial stress in the economy changes, the data series are likely to move together. REF: St. Louis Fed
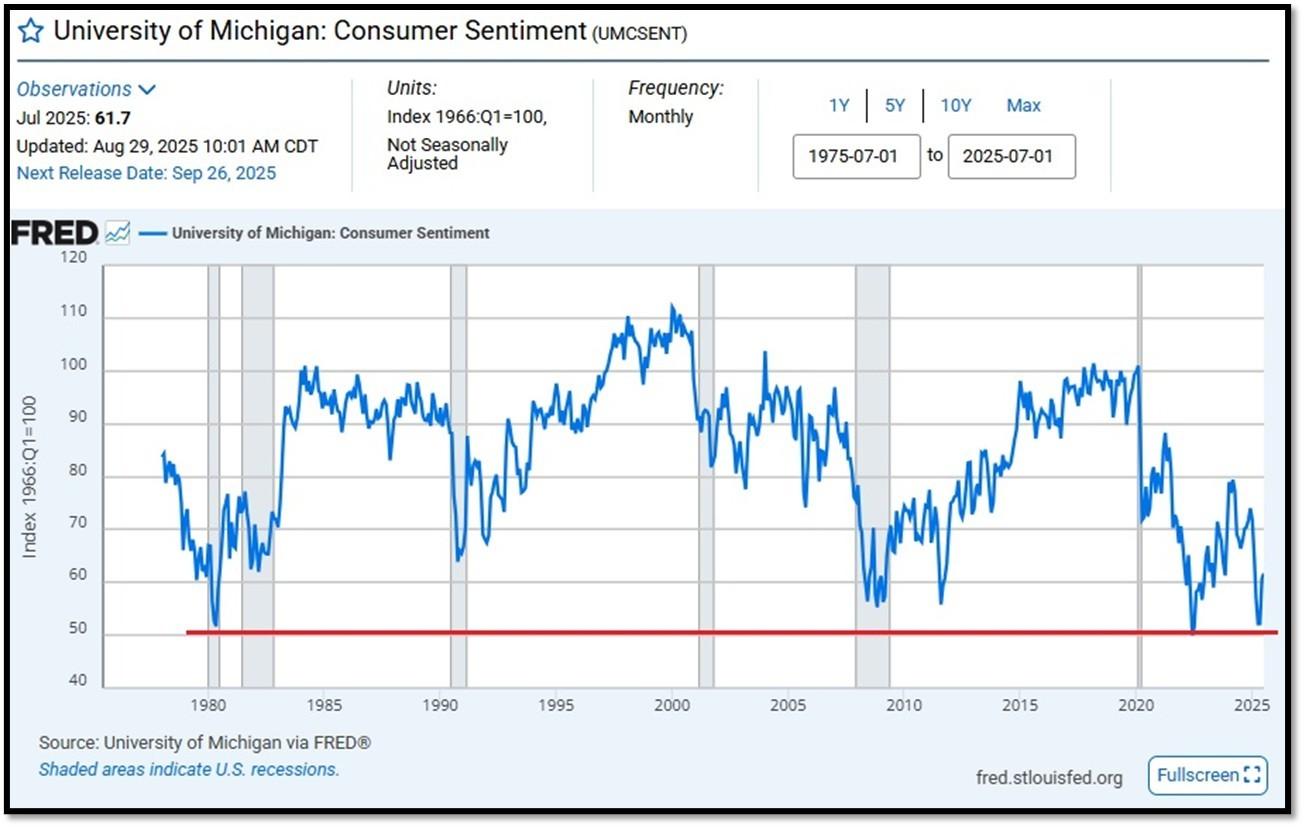
5C. University of Michigan, University of Michigan: Consumer Sentiment for February [UMCSENT] at 61.7, retrieved from FRED, Federal Reserve Bank of St. Louis, August 29, 2025. Back in June 2022, Consumer Sentiment hit a low point going back to April 1980. REF: UofM
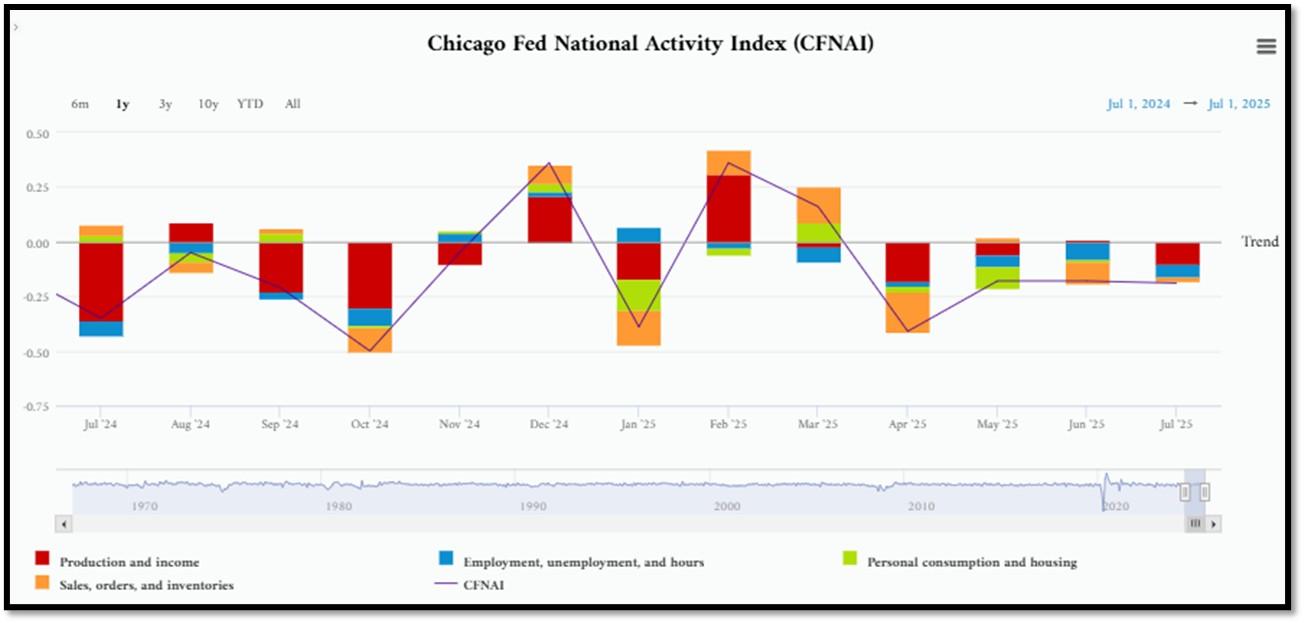
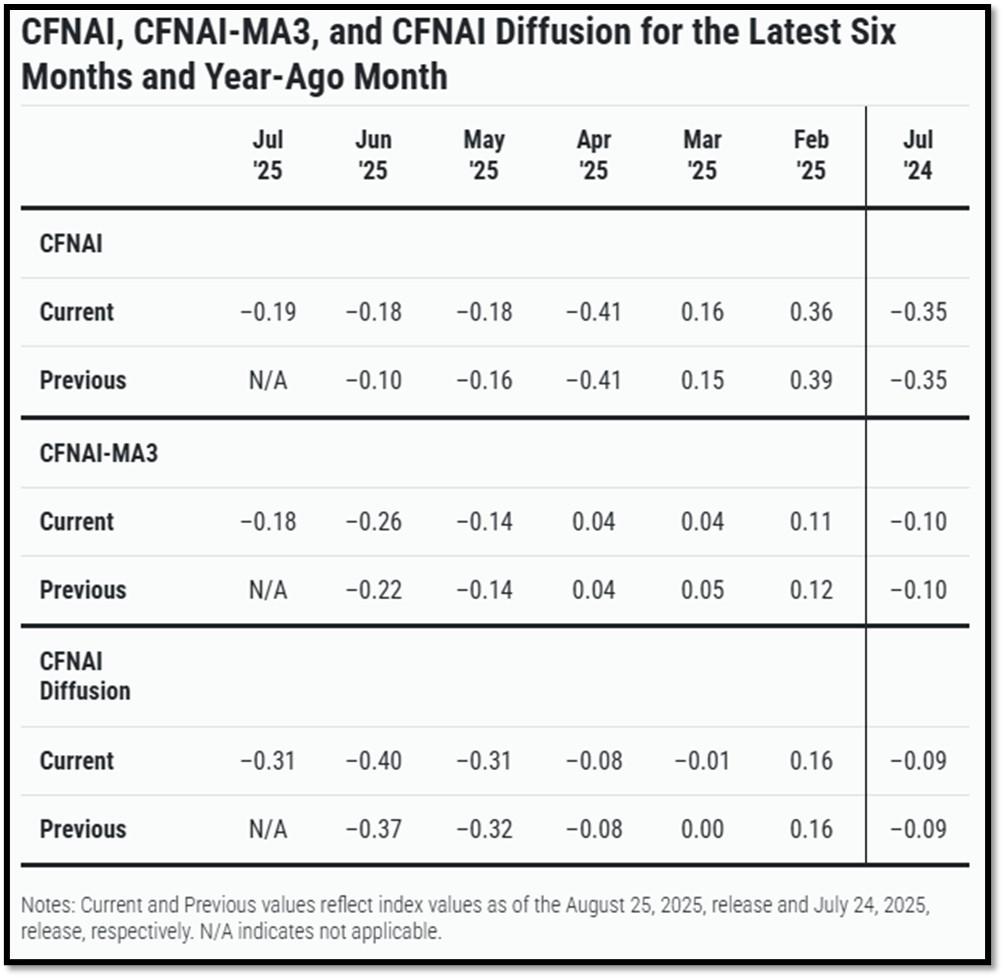
5D. The Chicago Fed National Activity Index (CFNAI) decreased to –0.19 in July from –0.18 in June. One of the four broad categories of indicators used to construct the index decreased from June, and three categories made negative contributions in July. The index’s three-month moving average, CFNAI-MA3, increased to –0.18 in July from –0.26 in June. REF: ChicagoFed, June’s Report
5E. (8/21/2025) The Conference Board Leading Economic Index (LEI) for the US inched down by 0.1% in July 2025 to 98.7 (2016=100), after declining by 0.3% in June. The LEI fell by 2.7% over the six months between January and July 2025, a faster rate of decline than its –1.0% contraction over the previous six-month period (July 2024 to January 2025. The composite economic indexes are the key elements in an analytic system designed to signal peaks and troughs in the business cycle. The indexes are constructed to summarize and reveal common turning points in the economy in a clearer and more convincing manner than any individual component. The CEI is highly correlated with real GDP. The LEI is a predictive variable that anticipates (or “leads”) turning points in the business cycle by around 7 months. Shaded areas denote recession periods or economic contractions. The dates above the shaded areas show the chronology of peaks and troughs in the business cycle. The ten components of The Conference Board Leading Economic Index® for the U.S. include: Average weekly hours in manufacturing; Average weekly initial claims for unemployment insurance; Manufacturers’ new orders for consumer goods and materials; ISM® Index of New Orders; Manufacturers’ new orders for nondefense capital goods excluding aircraft orders; Building permits for new private housing units; S&P 500® Index of Stock Prices; Leading Credit Index™; Interest rate spread (10-year Treasury bonds less federal funds rate); Average consumer expectations for business conditions. REF: ConferenceBoard, LEI Report for July (ReceesionAlert) (Released on 9/1/2025)
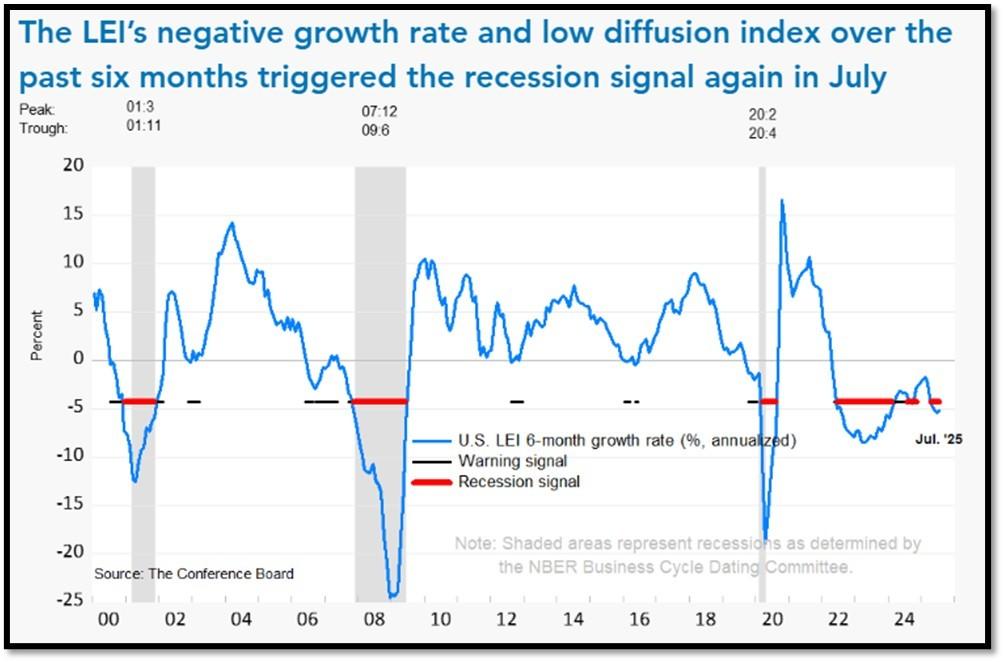
We have experienced a “rolling recession” since June 2022 and are only now emerging from it. However, authorities are not labeling it a recession due to high employment data.
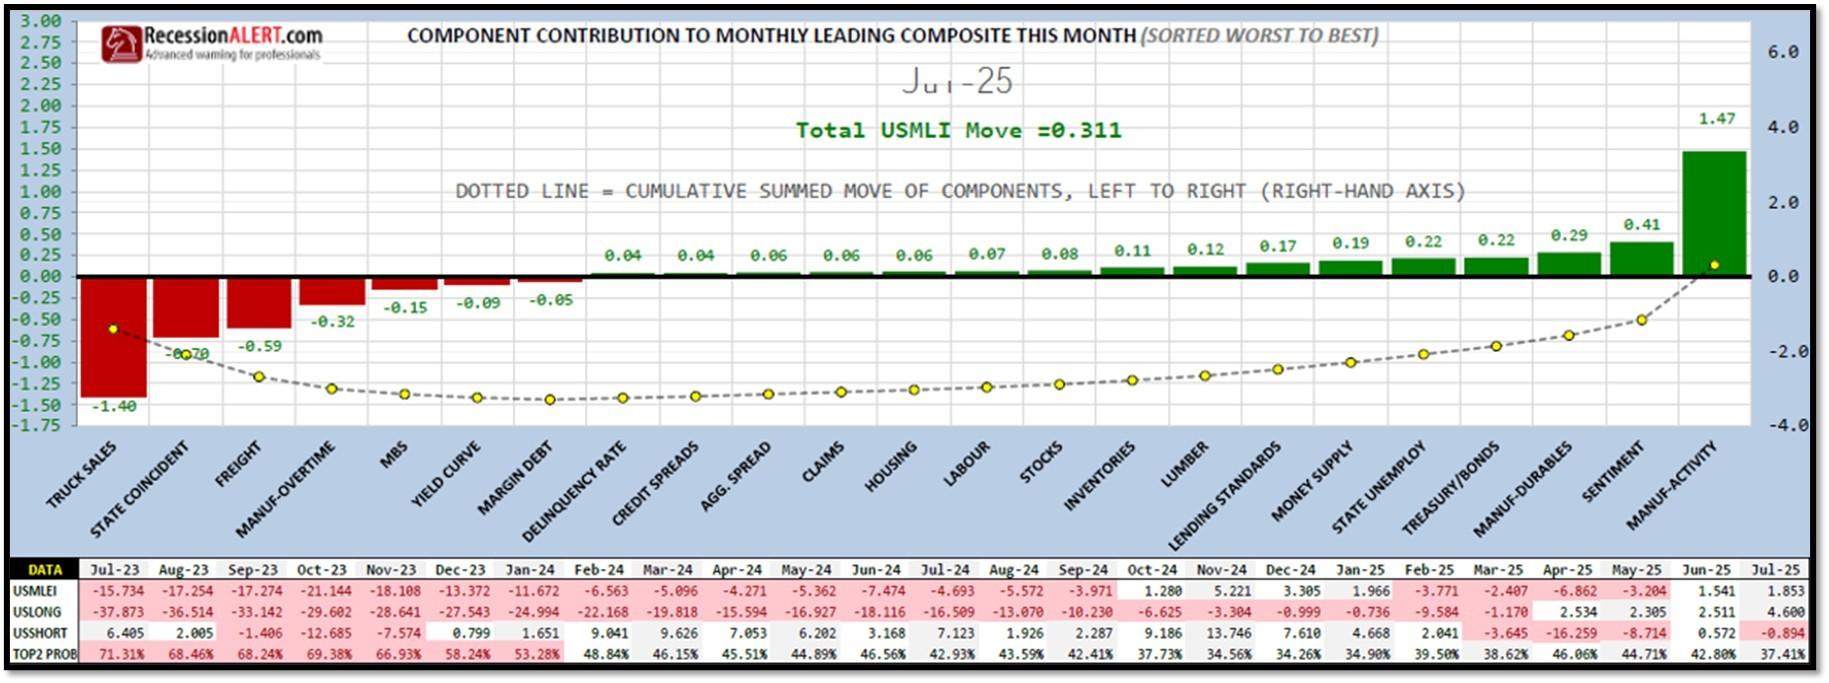
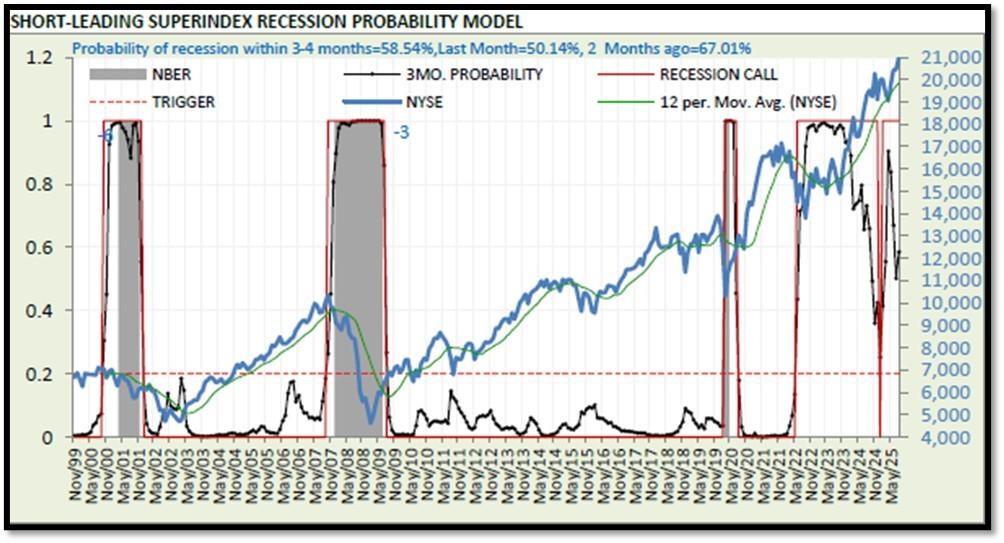
5F. Probability of U.S. falling into Recession within 3 to 4 months is currently at 58.54% (with data as of 08/26/2025 – Next Report 09/09/2025) according to RecessionAlert Research. Last release’s data was at 63.1%. This report is updated every two weeks. REF: RecessionAlertResearch
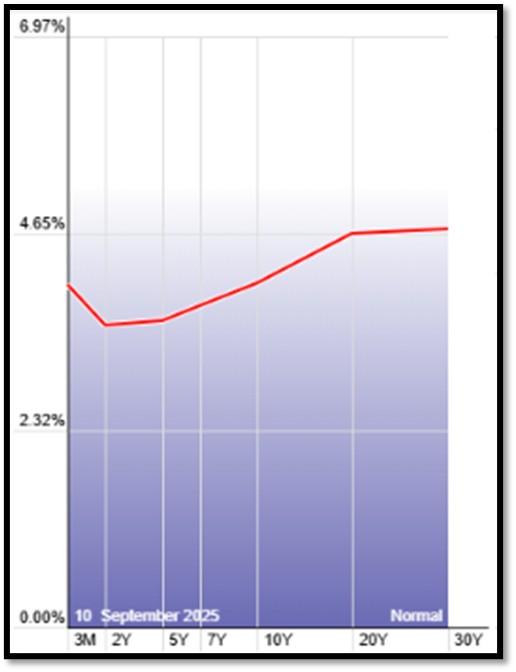
5G. Yield Curve as of 9/11/2025 is showing Normal. Spread on the 10-yr Treasury Yield (4.02%) minus yield on the 2-yr Treasury Yield (3.54%) is currently at 48bps. REF: Stockcharts The yield curve—specifically, the spread between the interest rates on the ten-year Treasury note and the three-month Treasury bill—is a valuable forecasting tool. It is simple to use and significantly outperforms other financial and macroeconomic indicators in predicting recessions two to six quarters ahead. REF: NYFED
5H. Recent Yields in 10-Year Government Bonds. REF: Source is from Bloomberg.com, dated 9/11/2025, rates shown below are as of 9/11/2025, subject to change.
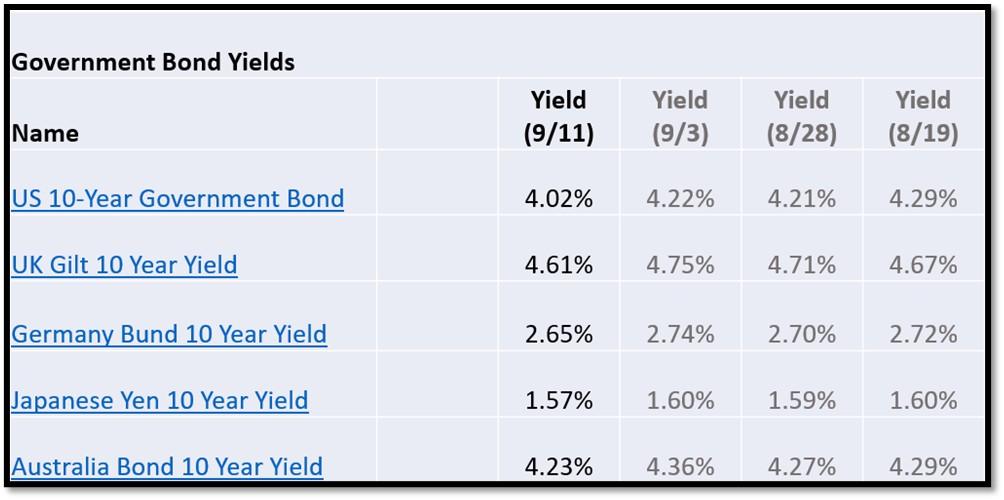
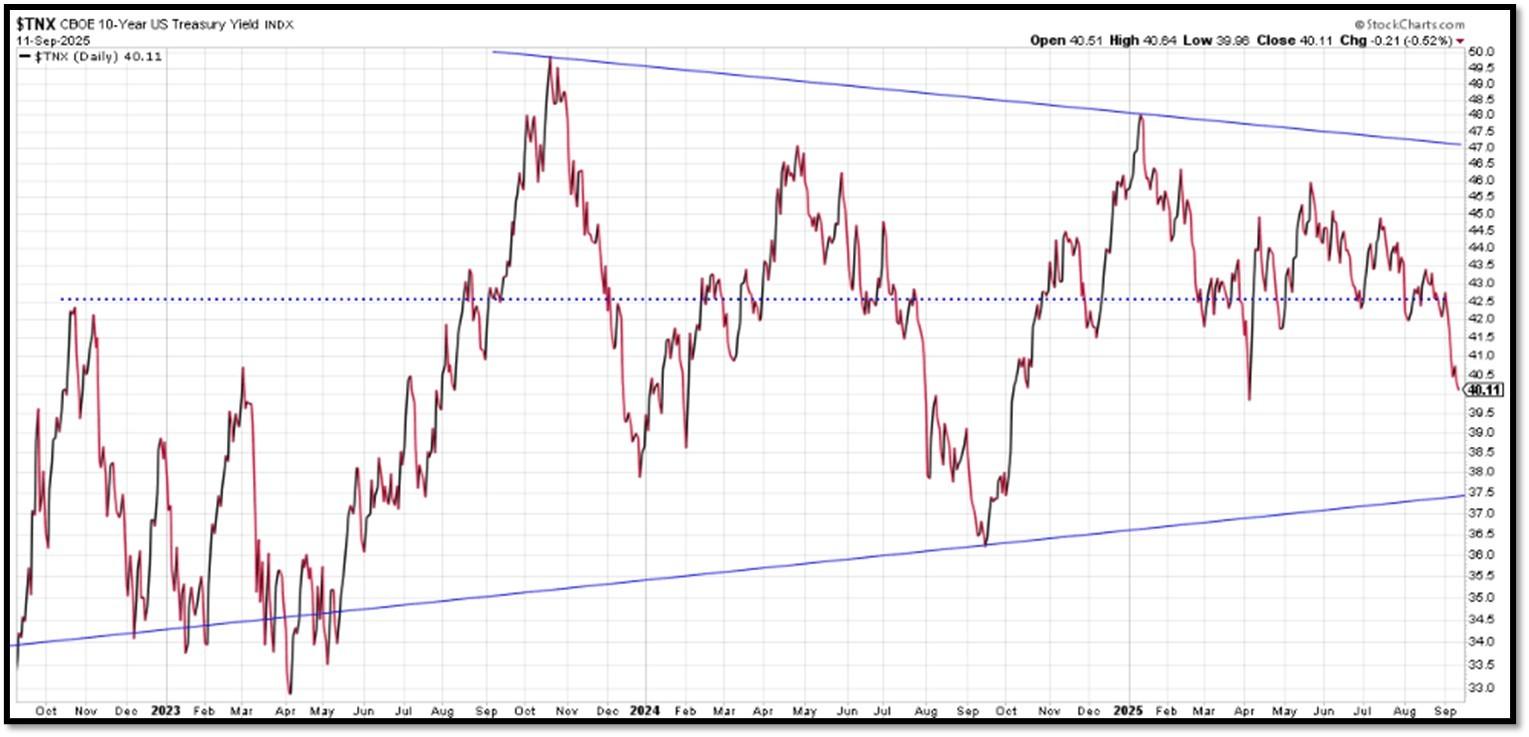
The 10-Year US Treasury Yield… The 10-Year Yield is indirectly related to inflation. I expect the 10-Year Yield to drop further as dis-inflation kicks in. REF: StockCharts1
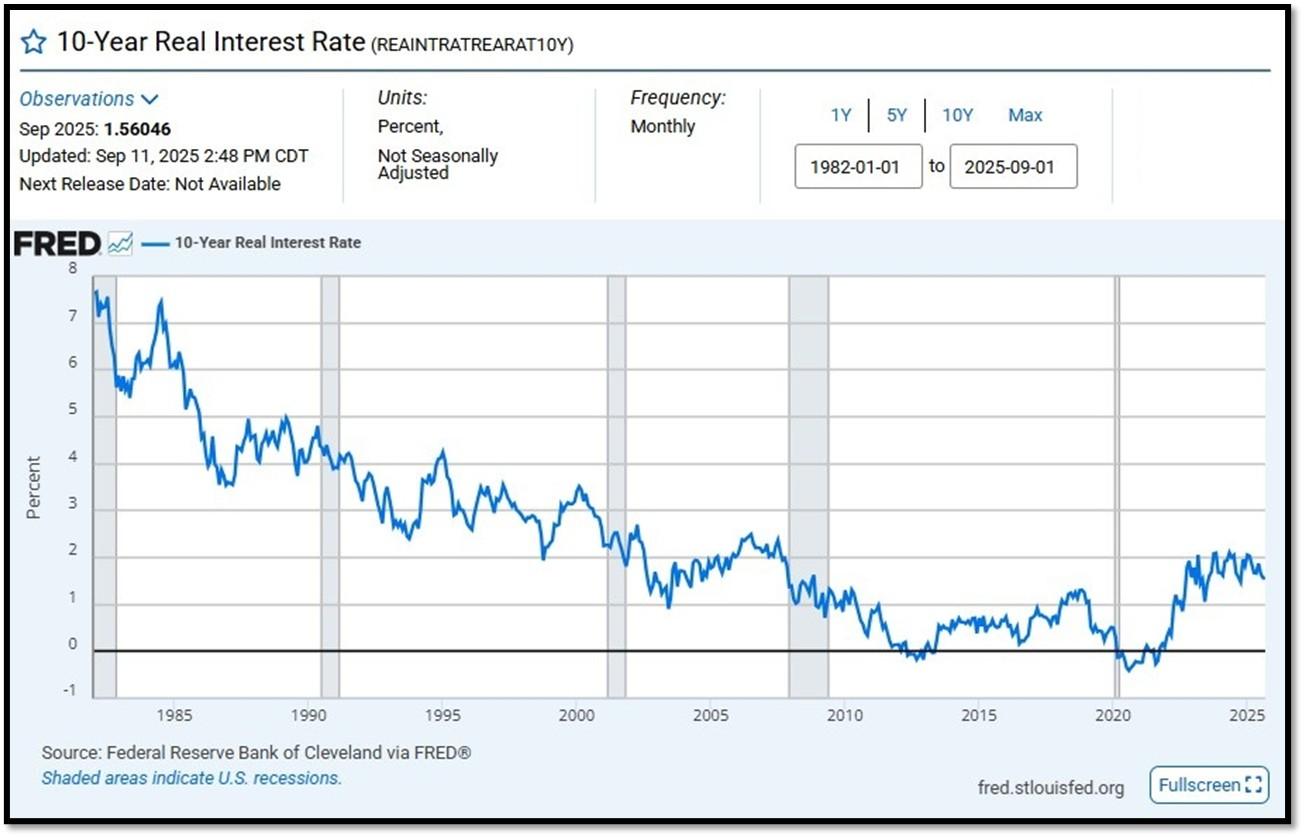
10-Year Real Interest Rate at 1.56046% as of 9/11/25. Last month’s data was 1.56633%. REF: REAINTRATREARAT10Y
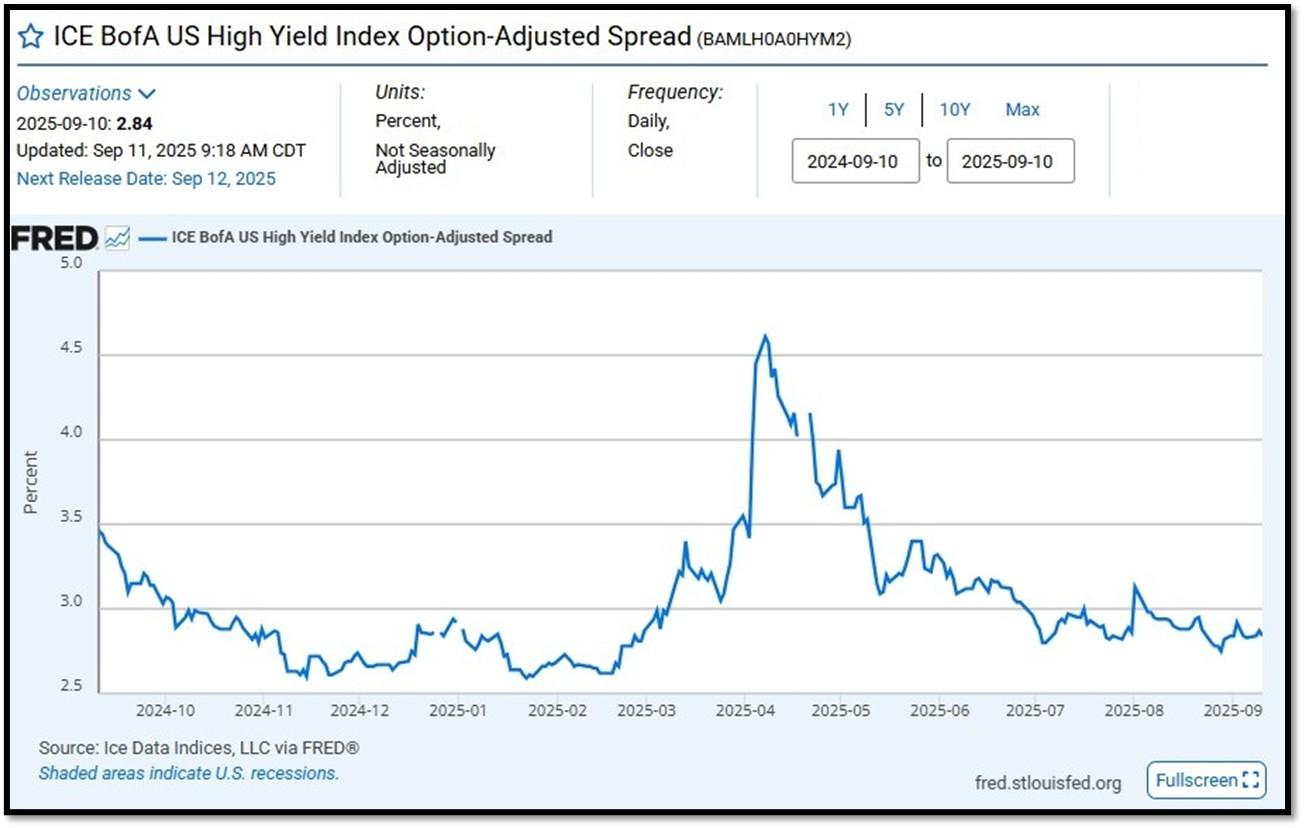
ICE BofA US High Yield Index Option-Adjusted Spread (BAMLH0A0HYM2) currently at 2.84 as of September 11, 2025. This is a key indicator of market sentiment, particularly regarding risk and economic health. At its core, the spread reflects the extra return investors demand to hold riskier corporate debt over safer government securities. High-yield bonds are issued by companies with lower credit ratings (below investment grade, like BB or lower), meaning they carry a higher chance of default. The spread compensates for this risk. When the spread is narrow—say, around 2.5% to 3%, as seen recently—it suggests investors are confident, willing to accept less extra yield because they perceive lower default risk or a strong economy. Narrow spreads often align with bullish markets, where cash is flowing, growth is steady, and fear is low. REF: FRED-BAMLH0A0HYM2
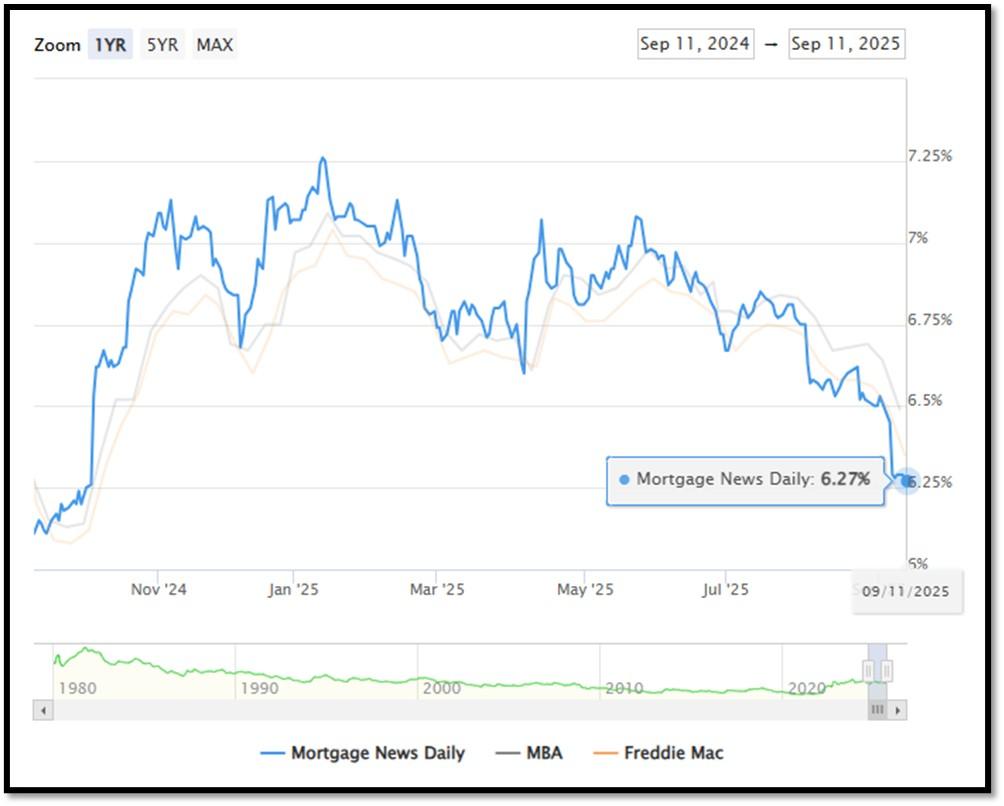
5I. (9/11/2025) Today’s National Average 30-Year Fixed Mortgage Rate is 6.27% (All Time High was 8.03% on 10/19/23). Last week’s data was 6.49%. This rate is the average 30-year fixed mortgage rates from several different surveys including Mortgage News Daily (daily index), Freddie Mac (weekly survey), Mortgage Bankers Association (weekly survey) and FHFA (monthly survey). REF: MortgageNewsDaily, Today’s Average Rate
The recent spike in the 30-year fixed-rate jumbo mortgage to 6.27%, compared to Freddie Mac’s rate at 6.35% and the Mortgage Bankers Association (MBA) rate at 6.49%, highlights key differences in the mortgage market. Jumbo mortgages, which exceed the conforming loan limits set by government agencies like Freddie Mac, typically carry higher interest rates because they are riskier for lenders. These loans are not backed by government entities, which increases the risk for lenders and, consequently, leads to higher rates. In contrast, Freddie Mac and MBA provide averages for conforming loans, which meet federal guidelines and have lower risk due to government backing, keeping their rates lower.
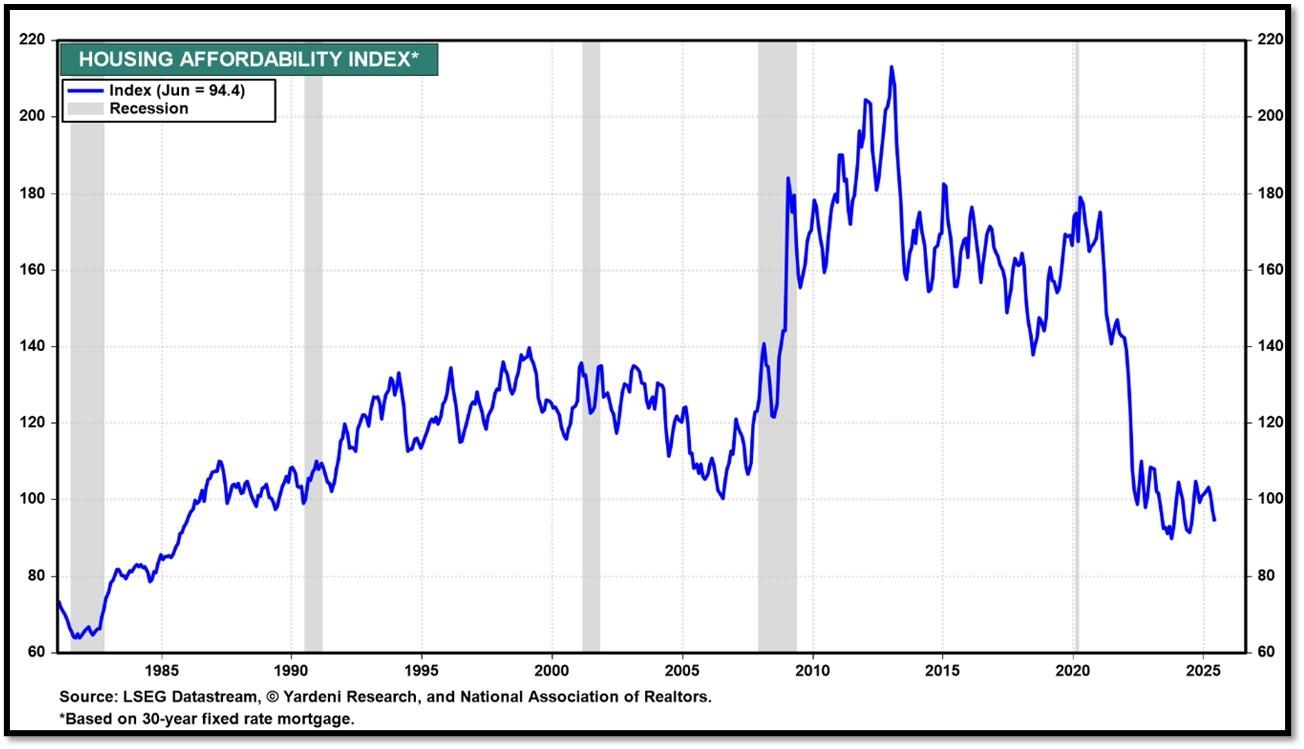
Housing Affordability Index for Jun = 94.4 // May = 97.2 // Apr = 101.0 // Mar = 103.2 // Feb = 102.2 // Jan = 100.7 // Dec = 100.7 // Nov = 99 // Oct = 102.3. Data provided by Yardeni Research. REF: Yardeni
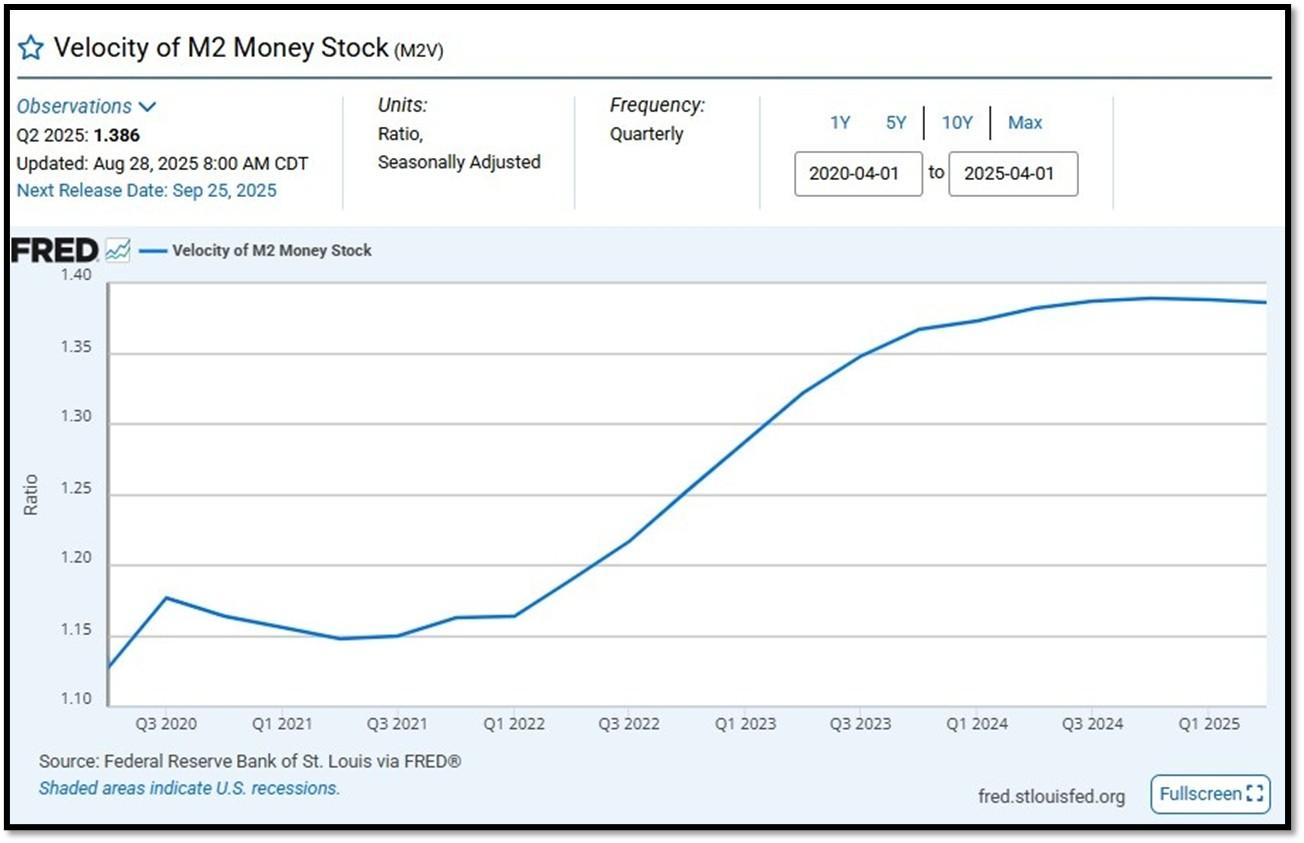
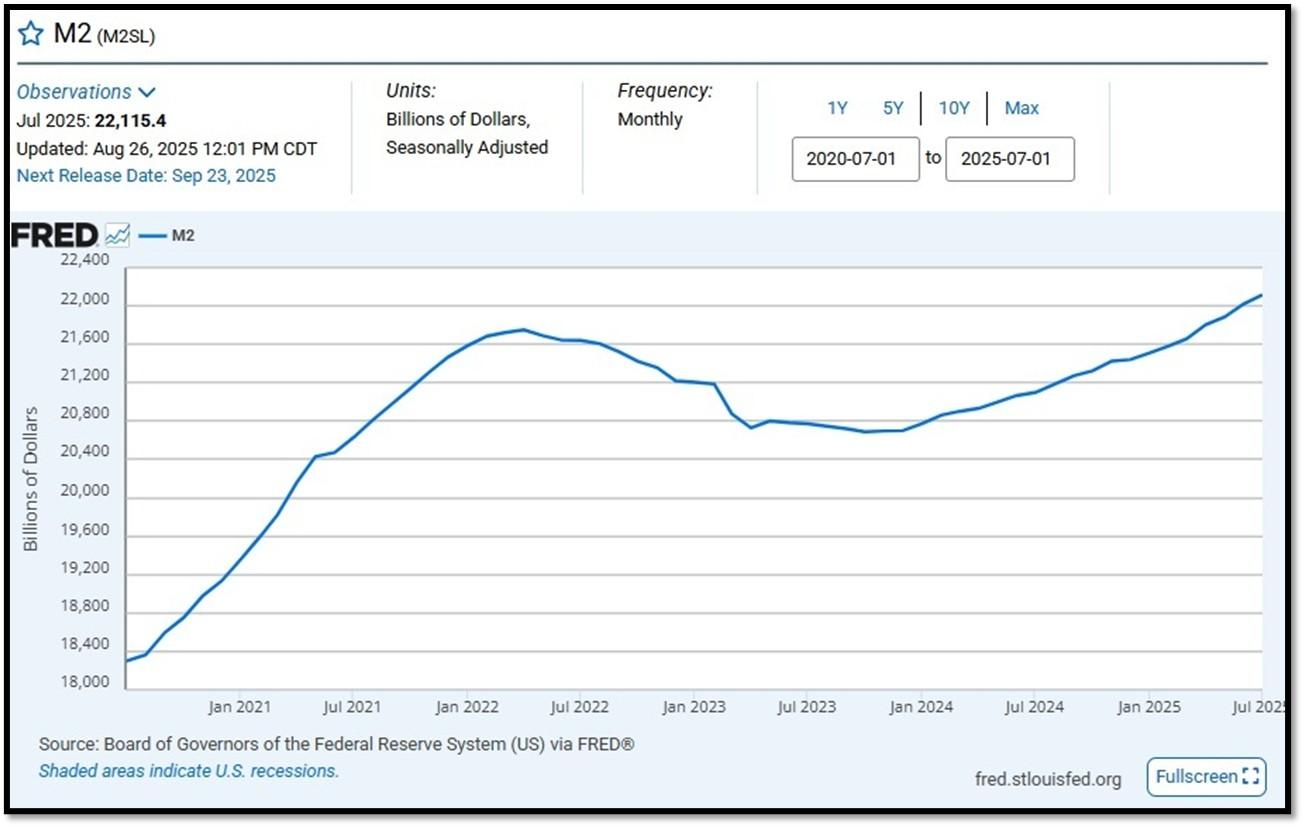
5J. Velocity of M2 Money Stock (M2V) with current read at 1.386 as of (Q2-2025 updated August 28, 2025). Previous quarter’s data was 1.386. The velocity of money is the frequency at which one unit of currency is used to purchase domestically- produced goods and services within a given time period. In other words, it is the number of times one dollar is spent to buy goods and services per unit of time. If the velocity of money is increasing, then more transactions are occurring between individuals in an economy. Current Money Stock (M2) report can be viewed in the reference link. REF: St.LouisFed-M2V
M2 consists of M1 plus (1) small-denomination time deposits (time deposits in amounts of less than $100,000) less IRA and Keogh balances at depository institutions; and (2) balances in retail MMFs less IRA and Keogh balances at MMFs. Seasonally adjusted M2 is constructed by summing savings deposits (before May 2020), small-denomination time deposits, and retail MMFs, each seasonally adjusted separately, and adding this result to seasonally adjusted M1. Board of Governors of the Federal Reserve System (US), M2 [M2SL], retrieved from FRED, Federal Reserve Bank of St. Louis; Updated on July 22, 2025. REF: St.LouisFed-M2
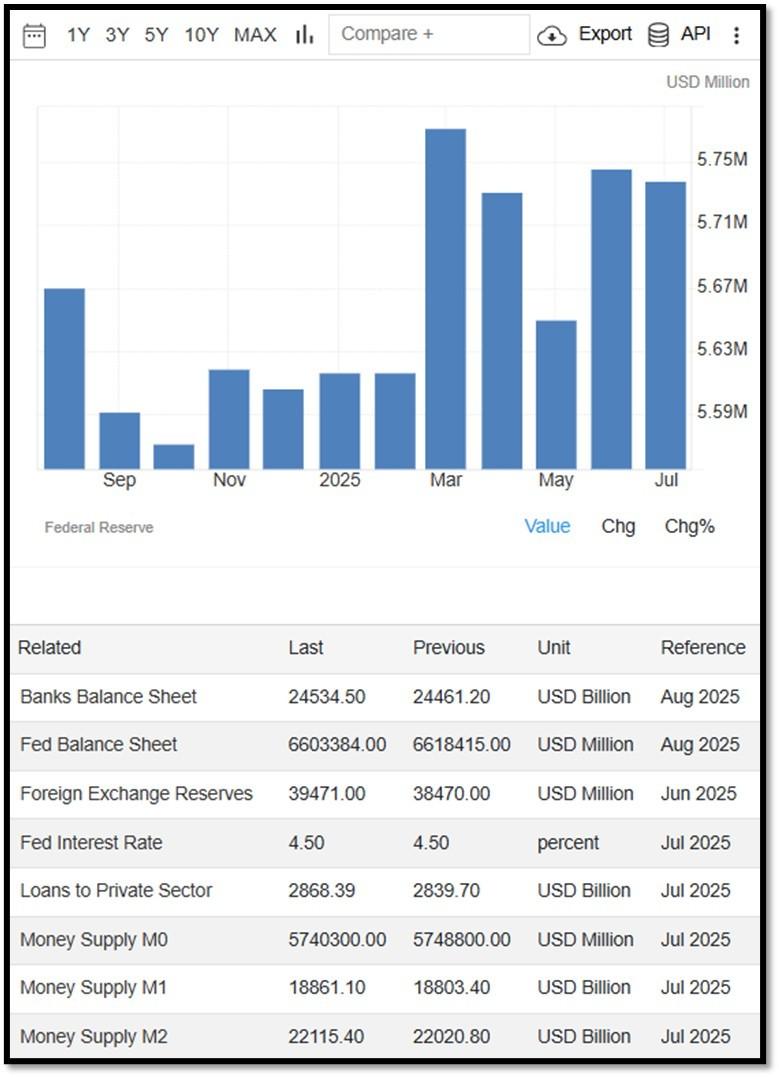
Money Supply M0 in the United States decreased to 5,740,300 USD Million in July from 5,748,800 USD Million in June of 2025. Money Supply M0 in the United States averaged 1,205,962.08 USD Million from 1959 until 2025, reaching an all-time high of 6,413,100.00 USD Million in December of 2021 and a record low of 48,400.00 USD Million in February of 1961. REF: TradingEconomics, M0
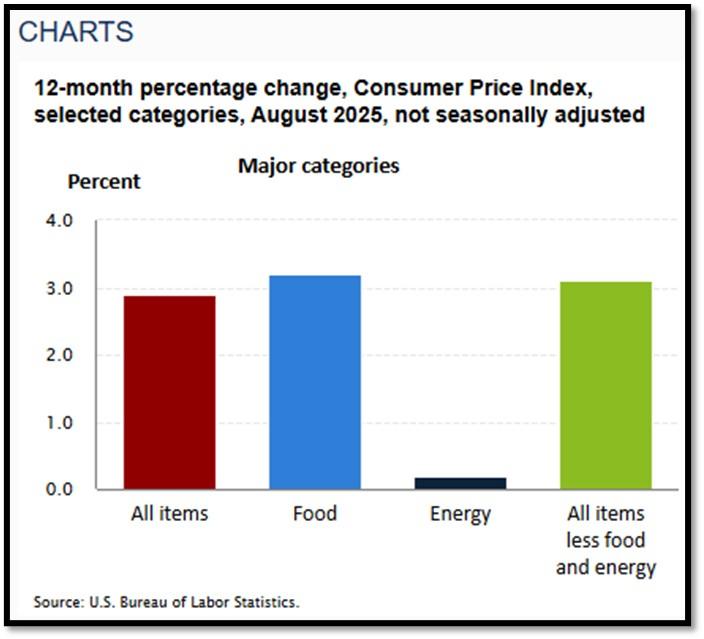
5K. In August, the Consumer Price Index for All Urban Consumers rose 0.4 percent, seasonally adjusted, and rose 2.9 percent over the last 12 months, not seasonally adjusted. The index for all items less food and energy increased 0.3 percent in August (SA); up 3.1 percent over the year (NSA). September 2025 CPI data are scheduled to be released on October 15, 2025, at 8:30AM-ET. REF: BLS, BLS.GOV
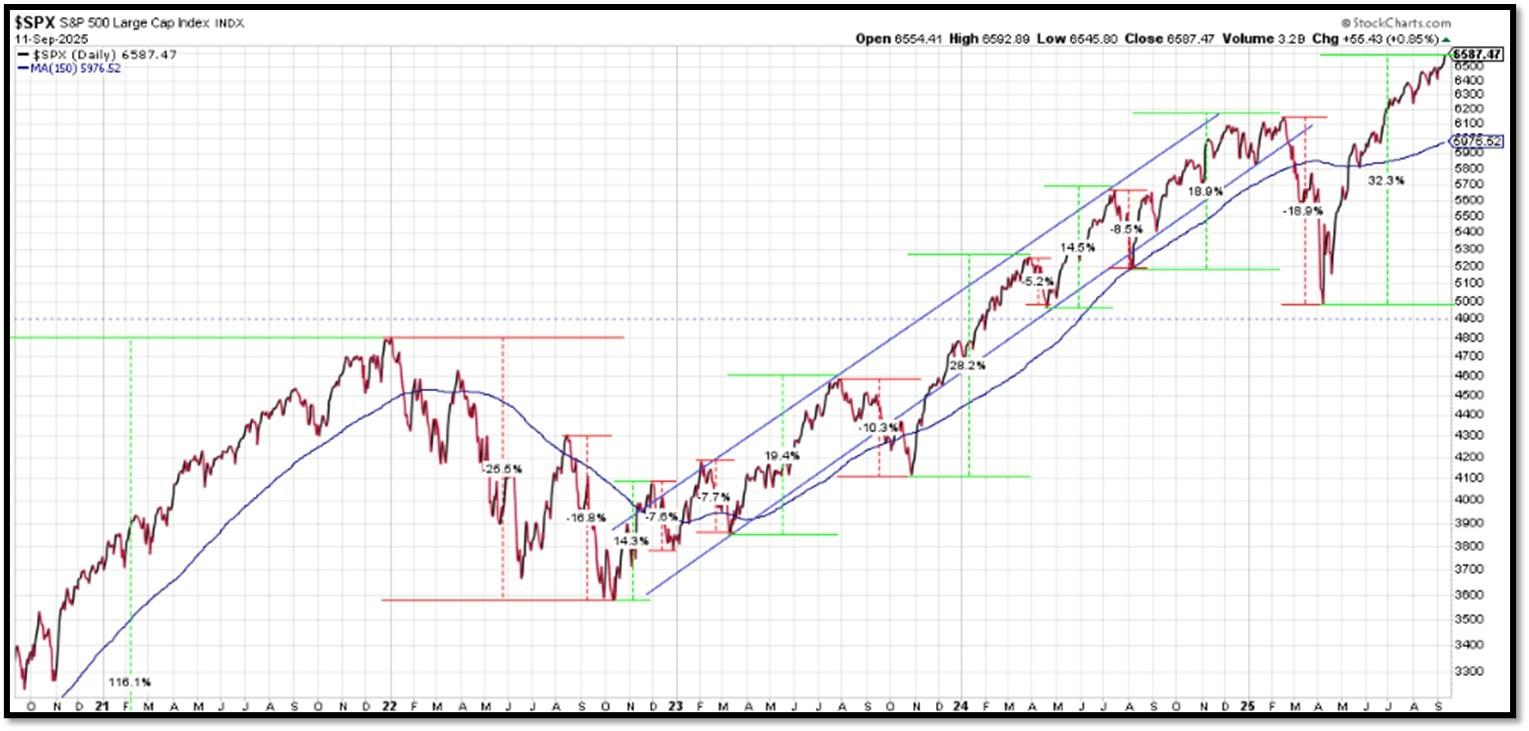
5L. Technical Analysis of the S&P500 Index. Click onto reference links below for images.
- Short-term Chart: Trend Bullish on 9/11/2025 – REF: Short-term S&P500 Chart by Marc Slavin (Click Here to Access Chart)
- Medium-term Chart: Trend Bearish to Bullish on 9/11/2025 – REF: Medium-term S&P500 Chart by Marc Slavin (Click Here to Access Chart)
- Market Timing Indicators – S&P500 Index as of 9/11/2025 – REF: S&P500 Charts (7 of them) by Joanne Klein’s Top 7 (Click Here to Access Updated Charts)
- The S&P500 is hitting all-time-high, rebounding from a V-shaped recovery. REF: Stockcharts
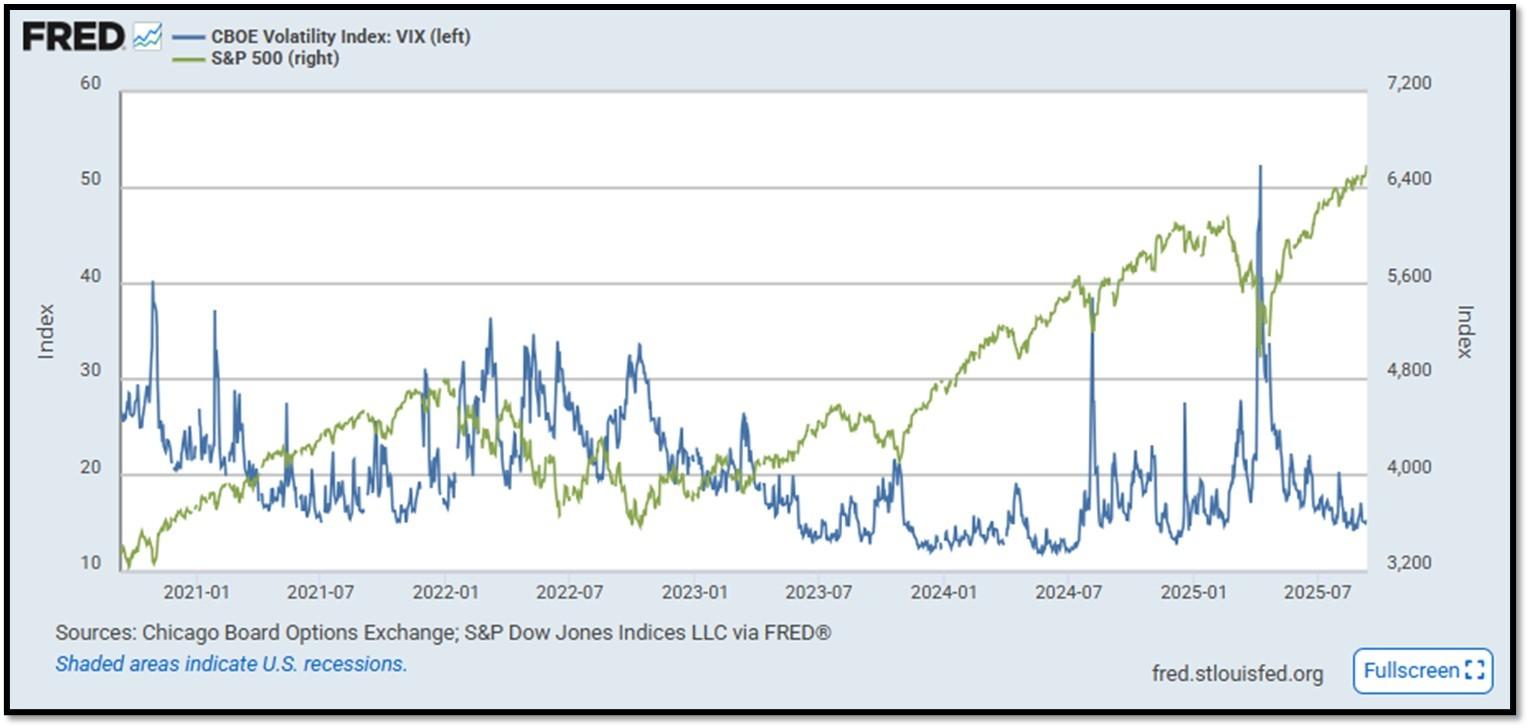
- S&P500 and CBOE Volatility Index (VIX) as of 9/11/2025. REF: FRED, Today’s Print
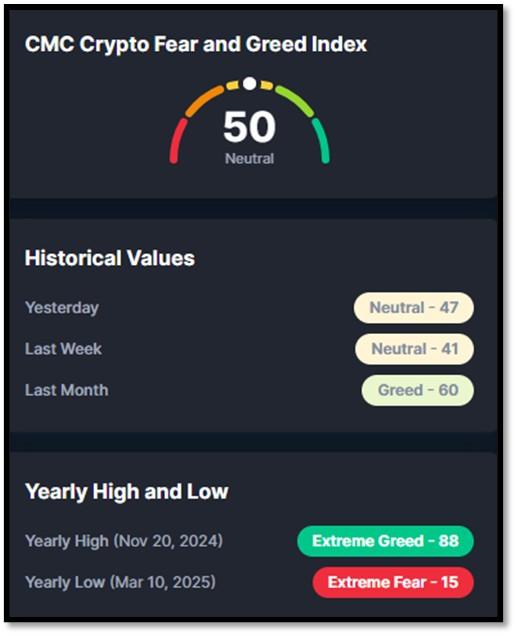
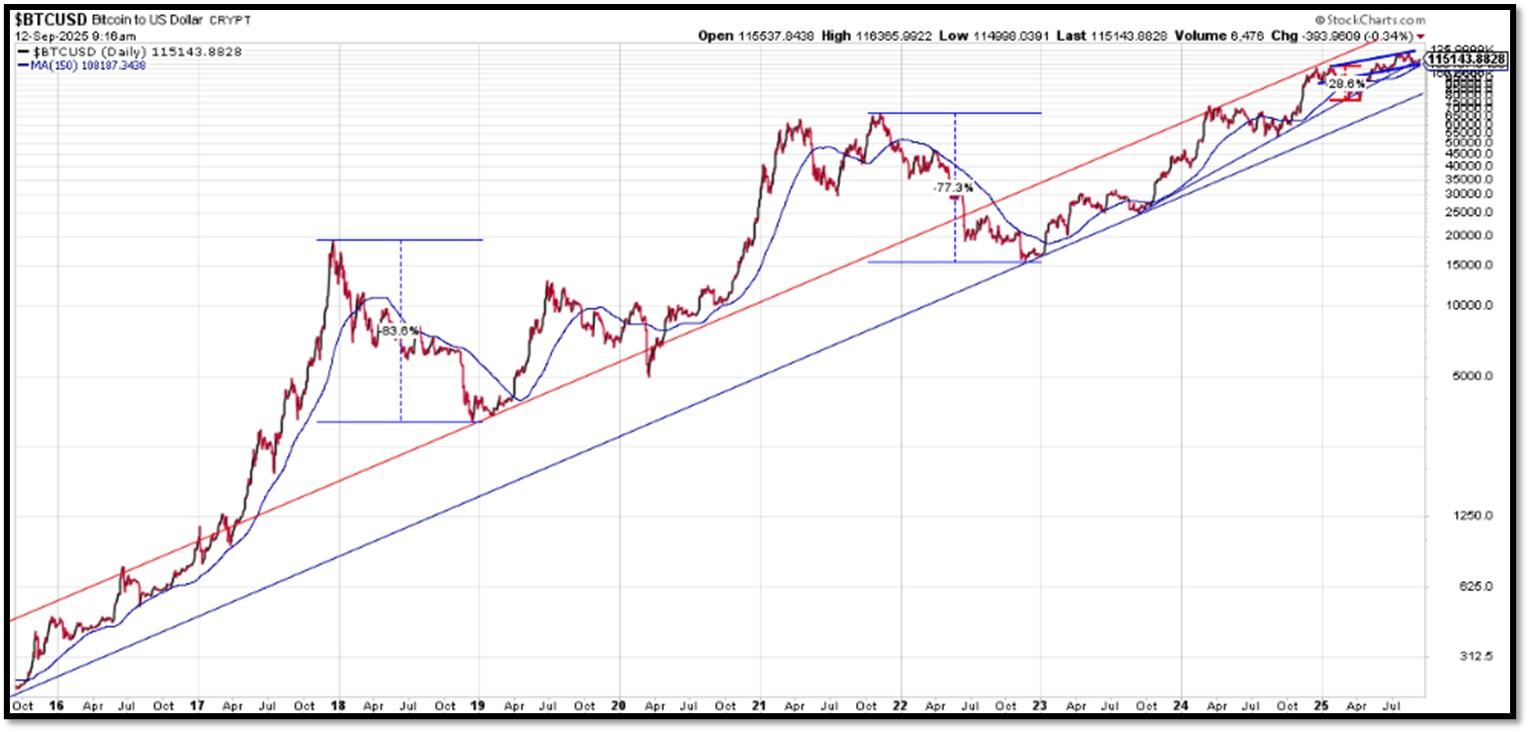
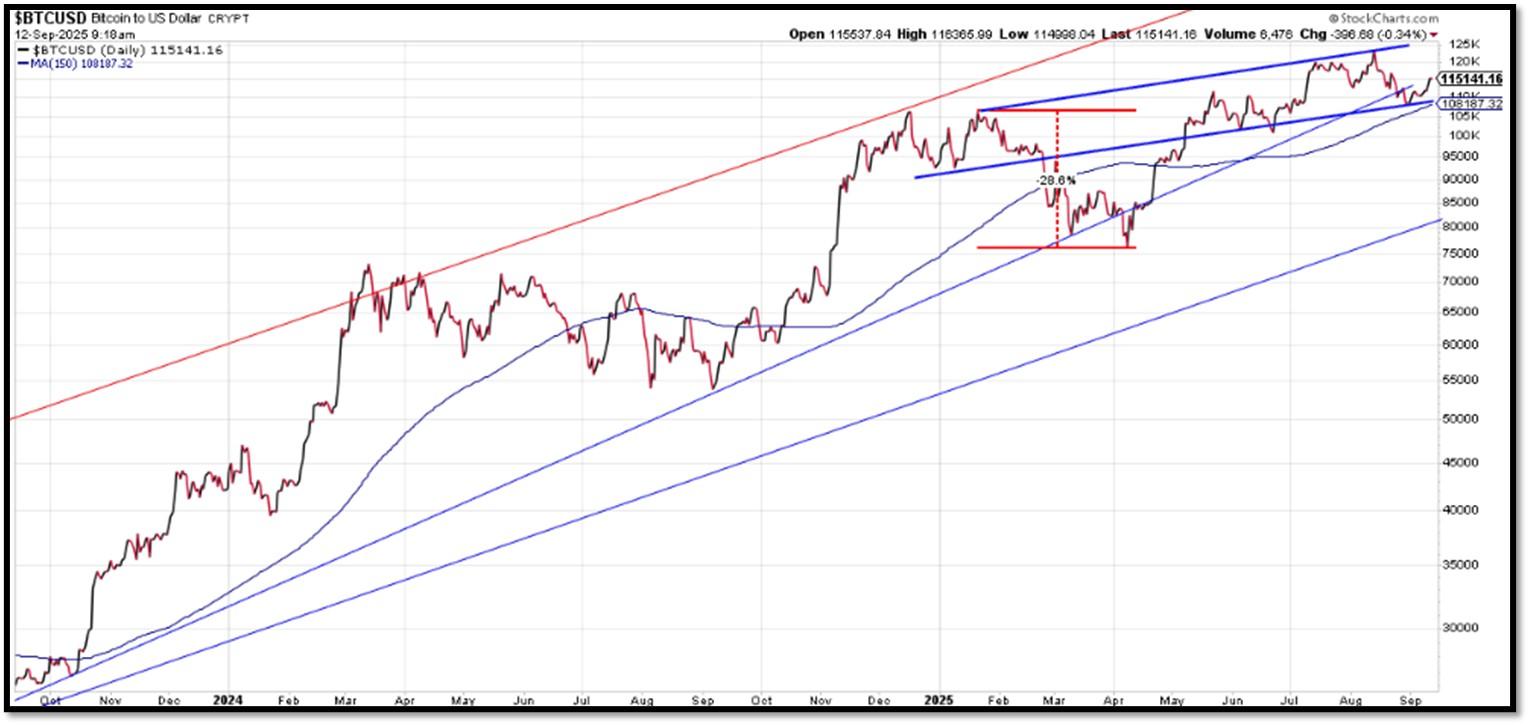
5M. Most recent read on the Crypto Fear & Greed Index with data as of 9/11/2025 is 50 (Neutral). Last week’s data was 41 (Neutral) (1-100). Fear & Greed Index – A Contrarian Data. The crypto market behavior is very emotional. People tend to get greedy when the market is rising which results in FOMO (Fear of missing out). Also, people often sell their coins in irrational reaction of seeing red numbers. With the Crypto Fear and Greed Index, the data try to help save investors from their own emotional overreactions. There are two simple assumptions:
- Extreme fear can be a sign that investors are too worried. That could be a buying opportunity.
- When Investors are getting too greedy, that means the market is due for a correction.
Therefore, the program for this index analyzes the current sentiment of the Bitcoin market and crunch the numbers into a simple meter from 0 to 100. Zero means “Extreme Fear”, while 100 means “Extreme Greed”. REF: Coinmarketcap.com, Today’sReading
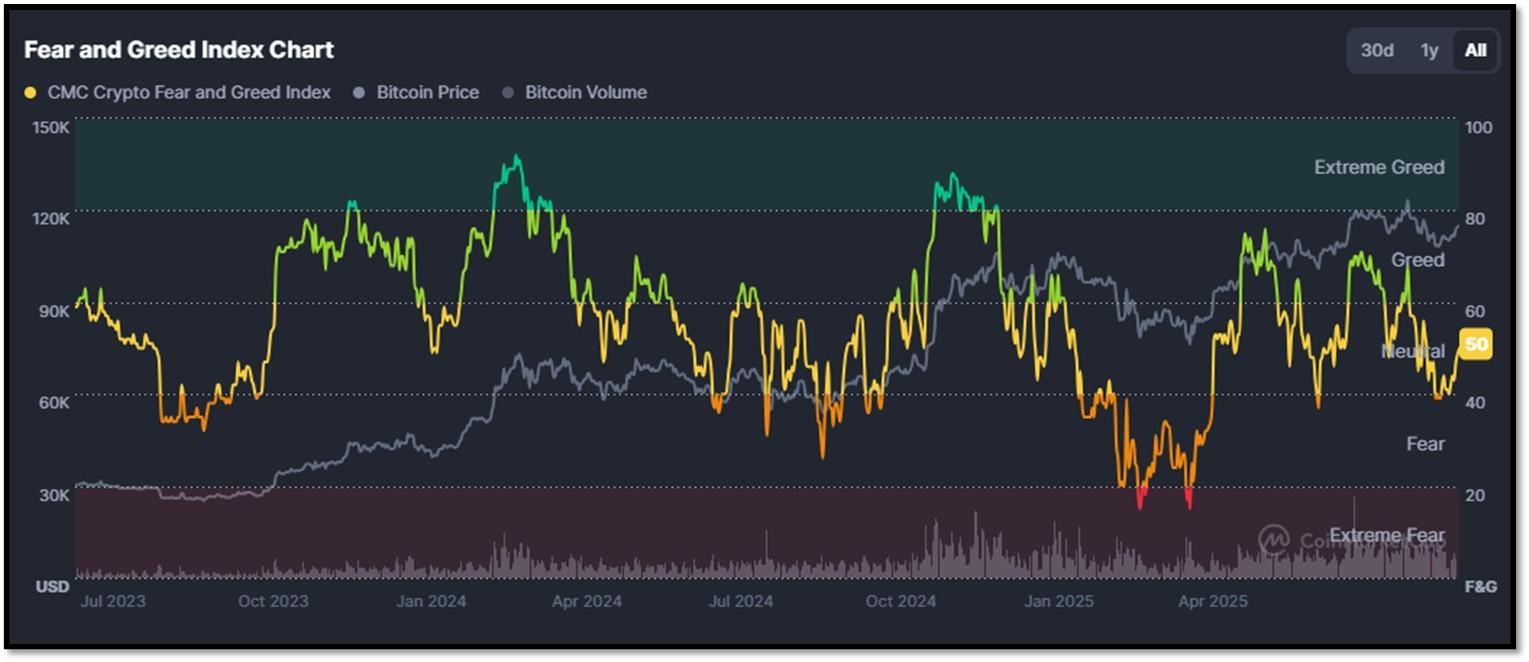
Bitcoin – 10-Year & 2-Year Charts. REF: Stockcharts10Y, Stockcharts2Y
From the desk of our Chief Investment Officer
As an investment professional with over twenty-six years of experience in the financial services industry, Andrew helps clients to protect, grow and transfer wealth during their lifetime with objective, unbiased, customized and efficient strategies.
Education, Professional Licenses Acquired & Affiliations
- Passed the Series 7, 63, 65 and 24 license examinations
- Currently holding Series 65 License
- BA in Economics – Boston University (Boston, MA) 1993
- Certificate in Commodities Trading – New York University (New York, NY) 1991
- Certificate in Financial Planning – New York University (New York, NY) April 2011
With extensive experience in the Financial Services Industry, Andrew Tang and Turner Financial Group provides disciplined wealth management with an intelligent caring approach to each and every client that compliments the Dedicated Financial offering.


Len writes much of his own content, and also shares helpful content from other trusted providers like Turner Financial Group (TFG).
The material contained herein is intended as a general market commentary, solely for informational purposes and is not intended to make an offer or solicitation for the sale or purchase of any securities. Such views are subject to change at any time without notice due to changes in market or economic conditions and may not necessarily come to pass. This information is not intended as a specific offer of investment services by Dedicated Financial and Turner Financial Group, Inc.
Dedicated Financial and Turner Financial Group, Inc., do not provide tax, legal or accounting advice. You should consult your own tax, legal and accounting advisors before engaging in any transaction.
Any hyperlinks in this document that connect to Web Sites maintained by third parties are provided for convenience only. Turner Financial Group, Inc. has not verified the accuracy of any information contained within the links and the provision of such links does not constitute a recommendation or endorsement of the company or the content by Dedicated Financial or Turner Financial Group, Inc. The prices/quotes/statistics referenced herein have been obtained from sources verified to be reliable for their accuracy or completeness and may be subject to change.
Past performance is no guarantee of future returns. Investing involves risk and possible loss of principal capital. The views and strategies described herein may not be suitable for all investors. To the extent referenced herein, real estate, hedge funds, and other private investments can present significant risks, including loss of the original amount invested. All indexes are unmanaged, and an individual cannot invest directly in an index. Index returns do not include fees or expenses.
Turner Financial Group, Inc. is an Investment Adviser registered with the United States Securities and Exchange Commission however, such registration does not imply a certain level of skill or training and no inference to the contrary should be made. Additional information about Turner Financial Group, Inc. is also available at www.adviserinfo.sec.gov. Advisory services are only offered to clients or prospective clients where Turner Financial Group, Inc. and its representatives are properly licensed or exempt from licensure. No advice may be rendered by Turner Financial Group, Inc. unless a client service agreement is in place.


