- 1. Some of the companies that have recently announced layoffs include Amperity, Drata, F5, Fly.io, FreightWaves, IBM, Luminar, Moov, Notable Labs, Olo, Reverb, and Udemy.
- 2. The International Monetary Fund’s (IMF) recent blog titled “Sustained Economic Growth Hinges on Productivity Gains as Populations Age” discusses the critical role of productivity growth in sustaining economic prosperity, especially as populations age.
- With the current macro-economic backdrop, below are areas we currently favor:
- 3. Ray Dalio’s analysis, featured in Visual Capitalist, shows that the U.S. has a significant debt burden compared to other major economies.
- 4. World Watch: China’s stimulus pack positively affects economy, Dock workers walk out (US, east and gulf coast), Eurozone inflation rate slowing, and a snapshot of the current global state of the economy.
- 5. Quant & Technical Corner
1. Some of the companies that have recently announced layoffs include Amperity, Drata, F5, Fly.io, FreightWaves, IBM, Luminar, Moov, Notable Labs, Olo, Reverb, and Udemy.
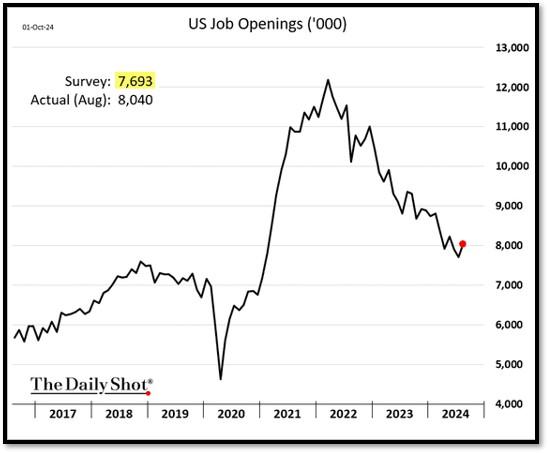
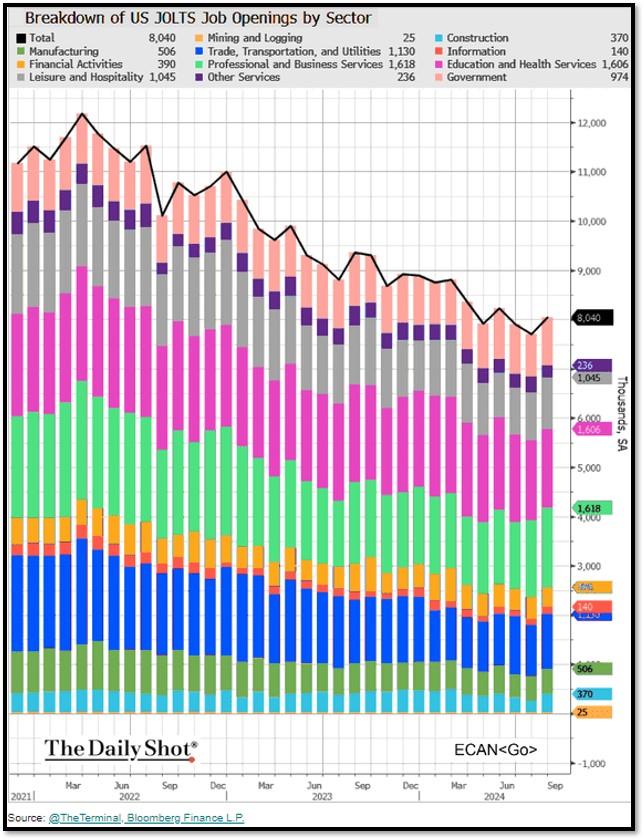
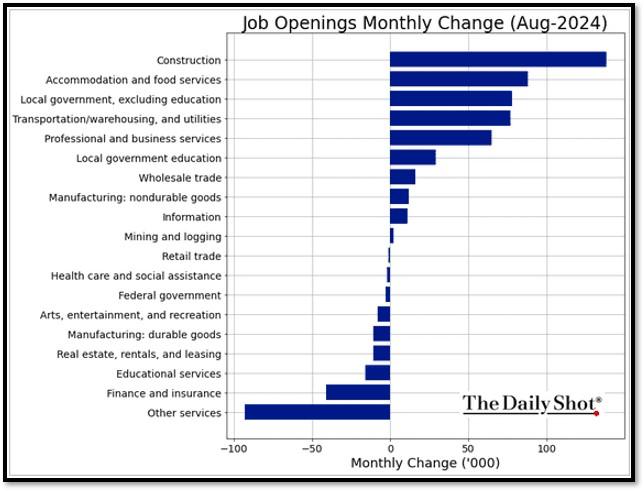
In 2024, at least 86,913 workers at U.S.-based tech companies have been laid off so far. These layoffs are part of a continuing trend from the tech sector, which has seen job cuts rise significantly since 2022 due to various factors, including over hiring during the pandemic and changing economic conditions. Despite the layoffs, U.S. job openings recently climbed to their highest level in three months, surpassing forecasts. This increase indicates strong demand for labor, suggesting that businesses are still looking to hire despite economic uncertainties. Higher job openings can signal economic strength, as companies may be expanding and needing more employees. However, it could also indicate a potential mismatch between job vacancies and the skills or availability of workers, which can put pressure on wages and influence inflation. REF: Dailyshot
Job openings increased again in August, topping expectations…
2. The International Monetary Fund’s (IMF) recent blog titled “Sustained Economic Growth Hinges on Productivity Gains as Populations Age” discusses the critical role of productivity growth in sustaining economic prosperity, especially as populations age.
The piece highlights that productivity, driven by factors like innovation and technology, has been slowing down for over 20 years, accounting for more than half of the deceleration in global economic growth since the financial crisis. To counter this trend, government policies should encourage resource reallocation, support small businesses and startups, promote competition, and make new technologies like AI accessible to all sectors of the economy. Innovation solves problems… REF: IMF, IMF’s Website

With the current macro-economic backdrop, below are areas we currently favor:
- Fixed Income – Short-term (Low-Beta)
- Fixed Income – Adding Duration, preferred stocks & High Yield as Opportunistic Allocation (Low-Beta)
- Businesses that contribute to and benefit from AI & Automation (Market-Risk)
- Mid Cap Stocks & Small Cap Stocks
- Asian Stocks & European Stocks (Market-Risk)
- Industrials (Market-Risk)
- Clean Energy / Solar / Utilities (Market-Risk)
- Healthcare & Biotechnology (Market-Risk)
- Gold (Market-Risk)

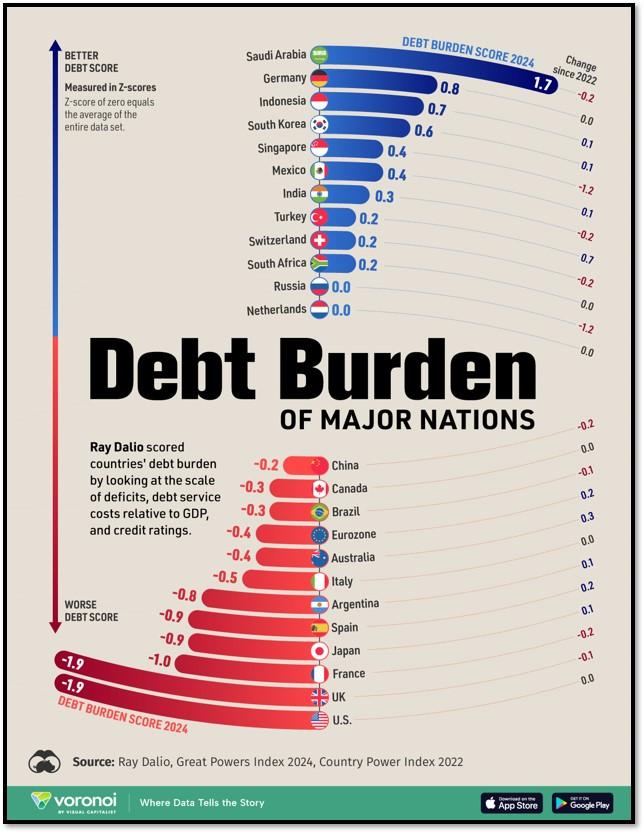
3. Ray Dalio’s analysis, featured in Visual Capitalist, shows that the U.S. has a significant debt burden compared to other major economies.
This high level of debt is a concern because it can limit economic growth and reduce the country’s financial stability. Dalio’s report suggests that increasing debt levels impact the U.S.’s position of power on the global stage, especially when compared to emerging economies like China. The analysis also explores how these debt dynamics shape economic policy and future growth prospects. This graphic shows the debt burden score of major world economies, based on analysis from Ray Dalio’s Great Powers Index 2024. Click onto the reference link to access Ray Dalio’s report. REF: GreatPowersIndex2024, ViusalCapitalist
4. World Watch: China’s stimulus pack positively affects economy, Dock workers walk out (US, east and gulf coast), Eurozone inflation rate slowing, and a snapshot of the current global state of the economy.
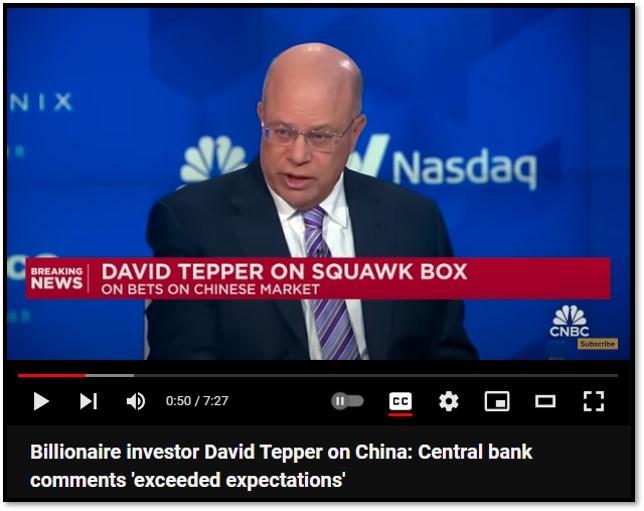
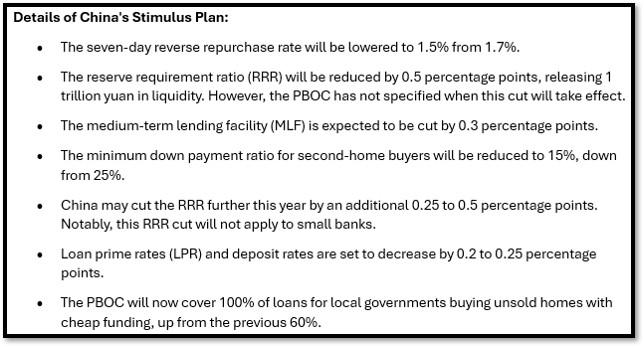
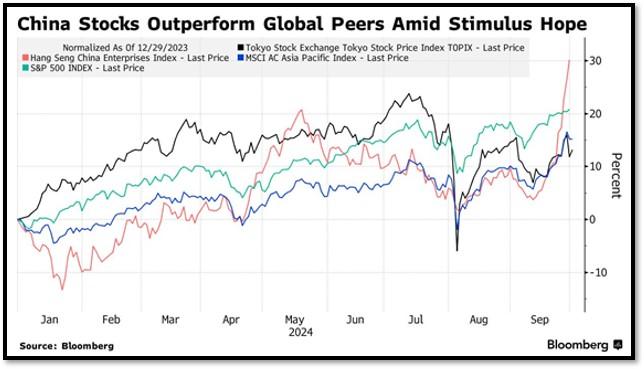
4A. China’s stock market is reacting positively to one of the most aggressive monetary stimulus packages aimed at reviving its economy. Markets have embraced the package, with China’s benchmark CSI 300 Index experiencing a significant spike. The benchmark CSI 300 China index now shows a year-to-date return of 17.1% as of 10/3/24, reversing three years of prior losses. Details of the stimulus package are shown in the image below.
A key highlight of the plan is a new initiative that allows public companies to access loans for stock buybacks. The People’s Bank of China (PBoC) has created an RMB 800 billion (USD 114 billion) fund to support the stock market by lending to asset managers, insurers, brokers, and listed companies specifically for stock buybacks. This move is part of a broader effort to stabilize capital markets and boost investor confidence. Depending on the program’s success, the fund size could potentially be doubled or tripled in the future. Click onto picture below to access video. REF: Bloomberg, CNBC
4B. The dockworkers’ walkout on October 1, 2024, affected major ports along the U.S. East Coast and Gulf Coast. The ILA, which represents 45,000 port workers, launched its strike on Tuesday after negotiations collapsed with the United States Maritime Alliance (USMX) for a new six-year contract. The union is seeking a $5-per-hour wage hike each year over six years. The parties disputed over wages, job security, working conditions, and concerns about automation in ports. Dockworkers walked out of every major port on the US East and Gulf coasts for the first time since 1977 after failing to reach a wage deal. In previous cases, dockworkers have struck when contract negotiations between their union (often the International Longshoremen’s Association) and port operators or shipping companies break down. If the strike continues for an extended period, it could create ripple effects throughout the economy and drive-up prices. As businesses redirect their shipments to West Coast ports, the heightened demand may increase shipping costs and lead to delivery delay. Click onto picture below to access video. REF: WSJ, BARRON’S

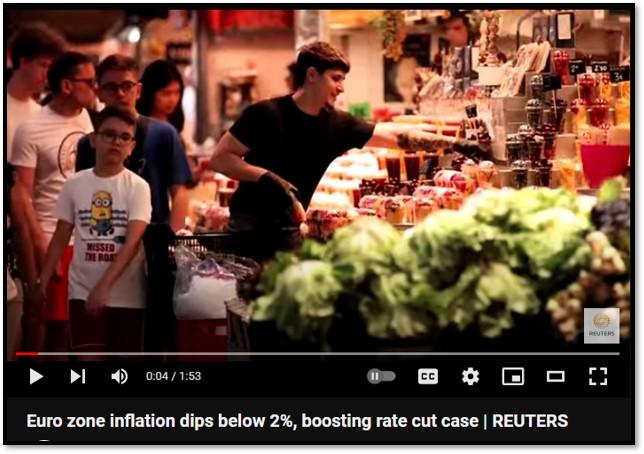
4C. The Eurozone inflation rate slowing to 1.8% has increased the likelihood that the European Central Bank (ECB) will implement interest rate cuts at its upcoming meeting in October. This decline in inflation suggests that price pressures within the Eurozone are easing, which aligns more closely with the ECB’s target of maintaining inflation near 2%.
With inflation decreasing, the urgency to keep interest rates high diminishes. Lower interest rates are typically used to stimulate economic growth by reducing borrowing costs for consumers and businesses. Investors are now betting that the ECB will act sooner rather than later to support the economy, especially since the slowdown in inflation provides more room for policy easing without the risk of overheating the economy. Click onto picture below to access video. REF: NYT, Reuters
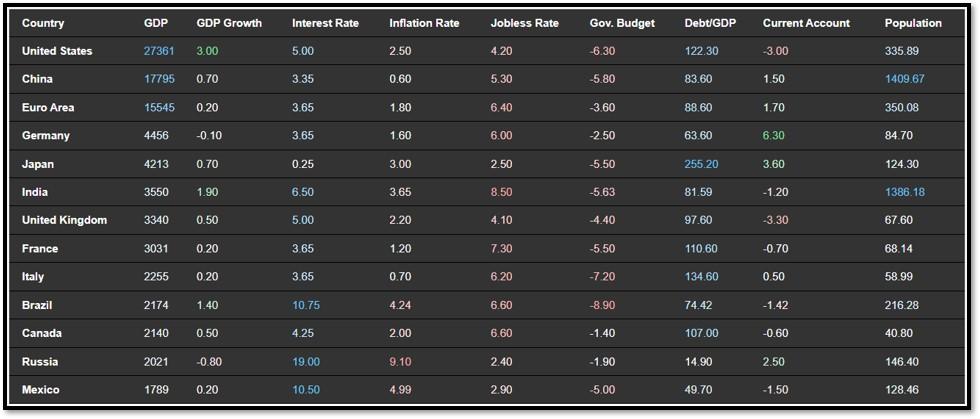
4D. Below is an updated snapshot of the current global state of economy according to TradingEconomics as of 10/2/2024. REF: TradingEconomics
- The annual inflation rate in Germany fell to 1.6% in September 2024, below forecasts of 1.7%, down from 1.9% in August, preliminary estimates showed.
- The British economy expanded 0.5% on quarter in Q2 2024, slightly below 0.6% in the first estimate and 0.7% in Q1.
- Annual inflation rate in France fell to 1.2% in September 2024, the lowest level since July 2021, compared to 1.8% in August and forecasts of 1.6%, preliminary estimates showed.
- Annual inflation rate in the Eurozone fell to 1.8% in September 2024, the lowest since April 2021, compared to 2.2% in August and forecasts of 1.9%, preliminary estimates showed.
5. Quant & Technical Corner
Below is a selection of quantitative & technical data we monitor on a regular basis to help gauge the overall financial market conditions and the investment environment.
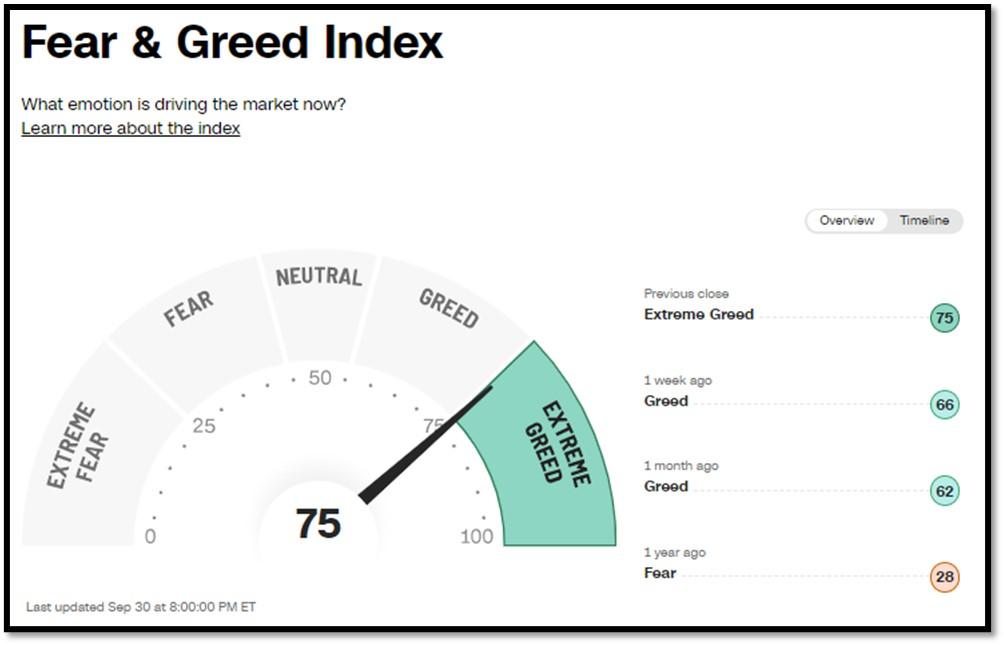
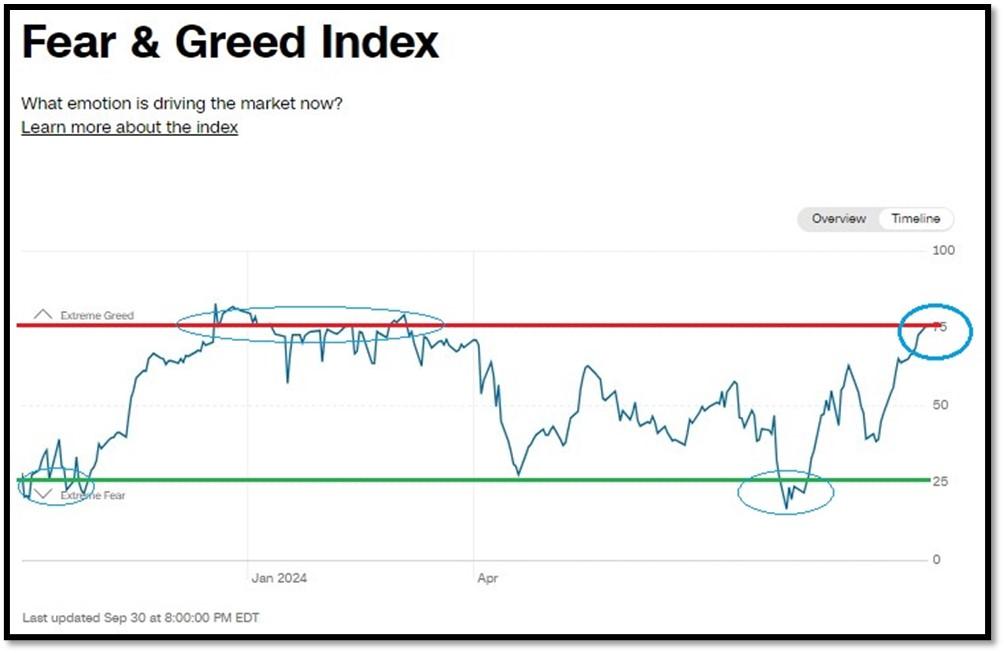
5A. Most recent read on the Fear & Greed Index with data as of 9/30/2024 – 8:00PM-ET is 75 (Extreme Greed). Last week’s data was 66 (Greed) (1-100). CNNMoney’s Fear & Greed index looks at 7 indicators (Stock Price Momentum, Stock Price Strength, Stock Price Breadth, Put and Call Options, Junk Bond Demand, Market Volatility, and Safe Haven Demand). Keep in mind this is a contrarian indicator! REF: Fear&Greed via CNNMoney
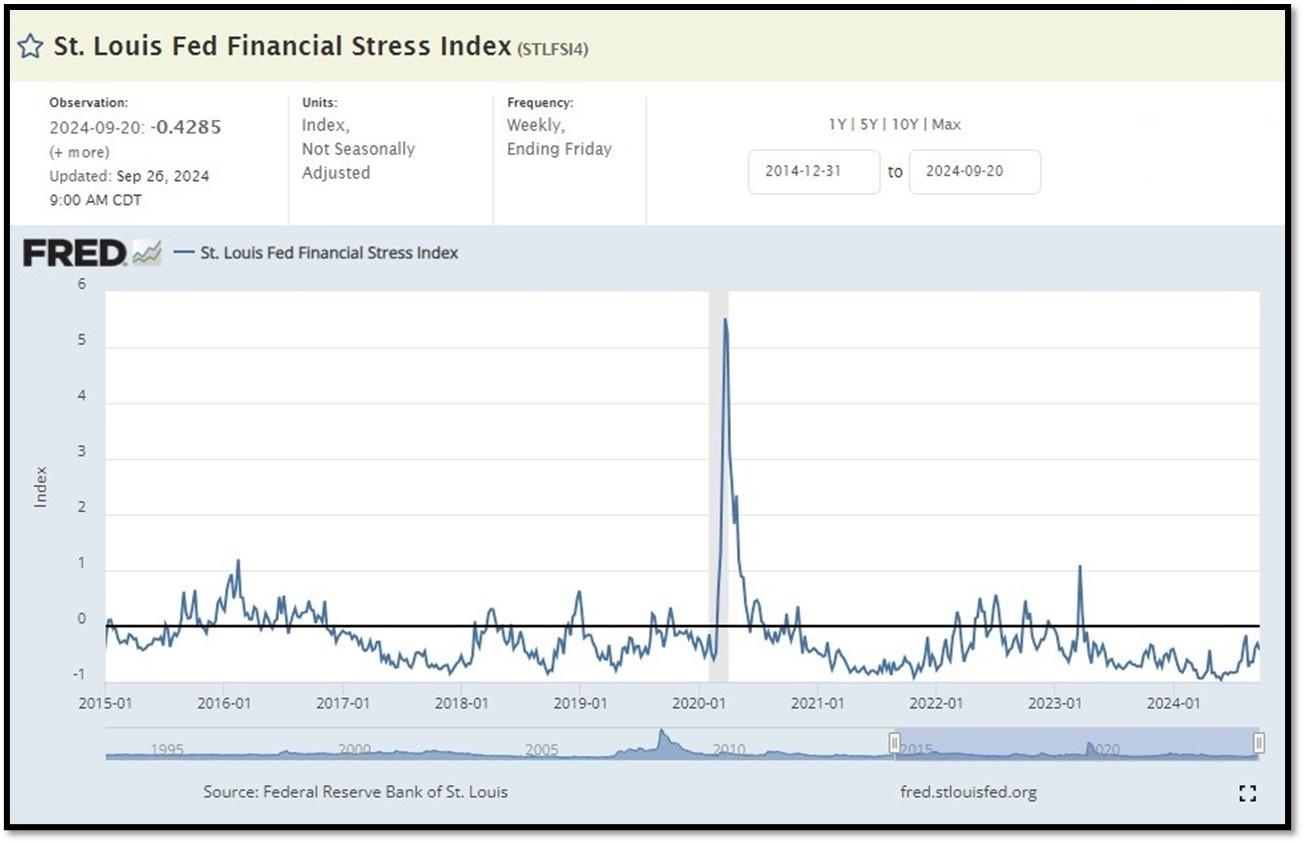
5B. St. Louis Fed Financial Stress Index’s (STLFSI4) most recent read is at –0.4285 as of September 26, 2024. A big spike up from previous readings reflecting the recent turmoil in the banking sector. Previous week’s data was -0.2977. This weekly index is not seasonally adjusted. The STLFSI4 measures the degree of financial stress in the markets and is constructed from 18 weekly data series: seven interest rate series, six yield spreads and five other indicators. Each of these variables captures some aspect of financial stress. Accordingly, as the level of financial stress in the economy changes, the data series are likely to move together. REF: St. Louis Fed
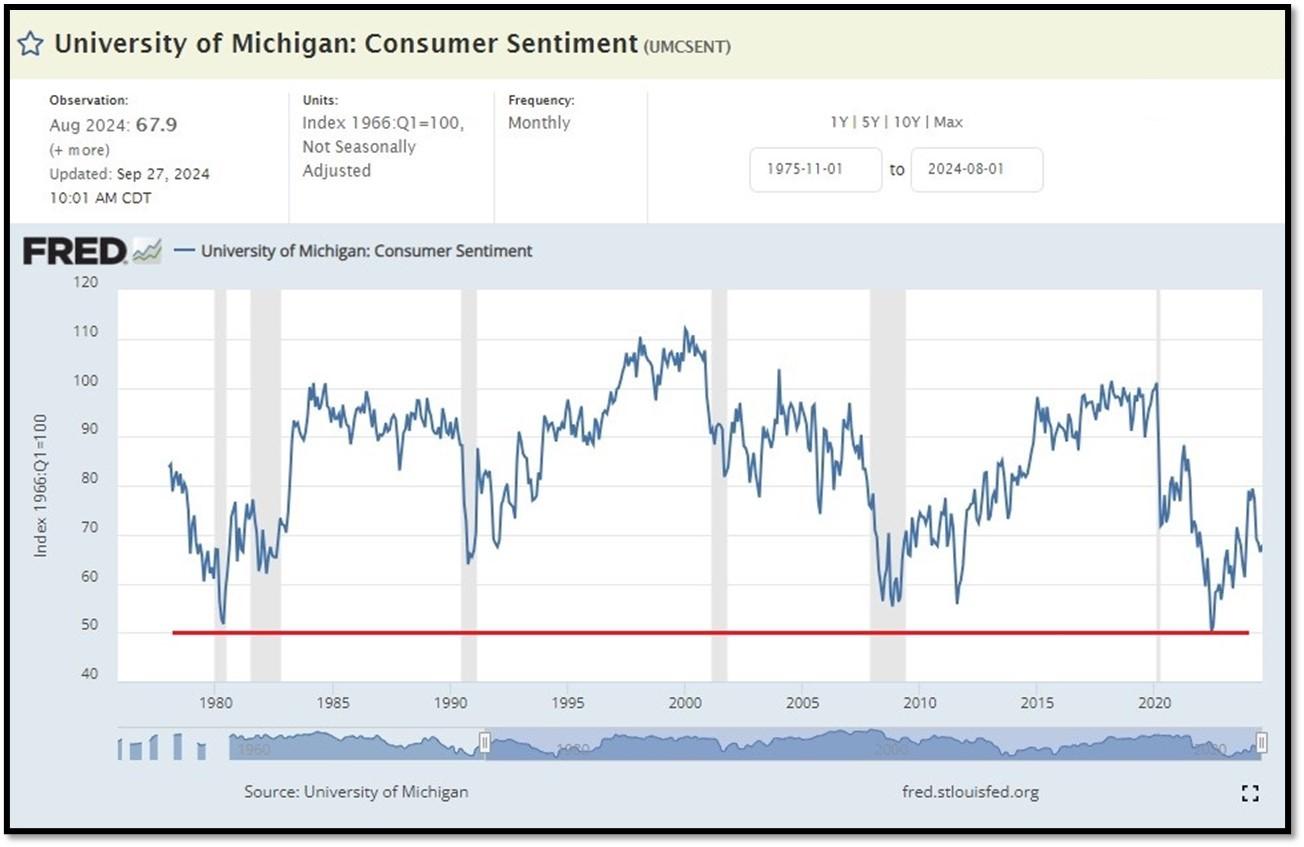
5C. University of Michigan, University of Michigan: Consumer Sentiment for June [UMCSENT] at 67.9 (last month’s data at 66.4), retrieved from FRED, Federal Reserve Bank of St. Louis, September 27, 2024. Back in June 2022, Consumer Sentiment hit a low point going back to April 1980. REF: UofM
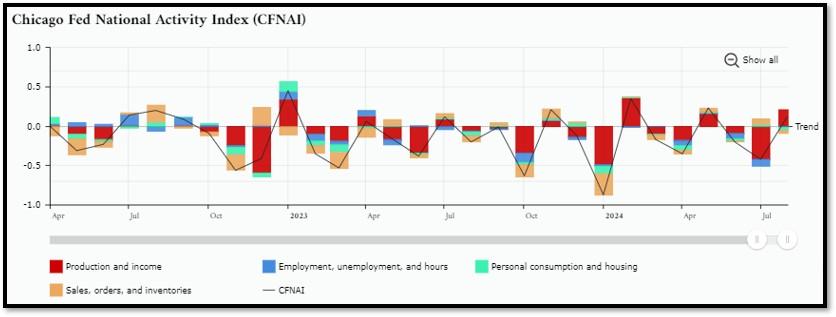
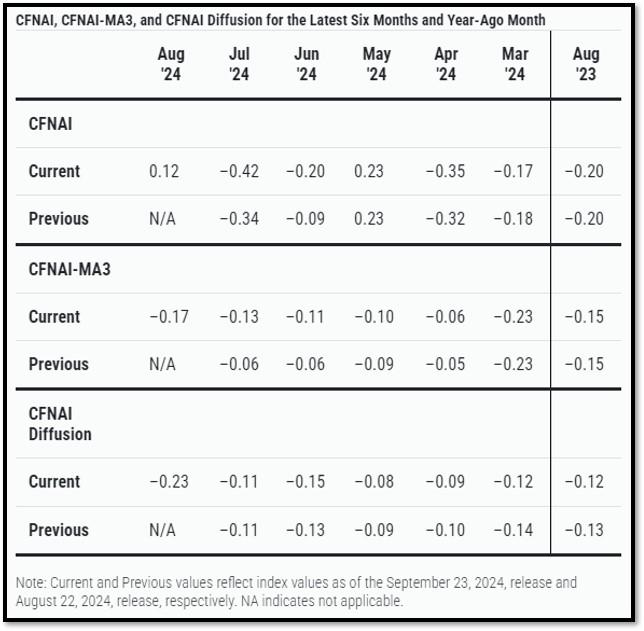
5D. The Chicago Fed National Activity Index (CFNAI) increased to +0.12 in August from –0.42 in July. Two of the four broad categories of indicators used to construct the index increased from July, and one category made a positive contribution in August. The index’s three-month moving average, CFNAI-MA3, decreased to –0.17 in August from –0.13 in July. REF: ChicagoFed, August’s Report
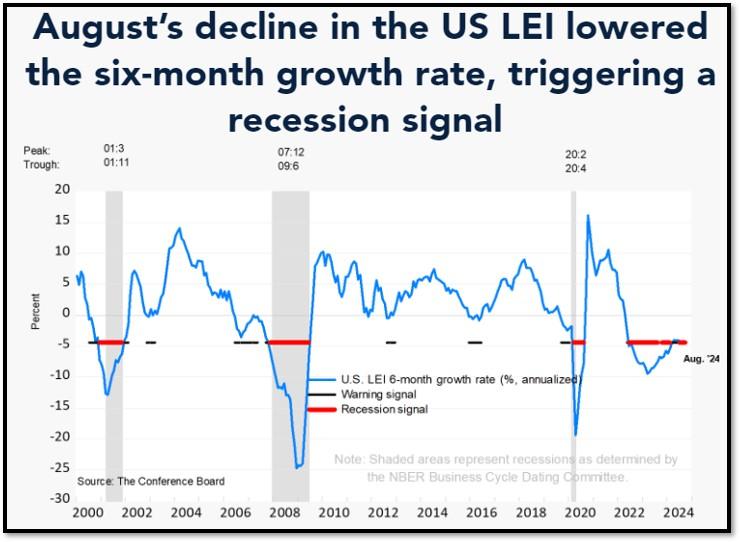
5E. (09/19/2024) The Conference Board Leading Economic Index (LEI) for the U.S. declined by 0.2% in August 2024 to 100.2 (2016=100), following an unrevised 0.6% decline in July. Over the six-month period between February and August 2024, the LEI fell by 2.3%, a smaller rate of decline than the 2.7% drop over the six-month period between August 2023 and February 2024. The composite economic indexes are the key elements in an analytic system designed to signal peaks and troughs in the business cycle. The indexes are constructed to summarize and reveal common turning points in the economy in a clearer and more convincing manner than any individual component. The CEI is highly correlated with real GDP. The LEI is a predictive variable that anticipates (or “leads”) turning points in the business cycle by around 7 months. Shaded areas denote recession periods or economic contractions. The dates above the shaded areas show the chronology of peaks and troughs in the business cycle. The ten components of The Conference Board Leading Economic Index® for the U.S. include: Average weekly hours in manufacturing; Average weekly initial claims for unemployment insurance; Manufacturers’ new orders for consumer goods and materials; ISM® Index of New Orders; Manufacturers’ new orders for nondefense capital goods excluding aircraft orders; Building permits for new private housing units; S&P 500® Index of Stock Prices; Leading Credit Index™; Interest rate spread (10-year Treasury bonds less federal funds rate); Average consumer expectations for business conditions. REF: ConferenceBoard, LEI Report for August (Released on 9/27/2024)
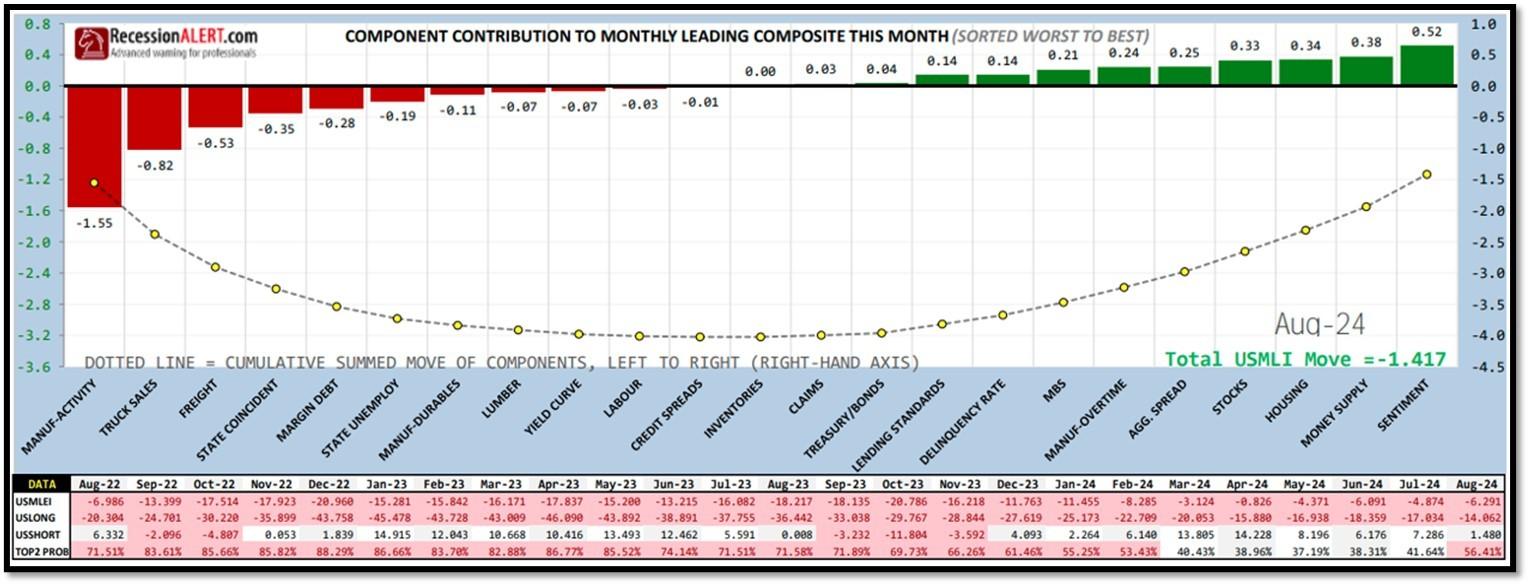
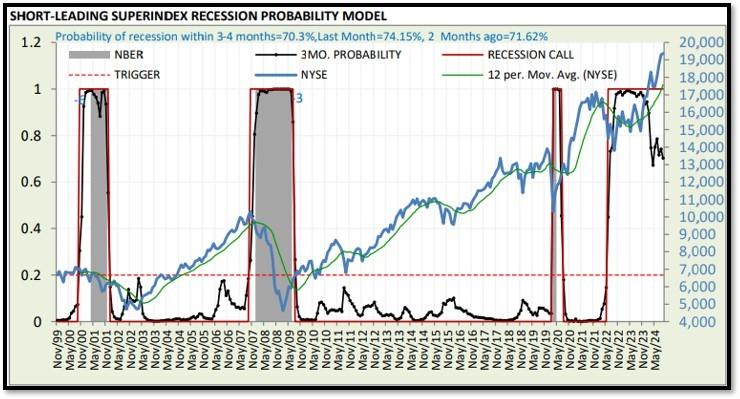
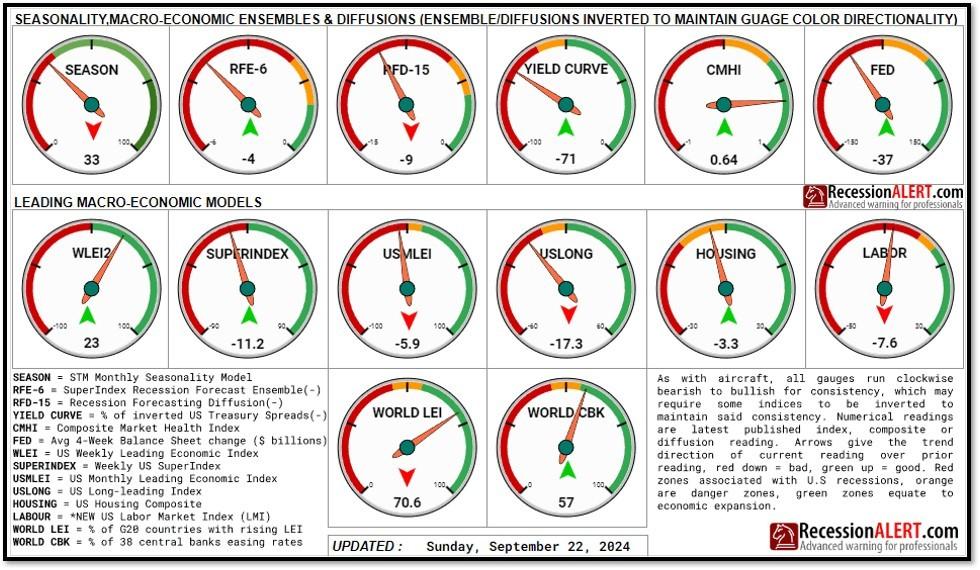
5F. Probability of U.S. falling into Recession within 3 to 4 months is currently at 70.3% (with data as of 09/22/2024 – Next Report 10/06/2024) according to RecessionAlert Research. Last release’s data was at 82.23%. This report is updated every two weeks. REF: RecessionAlertResearch, Gauges
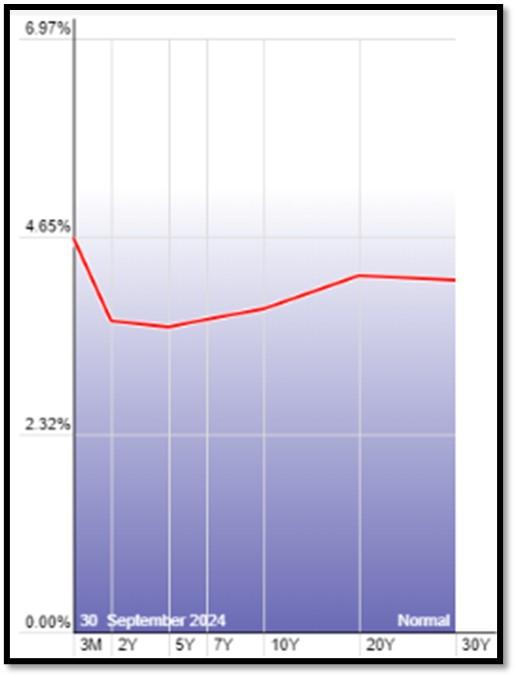
5G. Yield Curve as of 9/30/2024 is showing Inversion to Flattening. Spread on the 10-yr Treasury Yield (3.78%) minus yield on the 2-yr Treasury Yield (3.64%) is currently at 14 bps. REF: Stockcharts The yield curve—specifically, the spread between the interest rates on the ten-year Treasury note and the three-month Treasury bill—is a valuable forecasting tool. It is simple to use and significantly outperforms other financial and macroeconomic indicators in predicting recessions two to six quarters ahead. REF: NYFED
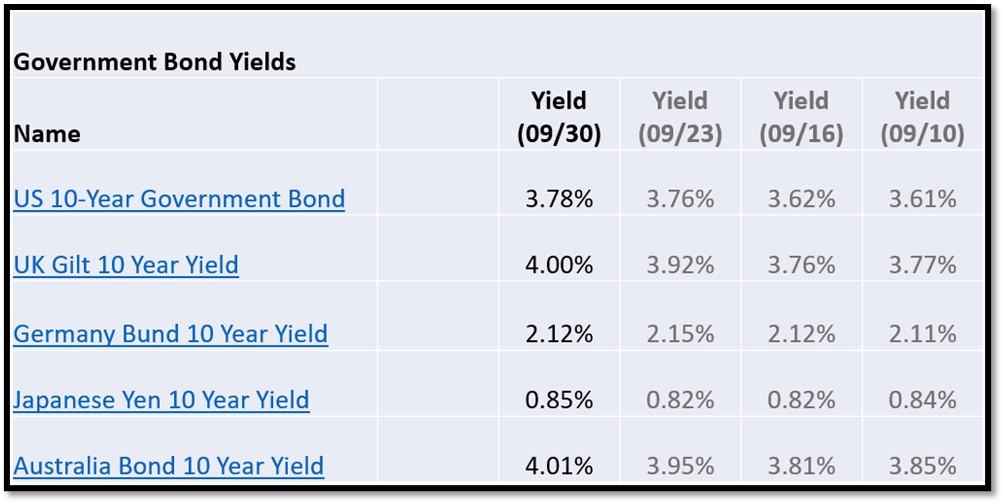
5H. Recent Yields in 10-Year Government Bonds. REF: Source is from Bloomberg.com, dated 9/30/2024, rates shown below are as of 9/30/2024, subject to change.
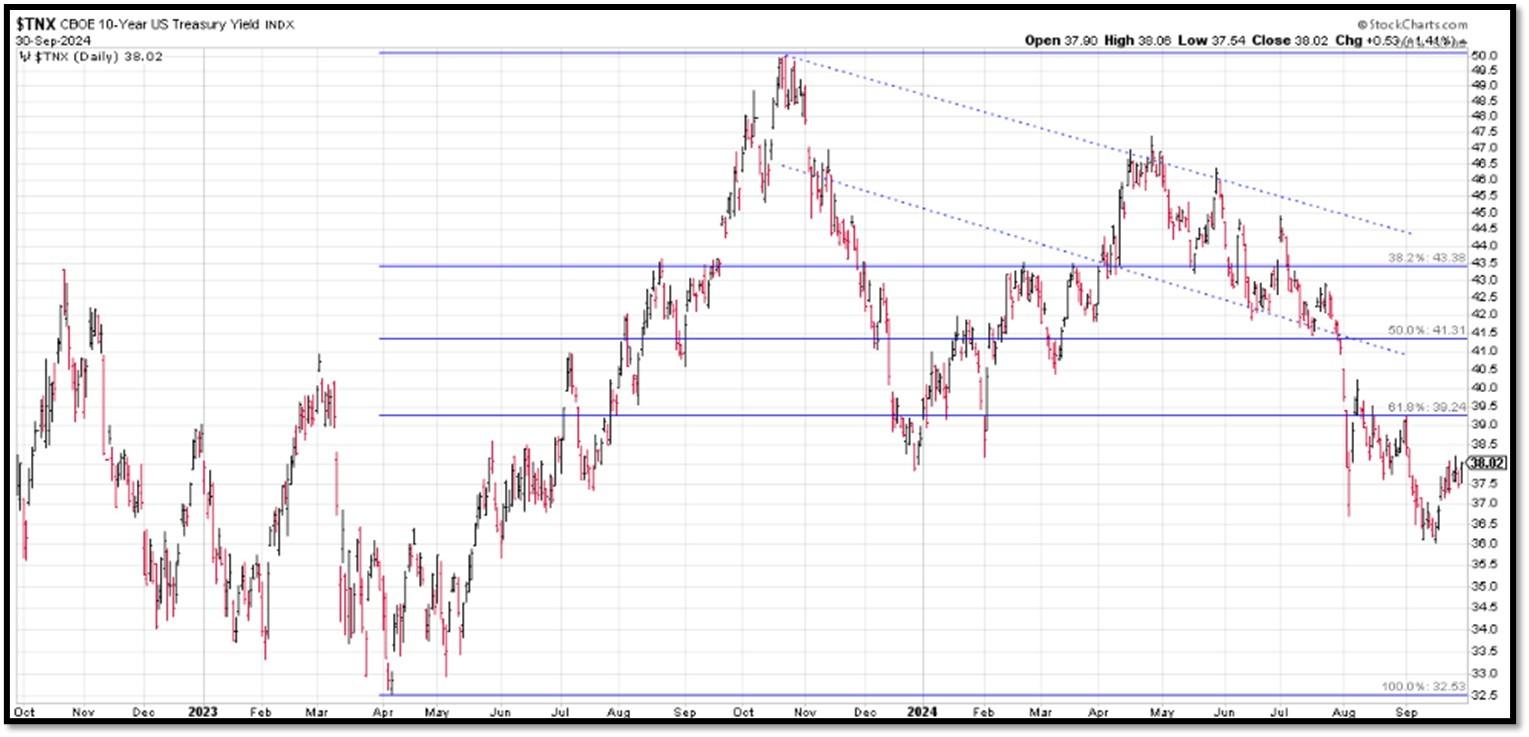
The 10-Year US Treasury Yield… REF: StockCharts1, StockCharts2
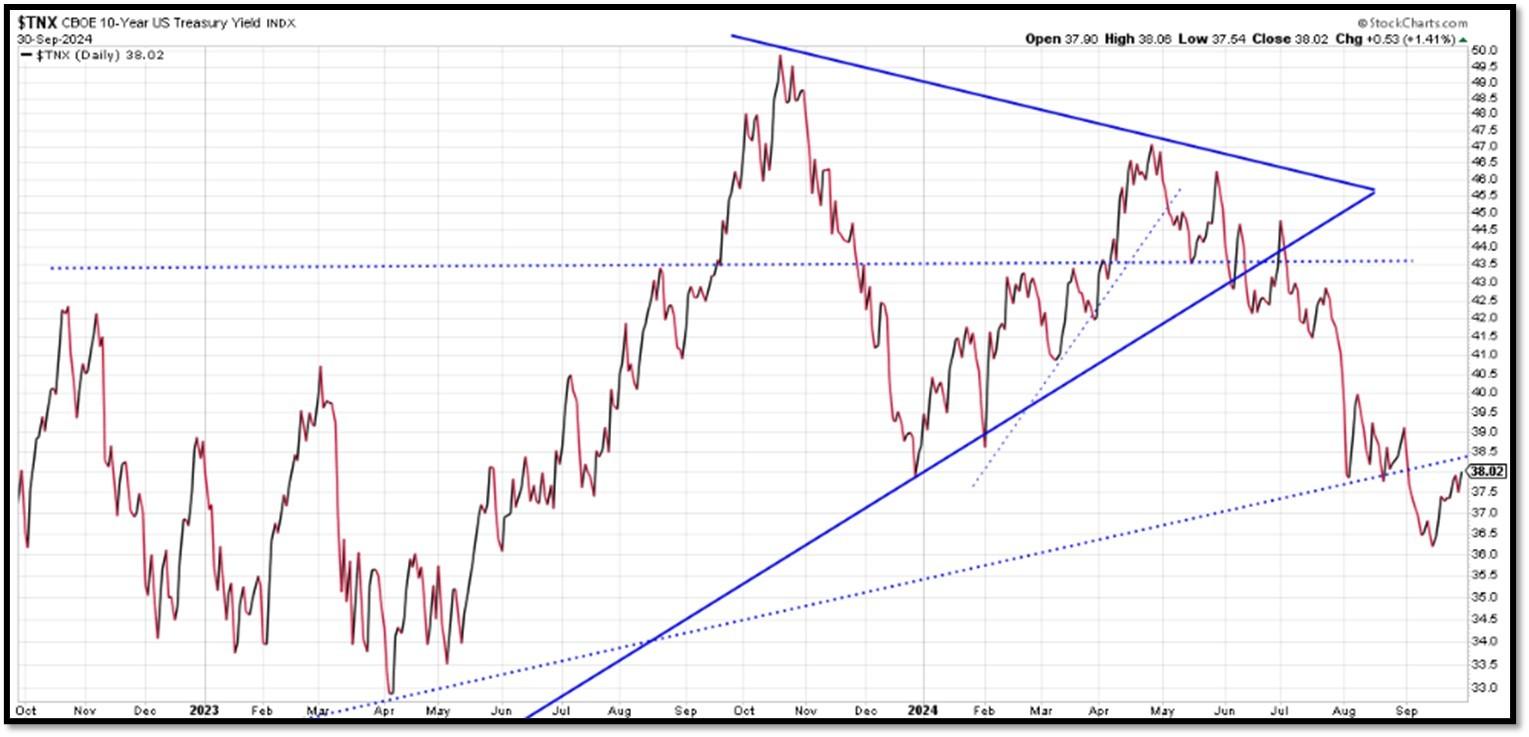
The 10-year yield – Headed lower…
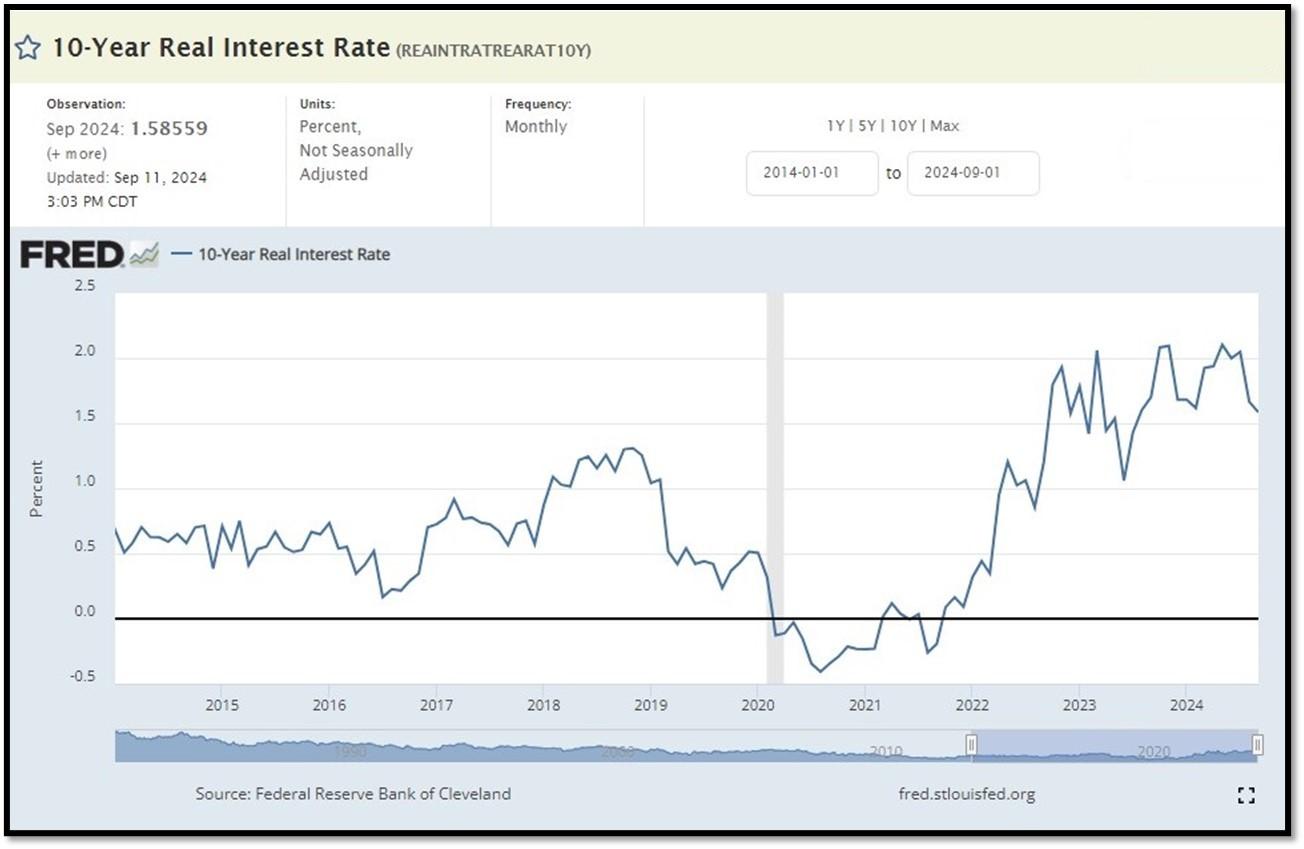
10-Year Real Interest Rate at 1.85% as of 9/11/24. It continues to climb even when Fed stopped raising interest rates. REF: REAINTRATREARAT10Y
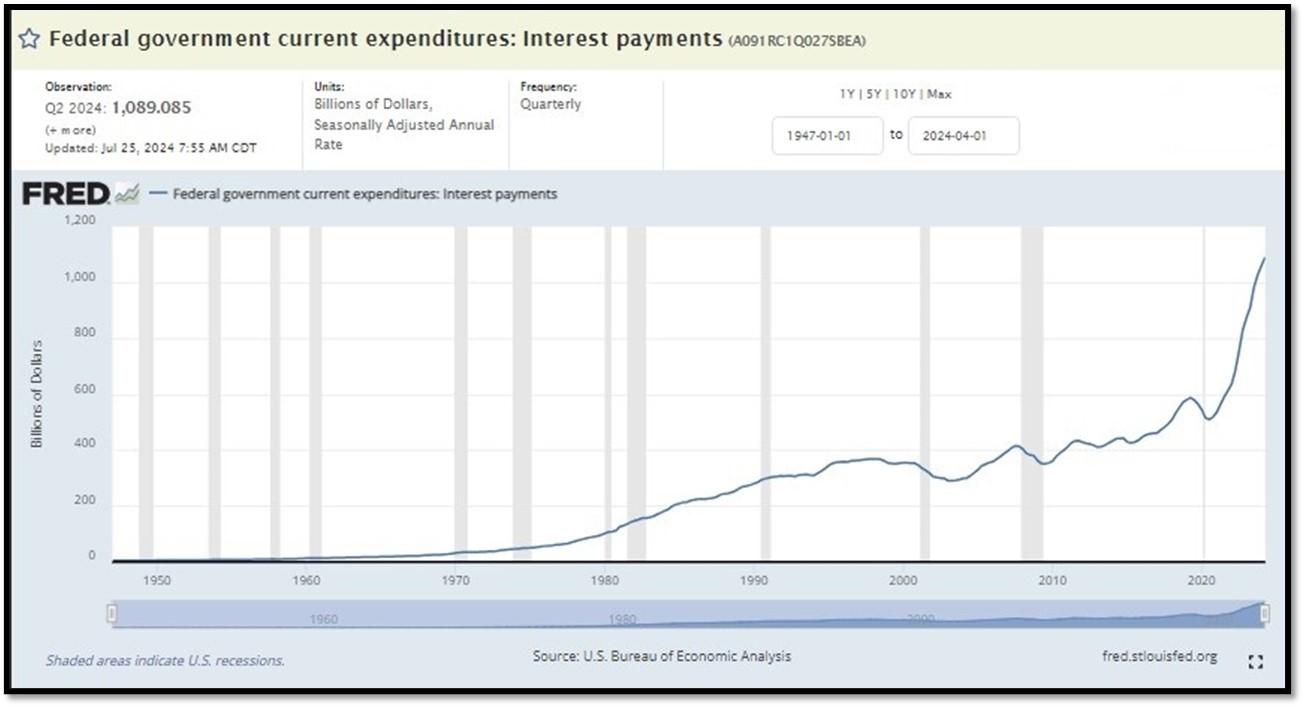
Federal government Interest Payments increased $30B to $1.089 T as of Q2-2024. REF: FRED-A091RC1Q027SBEA
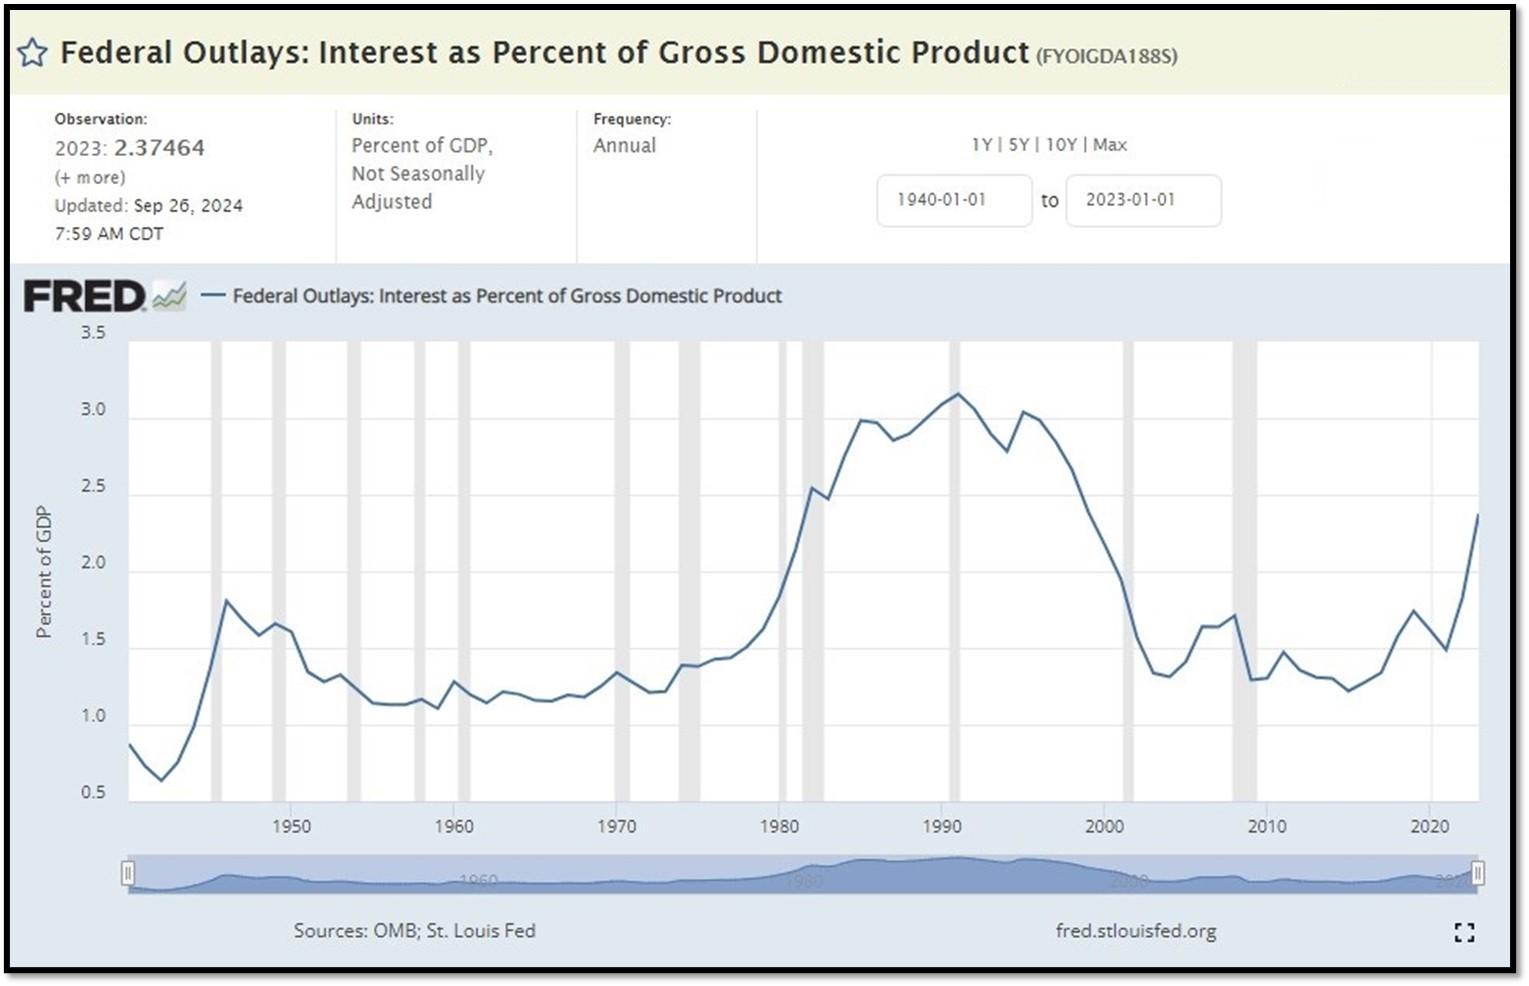
Interest payments as a percentage of GDP increased from 1.84853 in 2022 to 2.37464 as of 9/26/24. REF: FRED-FYOIGDA188S
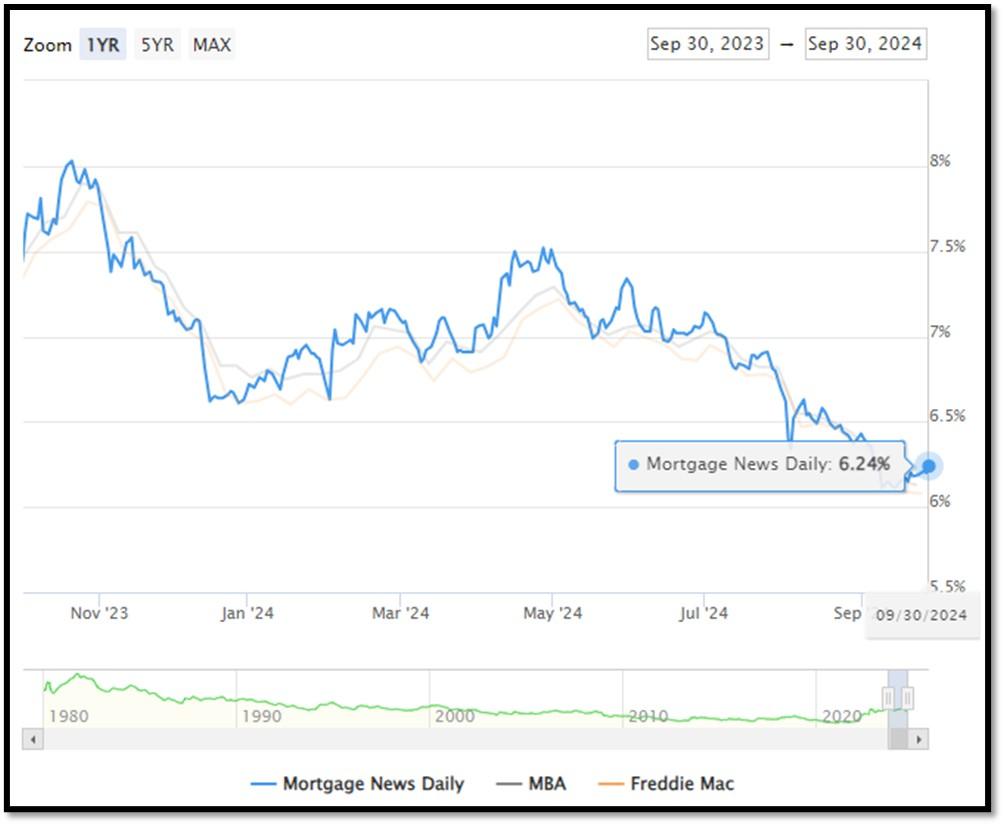
5I. (09/30/2024) Today’s National Average 30-Year Fixed Mortgage Rate is 6.24% (All Time High was 8.03% on 10/19/23). Last week’s data was 6.20%. This rate is the average 30-year fixed mortgage rates from several different surveys including Mortgage News Daily (daily index), Freddie Mac (weekly survey), Mortgage Bankers Association (weekly survey) and FHFA (monthly survey). REF: MortgageNewsDaily, Today’s Average Rate
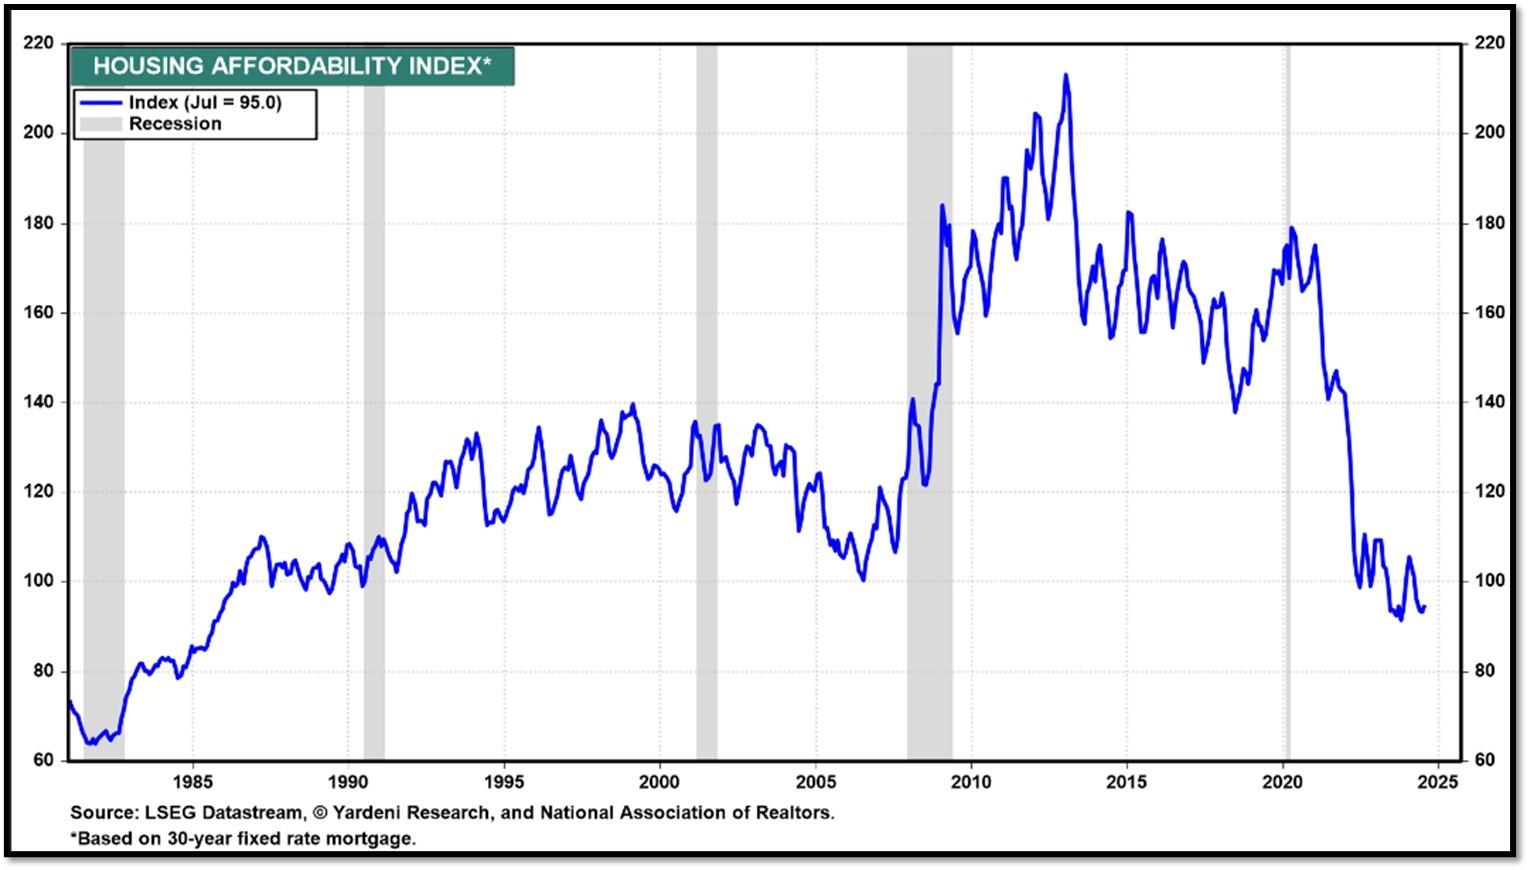
(09/16/24) Housing Affordability Index for July = 95 // June = 93.3 // May = 93.1 // April = 95.9 // March = 101.1 // February = 103.0. Data provided by Yardeni Research. REF: Yardeni
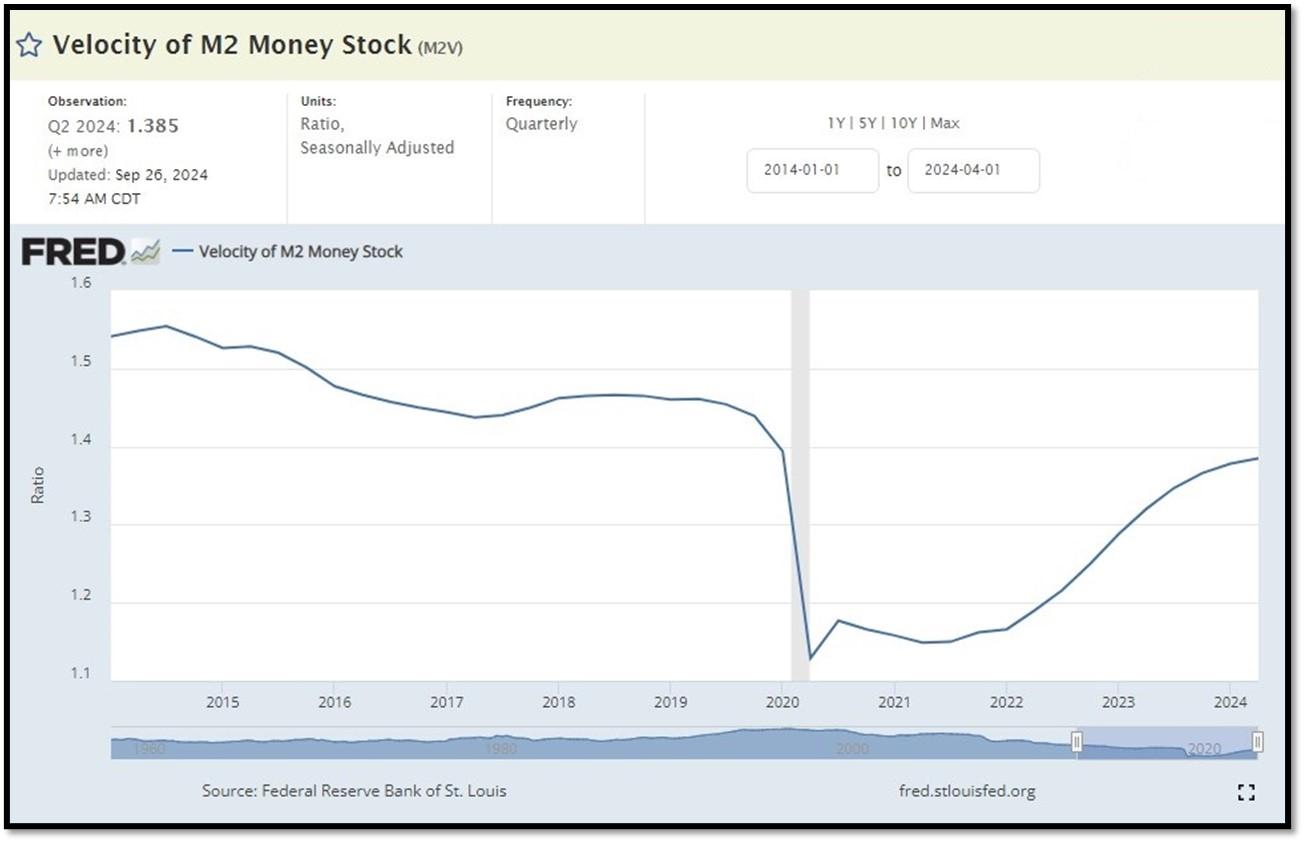
5J. Velocity of M2 Money Stock (M2V) with current read at 1.385 as of (Q2-2024 updated 9/26/2024). Previous quarter’s data was 1.368. The velocity of money is the frequency at which one unit of currency is used to purchase domestically- produced goods and services within a given time period. In other words, it is the number of times one dollar is spent to buy goods and services per unit of time. If the velocity of money is increasing, then more transactions are occurring between individuals in an economy. Current Money Stock (M2) report can be viewed in the reference link. REF: St.LouisFed-M2V
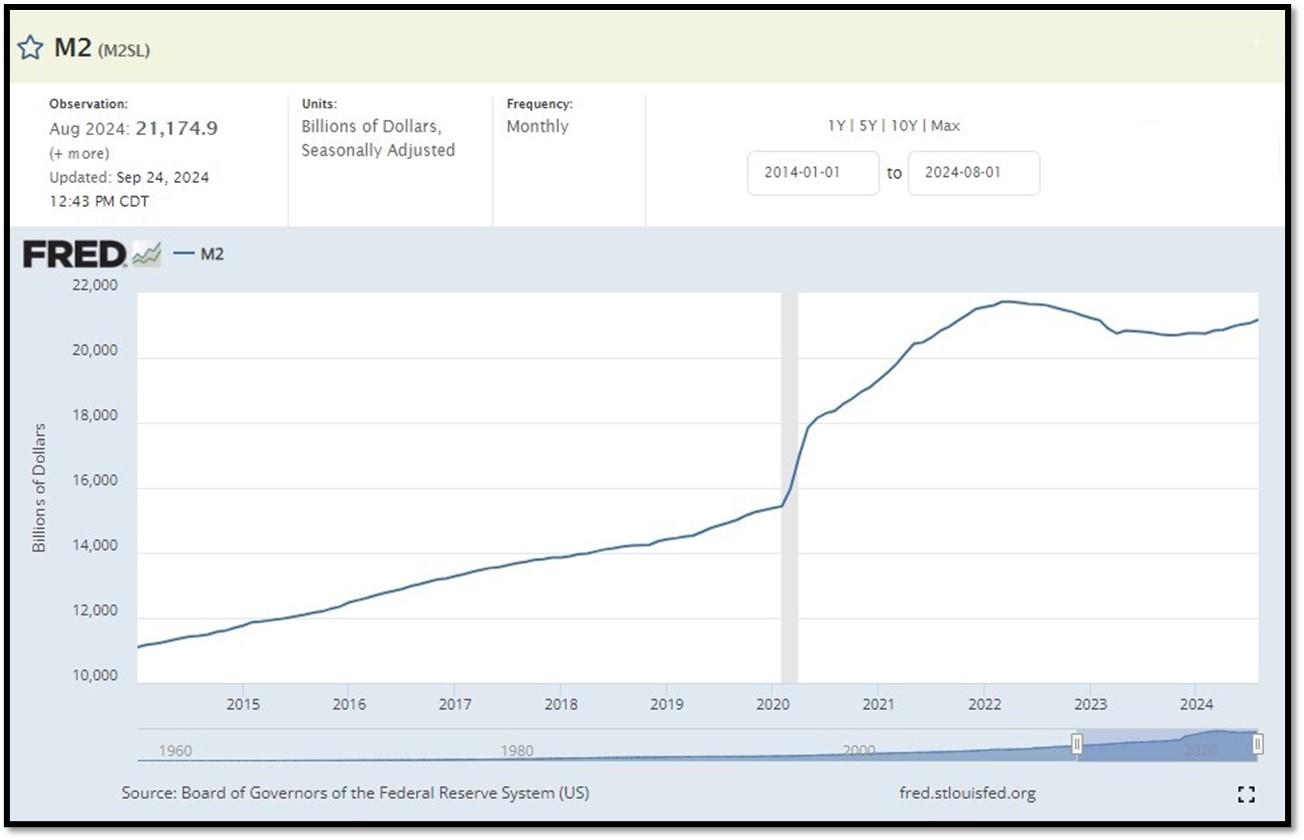
M2 consists of M1 plus (1) small-denomination time deposits (time deposits in amounts of less than $100,000) less IRA and Keogh balances at depository institutions; and (2) balances in retail MMFs less IRA and Keogh balances at MMFs. Seasonally adjusted M2 is constructed by summing savings deposits (before May 2020), small-denomination time deposits, and retail MMFs, each seasonally adjusted separately, and adding this result to seasonally adjusted M1. Board of Governors of the Federal Reserve System (US), M2 [M2SL], retrieved from FRED, Federal Reserve Bank of St. Louis; Updated on August 27, 2024. REF: St.LouisFed-M2
Money Supply M0 in the United States decreased to 5,653,900 USD Million in July from 5,731,900 USD Million in June of 2024. Money Supply M0 in the United States averaged 1138055.78 USD Million from 1959 until 2024, reaching an all-time high of 6,413,100.00 USD Million in December of 2021 and a record low of 48,400.00 USD Million in February of 1961. REF: TradingEconomics, M0

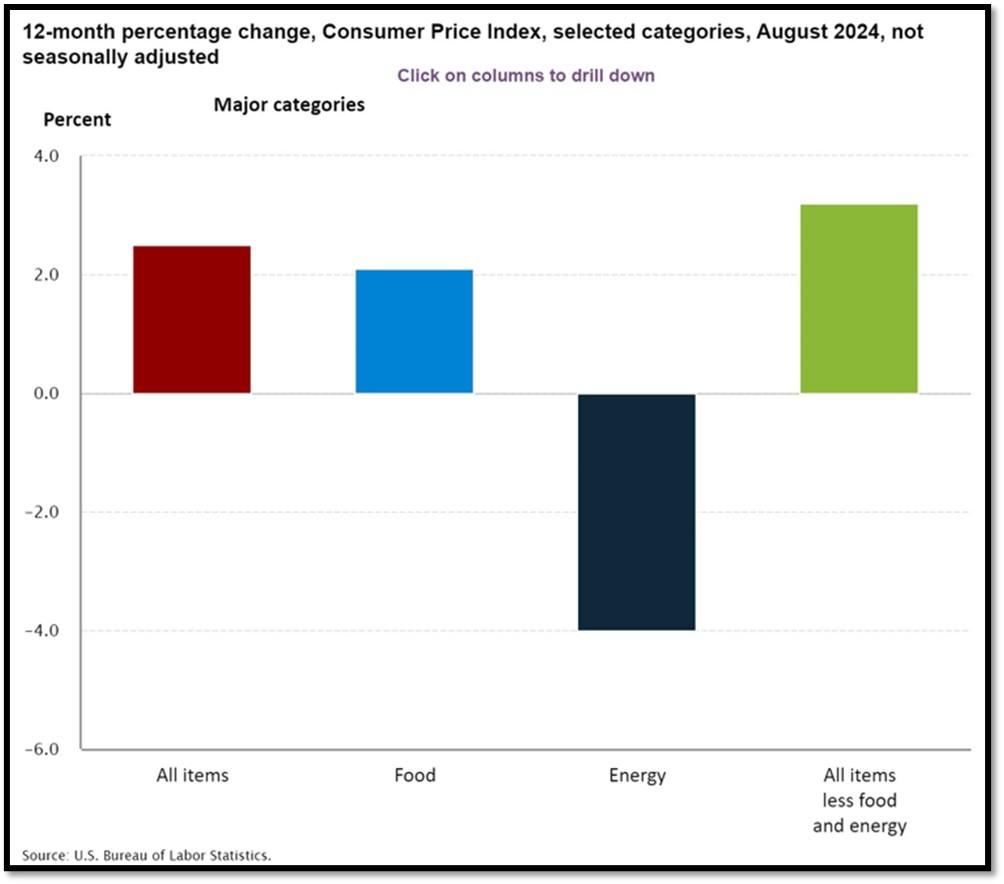
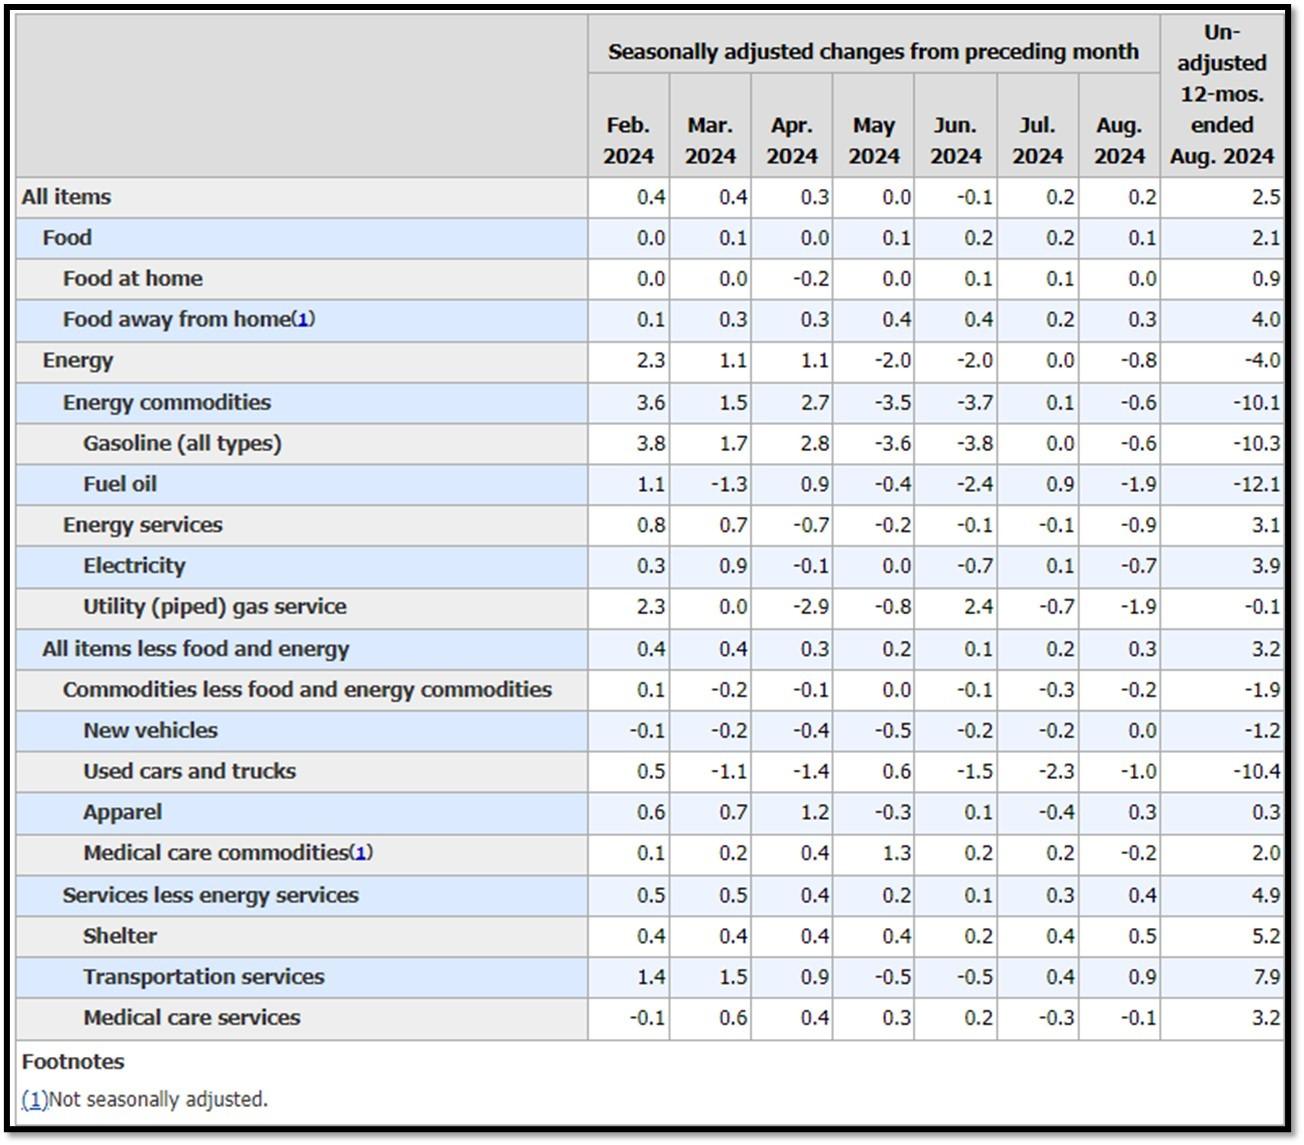
5K. In August, the Consumer Price Index for All Urban Consumers rose 0.2 percent, seasonally adjusted, and rose 2.5 percent over the last 12 months, not seasonally adjusted. The index for all items less food and energy increased 0.3 percent in August (SA); up 3.2 percent over the year (NSA). September 2024 CPI data are scheduled to be released on October 10, 2024, at 8:30AM-ET. REF: BLS, BLS.GOV
5L. Technical Analysis of the S&P500 Index. Click onto reference links below for images.
- Short-term Chart: Bottoming/Rising on 9/30/2024 – REF: Short-term S&P500 Chart by Marc Slavin (Click Here to Access Chart)
- Medium-term Chart: Bullish on 9/30/2024 – REF: Medium-term S&P500 Chart by Marc Slavin (Click Here to Access Chart)
- Market Timing Indicators – S&P500 Index as of 9/30/2024 – REF: S&P500 Charts (7 of them) by Joanne Klein’s Top 7 (Click Here to Access Updated Charts)
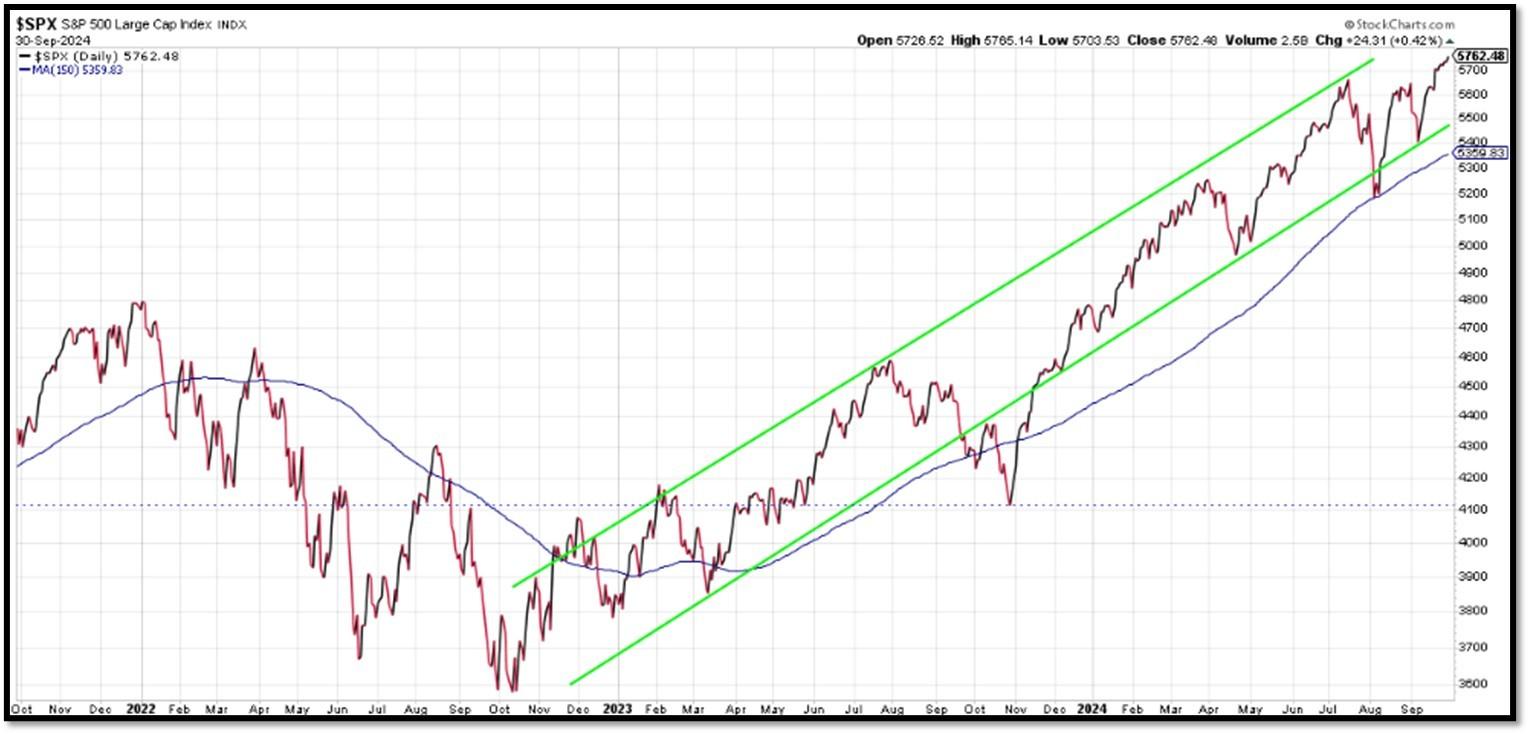
- A well-defined uptrend channel shown in green with S&P500 getting back on trend. REF: Stockcharts
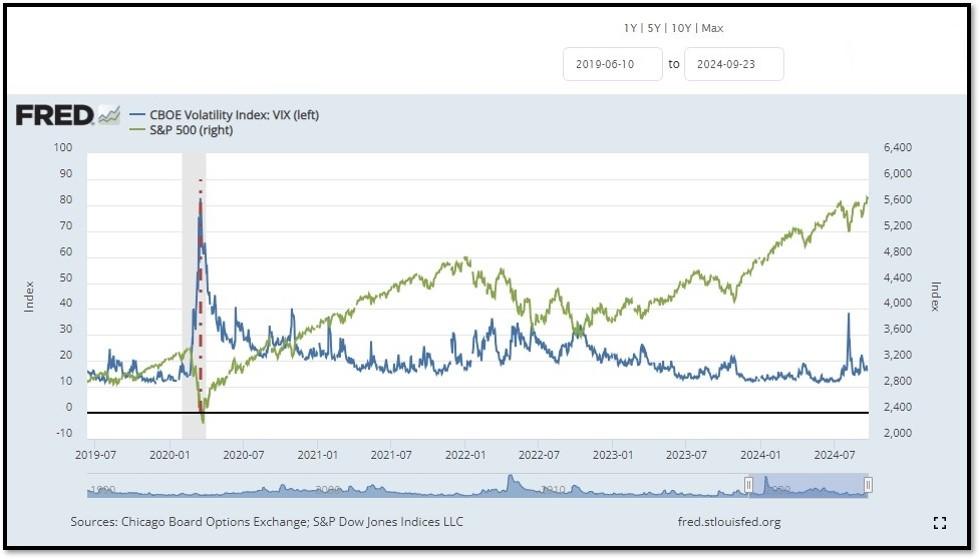
- S&P500 and CBOE Volatility Index (VIX) as of 9/30/2024. REF: FRED, Today’s Print
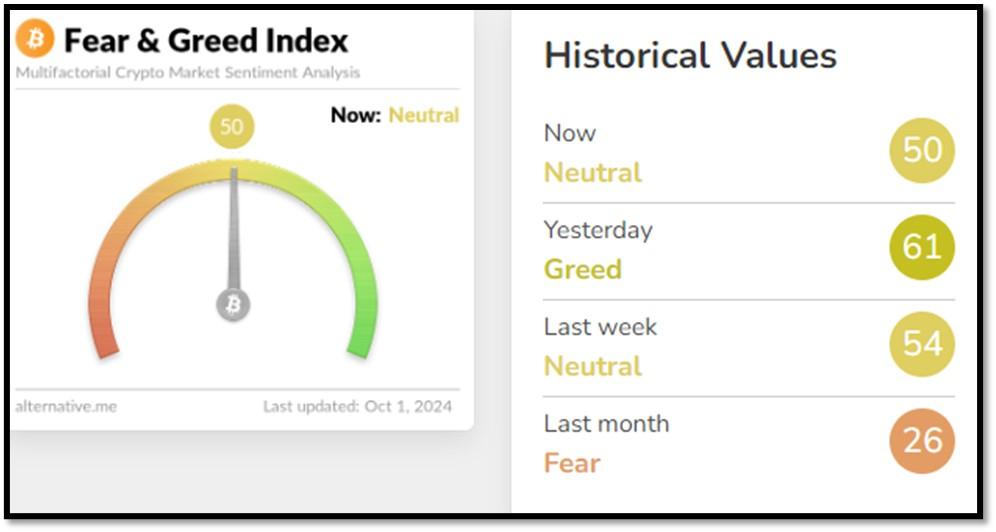
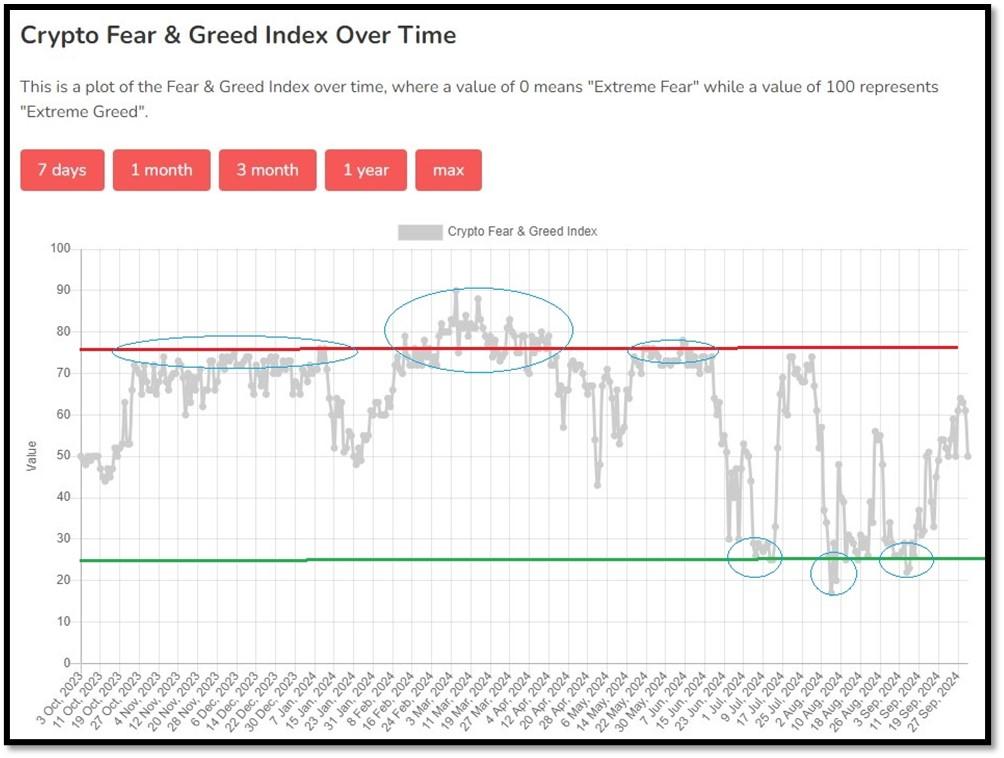
5M. Most recent read on the Crypto Fear & Greed Index with data as of 10/1/2024au is 50 (Neutral). Last week’s data was 54 (Neutral) (1-100). Fear & Greed Index – A Contrarian Data. The crypto market behavior is very emotional. People tend to get greedy when the market is rising which results in FOMO (Fear of missing out). Also, people often sell their coins in irrational reaction of seeing red numbers. With the Crypto Fear and Greed Index, the data try to help save investors from their own emotional overreactions. There are two simple assumptions:
- Extreme fear can be a sign that investors are too worried. That could be a buying opportunity.
- When Investors are getting too greedy, that means the market is due for a correction.
Therefore, the program for this index analyzes the current sentiment of the Bitcoin market and crunch the numbers into a simple meter from 0 to 100. Zero means “Extreme Fear”, while 100 means “Extreme Greed”. REF: Alternative.me, Today’sReading
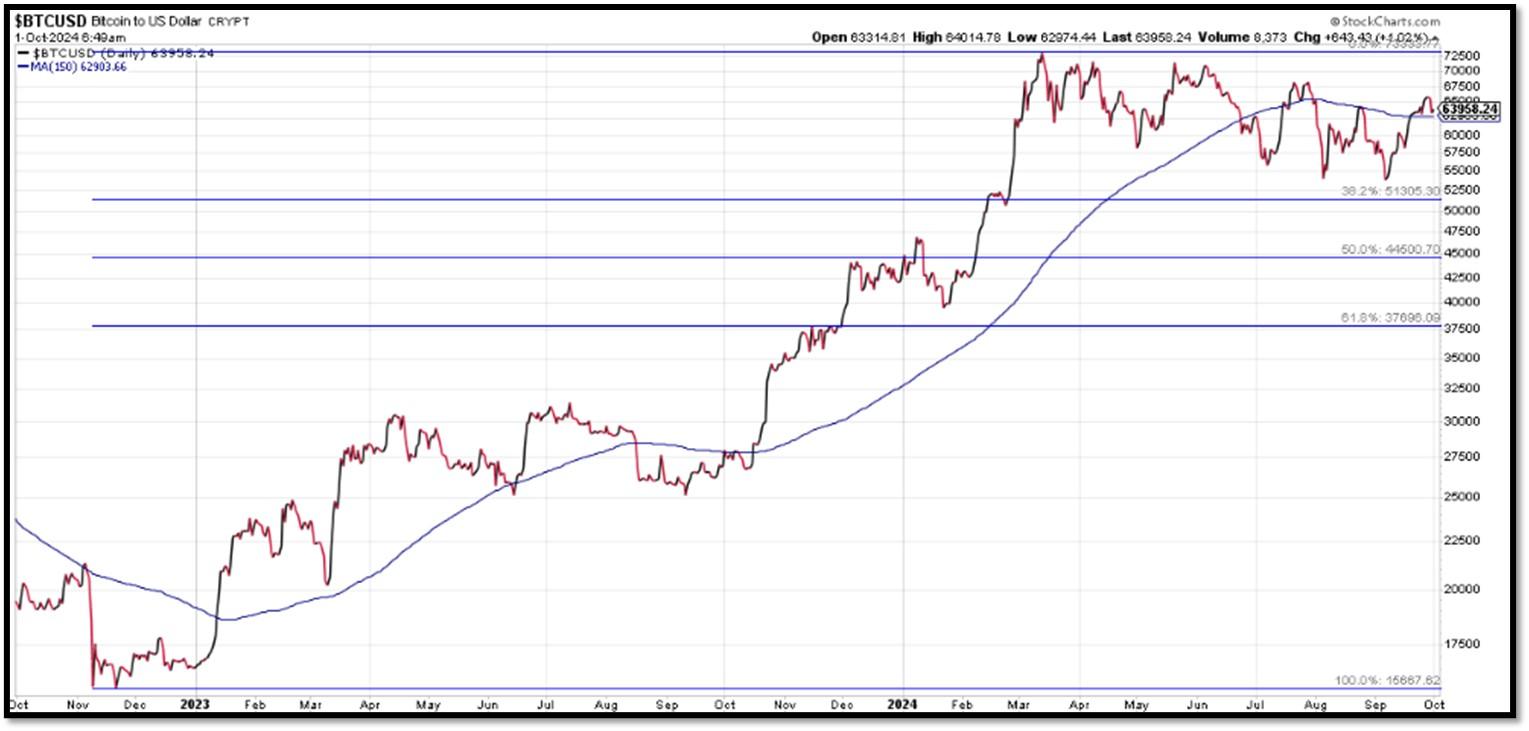
Bitcoin currently below the 150-day moving average. REF: Stockcharts
From the desk of our Chief Investment Officer
As an investment professional with over twenty-six years of experience in the financial services industry, Andrew helps clients to protect, grow and transfer wealth during their lifetime with objective, unbiased, customized and efficient strategies.
Education, Professional Licenses Acquired & Affiliations
- Passed the Series 7, 63, 65 and 24 license examinations
- Currently holding Series 65 License
- BA in Economics – Boston University (Boston, MA) 1993
- Certificate in Commodities Trading – New York University (New York, NY) 1991
- Certificate in Financial Planning – New York University (New York, NY) April 2011
With extensive experience in the Financial Services Industry, Andrew Tang and Turner Financial Group provides disciplined wealth management with an intelligent caring approach to each and every client that compliments the Dedicated Financial offering.


Len writes much of his own content, and also shares helpful content from other trusted providers like Turner Financial Group (TFG).
The material contained herein is intended as a general market commentary, solely for informational purposes and is not intended to make an offer or solicitation for the sale or purchase of any securities. Such views are subject to change at any time without notice due to changes in market or economic conditions and may not necessarily come to pass. This information is not intended as a specific offer of investment services by Dedicated Financial and Turner Financial Group, Inc.
Dedicated Financial and Turner Financial Group, Inc., do not provide tax, legal or accounting advice. You should consult your own tax, legal and accounting advisors before engaging in any transaction.
Any hyperlinks in this document that connect to Web Sites maintained by third parties are provided for convenience only. Turner Financial Group, Inc. has not verified the accuracy of any information contained within the links and the provision of such links does not constitute a recommendation or endorsement of the company or the content by Dedicated Financial or Turner Financial Group, Inc. The prices/quotes/statistics referenced herein have been obtained from sources verified to be reliable for their accuracy or completeness and may be subject to change.
Past performance is no guarantee of future returns. Investing involves risk and possible loss of principal capital. The views and strategies described herein may not be suitable for all investors. To the extent referenced herein, real estate, hedge funds, and other private investments can present significant risks, including loss of the original amount invested. All indexes are unmanaged, and an individual cannot invest directly in an index. Index returns do not include fees or expenses.
Turner Financial Group, Inc. is an Investment Adviser registered with the United States Securities and Exchange Commission however, such registration does not imply a certain level of skill or training and no inference to the contrary should be made. Additional information about Turner Financial Group, Inc. is also available at www.adviserinfo.sec.gov. Advisory services are only offered to clients or prospective clients where Turner Financial Group, Inc. and its representatives are properly licensed or exempt from licensure. No advice may be rendered by Turner Financial Group, Inc. unless a client service agreement is in place.