1. There is a lot to unpack this week’s “Weekly Market Review”, the U.S. stock market experienced significant volatility. There was also a sharp spike in the 10-year Treasury yield rising to 4.5%, fueled by poor demand at U.S. Treasury auctions on April 9 and 10. Japan’s move to sell U.S. Treasuries, joining bond vigilantes in protesting perceived U.S. fiscal policy missteps and eroding confidence in the nation’s financial system, marked a pivotal moment. This pressure prompted President Trump to announce a 90-day tariff pause for most countries, excluding China, to stabilize markets and ease concerns about escalating trade tensions.

On April 10, 2025, President Donald Trump addressed the press, revealing for the first time his plan to use tariff revenue to pay down the national debt while also funding priorities like tax cuts and border security. This announcement, set against the backdrop of Japan’s reported selling of U.S. Treasuries and a recent pause in his aggressive tariff hikes—except for a 125% levy on Chinese goods—appeared to signal a focus on fiscal responsibility, possibly to reassure global markets rattled by concerns over the $36 trillion U.S. debt and rising borrowing costs.
Trump’s remarks suggest a strategic response to both domestic and international pressures, framing tariffs as a tool to protect American industries and generate funds for debt reduction. However, relying on tariffs, which increase consumer costs and risk retaliation, may not sufficiently dent the massive debt, especially with competing spending goals. Whether this was a direct reaction to Japan’s actions or a broader message to stabilize confidence in U.S. finances, Trump’s approach blends protectionism with an ambitious, yet uncertain, vision for economic stability. Click onto picture below to access video. REF: CNBC

Expect stock market volatility, both upside and downside, to persist until China and the U.S. make progress in negotiations. In my opinion, this could happen within one to several weeks, and not months. Kevin O’Leary called for 400% tariffs on China which I thought was interesting. Click onto picture below to access video. REF: CNN

Current situation… “The Standoff”

2. A recent Wall Street Journal article highlights the escalating economic tensions between the U.S. and China, framing it as a descent into economic warfare with far-reaching global consequences. The article details how the U.S., under President Trump’s aggressive tariff policies, has imposed steep levies, including a 125% tariff on Chinese goods, prompting retaliatory measures from Beijing, such as restrictions on U.S. agricultural imports and currency depreciation maneuvers. It argues that both nations are entrenching themselves in a prolonged conflict, driven by Trump’s protectionist stance and China’s determination to protect its economic interests, risking supply chain disruptions, higher consumer prices, and global market instability. The WSJ emphasizes that this tit-for-tat approach could weaken both economies without resolving underlying issues like trade imbalances or technological competition, predicting widespread economic pain.
In my opinion, Xi Jinping’s motivations are rooted in maintaining his grip on power, as any slide into economic chaos could be pinned on him, threatening his leadership. China is already grappling with sluggish growth and opaque debt levels that obscure the true scale of its financial vulnerabilities. If economic turmoil erupts, public discontent could surge, pushing citizens to seek alternatives to the current regime—something Xi is desperate to avoid. His hardline response to U.S. tariffs reflects a calculated effort to project strength and deflect blame, but it risks exacerbating China’s domestic challenges, potentially undermining the stability he prioritizes above all else. Click onto picture below to access video. Data graphs shown further below provided by WSJ and The Conference Board. REF: WSJ, TheConferenceBoard, ChinaObserver


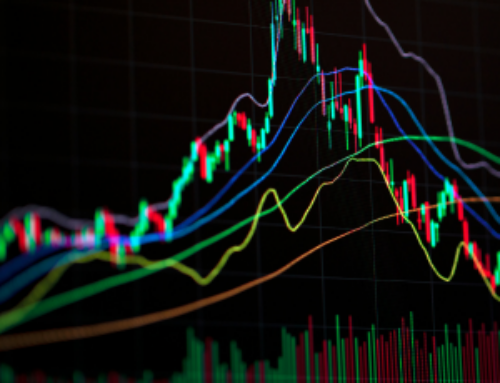
3. Amid the economic chaos driven by U.S.-China trade tensions, the WisdomTree Cloud Computing ETF (WCLD) presents a compelling investment opportunity. WCLD tracks a portfolio of companies focused on cloud computing services, an area poised for growth regardless of macroeconomic turbulence. Businesses, under pressure to evolve and boost efficiency, are increasingly reliant on cloud infrastructure to innovate and scale operations cost-effectively. Unlike discretionary spending, cloud adoption is a necessity for companies aiming to stay competitive, making WCLD a resilient choice. With firms like Snowflake, Datadog, and Zscaler in its holdings, WCLD offers exposure to high-growth names that I believe will see sustained demand as enterprises prioritize digital transformation over cost-cutting in this critical area.
Similarly, the Amplify Cybersecurity ETF (HACK) stands out as a strong contender in this volatile environment. HACK invests in companies specializing in cybersecurity, an essential safeguard as tariffs and geopolitical frictions heightens risks of data breaches and operational disruptions. Protecting sensitive data and ensuring business continuity are non-negotiable for companies navigating this harsh economic reality, and I see no significant budget cuts in this space. With holdings in leaders like Palo Alto Networks, CrowdStrike, and Fortinet, HACK provides diversified exposure to firms benefiting from rising corporate spending on cyber defenses. As businesses face growing threats, HACK is well-positioned to capitalize on the unrelenting need for robust cybersecurity solutions. REF: WCLD, HACK, Chart-WCLD, Chart-HACK
Important Note: Investor should consider the investment objective, risks, charges and expenses carefully before investing. For prospectus or summary prospectus with this and other information about these two Funds, please visit referenced (REF) links listed above. Read carefully before investing.


With the current macro-economic backdrop, below are areas we currently favor:
- Fixed Income – Short-term Corporates (Low-Beta)
- Fixed Income – Corporates High Yield as Opportunistic Allocation (Low-Beta)
- Businesses that contribute to and benefit from AI & Automation (Market-Risk)
- Financials (Market-Risk)
- Communications & Cloud Computing (Market-Risk)
- Cyber-Security (Market-Risk)
- Biotechnology (Market-Risk)
- Gold & Digital Asset – Bitcoin (Market-Risk/Hedge)
- Small Cap & Mid Cap Stocks (Market-Risk)
4. World Watch
4A. A Bloomberg article from April 10, 2025, reports that President Xi Jinping will visit Vietnam, Malaysia, and Cambodia from April 14 to 18 to bolster ties with Southeast Asian nations amid a worsening trade war with the U.S. With Trump imposing a 125% tariff on Chinese goods while pausing tariffs for these countries, Xi’s first overseas trip this year aims to secure trade partnerships to cushion China’s economy. The move counters U.S. efforts to isolate Beijing, leveraging regional concerns about American trade volatility.
Bloomberg frames Xi’s outreach as a bid to stabilize China’s economy, with Southeast Asia’s 680 million consumers and status as China’s top trading partner being pivotal. In my view, Xi’s urgency reflects his need to preserve power, as trade war fallout could spark unrest in China, already strained by slow growth and hidden debt. By strengthening these ties, Xi aims to mitigate economic risks and prevent domestic challenges that might threaten his leadership. Click onto picture below to access video. REF: Bloomberg, Diplomantify

4B. Oil prices have stabilized in recent weeks and are likely to remain steady for the foreseeable future, largely due to a resurgence in U.S. oil production spurred by President Trump’s “Drill, Baby, Drill” initiative. This policy has unleashed a wave of activity among American oil producers, particularly in shale-rich regions like the Permian Basin, boosting domestic output to near-record levels. The increased U.S. supply has offset global market uncertainties, acting as a buffer against price spikes. Additionally, the U.S.’s growing energy independence reduces reliance on volatile international markets, creating a stabilizing force for oil prices even as geopolitical tensions simmer. By prioritizing deregulation and incentivizing drilling, Trump’s program has ensured that the U.S. remains a dominant player in global oil supply, keeping prices in check.
Further contributing to this stability is OPEC’s decision to increase production starting in April 2025, a response to neighboring countries flouting production quotas and a tacit acknowledgment of OPEC’s limited ability to manipulate oil prices in the current environment. Frustrated by non-compliance from some members and facing pressure from a well-supplied market, OPEC’s move to ramp up output reflects a pragmatic shift to maintain market share rather than artificially constrain supply. However, looming U.S.-China trade tensions and ongoing tariff talks introduce a countervailing risk, raising the specter of a global recession that could dampen oil demand. Despite this, the combination of robust U.S. production and OPEC’s strategic pivot creates a balanced supply-demand dynamic, likely anchoring oil prices in a stable range for the near term. REF: TradingEconomics, OPEC, OILPRICE

4C. Below is an updated snapshot of the current global state of economy according to TradingEconomics as of 4/7/2025. REF: TradingEconomics
- The U.S. unemployment rate rose to 4.2% in March 2025, the highest level since November and slightly above market expectations of 4.1%.
- Japan’s unemployment rate fell slightly to 2.4% in February 2025 from 2.5% in the previous month, defying forecasts for no change.
- The unemployment rate in Italy eased to 5.9% in February 2025, down from a revised 6.2% in the previous month, defying forecasts of an increase to 6.3%.
- The unemployment rate in Canada rose to 6.7% in March of 2025, accelerating from the three-month low recorded in the previous month and matching market expectations.

5. Quant & Technical Corner – Below is a selection of quantitative & technical data we monitor on a regular basis to help gauge the overall financial market conditions and the investment environment.
5A. Most recent read on the Fear & Greed Index with data as of 4/7/2025 – 8:00PM-ET is 4 (Extreme Fear). Last week’s data was 15 (Fear) (1-100). CNNMoney’s Fear & Greed index looks at 7 indicators (Stock Price Momentum, Stock Price Strength, Stock Price Breadth, Put and Call Options, Junk Bond Demand, Market Volatility, and Safe Haven Demand). Keep in mind this is a contrarian indicator! REF: Fear&Greed via CNNMoney


5B. St. Louis Fed Financial Stress Index’s (STLFSI4) most recent read is at –0.6316 as of April 3, 2025. Previous week’s data was -0.6489. A big spike up from previous readings reflecting the turmoil in the banking sector back in 2023. This weekly index is not seasonally adjusted. The STLFSI4 measures the degree of financial stress in the markets and is constructed from 18 weekly data series: seven interest rate series, six yield spreads and five other indicators. Each of these variables captures some aspect of financial stress. Accordingly, as the level of financial stress in the economy changes, the data series are likely to move together. REF: St. Louis Fed

5C. University of Michigan, University of Michigan: Consumer Sentiment for February [UMCSENT] at 64.7, retrieved from FRED, Federal Reserve Bank of St. Louis, March 28, 2025. Back in June 2022, Consumer Sentiment hit a low point going back to April 1980. REF: UofM

5D. The Chicago Fed National Activity Index (CFNAI) increased to +0.18 in February from –0.08 in January. Three of the four broad categories of indicators used to construct the index increased from January, and two categories made positive contributions in February. The index’s three-month moving average, CFNAI-MA3, increased to +0.15 in February from +0.07 in January. REF: ChicagoFed, February’s Report


5E. (3/20/2025) The Conference Board Leading Economic Index (LEI) for the US declined by 0.3% in February 2025 to 101.1 (2016=100), after a 0.2% decline (revised from –0.3%) in January. Overall, the LEI fell by 1.0% in the six-month period ending February 2025, less than half of its rate of decline of –2.1% over the previous six months (February–August 2024). The composite economic indexes are the key elements in an analytic system designed to signal peaks and troughs in the business cycle. The indexes are constructed to summarize and reveal common turning points in the economy in a clearer and more convincing manner than any individual component. The CEI is highly correlated with real GDP. The LEI is a predictive variable that anticipates (or “leads”) turning points in the business cycle by around 7 months. Shaded areas denote recession periods or economic contractions. The dates above the shaded areas show the chronology of peaks and troughs in the business cycle. The ten components of The Conference Board Leading Economic Index® for the U.S. include: Average weekly hours in manufacturing; Average weekly initial claims for unemployment insurance; Manufacturers’ new orders for consumer goods and materials; ISM® Index of New Orders; Manufacturers’ new orders for nondefense capital goods excluding aircraft orders; Building permits for new private housing units; S&P 500® Index of Stock Prices; Leading Credit Index™; Interest rate spread (10-year Treasury bonds less federal funds rate); Average consumer expectations for business conditions. REF: ConferenceBoard, LEI Report for February (Released on 3/29/2025)

We have experienced a “rolling recession” since June 2022 and are only now emerging from it. However, authorities are not labeling it a recession due to high employment data. 
5F. Probability of U.S. falling into Recession within 3 to 4 months is currently at 48.26% (with data as of 03/30/2025 – Next Report 04/14/2025) according to RecessionAlert Research. Last release’s data was at 32.85%. This report is updated every two weeks. REF: RecessionAlertResearch


5G. Yield Curve as of 4/7/2025 is showing Normal. Spread on the 10-yr Treasury Yield (4.15%) minus yield on the 2-yr Treasury Yield (3.72%) is currently at 43bps. REF: Stockcharts The yield curve—specifically, the spread between the interest rates on the ten-year Treasury note and the three-month Treasury bill—is a valuable forecasting tool. It is simple to use and significantly outperforms other financial and macroeconomic indicators in predicting recessions two to six quarters ahead. REF: NYFED

5H. Recent Yields in 10-Year Government Bonds. REF: Source is from Bloomberg.com, dated 4/7/2025, rates shown below are as of 4/7/2025, subject to change.

The 10-Year US Treasury Yield… The 10-Year Yield is indirectly related to inflation. I expect the 10-Year Yield to drop further as dis-inflation kicks in. REF: StockCharts1, StockCharts2


10-Year Real Interest Rate at 1.86151% as of 3/12/25. Last month’s data was 2.03128%. REF: REAINTRATREARAT10Y

ICE BofA US High Yield Index Option-Adjusted Spread (BAMLH0A0HYM2) currently at 4.45 as of April 7, 2025. This is a key indicator of market sentiment, particularly regarding risk and economic health. At its core, the spread reflects the extra return investors demand to hold riskier corporate debt over safer government securities. High-yield bonds are issued by companies with lower credit ratings (below investment grade, like BB or lower), meaning they carry a higher chance of default. The spread compensates for this risk. When the spread is narrow—say, around 2.5% to 3%, as seen recently—it suggests investors are confident, willing to accept less extra yield because they perceive lower default risk or a strong economy. Narrow spreads often align with bullish markets, where cash is flowing, growth is steady, and fear is low. REF: FRED-BAMLH0A0HYM2

5I. (4/7/2025) Today’s National Average 30-Year Fixed Mortgage Rate is 6.82% (All Time High was 8.03% on 10/19/23). Last week’s data was 6.74%. This rate is the average 30-year fixed mortgage rates from several different surveys including Mortgage News Daily (daily index), Freddie Mac (weekly survey), Mortgage Bankers Association (weekly survey) and FHFA (monthly survey). REF: MortgageNewsDaily, Today’s Average Rate
The recent spike in the 30-year fixed-rate jumbo mortgage to 6.82%, compared to Freddie Mac’s rate at 6.64% and the Mortgage Bankers Association (MBA) rate at 6.71%, highlights key differences in the mortgage market. Jumbo mortgages, which exceed the conforming loan limits set by government agencies like Freddie Mac, typically carry higher interest rates because they are riskier for lenders. These loans are not backed by government entities, which increases the risk for lenders and, consequently, leads to higher rates. In contrast, Freddie Mac and MBA provide averages for conforming loans, which meet federal guidelines and have lower risk due to government backing, keeping their rates lower.

(3/17/25) Housing Affordability Index for Jan = 100.7 // Dec = 100.7 // Nov = 99 // Oct = 102.3 // Sep = 105.5 // Aug = 98.6. Data provided by Yardeni Research. REF: Yardeni


5J. Velocity of M2 Money Stock (M2V) with current read at 1.387 as of (Q4-2024 updated 3/27/2025). Previous quarter’s data was 1.390. The velocity of money is the frequency at which one unit of currency is used to purchase domestically- produced goods and services within a given time period. In other words, it is the number of times one dollar is spent to buy goods and services per unit of time. If the velocity of money is increasing, then more transactions are occurring between individuals in an economy. Current Money Stock (M2) report can be viewed in the reference link. REF: St.LouisFed-M2V

M2 consists of M1 plus (1) small-denomination time deposits (time deposits in amounts of less than $100,000) less IRA and Keogh balances at depository institutions; and (2) balances in retail MMFs less IRA and Keogh balances at MMFs. Seasonally adjusted M2 is constructed by summing savings deposits (before May 2020), small-denomination time deposits, and retail MMFs, each seasonally adjusted separately, and adding this result to seasonally adjusted M1. Board of Governors of the Federal Reserve System (US), M2 [M2SL], retrieved from FRED, Federal Reserve Bank of St. Louis; Updated on March 25, 2025. REF: St.LouisFed-M2

Money Supply M0 in the United States decreased to 5,614,000 USD Million in February from 5,614,200 USD Million in January of 2025. Money Supply M0 in the United States averaged 1,177,483.25 USD Million from 1959 until 2025, reaching an all-time high of 6,413,100.00 USD Million in December of 2021 and a record low of 48,400.00 USD Million in February of 1961.. REF: TradingEconomics, M0

5K. In February, the Consumer Price Index for All Urban Consumers rose 0.2 percent, seasonally adjusted, and rose 2.8 percent over the last 12 months, not seasonally adjusted. The index for all items less food and energy increased 0.2 percent in February (SA); up 3.1 percent over the year (NSA). March 2025 CPI data are scheduled to be released on April 10, 2025, at 8:30AM-ET. REF: BLS, BLS.GOV


5L. Technical Analysis of the S&P500 Index. Click onto reference links below for images.
- Short-term Chart: Trend Bearish on 4/7/2025 – REF: Short-term S&P500 Chart by Marc Slavin (Click Here to Access Chart)
- Medium-term Chart: Trend Bullish to Falling on 4/7/2025 – REF: Medium-term S&P500 Chart by Marc Slavin (Click Here to Access Chart)
- Market Timing Indicators – S&P500 Index as of 4/7/2025 – REF: S&P500 Charts (7 of them) by Joanne Klein’s Top 7 (Click Here to Access Updated Charts)
- A well-defined uptrend channel shown in green with S&P500 broke away from the uptrend. REF: Stockcharts

- S&P500 and CBOE Volatility Index (VIX) as of 4/7/2025. REF: FRED, Today’s Print

5M. Most recent read on the Crypto Fear & Greed Index with data as of 4/7/2025 is 19 (Extreme Fear). Last week’s data was 24 (Fear) (1-100). Fear & Greed Index – A Contrarian Data. The crypto market behavior is very emotional. People tend to get greedy when the market is rising which results in FOMO (Fear of missing out). Also, people often sell their coins in irrational reaction of seeing red numbers. With the Crypto Fear and Greed Index, the data try to help save investors from their own emotional overreactions. There are two simple assumptions:
- Extreme fear can be a sign that investors are too worried. That could be a buying opportunity.
- When Investors are getting too greedy, that means the market is due for a correction.
Therefore, the program for this index analyzes the current sentiment of the Bitcoin market and crunch the numbers into a simple meter from 0 to 100. Zero means “Extreme Fear”, while 100 means “Extreme Greed”. REF: Coinmarketcap.com, Today’sReading


Bitcoin – 10-Year & 2-Year Charts. REF: Stockcharts10Y, Stockcharts2Y


Len writes much of his own content, and also shares helpful content from other trusted providers like Turner Financial Group (TFG).
The material contained herein is intended as a general market commentary, solely for informational purposes and is not intended to make an offer or solicitation for the sale or purchase of any securities. Such views are subject to change at any time without notice due to changes in market or economic conditions and may not necessarily come to pass. This information is not intended as a specific offer of investment services by Dedicated Financial and Turner Financial Group, Inc.
Dedicated Financial and Turner Financial Group, Inc., do not provide tax, legal or accounting advice. You should consult your own tax, legal and accounting advisors before engaging in any transaction.
Any hyperlinks in this document that connect to Web Sites maintained by third parties are provided for convenience only. Turner Financial Group, Inc. has not verified the accuracy of any information contained within the links and the provision of such links does not constitute a recommendation or endorsement of the company or the content by Dedicated Financial or Turner Financial Group, Inc. The prices/quotes/statistics referenced herein have been obtained from sources verified to be reliable for their accuracy or completeness and may be subject to change.
Past performance is no guarantee of future returns. Investing involves risk and possible loss of principal capital. The views and strategies described herein may not be suitable for all investors. To the extent referenced herein, real estate, hedge funds, and other private investments can present significant risks, including loss of the original amount invested. All indexes are unmanaged, and an individual cannot invest directly in an index. Index returns do not include fees or expenses.
Turner Financial Group, Inc. is an Investment Adviser registered with the United States Securities and Exchange Commission however, such registration does not imply a certain level of skill or training and no inference to the contrary should be made. Additional information about Turner Financial Group, Inc. is also available at www.adviserinfo.sec.gov. Advisory services are only offered to clients or prospective clients where Turner Financial Group, Inc. and its representatives are properly licensed or exempt from licensure. No advice may be rendered by Turner Financial Group, Inc. unless a client service agreement is in place.