- 1. Recent economic indicators suggest a deceleration in the U.S. economy.
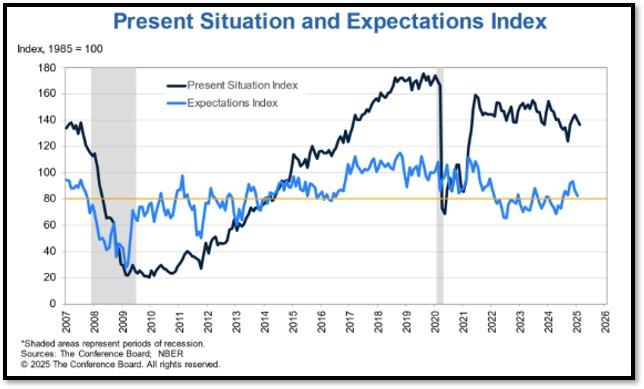
- 2. In February 2025, U.S. consumer confidence experienced its most significant decline since August 2021, as reported by The Conference Board.
- 3. The January Barometer is a market theory suggesting that the performance of the stock market in January serves as an indicator for the rest of the year.
- **With the current macro-economic backdrop, below are areas we currently favor:
- 4. World Watch
- 5. Quant & Technical Corner
1. Recent economic indicators suggest a deceleration in the U.S. economy.
In February, consumer confidence experienced its most significant decline since August 2021, with The Conference Board’s index dropping to 98.3 from 105.3 in January. This downturn reflects growing concerns over inflation and potential trade conflicts (See item No. 2 below for additional information). The housing market also shows signs of cooling. New home sales in January fell by 10.5% to an annual rate of 657,000 units, down from 734,000 in December. This decline is attributed to high mortgage rates and elevated home prices, which have dampened buyer demand. Investors are now closely monitoring upcoming data releases, including initial and continuing jobless claims, personal income, and the Personal Consumption Expenditures (PCE) index for January. Should these indicators reveal further economic weakening, the likelihood of an emergency interest rate cut by the Federal Reserve may increase, as policymakers aim to support economic growth amid mounting uncertainties.
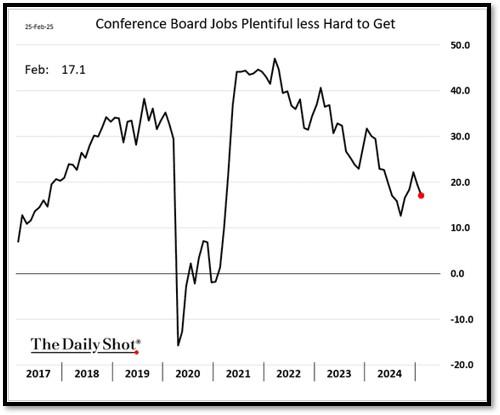
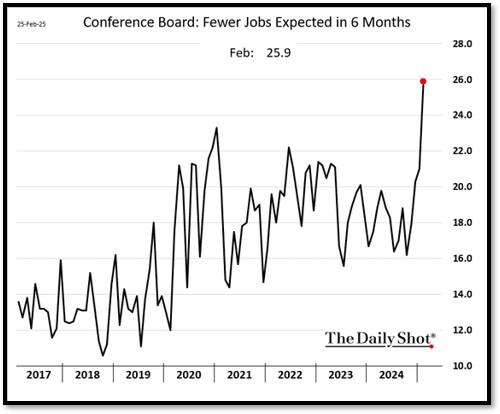
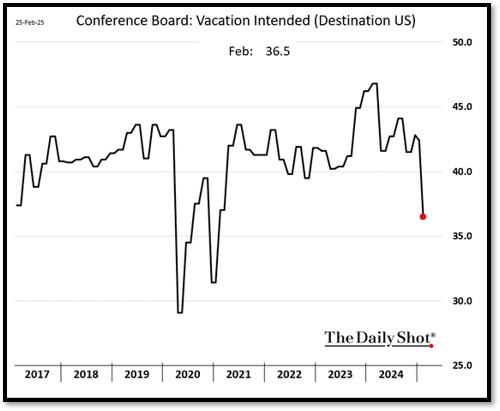
This week’s highlighted charts include: the labor differential index declining, as more Americans anticipate fewer job opportunities in the coming months, with fewer Americans plan domestic vacations. REF: Dailyshot
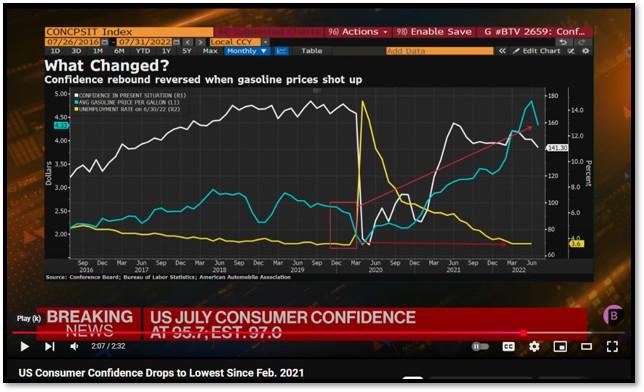
2. In February 2025, U.S. consumer confidence experienced its most significant decline since August 2021, as reported by The Conference Board.
The index fell from 105.3 in January to 98.3, surpassing economists’ expectations of 103. This sharp downturn is primarily attributed to persistent inflation and escalating concerns over potential trade wars under President Donald Trump’s administration. The imposition of tariffs on imports from China, Canada, and Mexico has heightened fears of rising consumer prices, contributing to the erosion of public trust in the economy. This sentiment is further corroborated by the University of Michigan’s survey, which also indicates a decline in consumer sentiment. The prevailing anxiety suggests that, despite a robust labor market, Americans are increasingly apprehensive about future economic conditions, potentially leading to reduced consumer spending and a slowdown in economic growth. Click onto picture below to access video. REF: CNBC, Bloomberg, TheConferenceBoard
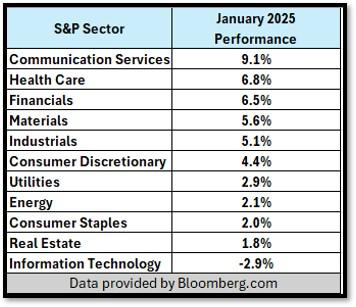
3. The January Barometer is a market theory suggesting that the performance of the stock market in January serves as an indicator for the rest of the year.
Historically, a strong January signals a bullish year, while a weak start suggests potential struggles ahead. While not infallible, this theory has been observed in many years, making it a point of interest for investors. Applying this to sector performance in January 2025, Communication Services, which led with a 9.1% return, could continue to outperform throughout the year. This sector’s strength may indicate sustained investor confidence in digital services, media, and telecom companies. On the other hand, the Technology sector, which declined 2.9%, faces headwinds that may persist, possibly due to concerns over interest rates, regulatory pressure, or shifting consumer demand. If the January Barometer holds, investors may favor sectors that showed early strength while remaining cautious with underperforming areas. However, external factors such as economic policy shifts, inflation, and global events could still alter these trajectories. While January sets a tone, adaptability remains key in navigating market trends for the year ahead. REF: Invesco
**With the current macro-economic backdrop, below are areas we currently favor:
- Fixed Income – Short-term Corporates (Low-Beta)
- Fixed Income – Corporates High Yield as Opportunistic Allocation (Low-Beta)
- Businesses that contribute to and benefit from AI & Automation (Market-Risk)
- Communications (Market-Risk)
- Financials (Market-Risk)
- Small Cap & Mid Cap Stocks (Market-Risk)
- Biotechnology (Market-Risk)
- Gold & Digital Asset – Bitcoin (Market-Risk/Hedge)
4. World Watch
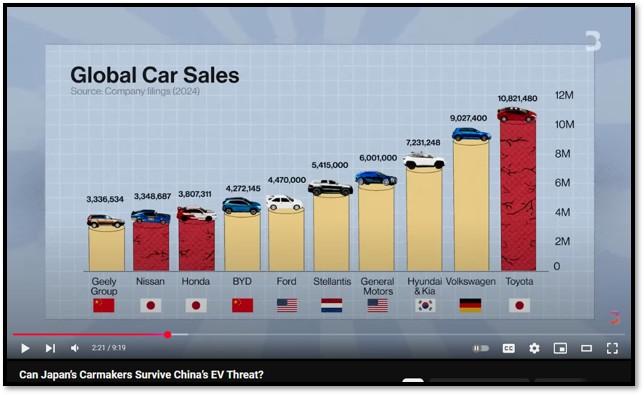
4A. Japan’s Carmakers Face an Existential Threat from China’s EV Dominance – Japanese automakers, long revered for their engineering excellence and reliability, are facing an unprecedented challenge as Chinese electric vehicle (EV) manufacturers rapidly gain market share. According to Bloomberg, industry giants like Honda and Nissan are losing ground, particularly in key markets such as Southeast Asia, as China aggressively expands its dominance in EV production and innovation. The decline of Japanese automakers is largely tied to their slow transition to electrification. While Toyota, Honda, and Nissan pioneered hybrid technology, their hesitance to fully embrace EVs has left them vulnerable to Chinese brands like BYD, which are offering affordable, technologically advanced models. The Chinese government’s strong support for its domestic EV industry, coupled with advances in battery technology and cost efficiencies, has given China an edge that Japan is struggling to counter.
For Japan’s carmakers to survive, they must accelerate their EV strategies, invest in next-generation battery technology, and forge global partnerships to remain competitive. A shift in mindset—from incremental improvements to bold innovation—will be crucial. Without a decisive pivot, Japan risks ceding its once-dominant position in the global automotive market to an electrified future led by China. Merger discussions between Nissan and Honda, initiated in December 2024, have collapsed due to significant disagreements over control and restructuring. Honda proposed making Nissan a subsidiary and suggested that Nissan abandon its proprietary hybrid system in favor of Honda’s technology. Nissan’s leadership found these terms unacceptable, leading to the termination of the talks. This development has intensified scrutiny of Nissan’s CEO, Makoto Uchida, with reports indicating that the company is considering his replacement amid ongoing financial challenges. Click onto picture below to access video. REF: Bloomberg, REUTERS
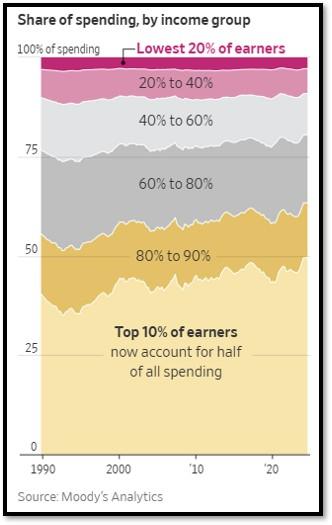
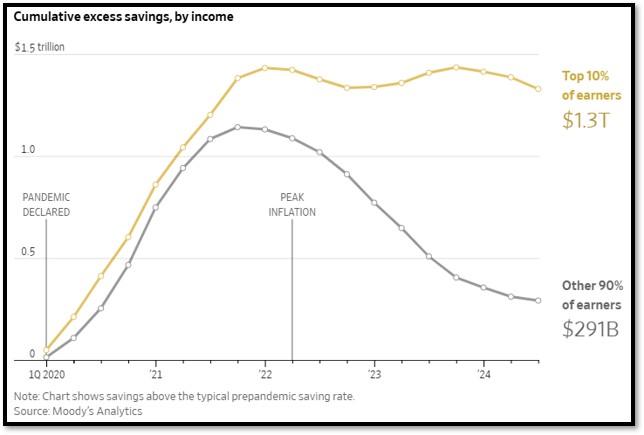
4B. The U.S. economy is becoming increasingly reliant on the spending habits of the highest-earning 10% of Americans. According to The Wall Street Journal, this elite group has significantly increased its expenditures, outpacing inflation, while the rest of the population has struggled to keep up. This growing divide underscores a fundamental shift in economic dynamics, where affluent consumers are driving demand while middle- and lower-income households remain constrained by rising costs and stagnant wages.
The disparity in spending is largely attributed to wealth accumulation among the top earners, who benefit from stock market gains, high property values, and rising incomes. In contrast, the majority of Americans face financial pressures from inflation, higher interest rates, and mounting debt, limiting their discretionary spending. As a result, industries such as luxury goods, high-end travel, and premium services thrive, while sectors dependent on middle-class consumption see slower growth. This economic imbalance raises concerns about long-term sustainability. If the broader population continues to struggle financially, overall economic growth could weaken, making the U.S. economy overly dependent on the spending patterns of a small, affluent minority. Addressing income inequality and strengthening financial stability for all Americans may be crucial to ensuring a more balanced and resilient economic future. REF: WSJ
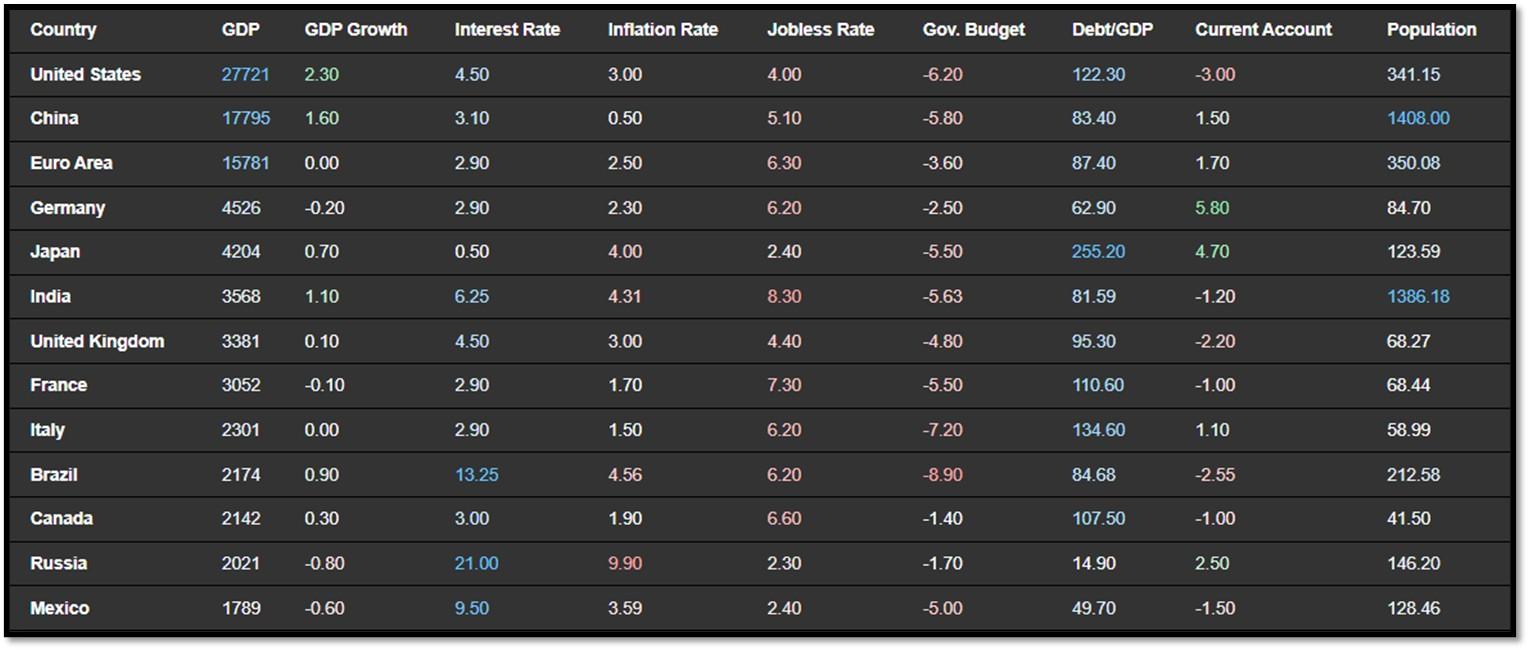
4C. Below is an updated snapshot of the current global state of economy according to TradingEconomics as of 2/25/2025. REF: TradingEconomics
- The annual inflation rate in Japan climbed to 4.0% in January 2025 from 3.6% in the prior month, marking the highest reading since January 2023.
- The annual inflation rate in the UK accelerated sharply to 3% in January 2025, the highest since March 2024, from 2.5% in the previous month and above forecasts of 2.8%.
- The German economy shrank by 0.2% quarter-on-quarter in the three months to December 2024, confirming preliminary estimates and following a 0.1% expansion in the previous period.
- The Bank of Korea (BoK) lowered its base rate by 25 bps to 2.75% at the February 2025 meeting, after keeping the rate unchanged in January.
5. Quant & Technical Corner
Below is a selection of quantitative & technical data we monitor on a regular basis to help gauge the overall financial market conditions and the investment environment.
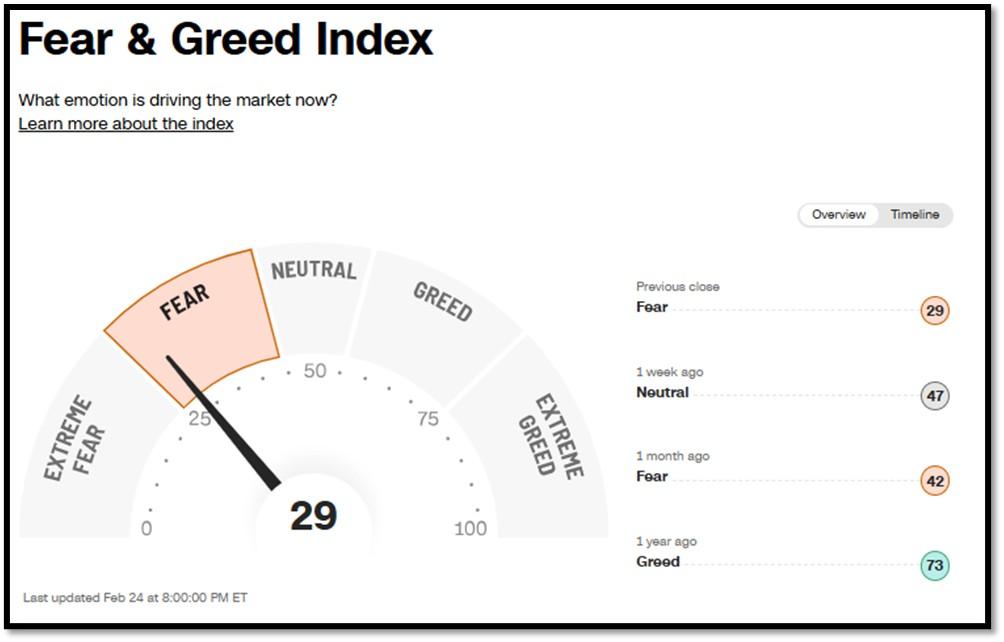
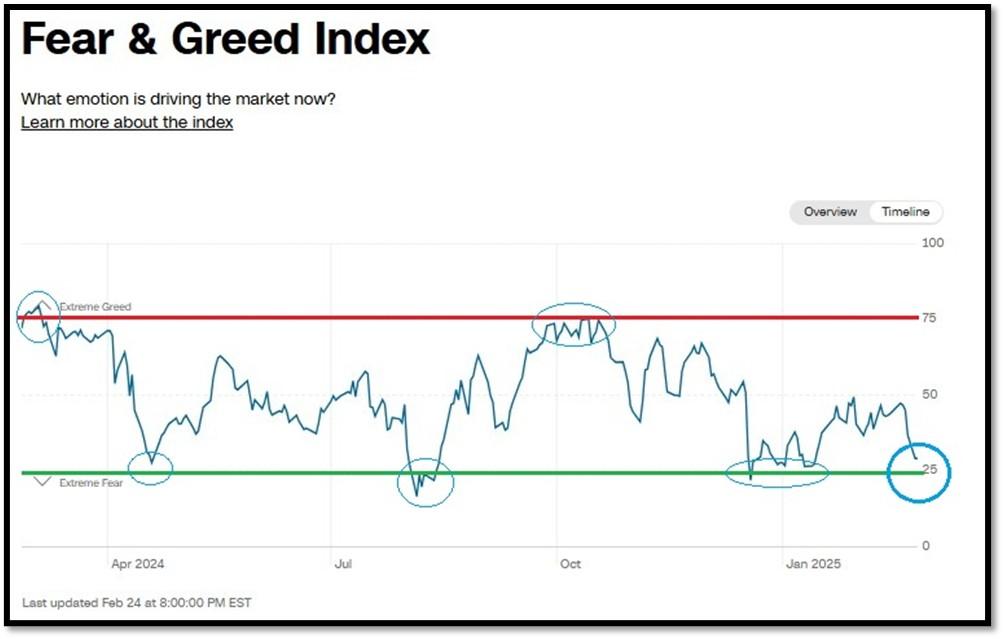
5A. Most recent read on the Fear & Greed Index with data as of 2/24/2025 – 8:00PM-ET is 29 (Fear). Last week’s data was 47 (Neutral) (1-100). CNNMoney’s Fear & Greed index looks at 7 indicators (Stock Price Momentum, Stock Price Strength, Stock Price Breadth, Put and Call Options, Junk Bond Demand, Market Volatility, and Safe Haven Demand). Keep in mind this is a contrarian indicator! REF: Fear&Greed via CNNMoney
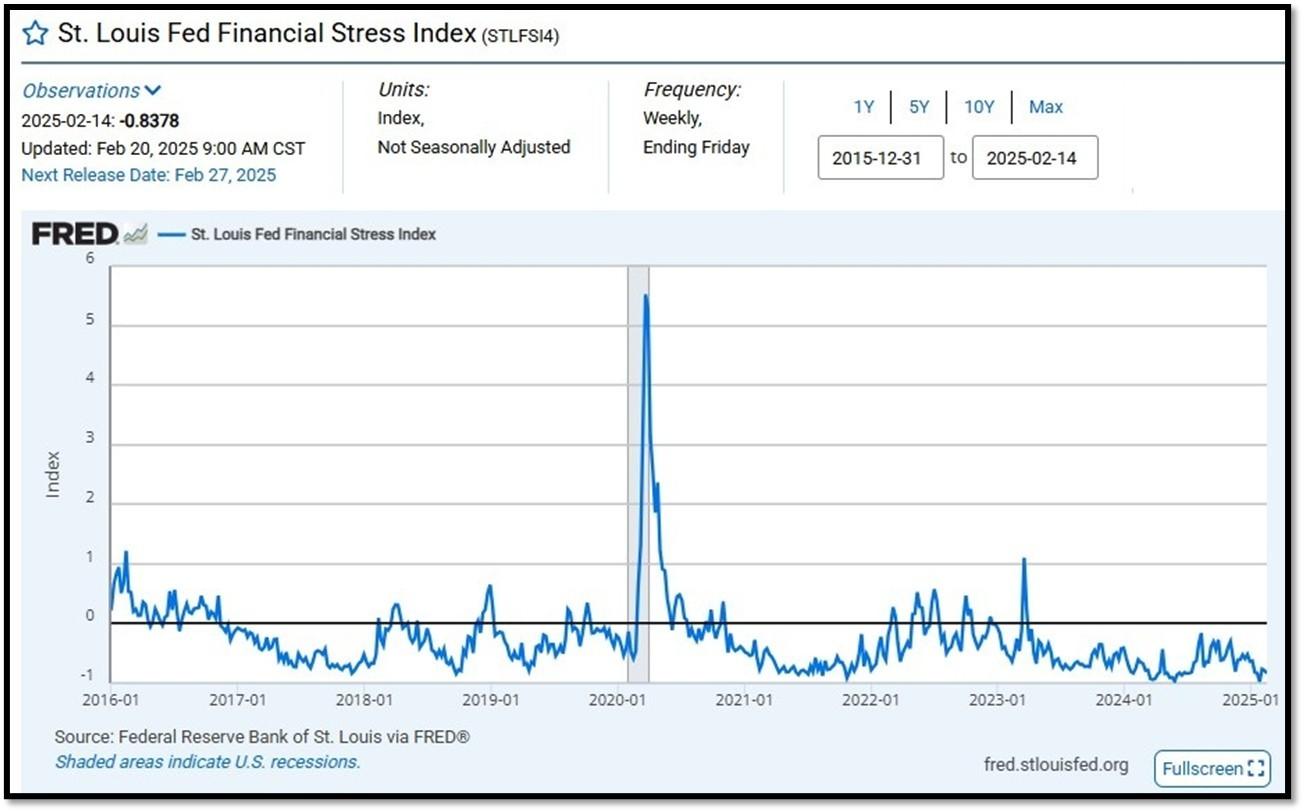
5B. St. Louis Fed Financial Stress Index’s (STLFSI4) most recent read is at –0.8378 as of February 20, 2025. Previous week’s data was -0.7872. A big spike up from previous readings reflecting the turmoil in the banking sector back in 2023. This weekly index is not seasonally adjusted. The STLFSI4 measures the degree of financial stress in the markets and is constructed from 18 weekly data series: seven interest rate series, six yield spreads and five other indicators. Each of these variables captures some aspect of financial stress. Accordingly, as the level of financial stress in the economy changes, the data series are likely to move together. REF: St. Louis Fed
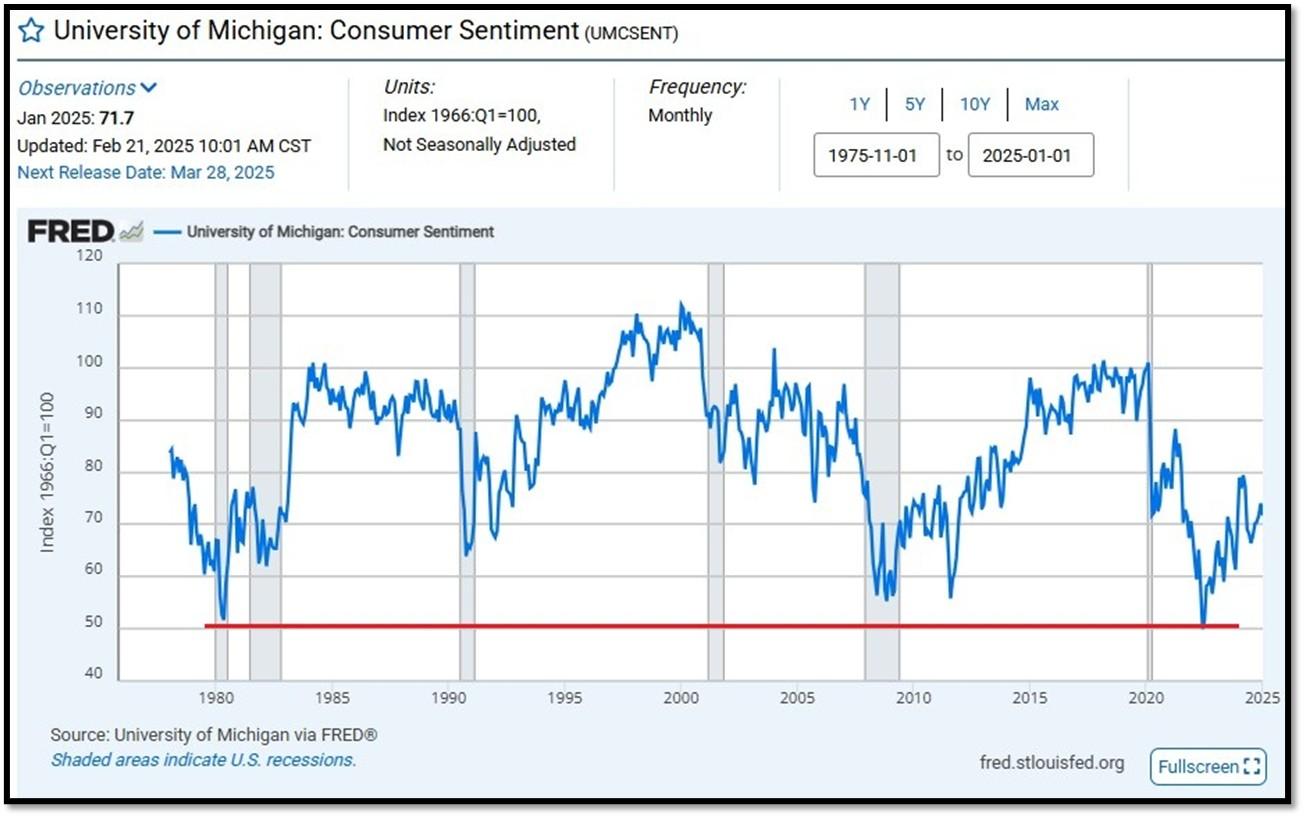
5C. University of Michigan, University of Michigan: Consumer Sentiment for January [UMCSENT] at 71.7, retrieved from FRED, Federal Reserve Bank of St. Louis, February 21, 2025. Back in June 2022, Consumer Sentiment hit a low point going back to April 1980. REF: UofM
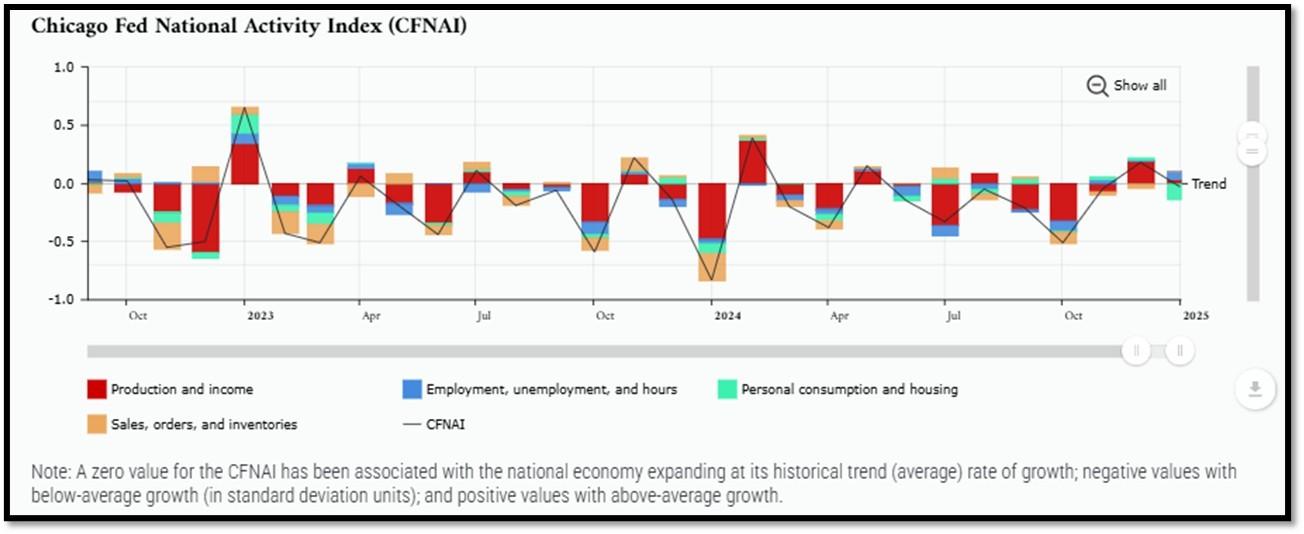
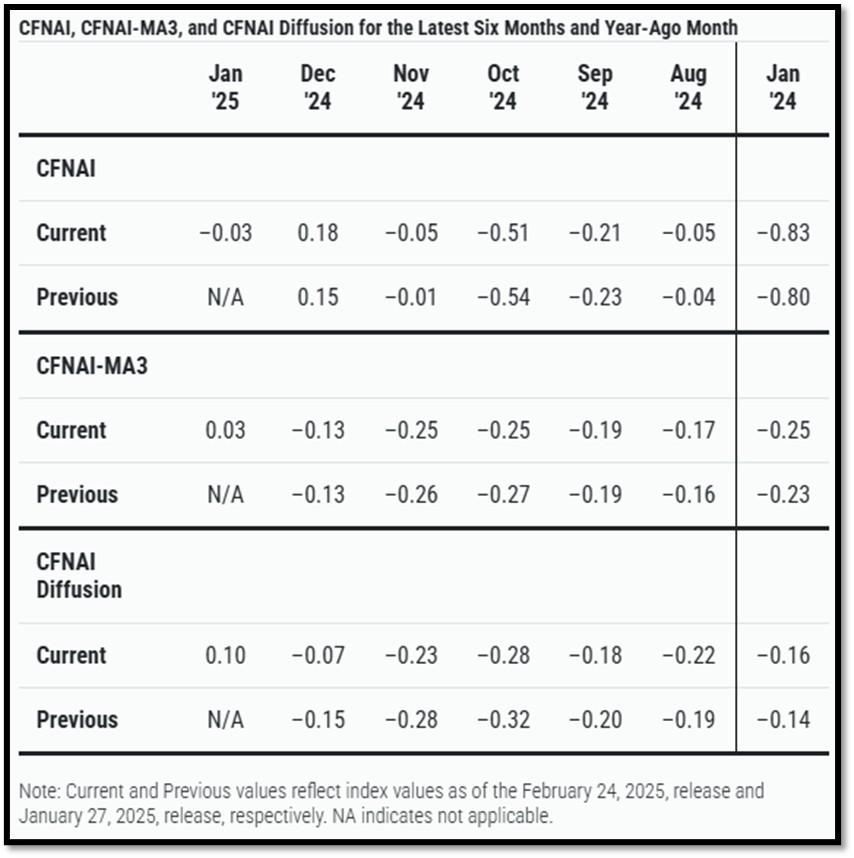
5D. The Chicago Fed National Activity Index (CFNAI) decreased to –0.03 in January from +0.18 in December. Two of the four broad categories of indicators used to construct the index decreased from December, and one category made a negative contribution in January. The index’s three-month moving average, CFNAI-MA3, increased to +0.03 in January from –0.13 in December. REF: ChicagoFed, January’s Report
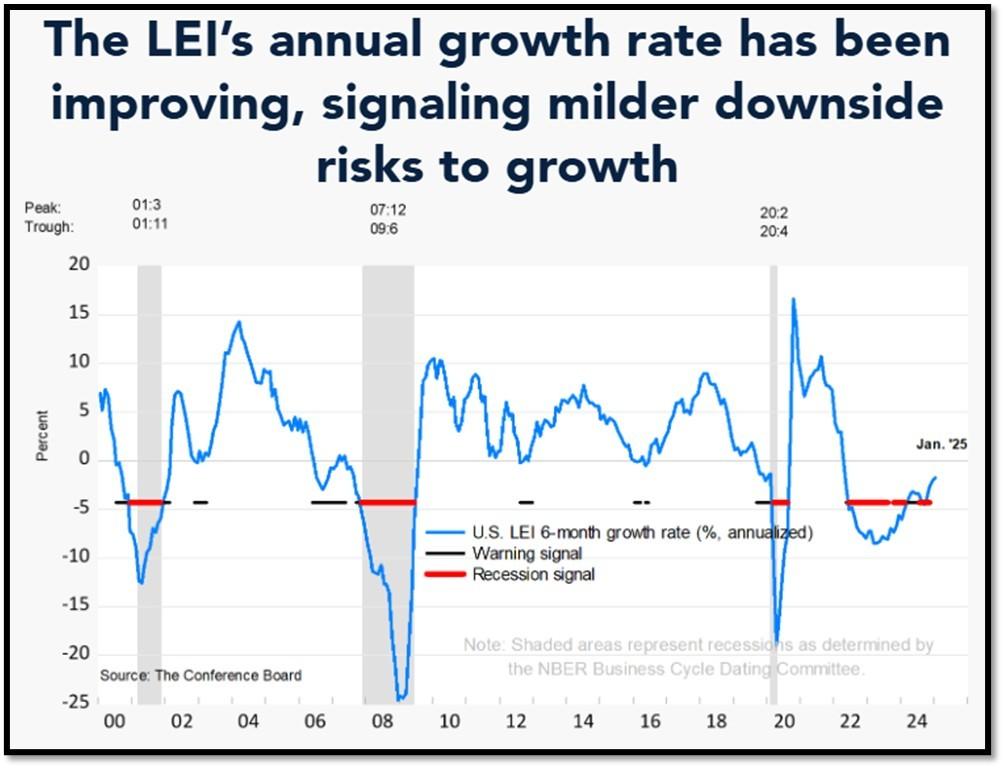
5E. (2/20/2025) The Conference Board Leading Economic Index (LEI) for the US fell by 0.3% in January 2025 to 101.5 (2016=100), after a 0.1% increase in December 2024 (upwardly revised from an initially estimated decline of 0.1%). Overall, the LEI recorded a 0.9% decline in the six-month period ending January 2025, much less than its 1.7% decline over the previous six months. The composite economic indexes are the key elements in an analytic system designed to signal peaks and troughs in the business cycle. The indexes are constructed to summarize and reveal common turning points in the economy in a clearer and more convincing manner than any individual component. The CEI is highly correlated with real GDP. The LEI is a predictive variable that anticipates (or “leads”) turning points in the business cycle by around 7 months. Shaded areas denote recession periods or economic contractions. The dates above the shaded areas show the chronology of peaks and troughs in the business cycle. The ten components of The Conference Board Leading Economic Index® for the U.S. include: Average weekly hours in manufacturing; Average weekly initial claims for unemployment insurance; Manufacturers’ new orders for consumer goods and materials; ISM® Index of New Orders; Manufacturers’ new orders for nondefense capital goods excluding aircraft orders; Building permits for new private housing units; S&P 500® Index of Stock Prices; Leading Credit Index™; Interest rate spread (10-year Treasury bonds less federal funds rate); Average consumer expectations for business conditions. REF: ConferenceBoard, LEI Report for December (Released on 2/1/2025)

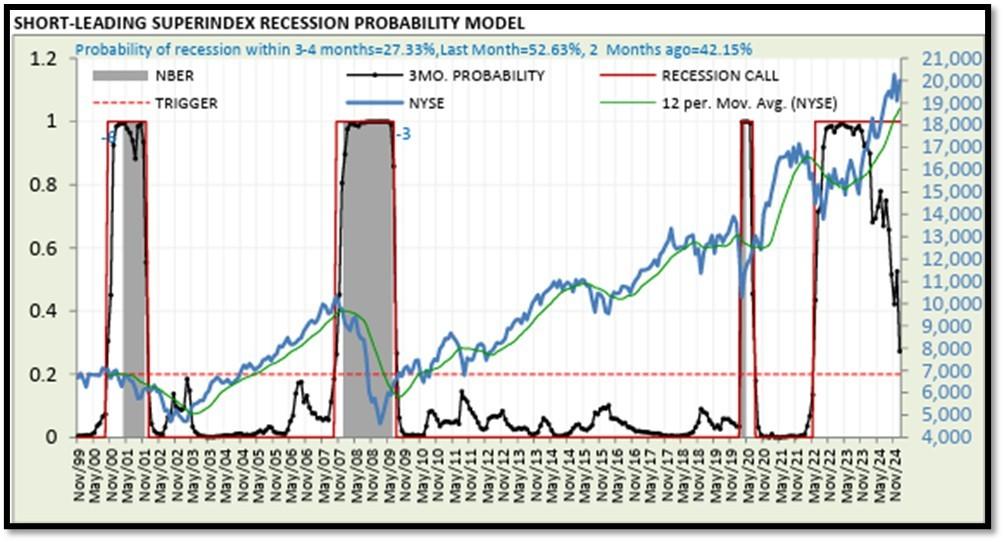
5F. Probability of U.S. falling into Recession within 3 to 4 months is currently at 27.33% (with data as of 02/16/2025 – Next Report 03/03/2025) according to RecessionAlert Research. Last release’s data was at 25.42%. This report is updated every two weeks. REF: RecessionAlertResearch
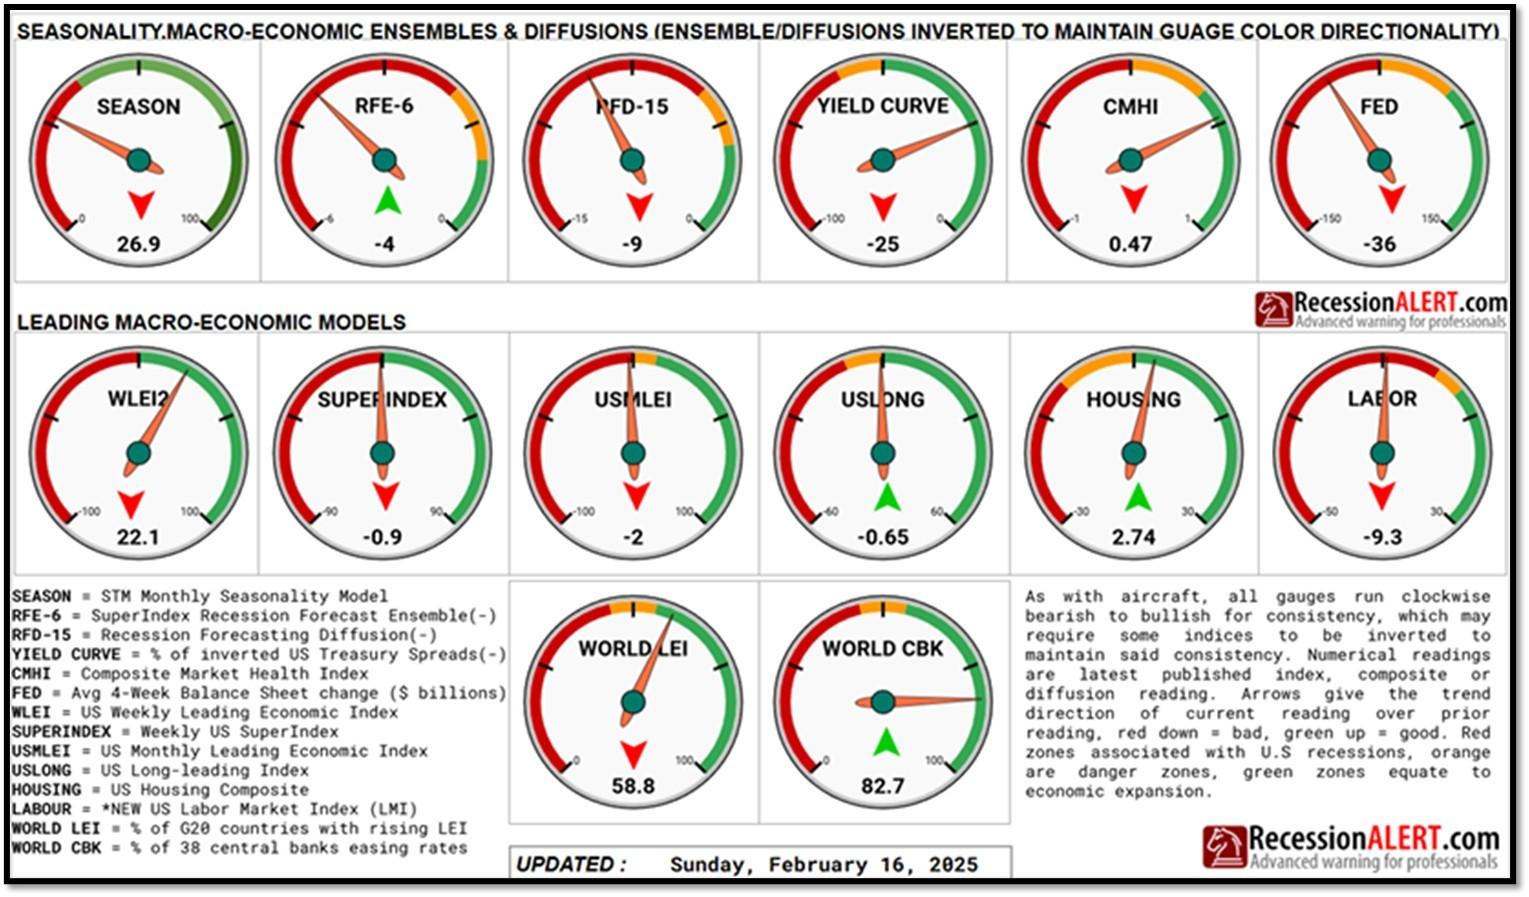
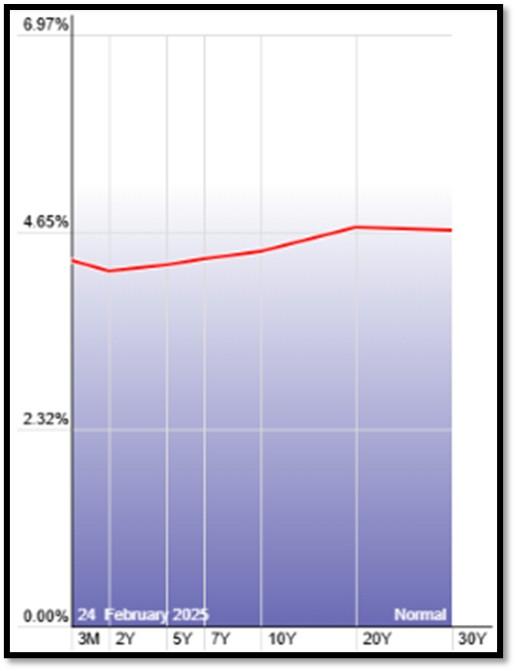
5G. Yield Curve as of 2/24/2025 is showing Normal. Spread on the 10-yr Treasury Yield (4.38%) minus yield on the 2-yr Treasury Yield (4.15%) is currently at 23 bps. REF: Stockcharts The yield curve—specifically, the spread between the interest rates on the ten-year Treasury note and the three-month Treasury bill—is a valuable forecasting tool. It is simple to use and significantly outperforms other financial and macroeconomic indicators in predicting recessions two to six quarters ahead. REF: NYFED
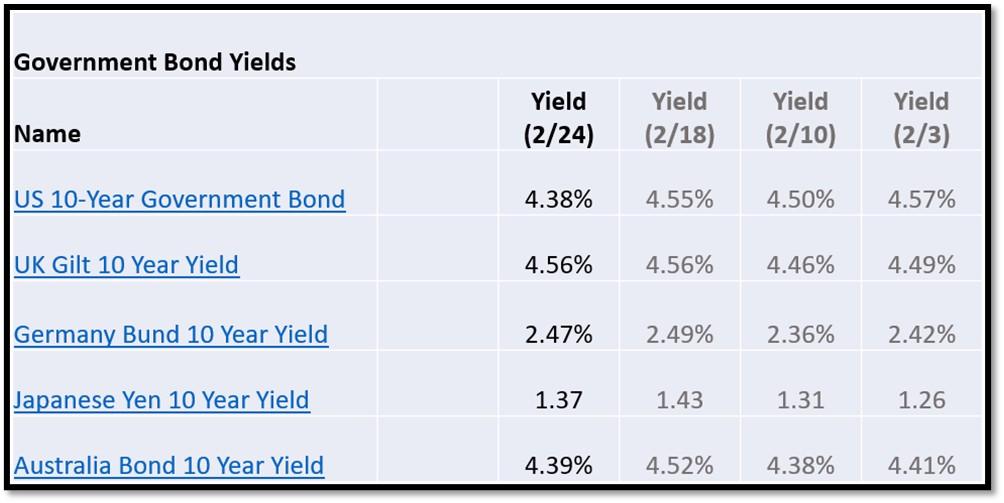
5H. Recent Yields in 10-Year Government Bonds. REF: Source is from Bloomberg.com, dated 2/24/2025, rates shown below are as of 2/24/2025, subject to change.
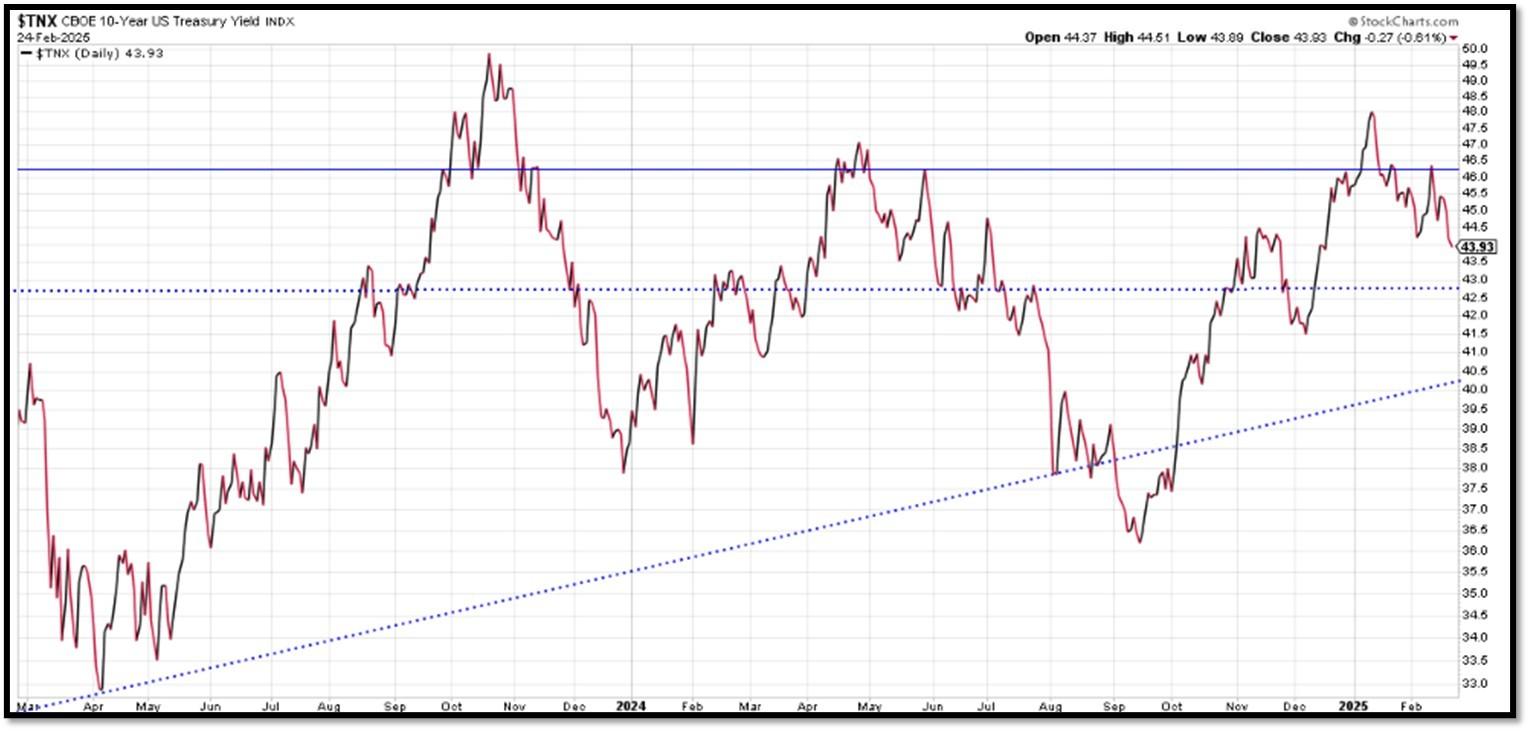
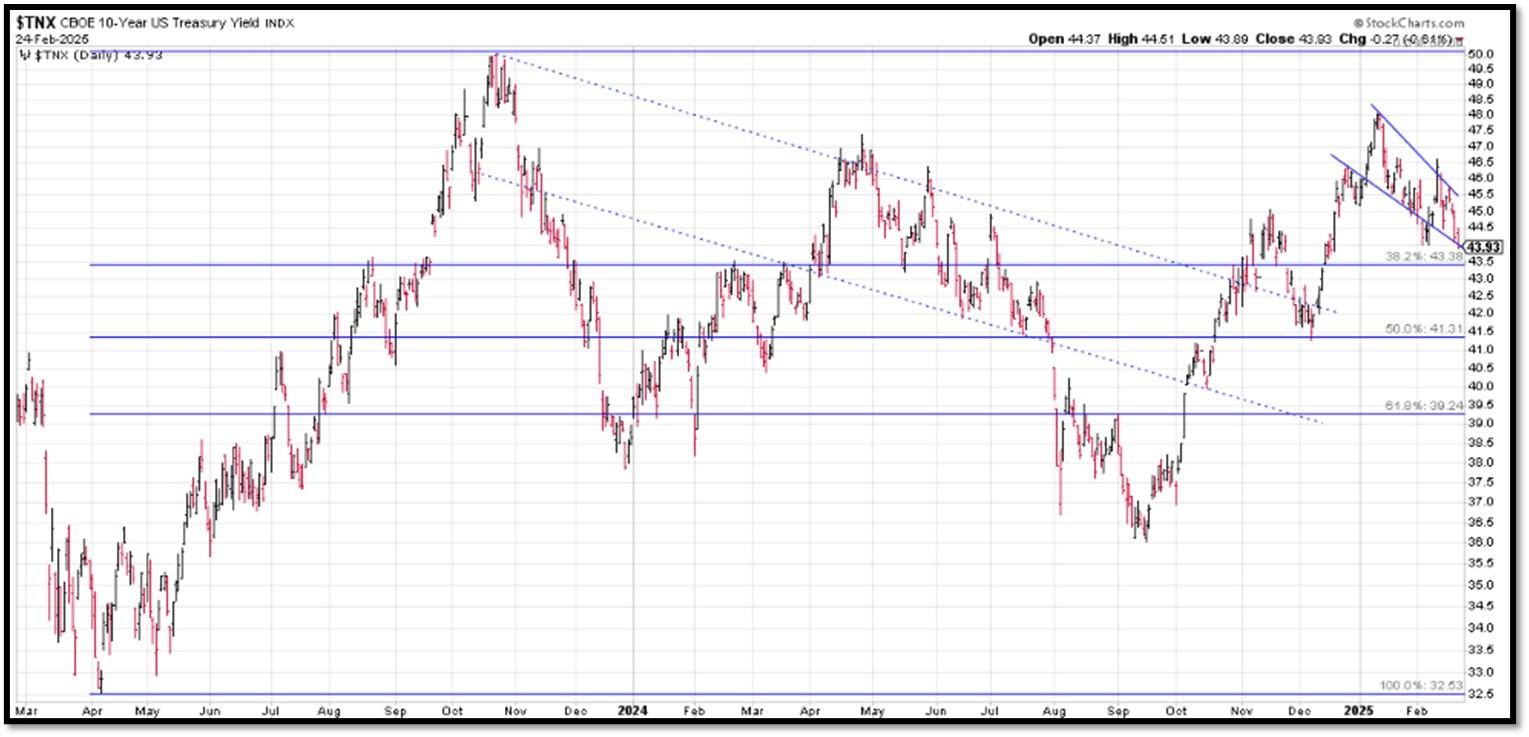
The 10-Year US Treasury Yield… REF: StockCharts1, StockCharts2
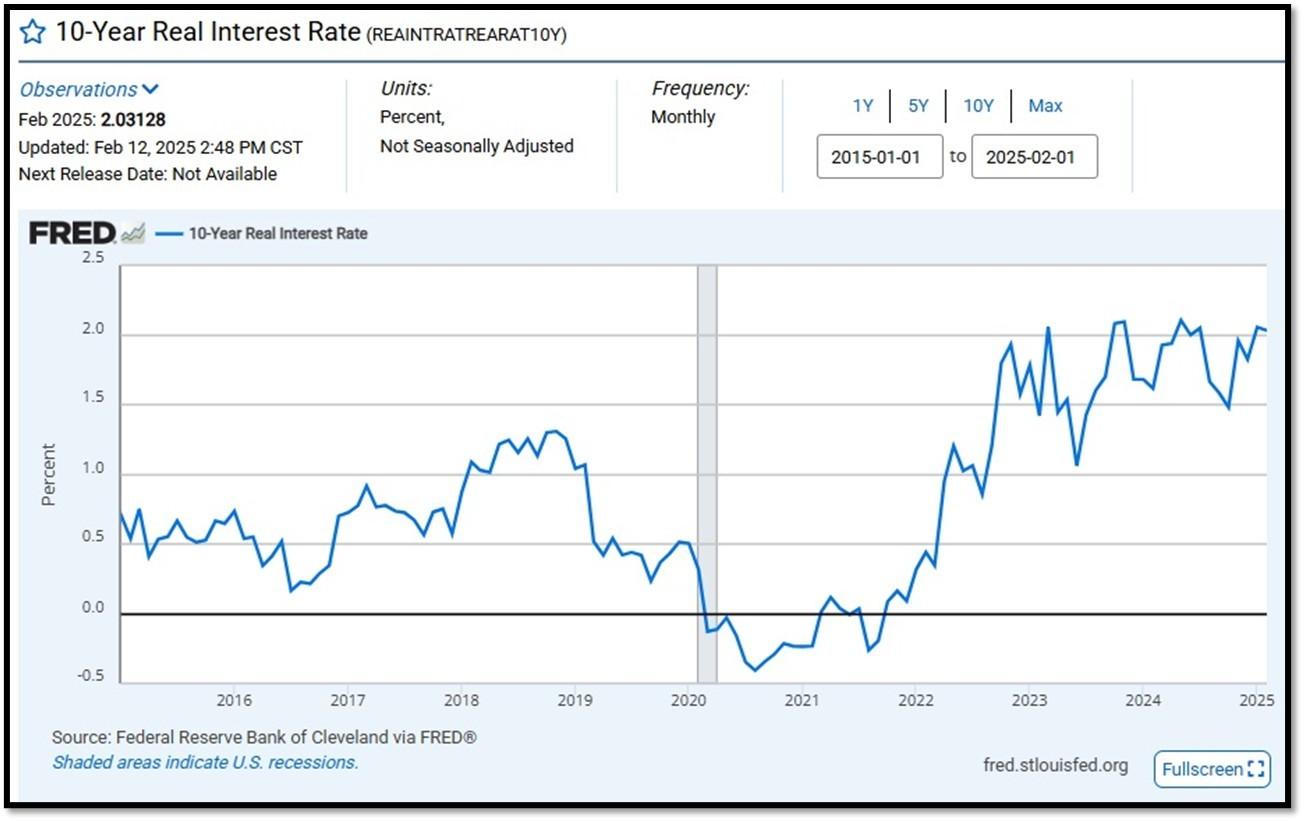
10-Year Real Interest Rate at 2.03128% as of 2/12/25. REF: REAINTRATREARAT10Y
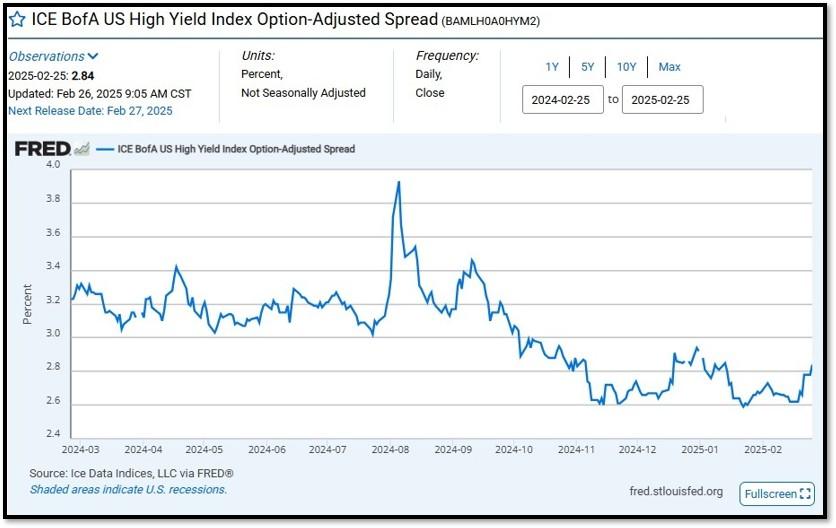
ICE BofA US High Yield Index Option-Adjusted Spread (BAMLH0A0HYM2) currently at 2.84 as of February 26, 2025. REF: FRED-BAMLH0A0HYM2
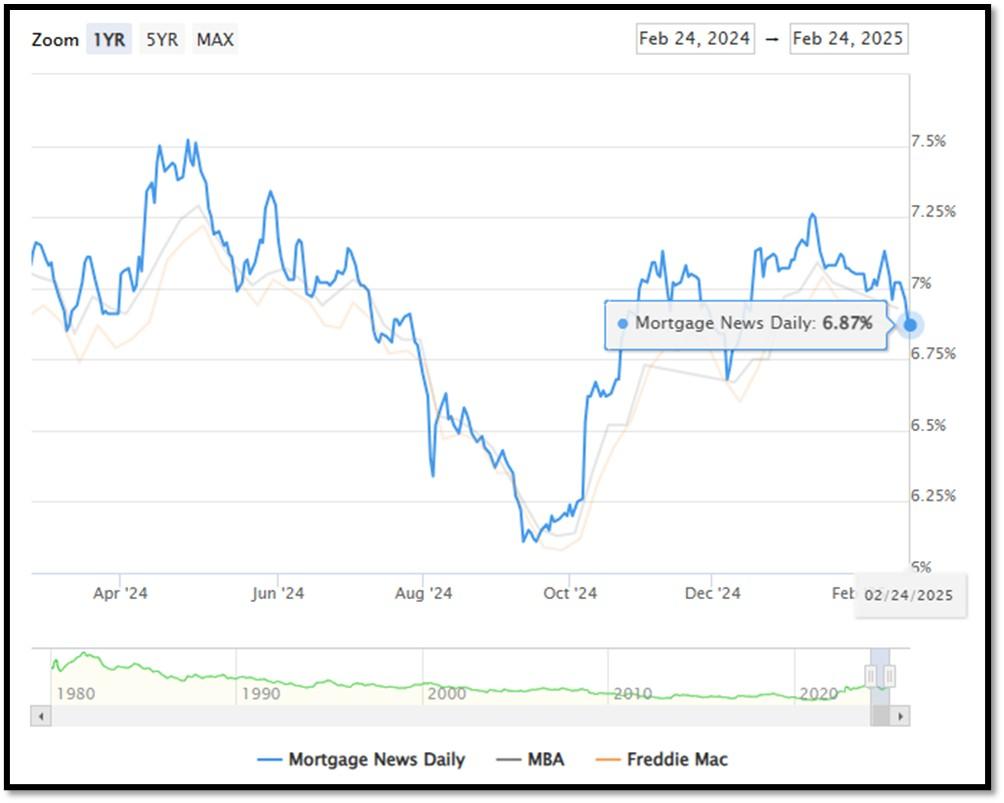
5I. (2/24/2025) Today’s National Average 30-Year Fixed Mortgage Rate is 6.87% (All Time High was 8.03% on 10/19/23). Last week’s data was 7.01%. This rate is the average 30-year fixed mortgage rates from several different surveys including Mortgage News Daily (daily index), Freddie Mac (weekly survey), Mortgage Bankers Association (weekly survey) and FHFA (monthly survey). REF: MortgageNewsDaily, Today’s Average Rate
The recent spike in the 30-year fixed-rate jumbo mortgage to 6.87%, compared to Freddie Mac’s rate at 6.85% and the Mortgage Bankers Association (MBA) rate at 6.93%, highlights key differences in the mortgage market. Jumbo mortgages, which exceed the conforming loan limits set by government agencies like Freddie Mac, typically carry higher interest rates because they are riskier for lenders. These loans are not backed by government entities, which increases the risk for lenders and, consequently, leads to higher rates. In contrast, Freddie Mac and MBA provide averages for conforming loans, which meet federal guidelines and have lower risk due to government backing, keeping their rates lower.
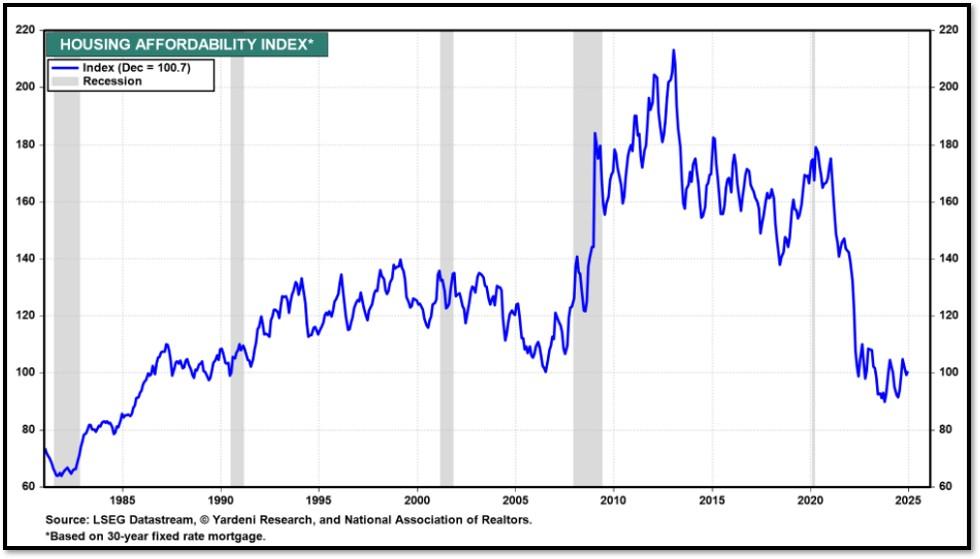
(2/10/25) Housing Affordability Index for Dec = 100.7 // Nov = 99 // Oct = 102.3 // Sep = 105.5 // Aug = 98.6 // July = 95 // June = 93.3 // May = 93.1 // April = 95.9 // March = 101.1 // February = 103.0. Data provided by Yardeni Research. REF: Yardeni

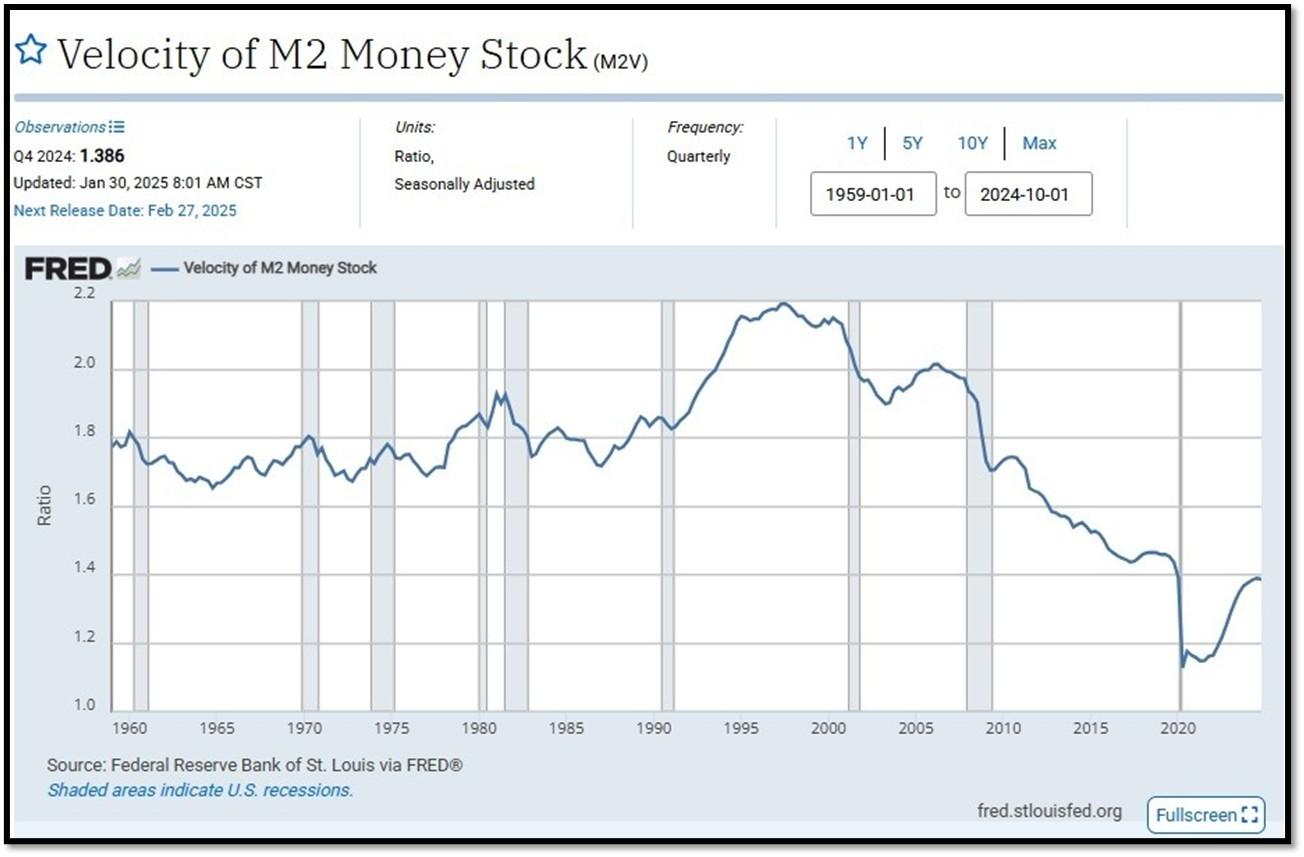
5J. Velocity of M2 Money Stock (M2V) with current read at 1.386 as of (Q4-2024 updated 1/30/2025). Previous quarter’s data was 1.390. The velocity of money is the frequency at which one unit of currency is used to purchase domestically- produced goods and services within a given time period. In other words, it is the number of times one dollar is spent to buy goods and services per unit of time. If the velocity of money is increasing, then more transactions are occurring between individuals in an economy. Current Money Stock (M2) report can be viewed in the reference link. REF: St.LouisFed-M2V
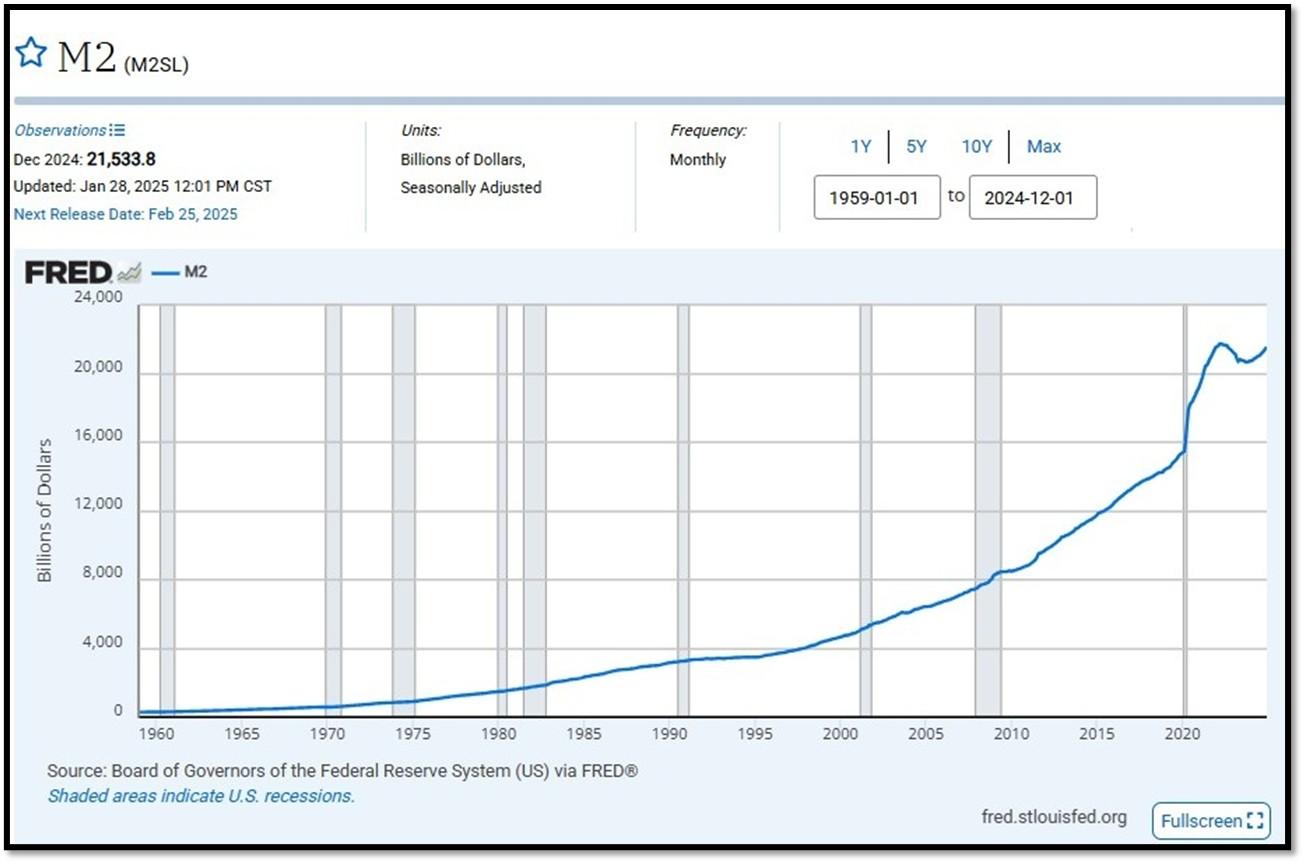
M2 consists of M1 plus (1) small-denomination time deposits (time deposits in amounts of less than $100,000) less IRA and Keogh balances at depository institutions; and (2) balances in retail MMFs less IRA and Keogh balances at MMFs. Seasonally adjusted M2 is constructed by summing savings deposits (before May 2020), small-denomination time deposits, and retail MMFs, each seasonally adjusted separately, and adding this result to seasonally adjusted M1. Board of Governors of the Federal Reserve System (US), M2 [M2SL], retrieved from FRED, Federal Reserve Bank of St. Louis; Updated on January 28, 2025. REF: St.LouisFed-M2
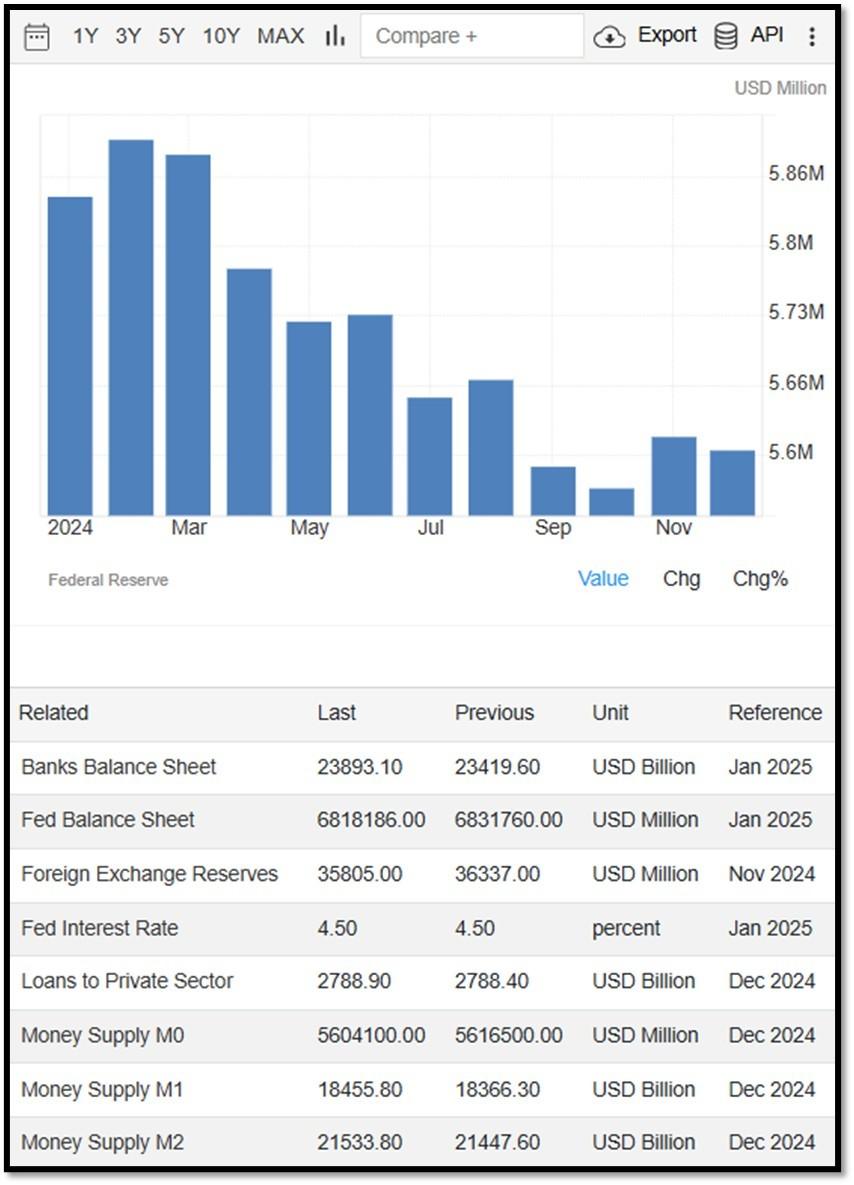
Money Supply M0 in the United States decreased to 5,604,100 USD Million in December from 5,616,500 USD Million in November of 2024. Money Supply M0 in the United States averaged 1,166,283.21 USD Million from 1959 until 2024, reaching an all-time high of 6,413,100.00 USD Million in December of 2021 and a record low of 48,400.00 USD Million in February of 1961. REF: TradingEconomics, M0
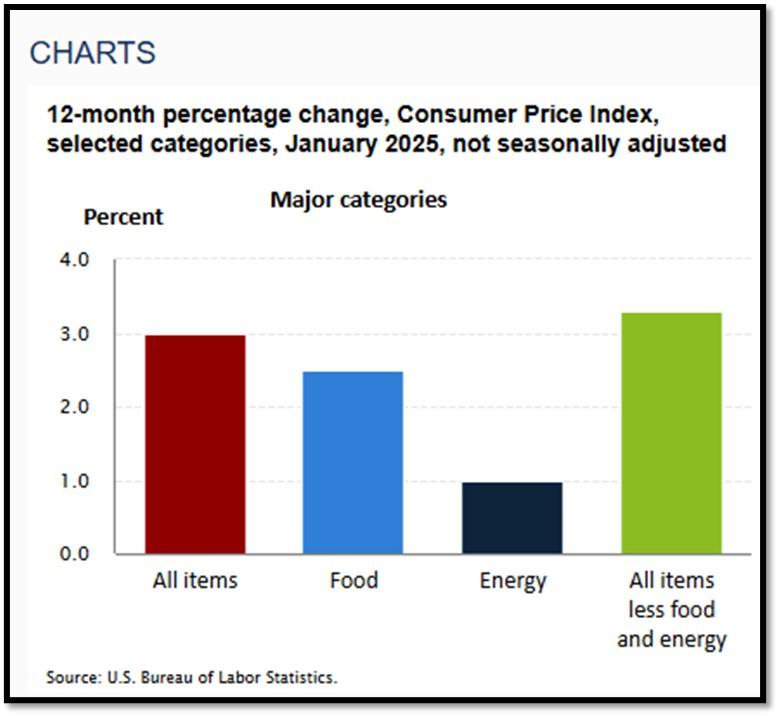
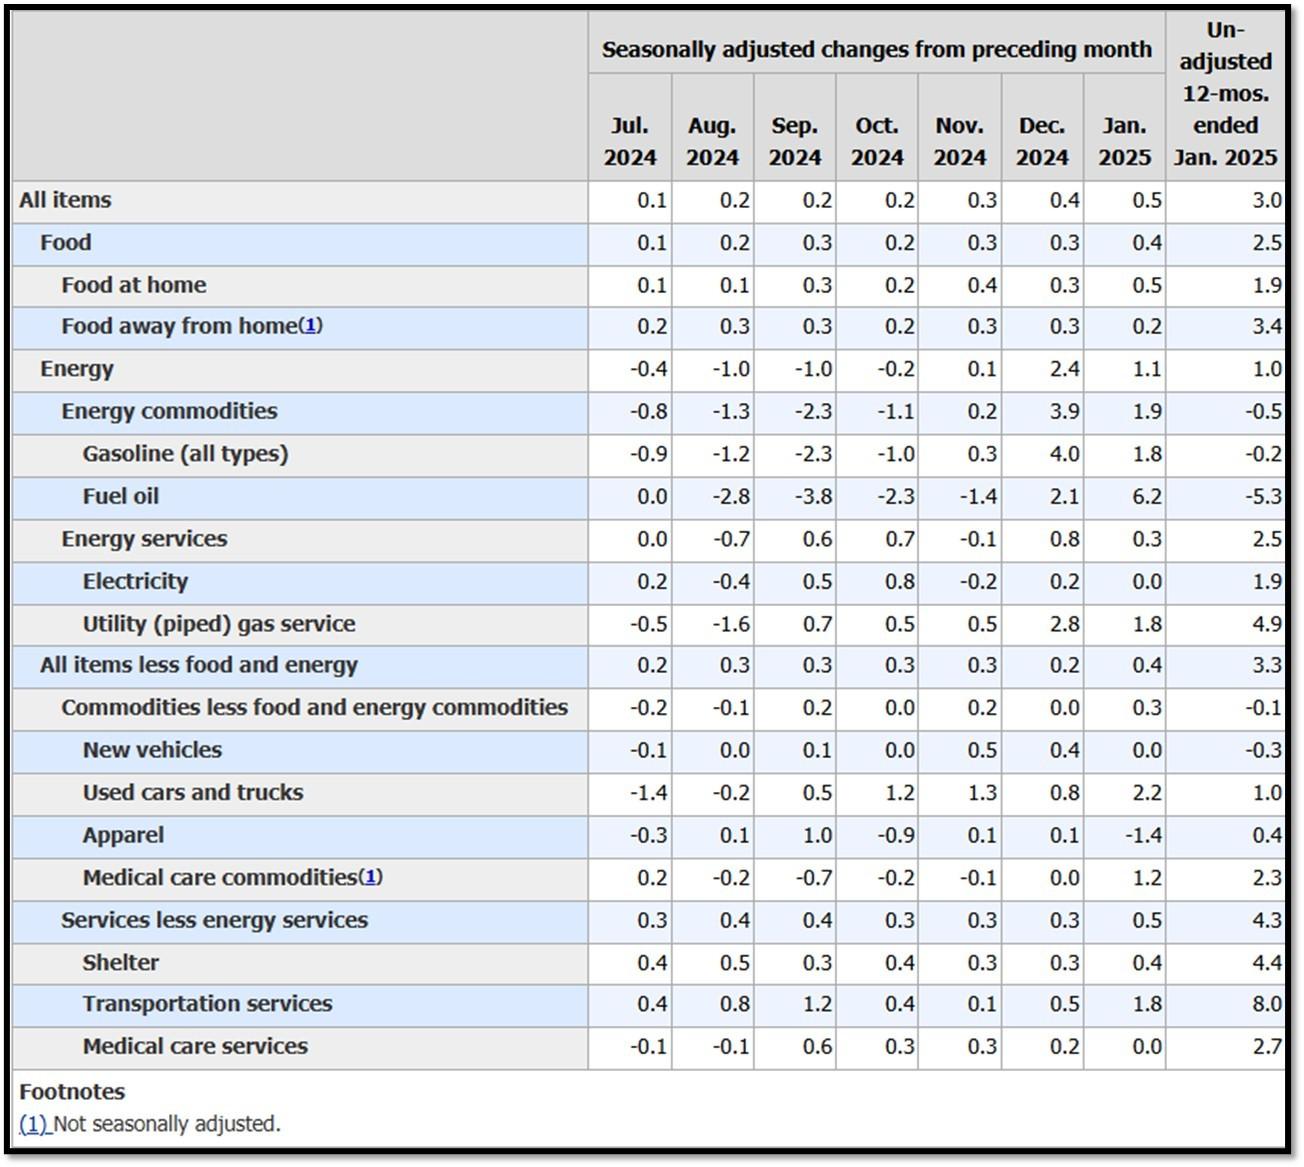
5K. In January, the Consumer Price Index for All Urban Consumers rose 0.5 percent, seasonally adjusted, and rose 3.0 percent over the last 12 months, not seasonally adjusted. The index for all items less food and energy increased 0.4 percent in January (SA); up 3.3 percent over the year (NSA). February 2025 CPI data are scheduled to be released on March 12, 2025, at 8:30AM-ET. REF: BLS, BLS.GOV
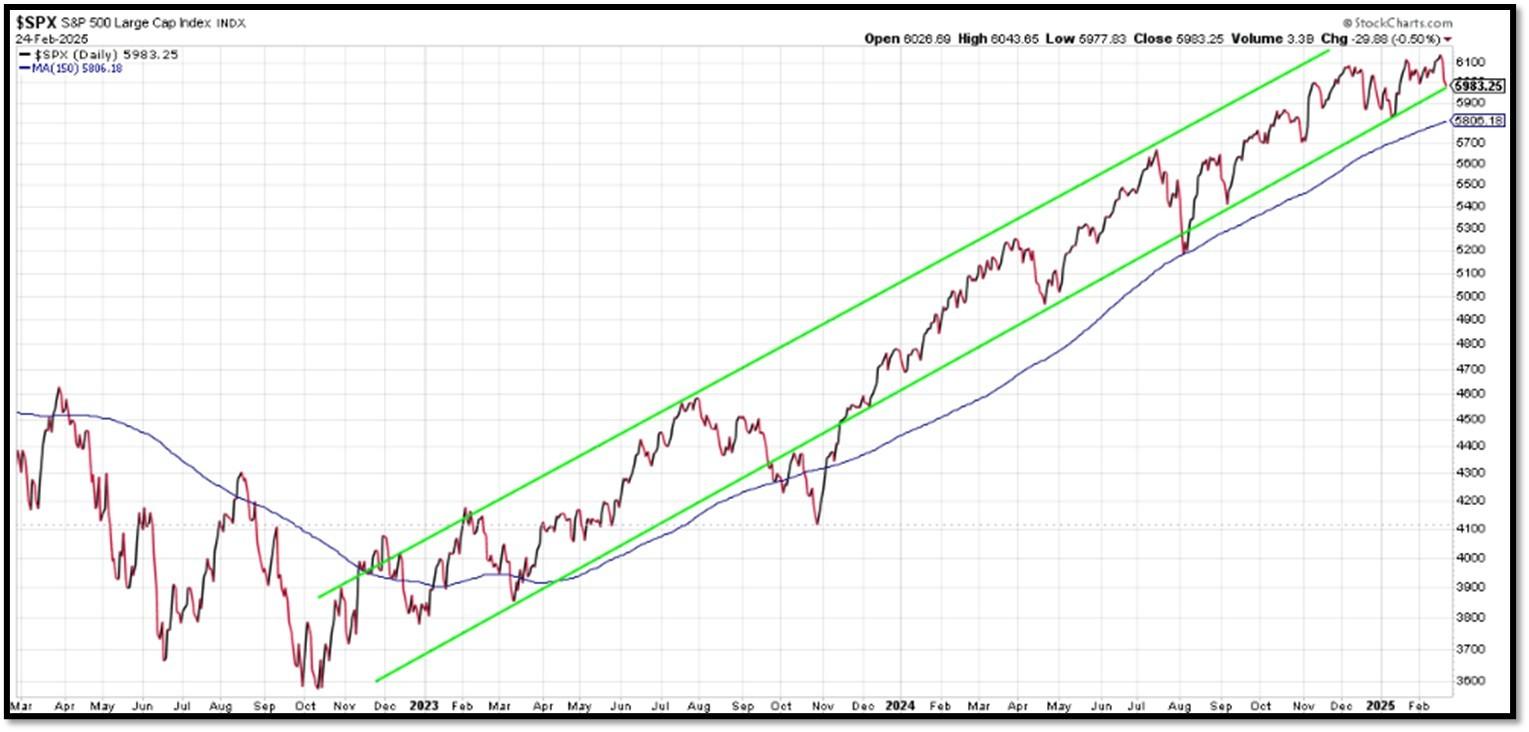
5L. Technical Analysis of the S&P500 Index. Click onto reference links below for images.
- Short-term Chart: Trend Neutral on 2/24/2025 – REF: Short-term S&P500 Chart by Marc Slavin (Click Here to Access Chart)
- Medium-term Chart: Trend Bullish on 2/24/2025 – REF: Medium-term S&P500 Chart by Marc Slavin (Click Here to Access Chart)
- Market Timing Indicators – S&P500 Index as of 2/24/2025 – REF: S&P500 Charts (7 of them) by Joanne Klein’s Top 7 (Click Here to Access Updated Charts)
- A well-defined uptrend channel shown in green with S&P500 still on up trend. REF: Stockcharts
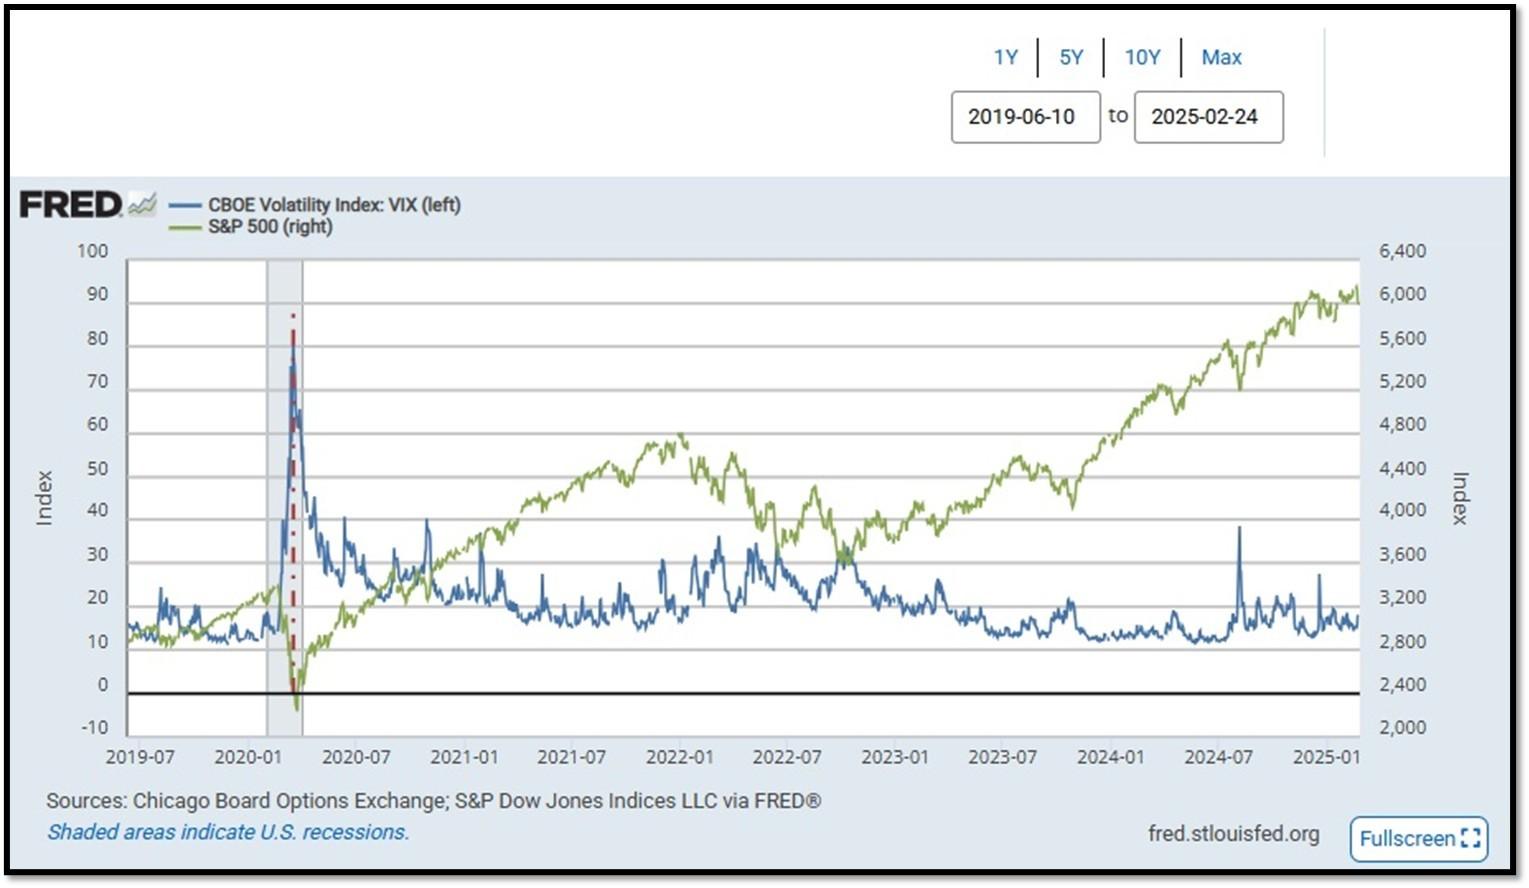
- S&P500 and CBOE Volatility Index (VIX) as of 2/24/2025. REF: FRED, Today’s Print
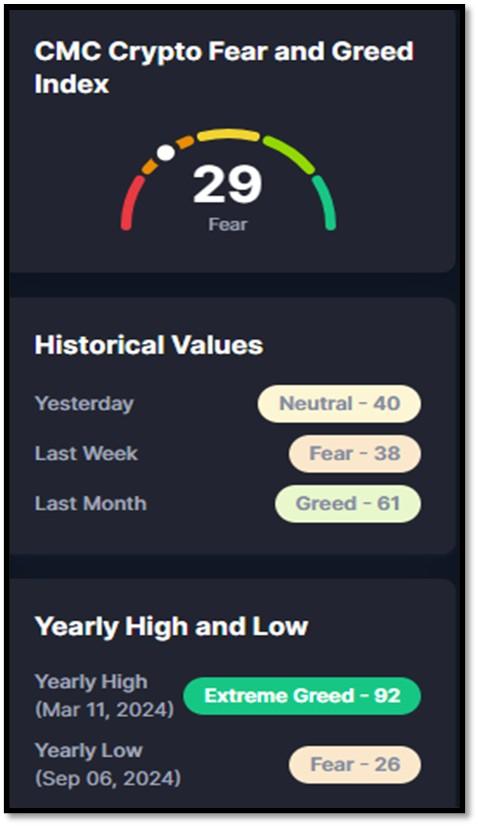
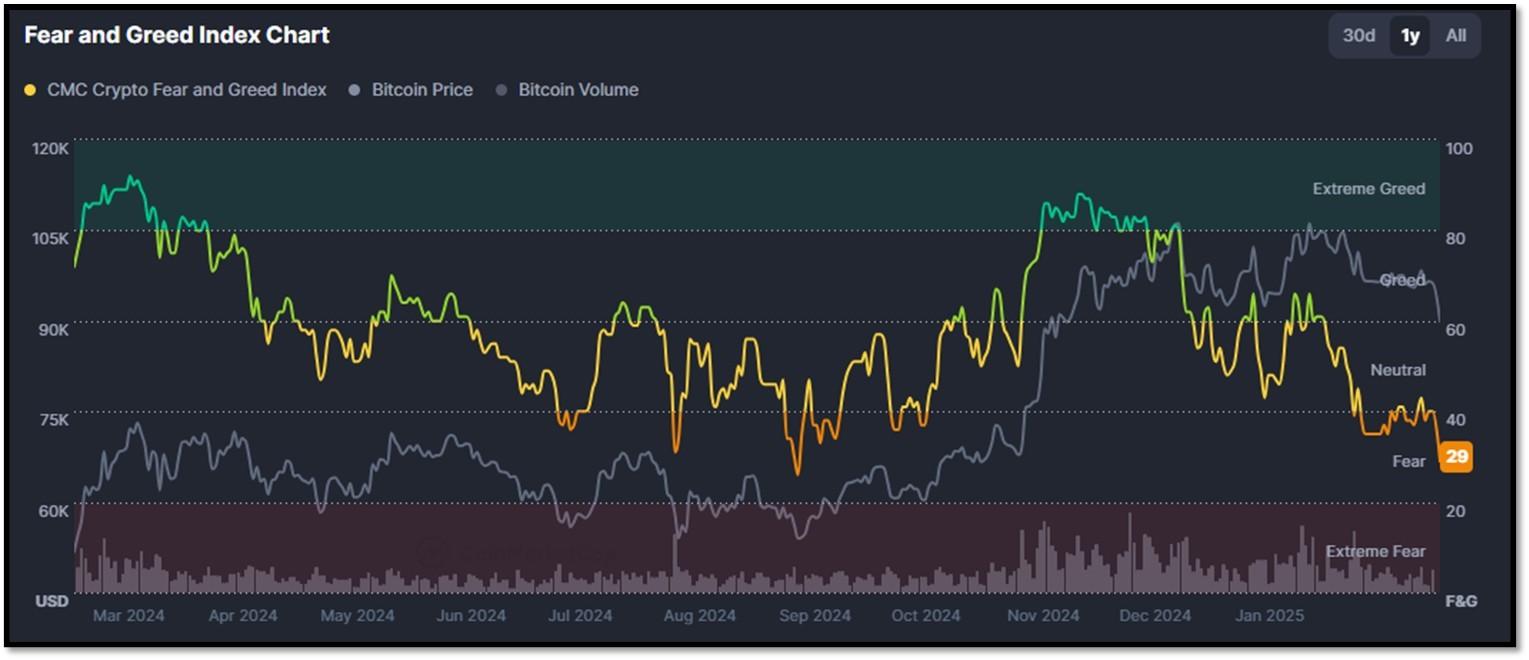
5M. Most recent read on the Crypto Fear & Greed Index with data as of 2/24/2025 is 29 (Fear). Last week’s data was 38 (Fear) (1-100). Fear & Greed Index – A Contrarian Data. The crypto market behavior is very emotional. People tend to get greedy when the market is rising which results in FOMO (Fear of missing out). Also, people often sell their coins in irrational reaction of seeing red numbers. With the Crypto Fear and Greed Index, the data try to help save investors from their own emotional overreactions. There are two simple assumptions:
- Extreme fear can be a sign that investors are too worried. That could be a buying opportunity.
- When Investors are getting too greedy, that means the market is due for a correction.
Therefore, the program for this index analyzes the current sentiment of the Bitcoin market and crunch the numbers into a simple meter from 0 to 100. Zero means “Extreme Fear”, while 100 means “Extreme Greed”. REF: Coinmarketcap.com, Today’sReading
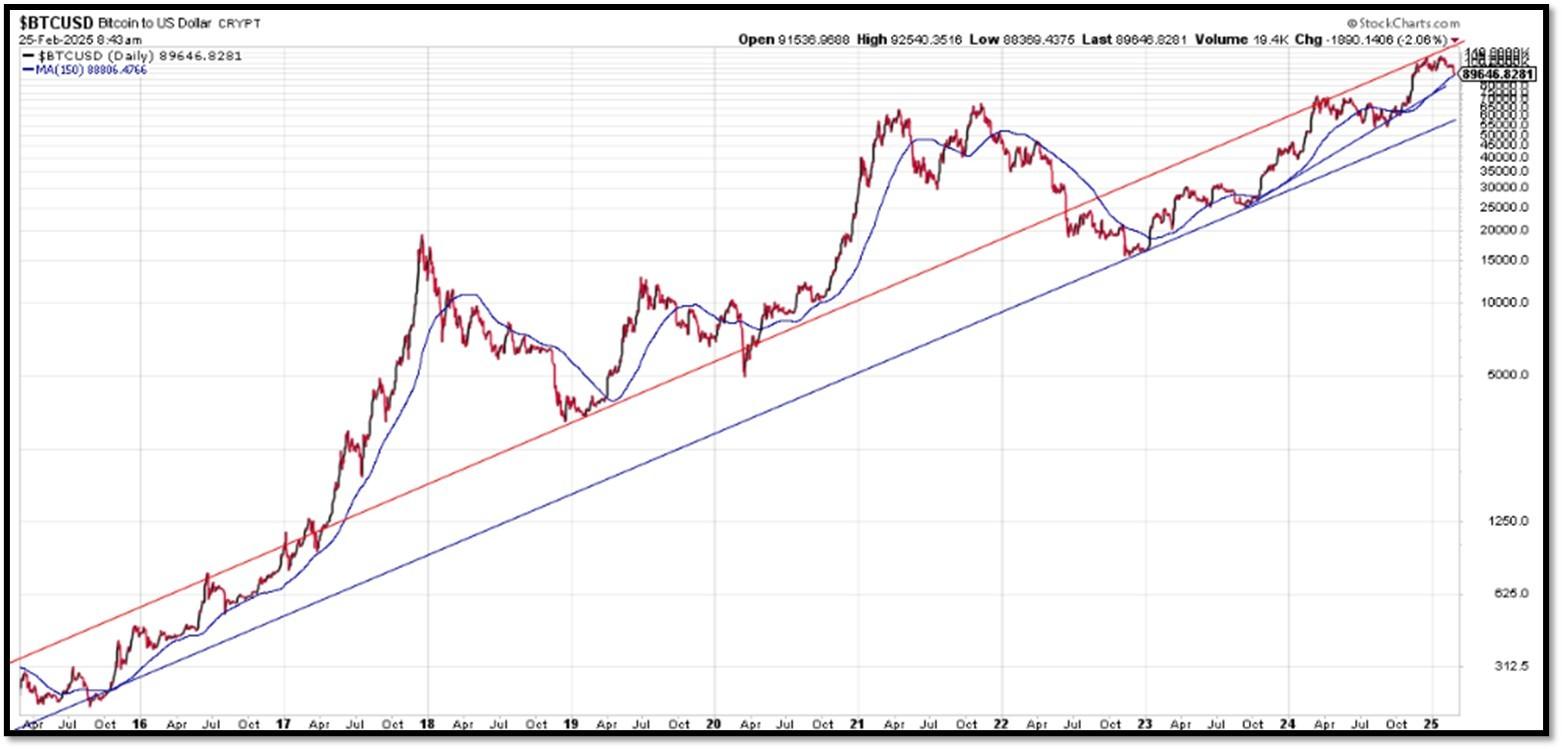
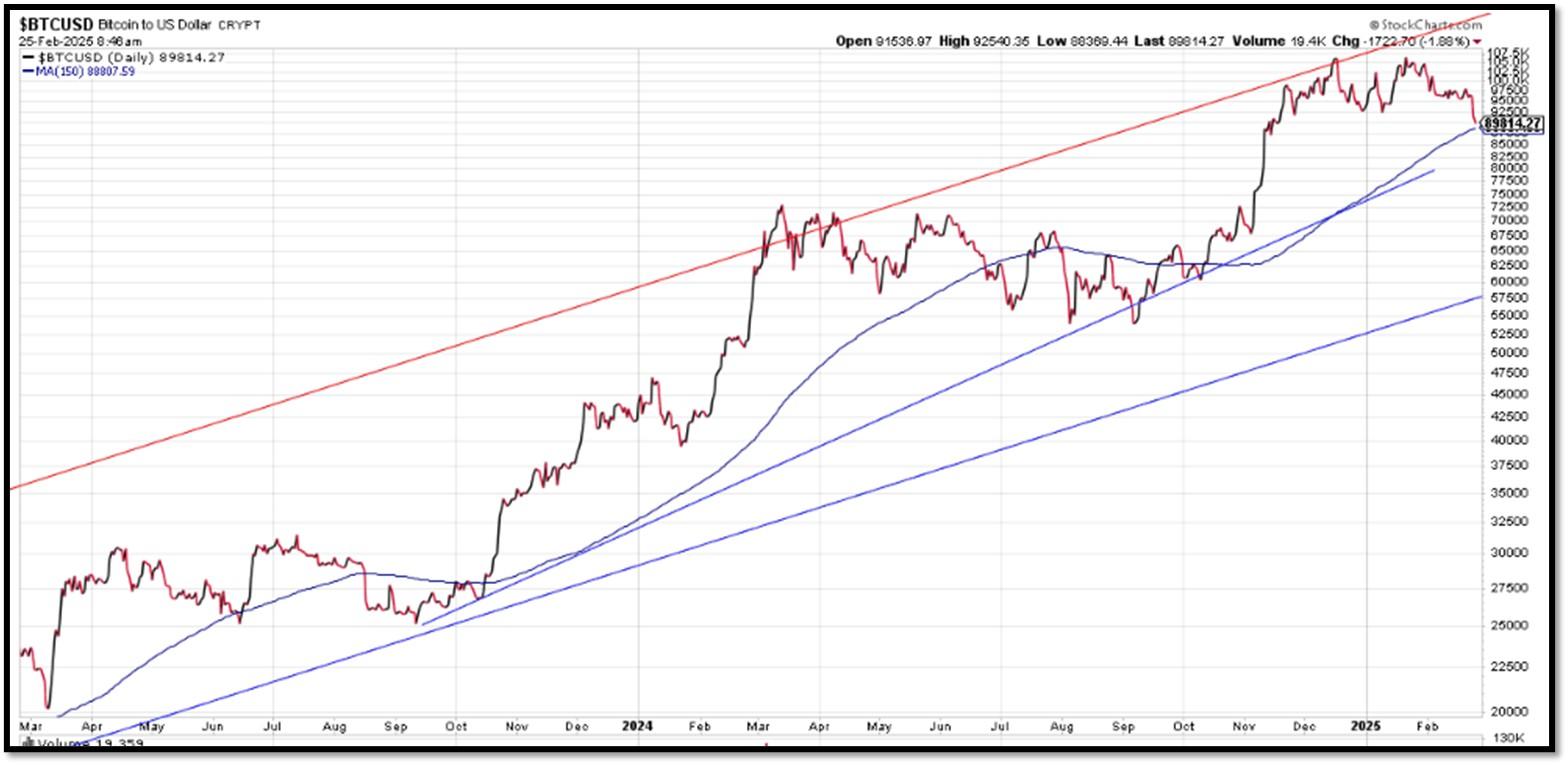
Bitcoin – 10-Year & 2-Year Charts. REF: Stockcharts10Y, Stockcharts2Y

Len writes much of his own content, and also shares helpful content from other trusted providers like Turner Financial Group (TFG).
The material contained herein is intended as a general market commentary, solely for informational purposes and is not intended to make an offer or solicitation for the sale or purchase of any securities. Such views are subject to change at any time without notice due to changes in market or economic conditions and may not necessarily come to pass. This information is not intended as a specific offer of investment services by Dedicated Financial and Turner Financial Group, Inc.
Dedicated Financial and Turner Financial Group, Inc., do not provide tax, legal or accounting advice. You should consult your own tax, legal and accounting advisors before engaging in any transaction.
Any hyperlinks in this document that connect to Web Sites maintained by third parties are provided for convenience only. Turner Financial Group, Inc. has not verified the accuracy of any information contained within the links and the provision of such links does not constitute a recommendation or endorsement of the company or the content by Dedicated Financial or Turner Financial Group, Inc. The prices/quotes/statistics referenced herein have been obtained from sources verified to be reliable for their accuracy or completeness and may be subject to change.
Past performance is no guarantee of future returns. Investing involves risk and possible loss of principal capital. The views and strategies described herein may not be suitable for all investors. To the extent referenced herein, real estate, hedge funds, and other private investments can present significant risks, including loss of the original amount invested. All indexes are unmanaged, and an individual cannot invest directly in an index. Index returns do not include fees or expenses.
Turner Financial Group, Inc. is an Investment Adviser registered with the United States Securities and Exchange Commission however, such registration does not imply a certain level of skill or training and no inference to the contrary should be made. Additional information about Turner Financial Group, Inc. is also available at www.adviserinfo.sec.gov. Advisory services are only offered to clients or prospective clients where Turner Financial Group, Inc. and its representatives are properly licensed or exempt from licensure. No advice may be rendered by Turner Financial Group, Inc. unless a client service agreement is in place.