- 1. The World Economic Forum’s Annual Meeting in Davos, held from January 20 to 24, 2025, convenes global leaders to address pressing global and regional challenges under the theme “Collaboration for the Intelligent Age.”
- 2. As of January 23, 2025, gold is experiencing a notable upward trend, with spot prices reaching an 11-week high of $2,751.89 per ounce.
- **With the current macro-economic backdrop, below are areas we currently favor:
- 3. DeepSeek is an advanced data discovery and analysis platform developed by a pioneering Chinese Hangzhou-based startup specializing in artificial intelligence and big data analytics.
- 4. World Watch
- 5. Quant & Technical Corner
1. The World Economic Forum’s Annual Meeting in Davos, held from January 20 to 24, 2025, convenes global leaders to address pressing global and regional challenges under the theme “Collaboration for the Intelligent Age.”
A central focus is the rapid advancement of artificial intelligence (AI). Discussions explore AI’s potential to boost productivity and living standards, while also addressing concerns about its impact on employment and privacy. Notably, Spain’s Prime Minister Pedro Sánchez warns that tech billionaires could threaten democracy, advocating for regulations to ensure ethical AI deployment.
Economic growth and trade are also pivotal topics. With the International Monetary Fund projecting global growth to remain steady at 3.3% in 2025, leaders examine new sources of economic expansion and the implications of high public debt levels. The forum provides a platform for dealmaking and discussions on adjusting to new regulatory policies, especially in light of potential U.S. trade tariffs under President Donald Trump’s administration. Climate change and energy transition receive significant attention. Following 2024 being recorded as the hottest year on record, sessions emphasize accelerating progress towards climate and nature goals. Despite the U.S. issuing an executive order to withdraw from the Paris Agreement, participants express a commitment to continue decarbonization efforts, highlighting that climate action is now deeply entrenched in global agendas. Geopolitical tensions and the concept of a “geopolitical recession” are discussed, marked by increased polarization and reduced global cooperation. This environment poses challenges to addressing major global issues, necessitating collaborative efforts on cybercrime, pandemic preparedness, AI regulation, and climate change. Click onto picture below to access video. REF: WEForum, Bloomberg

2. As of January 23, 2025, gold is experiencing a notable upward trend, with spot prices reaching an 11-week high of $2,751.89 per ounce.
This surge is attributed to safe-haven demand amid uncertainties surrounding U.S. trade policies and a weakening dollar. Key Considerations for Owning Gold Now: REF: REUTERS
- Safe-Haven Asset: In times of geopolitical instability and economic uncertainty, gold serves as a reliable store of value, attracting investors seeking to safeguard their wealth.
- Portfolio Diversification: Gold’s low correlation with other financial assets makes it an effective tool for diversifying investment portfolios, thereby reducing overall risk.
- Inflation Hedge: With potential inflationary pressures due to fiscal policies and global economic dynamics, gold is traditionally viewed as a hedge against inflation, preserving purchasing power over time.
- Central Bank Demand: Increased gold purchases by central banks, especially in emerging markets, have reset price levels higher since 2022, indicating strong institutional confidence in gold’s value.

**With the current macro-economic backdrop, below are areas we currently favor:
- Fixed Income – Short-term Corporates (Low-Beta)
- Fixed Income – Corporates High Yield as Opportunistic Allocation (Low-Beta)
- Businesses that contribute to and benefit from AI & Automation (Market-Risk)
- Financials (Market-Risk)
- Small Cap & Mid Cap Stocks (Market-Risk)
- Utilities (Market-Risk)
- Healthcare & Biotechnology (Market-Risk)
- Gold (Market-Risk)
- Industrials (Market-Risk)
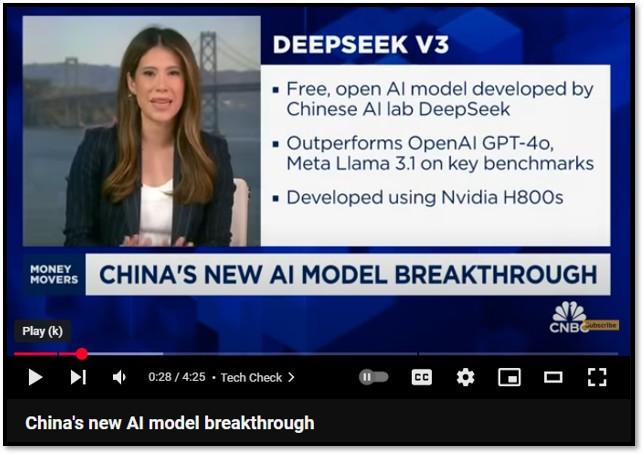
3. DeepSeek is an advanced data discovery and analysis platform developed by a pioneering Chinese Hangzhou-based startup specializing in artificial intelligence and big data analytics.
China is pursuing an open-source strategy and emerging as one of the biggest providers of powerful, fully open-source AI models in the world. Created to address the growing complexity of data management, it evolved through collaborations with global academic institutions and industry leaders, transforming into a powerful tool for uncovering patterns, insights, and trends across various industries. The platform leverages scalable cloud architecture, natural language processing (NLP), computer vision, and predictive analytics to enable real-time data analysis. Its user-friendly interface offers intuitive dashboards and customizable reports, making it accessible to both technical and non-technical users. APIs further allow seamless integration with existing systems, enhancing its versatility. Deepseek’s robust encryption and compliance with global standards like GDPR and HIPAA ensure data security, fostering trust among users. It has transformative applications in healthcare, finance, and cybersecurity, aiding in tasks like disease diagnosis, fraud detection, and risk mitigation.
According to AI expert Brian Roemmele, the free, open-source DeepSeek-AI R1 thinking model is “AGI-like.” Brian adds, “Since its release, we have tested it extensively, and it equals or surpasses OpenAI’s ChatGPT-4.0. This is the free model the world has been waiting for.” Click onto pictures below to access videos. REF: Forbes, Brian Roemmele, DeepSeek, GitHub


4. World Watch
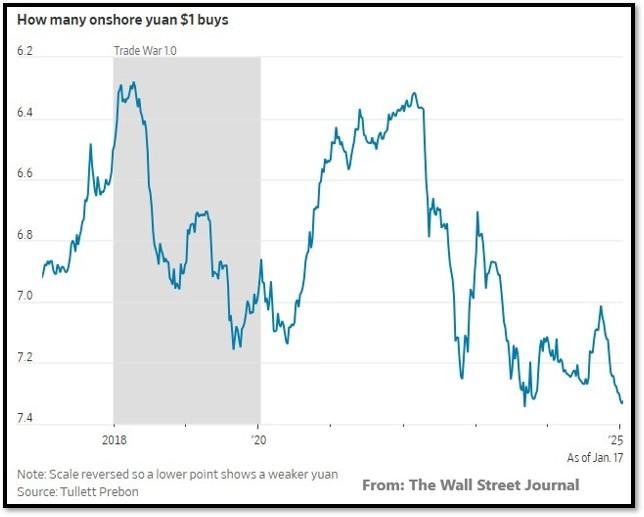
4A. In 2016, China countered U.S. tariffs by devaluing the renminbi (RMB), making exports more competitive and easing economic strain. However, recent reports from the Wall Street Journal indicate that China is now reluctant to devalue its currency. This shift stems from key factors. Devaluation risks triggering capital flight, straining China’s financial system already burdened by debt and a slow real estate market. It could also increase import costs, worsening inflation and harming domestic consumers. Additionally, China’s goal of promoting the RMB as a stable international currency would be undermined by devaluation, reducing global trust in its stability. Geopolitical tensions with the U.S. further discourage such a move, as it could escalate conflicts.
Instead, China is focusing on fiscal stimulus, structural reforms, and diversifying trade partnerships to navigate economic challenges. While devaluation was a viable strategy in 2016, the current context makes maintaining a stable currency more prudent, balancing domestic priorities with long-term global ambitions. Click onto picture below to access video. REF: WSJ
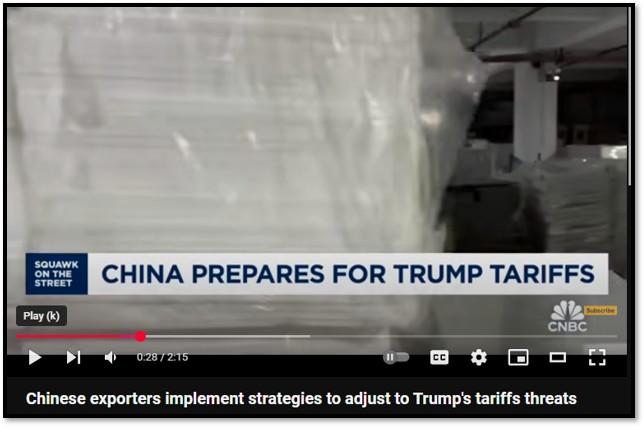
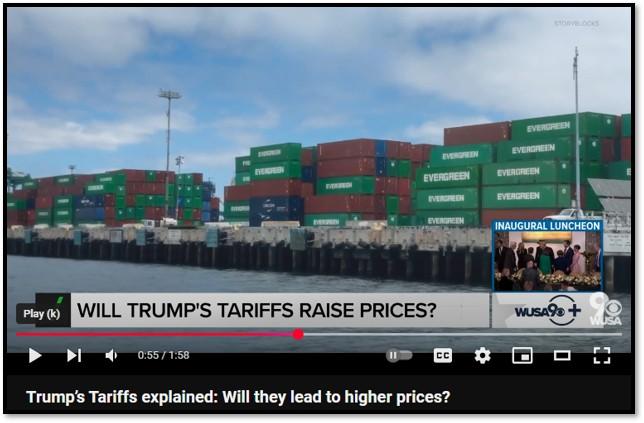
4B. President Donald Trump has strategically employed tariffs as a multifaceted tool to achieve various policy objectives beyond traditional trade concerns. By imposing or threatening tariffs, he aims to influence both economic and geopolitical outcomes. For instance, Trump has proposed a 10% tariff on Chinese imports, citing issues such as the shipment of fentanyl to the United States. This approach leverages economic measures to address public health concerns, using tariffs as a means to pressure China into taking action against the export of illegal substances. Additionally, Trump has threatened a 25% tariff on imports from Mexico and Canada, linking these tariffs to efforts to combat illegal immigration and drug trafficking. By connecting trade policies with security issues, he utilizes tariffs as leverage to encourage neighboring countries to strengthen their enforcement measures.
This strategy reflects a broader pattern in Trump’s use of tariffs as an economic weapon to further national security interests. As JPMorgan Chase CEO Jamie Dimon noted, while tariffs might lead to increased consumer prices, they can also serve as a tool with benefits for national security. This perspective underscores the administration’s willingness to accept certain economic costs in pursuit of broader strategic goals. Click onto picture below to access video. REF: Bloomberg

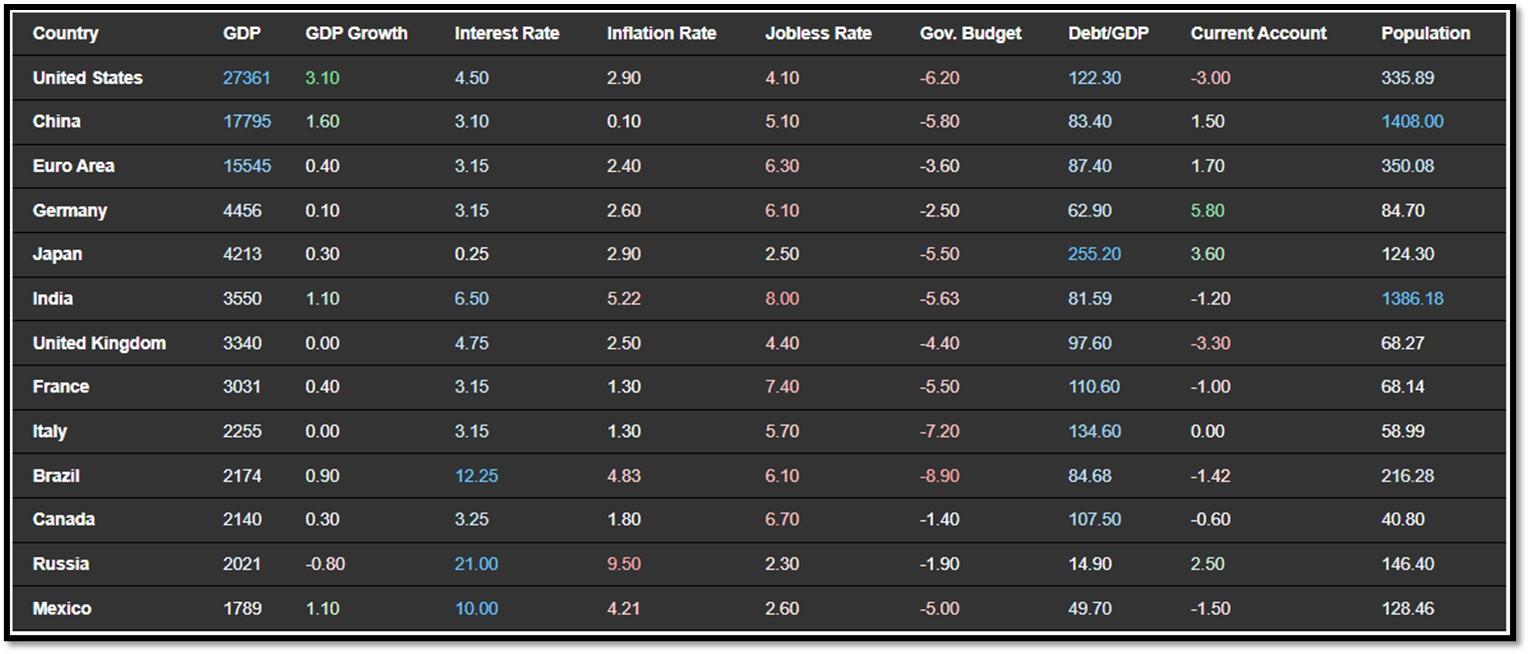
4C. Below is an updated snapshot of the current global state of economy according to TradingEconomics as of 1/21/2025. REF: TradingEconomics
- The annual inflation rate in the US rose for a 3rd consecutive month to 2.9% in December 2024 from 2.7% in November, in line with market expectations.
- The Chinese GDP grew by a seasonally adjusted 1.6% in Q4 2024, accelerating from an upwardly revised 1.3% rise in Q3 and marking the strongest quarterly increase since Q1 2023.
- China’s surveyed unemployment rate rose to 5.1% in December 2024, compared to market estimates and November’s reading of 5%.
- Annual inflation rate in the UK unexpectedly edged lower to 2.5% in December 2024 from 2.6% in November, below forecasts of 2.6%. However, it matched the BoE’s forecast from early November.
5. Quant & Technical Corner
Below is a selection of quantitative & technical data we monitor on a regular basis to help gauge the overall financial market conditions and the investment environment.
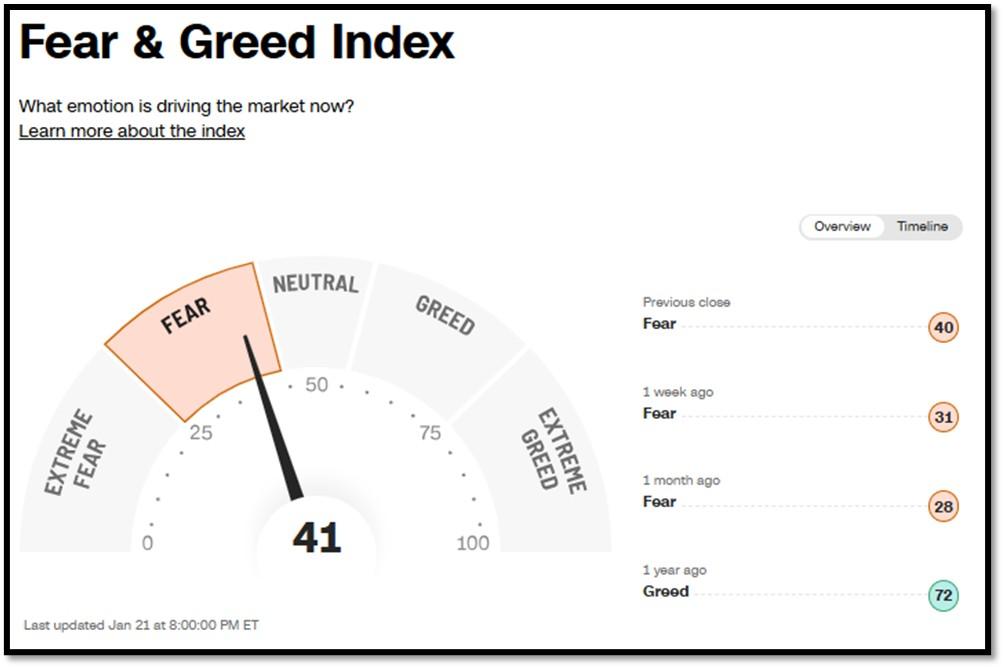
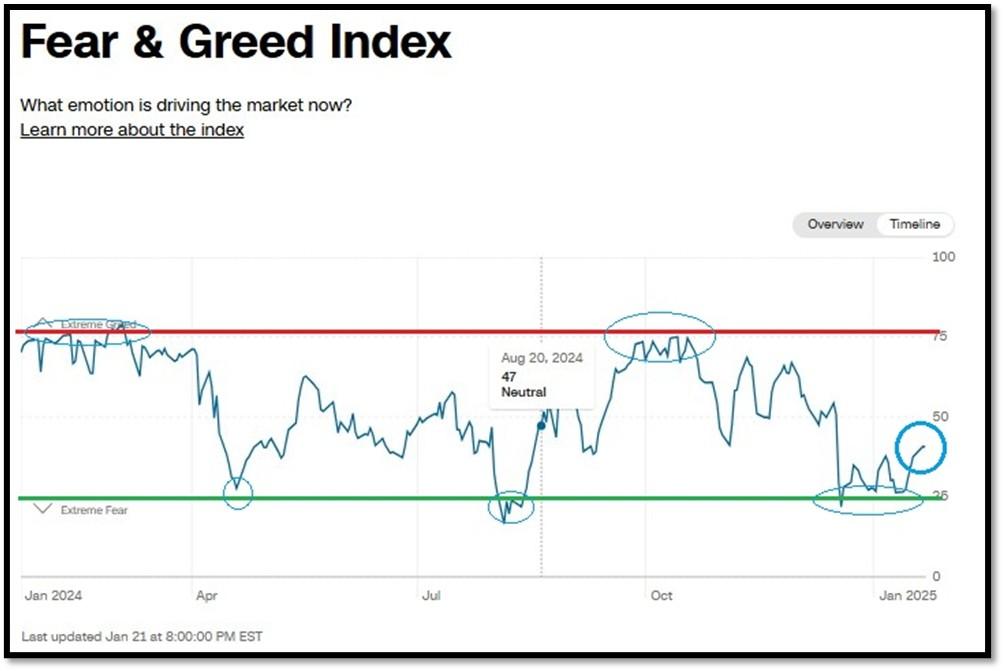
5A. Most recent read on the Fear & Greed Index with data as of 1/21/2024 – 8:00PM-ET is 41 (Fear). Last week’s data was 31 (Fear) (1-100). CNNMoney’s Fear & Greed index looks at 7 indicators (Stock Price Momentum, Stock Price Strength, Stock Price Breadth, Put and Call Options, Junk Bond Demand, Market Volatility, and Safe Haven Demand). Keep in mind this is a contrarian indicator! REF: Fear&Greed via CNNMoney
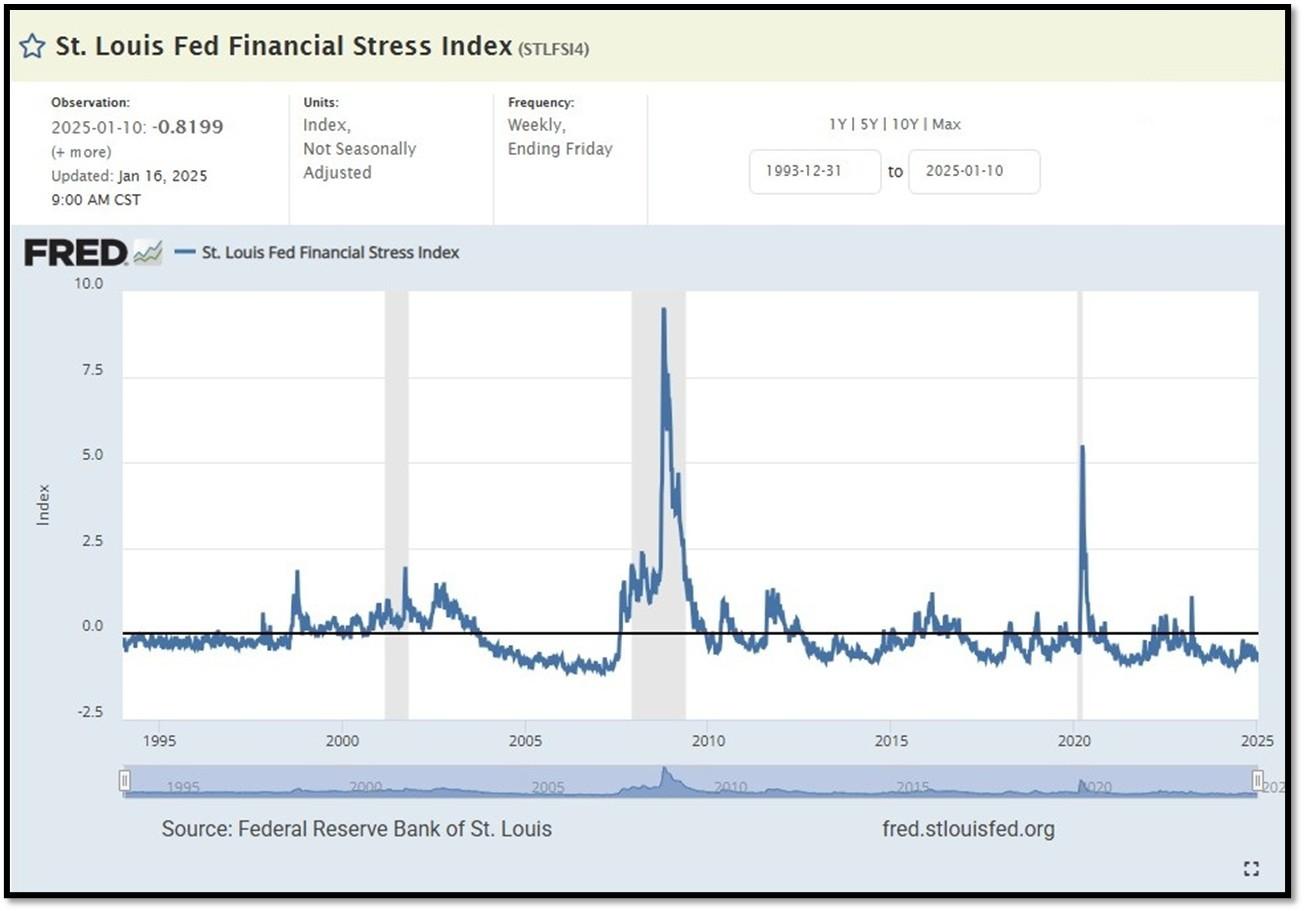
5B. St. Louis Fed Financial Stress Index’s (STLFSI4) most recent read is at –0.8199 as of January 16, 2025. A big spike up from previous readings reflecting the recent turmoil in the banking sector. Previous week’s data was -0.6291. This weekly index is not seasonally adjusted. The STLFSI4 measures the degree of financial stress in the markets and is constructed from 18 weekly data series: seven interest rate series, six yield spreads and five other indicators. Each of these variables captures some aspect of financial stress. Accordingly, as the level of financial stress in the economy changes, the data series are likely to move together. REF: St. Louis Fed
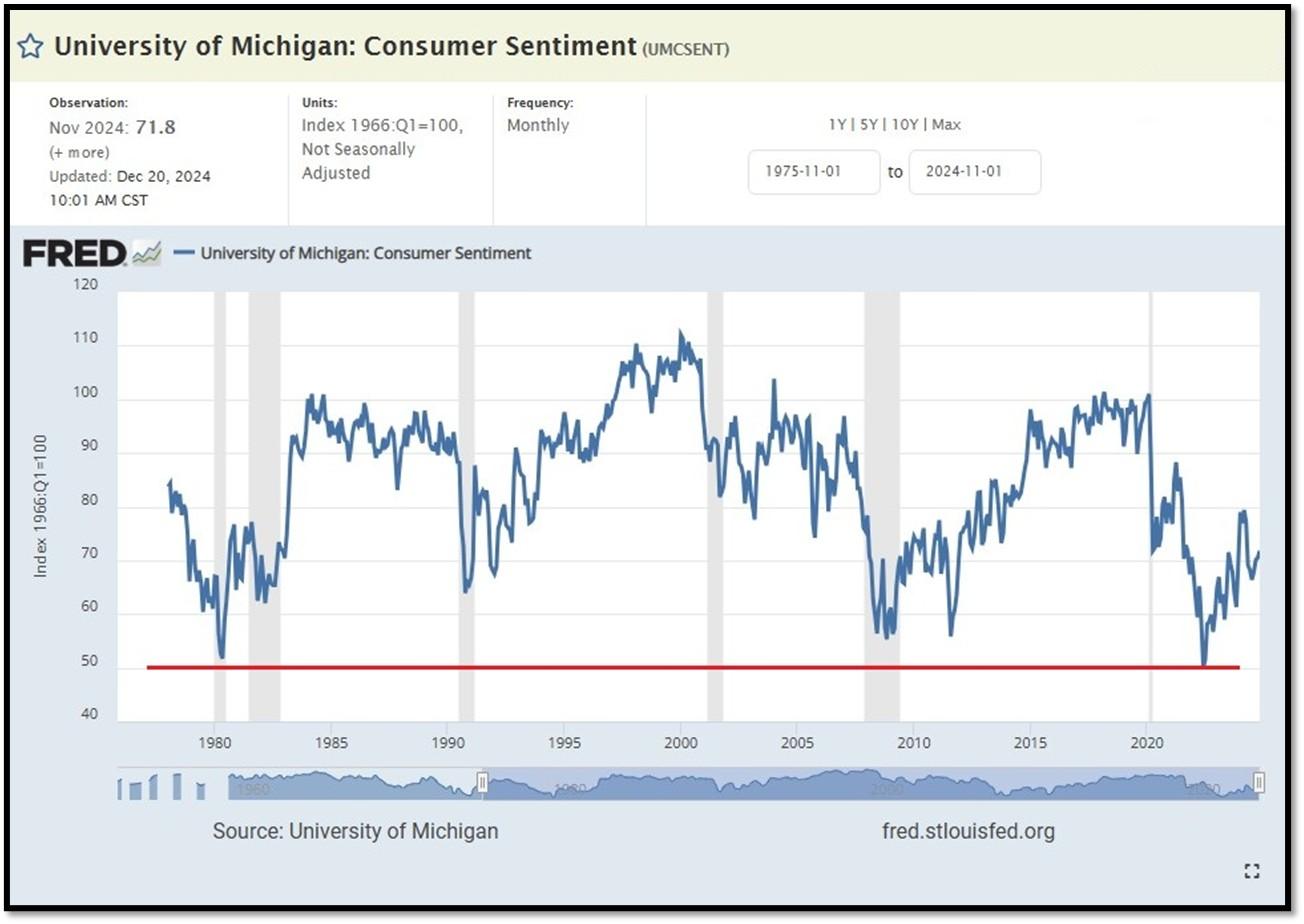
5C. University of Michigan, University of Michigan: Consumer Sentiment for September [UMCSENT] at 71.8, retrieved from FRED, Federal Reserve Bank of St. Louis, December 20, 2024. Back in June 2022, Consumer Sentiment hit a low point going back to April 1980. REF: UofM
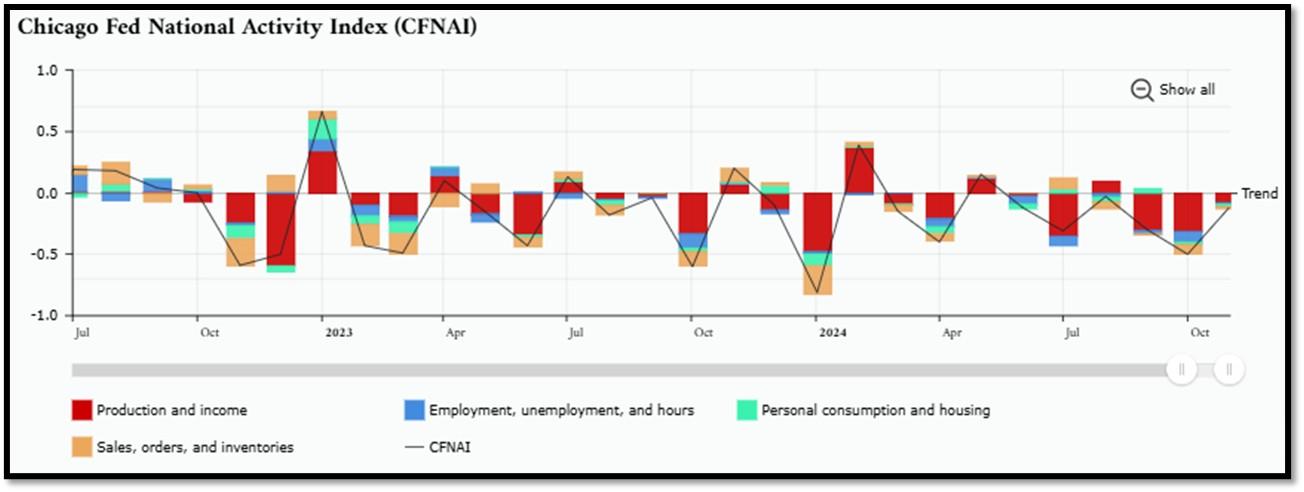
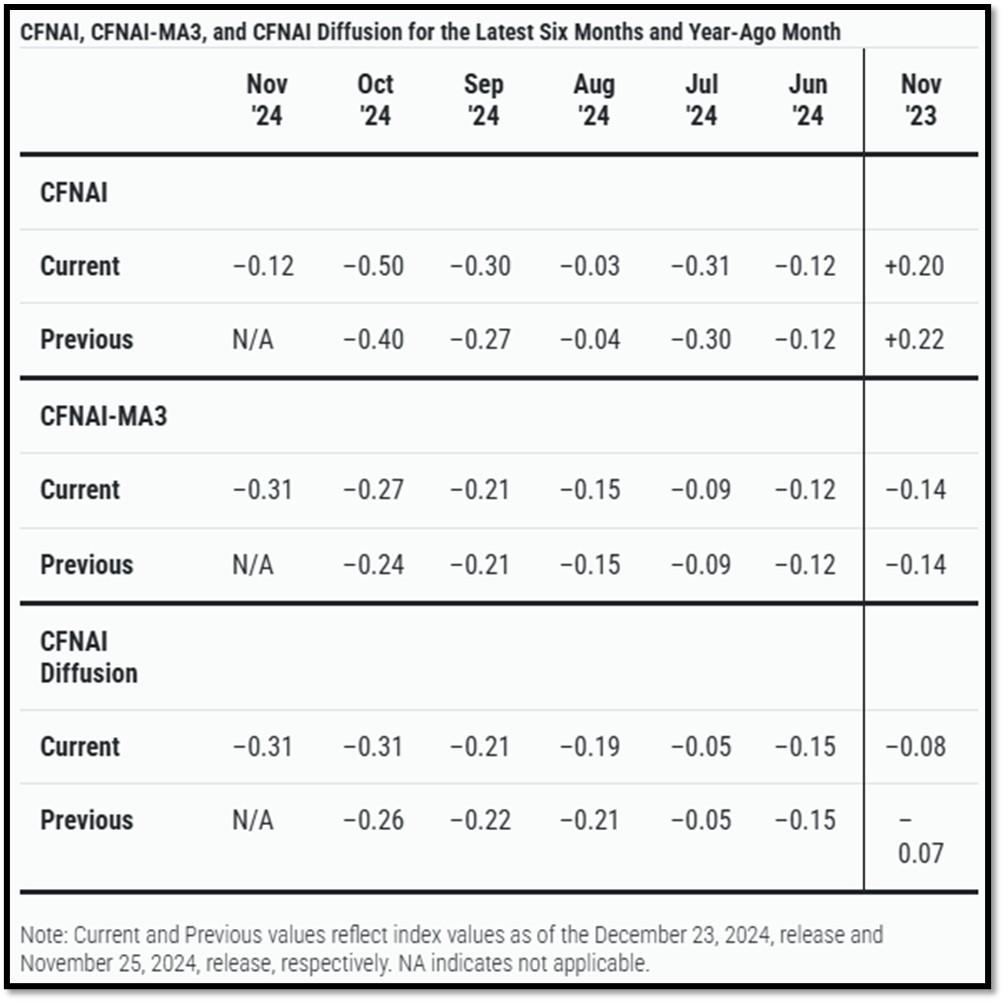
5D. The Chicago Fed National Activity Index (CFNAI) increased to –0.12 in November from –0.50 in October. Three of the four broad categories of indicators used to construct the index increased from October, but all four categories made negative contributions in November. The index’s three-month moving average, CFNAI-MA3, decreased to –0.31 in November from –0.27 in October. REF: ChicagoFed, November’s Report
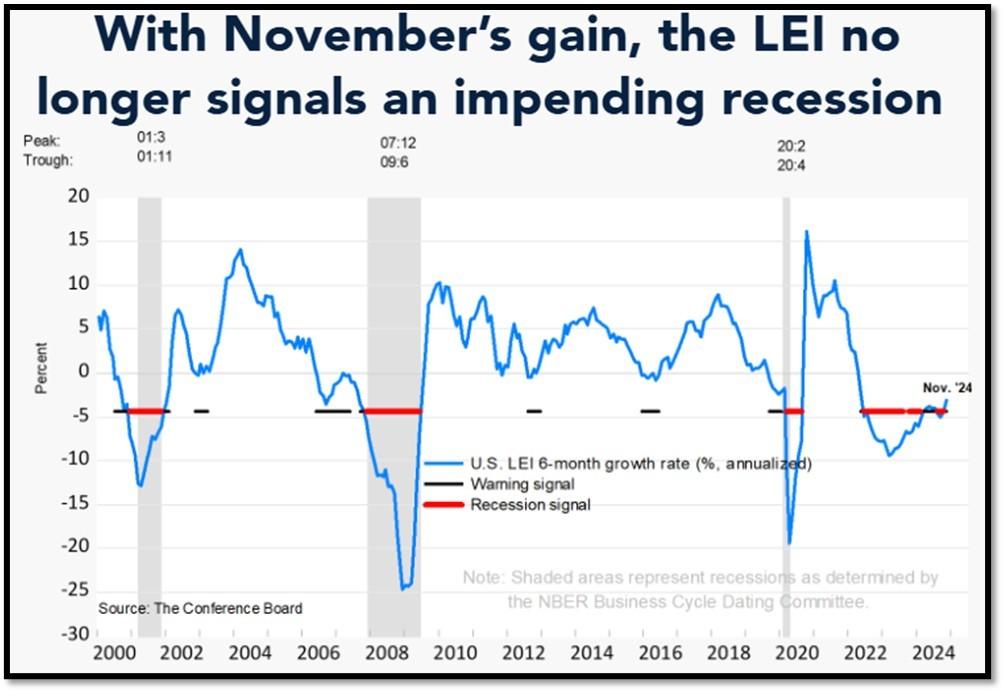
5E. (12/19/2024) The Conference Board Leading Economic Index (LEI) for the US increased by 0.3% in November 2024 to 99.7 (2016=100), nearly reversing its 0.4% decline in October. Over the six-month period between May and November 2024, the LEI declined by 1.6%, slightly less than its 1.9% decline over the previous six months (November 2023 to May 2024). The composite economic indexes are the key elements in an analytic system designed to signal peaks and troughs in the business cycle. The indexes are constructed to summarize and reveal common turning points in the economy in a clearer and more convincing manner than any individual component. The CEI is highly correlated with real GDP. The LEI is a predictive variable that anticipates (or “leads”) turning points in the business cycle by around 7 months. Shaded areas denote recession periods or economic contractions. The dates above the shaded areas show the chronology of peaks and troughs in the business cycle. The ten components of The Conference Board Leading Economic Index® for the U.S. include: Average weekly hours in manufacturing; Average weekly initial claims for unemployment insurance; Manufacturers’ new orders for consumer goods and materials; ISM® Index of New Orders; Manufacturers’ new orders for nondefense capital goods excluding aircraft orders; Building permits for new private housing units; S&P 500® Index of Stock Prices; Leading Credit Index™; Interest rate spread (10-year Treasury bonds less federal funds rate); Average consumer expectations for business conditions. REF: ConferenceBoard, LEI Report for November (Released on 1/6/2025)
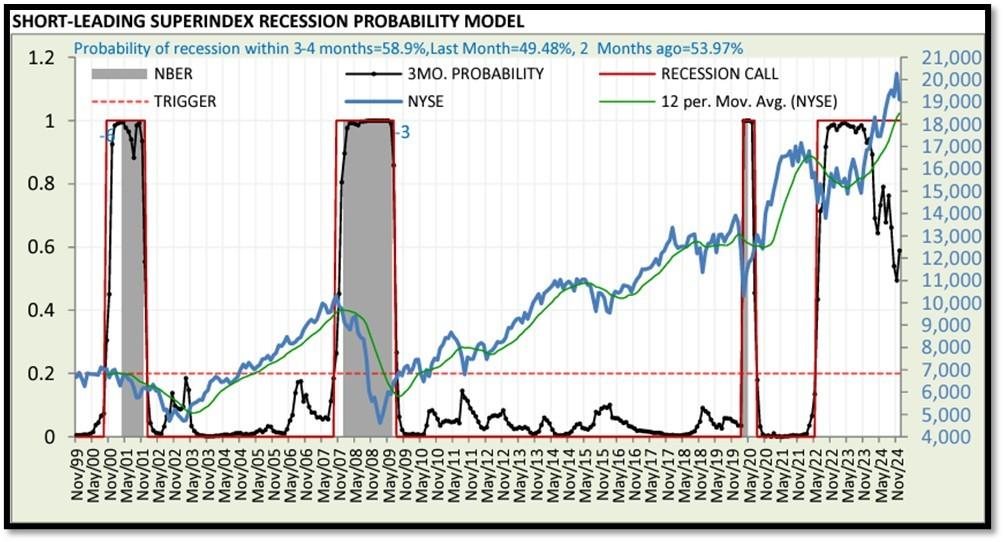
5F. Probability of U.S. falling into Recession within 3 to 4 months is currently at 58.9% (with data as of 01/07/2025 – Next Report 01/21/2025) according to RecessionAlert Research. Last release’s data was at 67.2%. This report is updated every two weeks. REF: RecessionAlertResearch
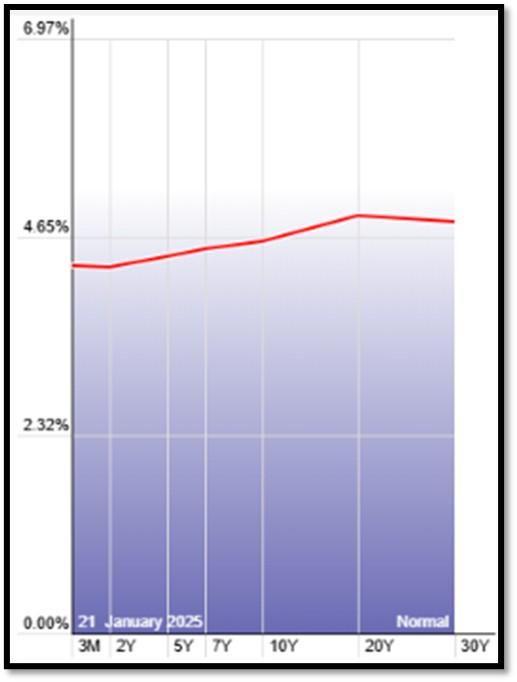
5G. Yield Curve as of 1/21/2025 is showing Normal. Spread on the 10-yr Treasury Yield (4.58%) minus yield on the 2-yr Treasury Yield (4.28%) is currently at 30 bps. REF: Stockcharts The yield curve—specifically, the spread between the interest rates on the ten-year Treasury note and the three-month Treasury bill—is a valuable forecasting tool. It is simple to use and significantly outperforms other financial and macroeconomic indicators in predicting recessions two to six quarters ahead. REF: NYFED
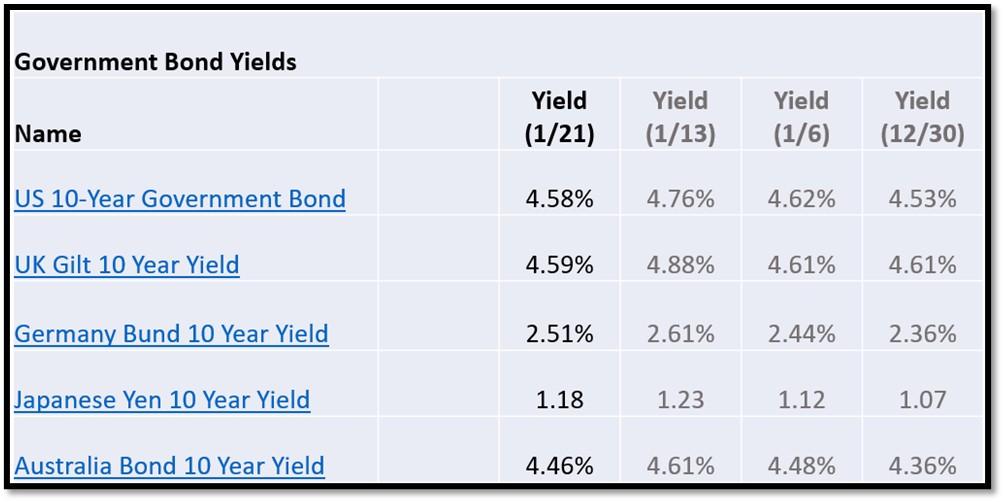
5H. Recent Yields in 10-Year Government Bonds. REF: Source is from Bloomberg.com, dated 1/21/2025, rates shown below are as of 1/21/2025, subject to change.
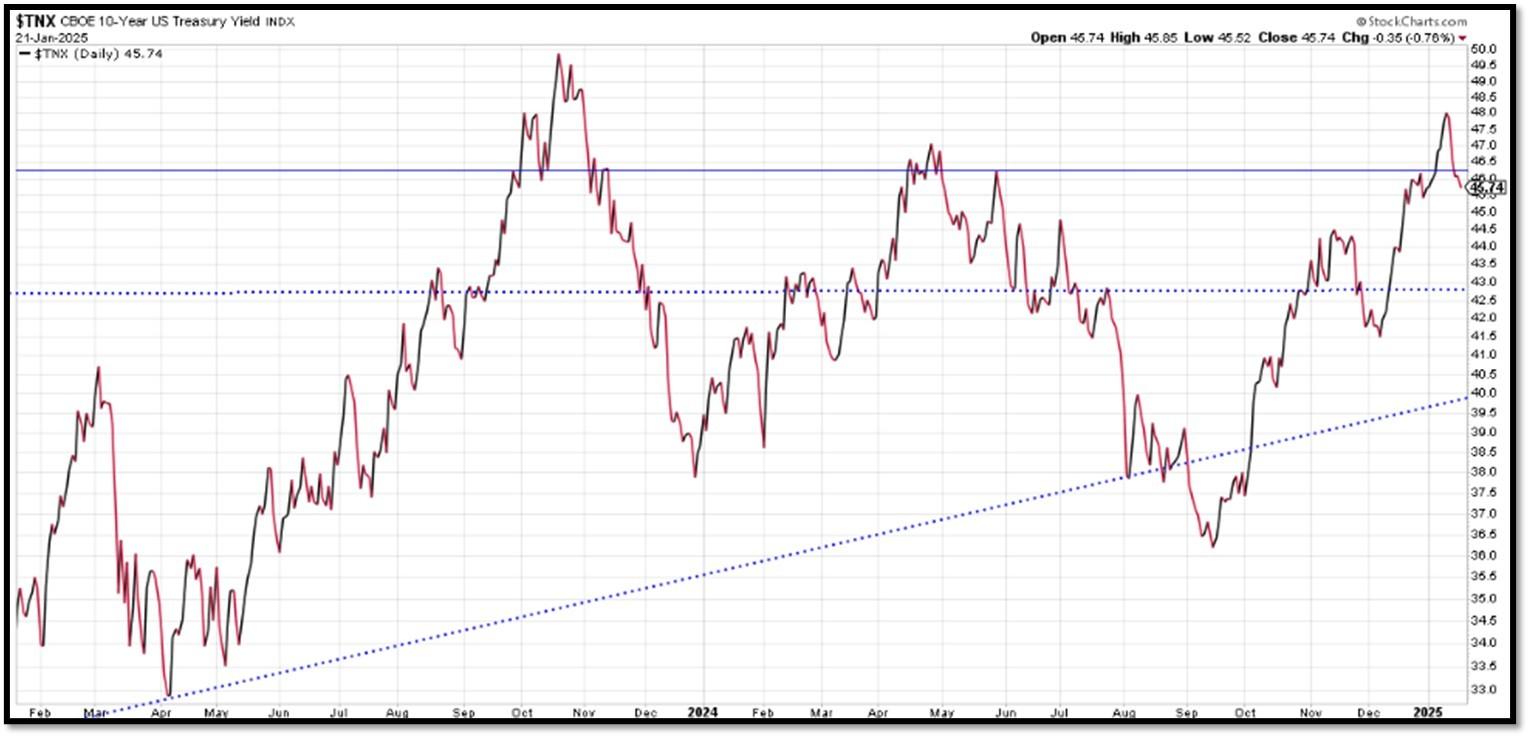
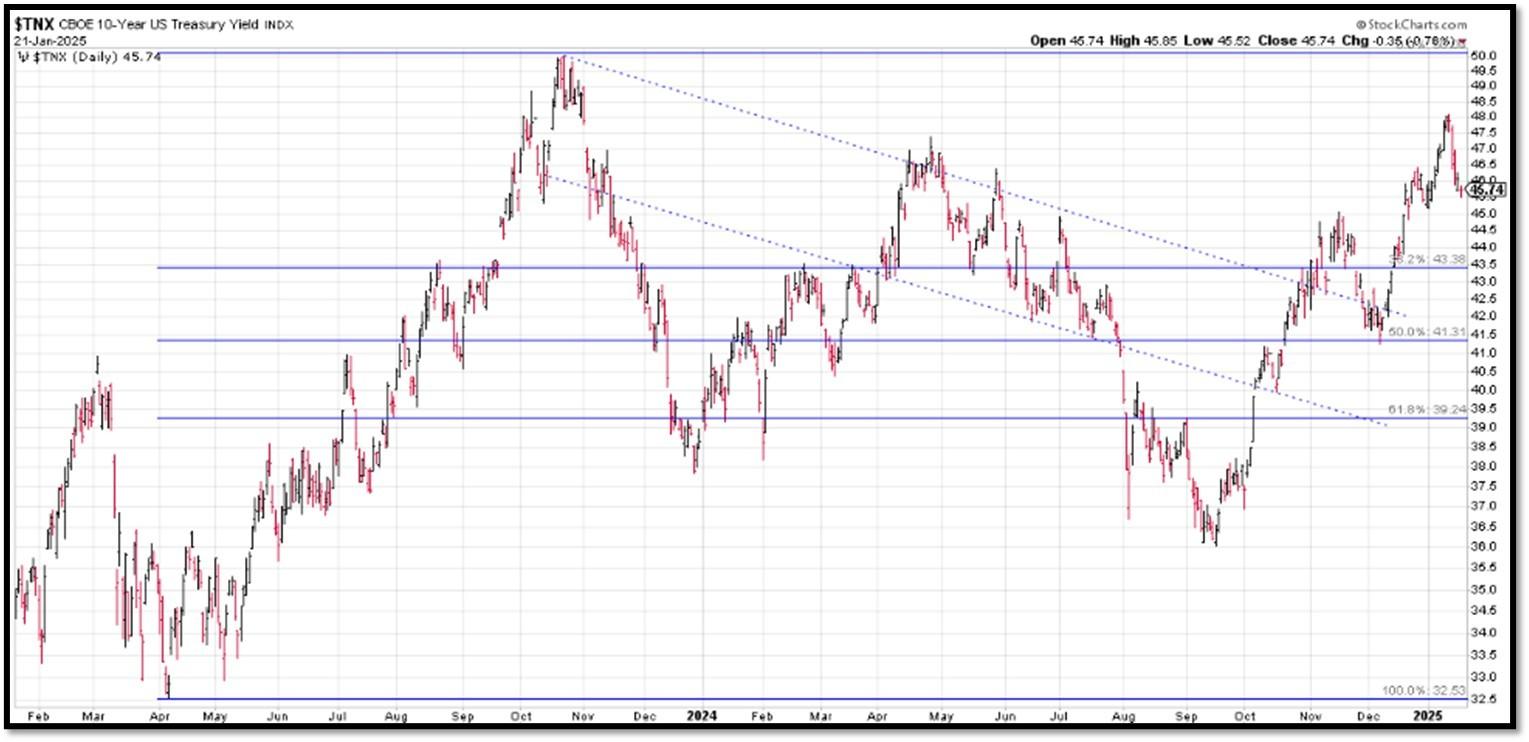
The 10-Year US Treasury Yield… REF: StockCharts1, StockCharts2
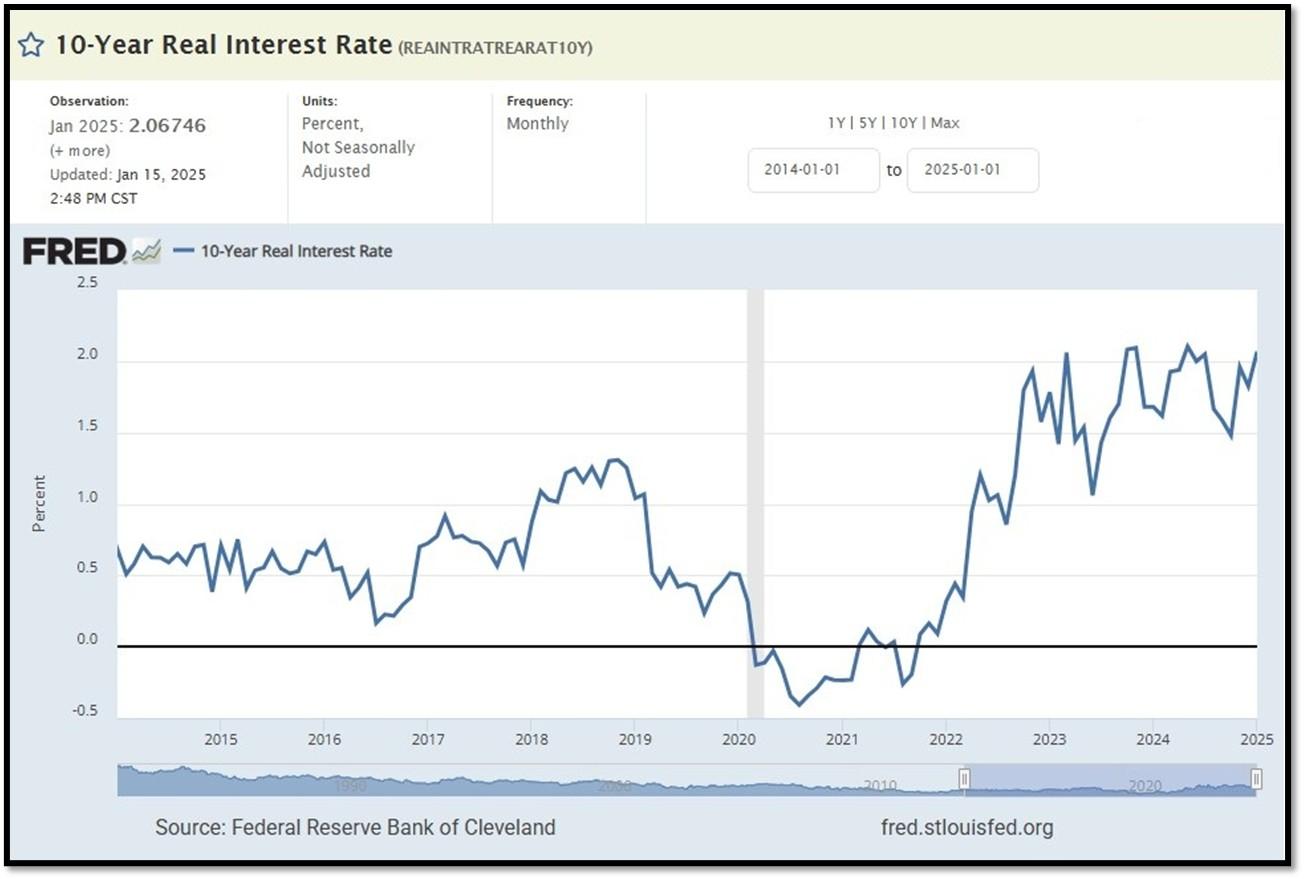
10-Year Real Interest Rate at 2.0674% as of 1/15/25. REF: REAINTRATREARAT10Y
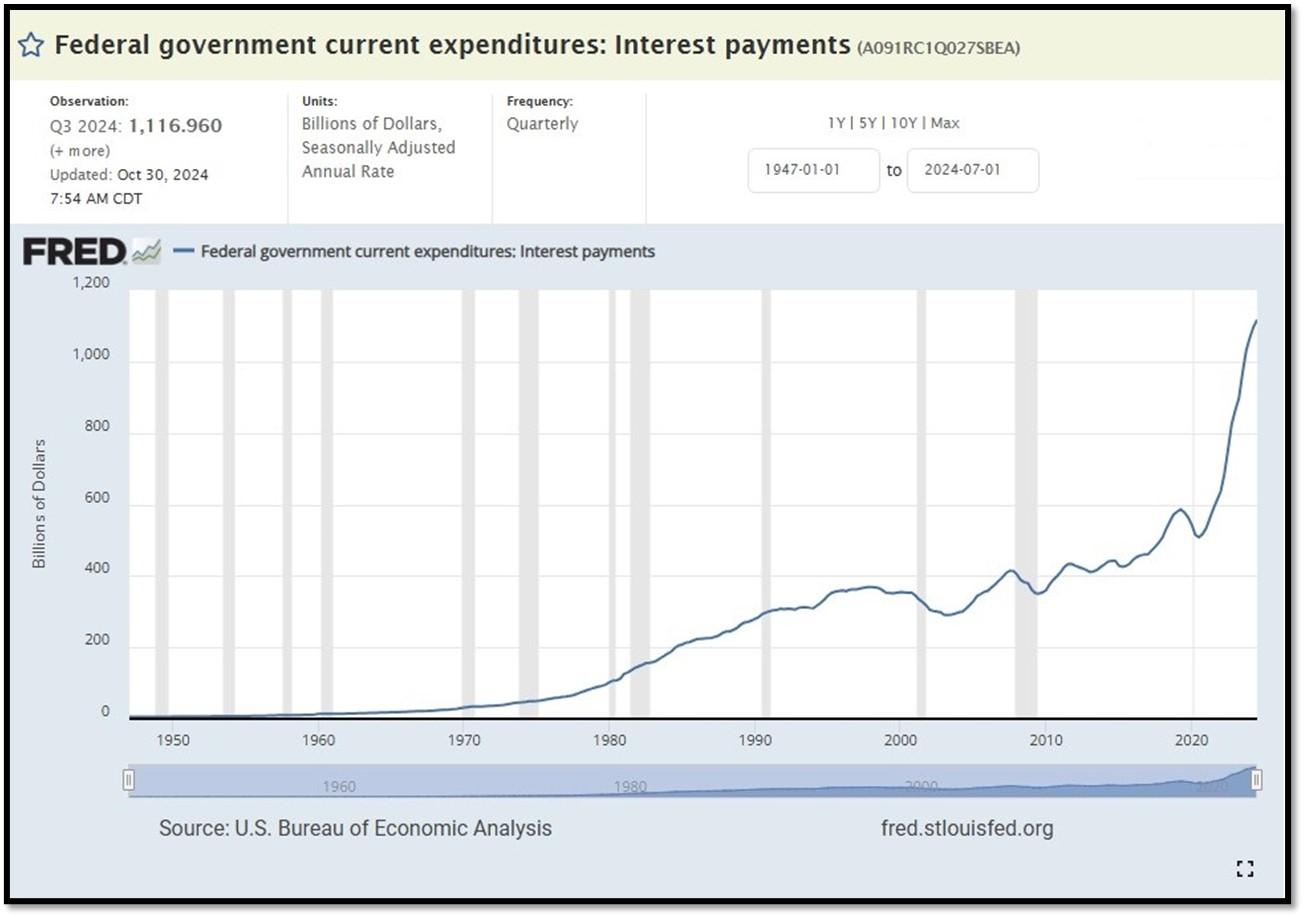
Federal government Interest Payments increased $20B+ to $1.1166 Trillion as of Q3-2024. REF: FRED-A091RC1Q027SBEA
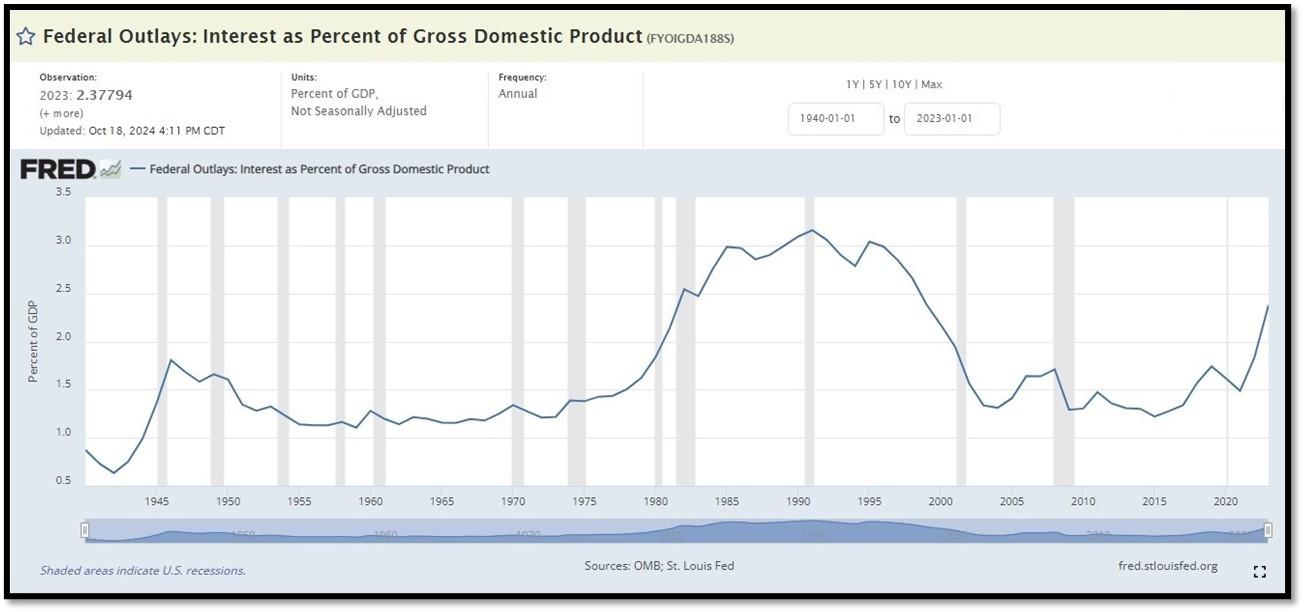
Interest payments as a percentage of GDP increased from 1.84853 in 2022 to 2.37794 as of 10/18/24. REF: FRED-FYOIGDA188S
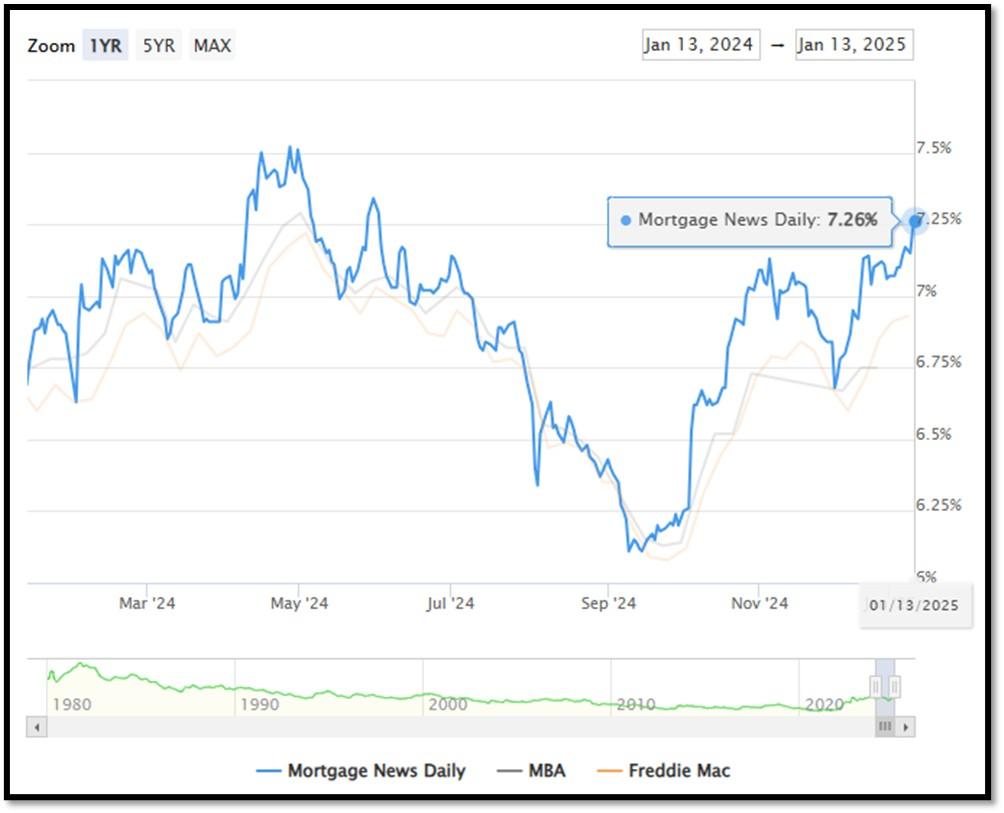
5I. (1/21/2025) Today’s National Average 30-Year Fixed Mortgage Rate is 7.08% (All Time High was 8.03% on 10/19/23). Last week’s data was 7.26%. This rate is the average 30-year fixed mortgage rates from several different surveys including Mortgage News Daily (daily index), Freddie Mac (weekly survey), Mortgage Bankers Association (weekly survey) and FHFA (monthly survey). REF: MortgageNewsDaily, Today’s Average Rate
The recent spike in the 30-year fixed-rate jumbo mortgage to 7.26%, compared to Freddie Mac’s rate at 7.04% and the Mortgage Bankers Association (MBA) rate at 6.75%, highlights key differences in the mortgage market. Jumbo mortgages, which exceed the conforming loan limits set by government agencies like Freddie Mac, typically carry higher interest rates because they are riskier for lenders. These loans are not backed by government entities, which increases the risk for lenders and, consequently, leads to higher rates. In contrast, Freddie Mac and MBA provide averages for conforming loans, which meet federal guidelines and have lower risk due to government backing, keeping their rates lower.
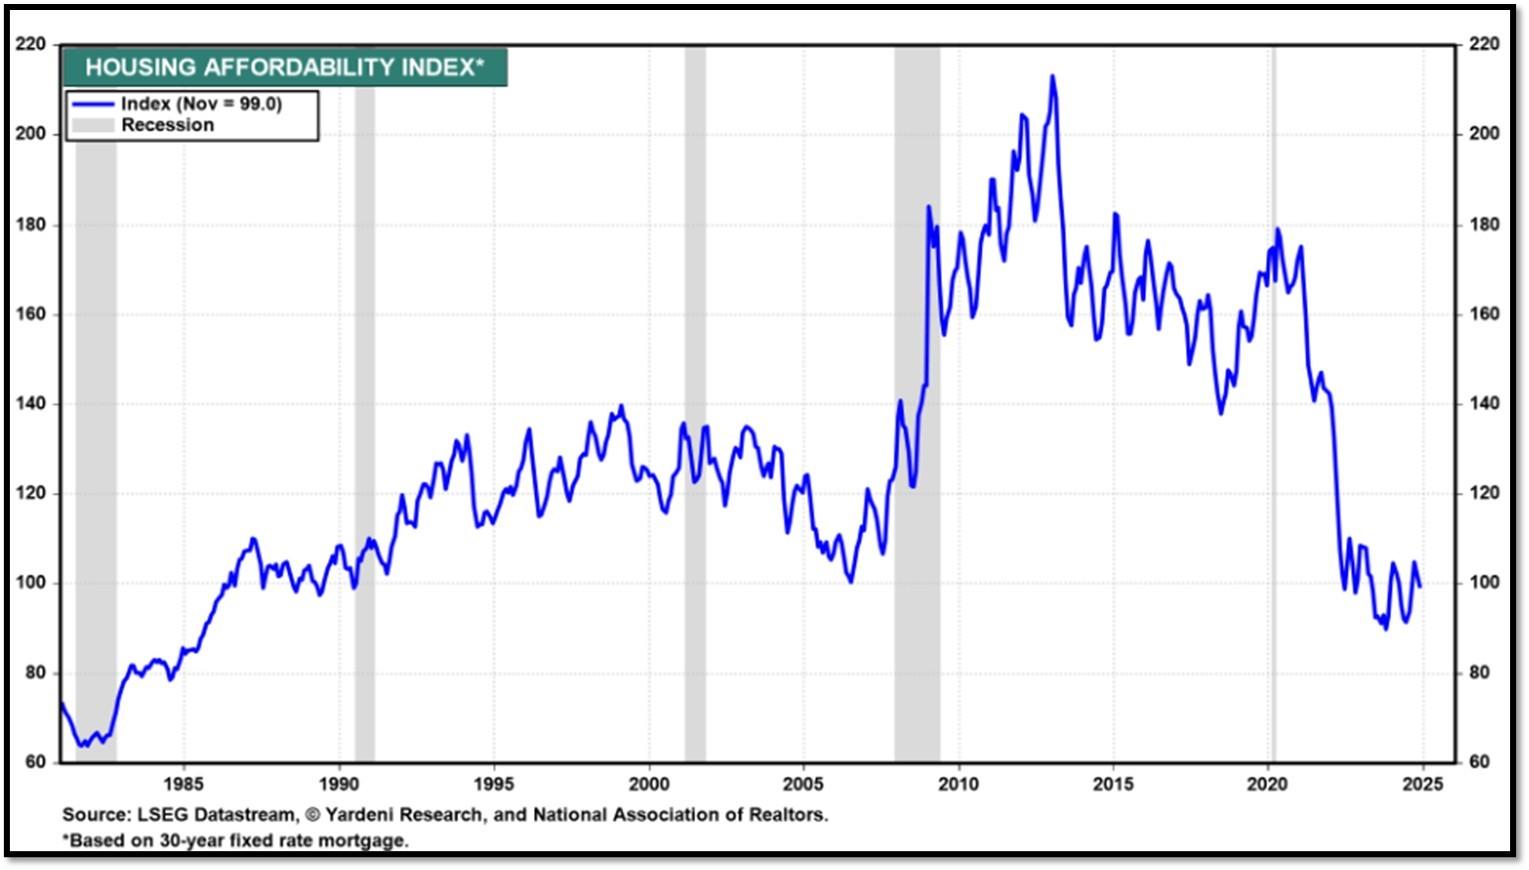
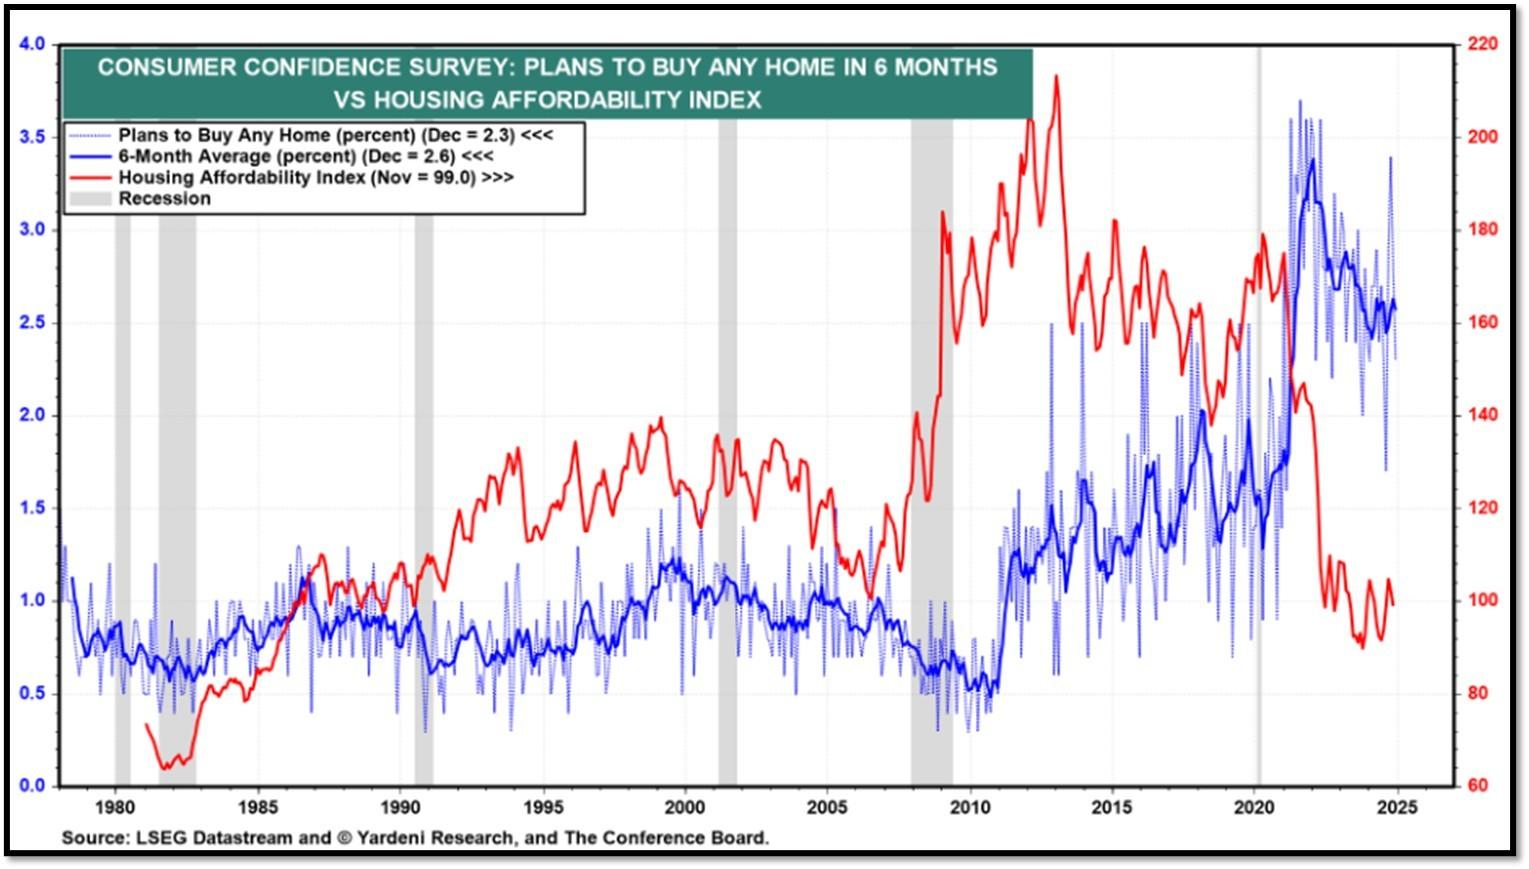
(1/13/25) Housing Affordability Index for Nov = 99 // Oct = 102.3 // Sep = 105.5 // Aug = 98.6 // July = 95 // June = 93.3 // May = 93.1 // April = 95.9 // March = 101.1 // February = 103.0. Data provided by Yardeni Research. REF: Yardeni
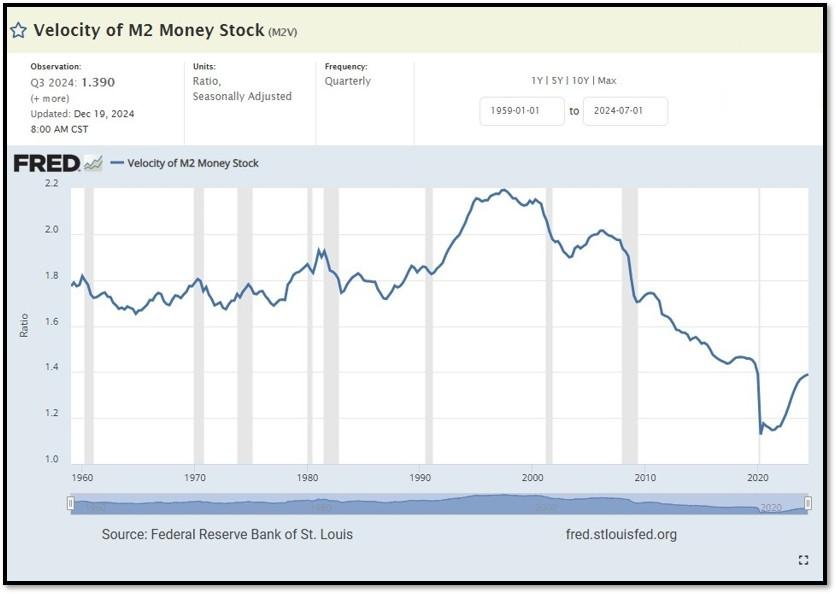
5J. Velocity of M2 Money Stock (M2V) with current read at 1.390 as of (Q3-2024 updated 12/19/2024). Previous quarter’s data was 1.389. The velocity of money is the frequency at which one unit of currency is used to purchase domestically- produced goods and services within a given time period. In other words, it is the number of times one dollar is spent to buy goods and services per unit of time. If the velocity of money is increasing, then more transactions are occurring between individuals in an economy. Current Money Stock (M2) report can be viewed in the reference link. REF: St.LouisFed-M2V
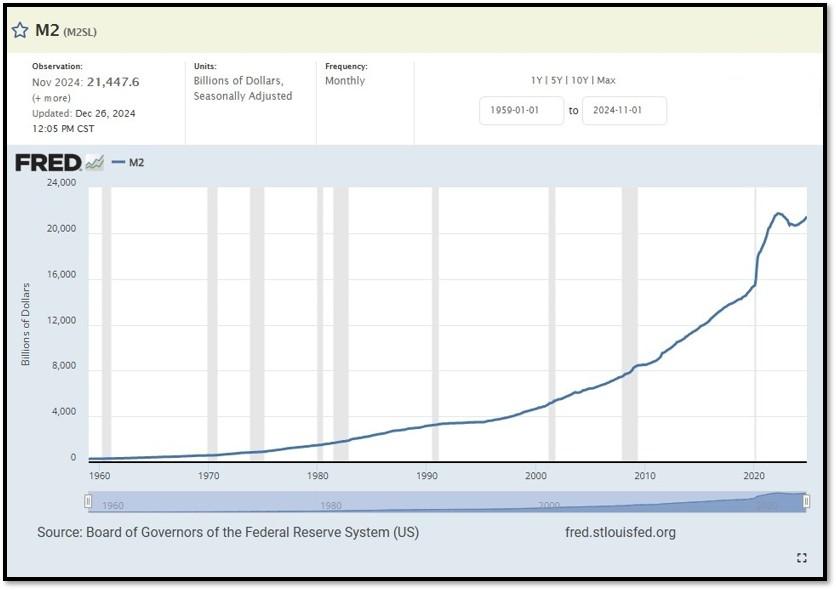
M2 consists of M1 plus (1) small-denomination time deposits (time deposits in amounts of less than $100,000) less IRA and Keogh balances at depository institutions; and (2) balances in retail MMFs less IRA and Keogh balances at MMFs. Seasonally adjusted M2 is constructed by summing savings deposits (before May 2020), small-denomination time deposits, and retail MMFs, each seasonally adjusted separately, and adding this result to seasonally adjusted M1. Board of Governors of the Federal Reserve System (US), M2 [M2SL], retrieved from FRED, Federal Reserve Bank of St. Louis; Updated on November 26, 2024. REF: St.LouisFed-M2
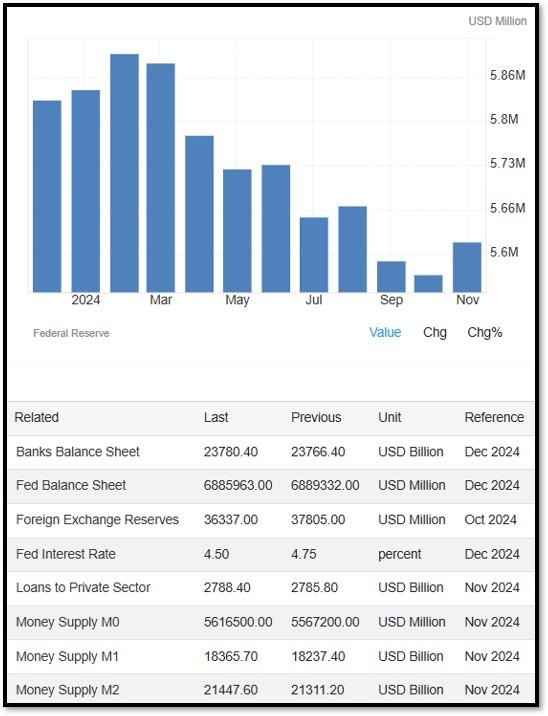
Money Supply M0 in the United States increased to 5,616,500 USD Million in November from 5,567,200 USD Million in October of 2024. Money Supply M0 in the United States averaged 1,160,672.82 USD Million from 1959 until 2024, reaching an all-time high of 6,413,100.00 USD Million in December of 2021 and a record low of 48,400.00 USD Million in February of 1961. REF: TradingEconomics, M0
5K. In December, the Consumer Price Index for All Urban Consumers rose 0.4 percent, seasonally adjusted, and rose 2.9 percent over the last 12 months, not seasonally adjusted. The index for all items less food and energy increased 0.2 percent in December (SA); up 3.2 percent over the year (NSA). January 2025 CPI data are scheduled to be released on February 12, 2025, at 8:30AM-ET. REF: BLS, BLS.GOV
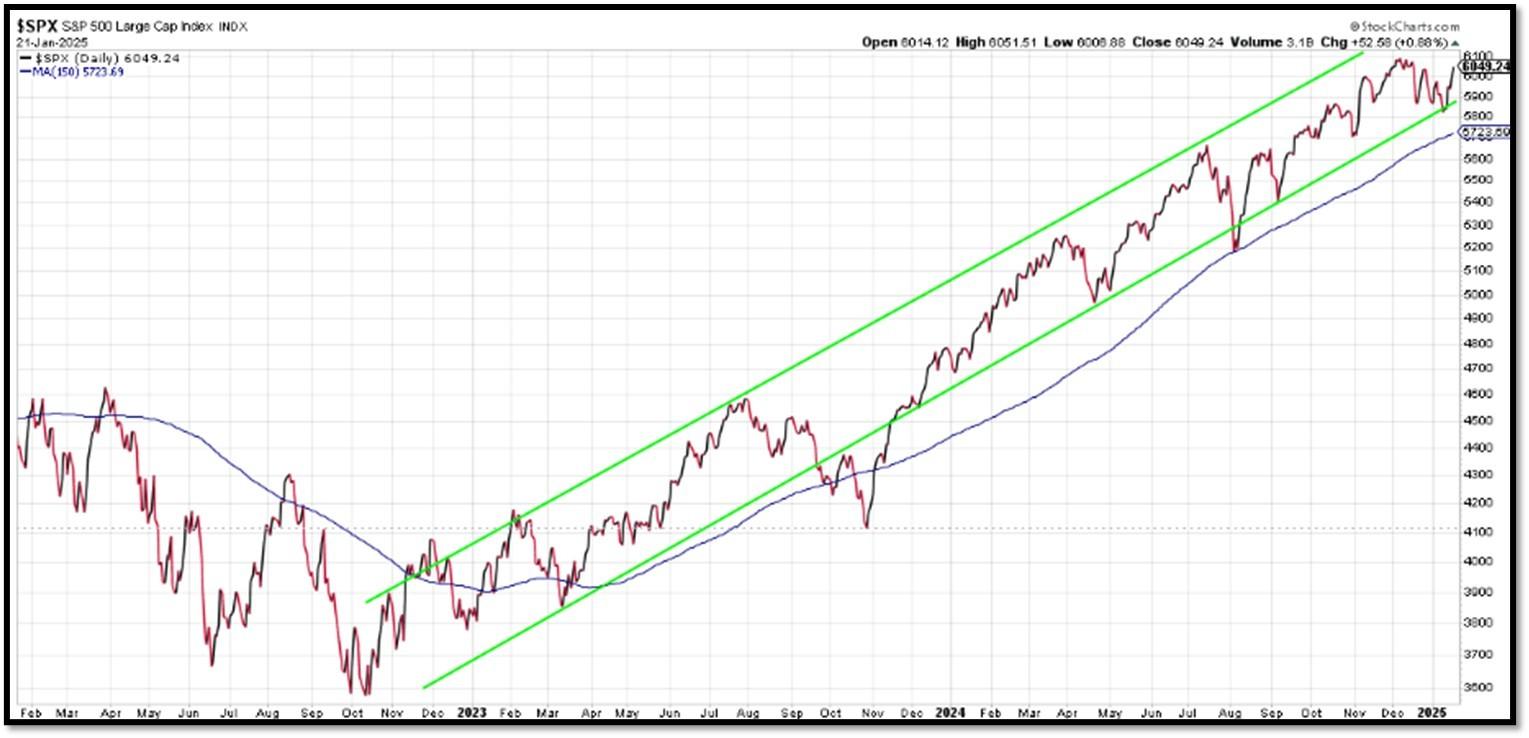
5L. Technical Analysis of the S&P500 Index. Click onto reference links below for images.
- Short-term Chart: Bearish to Improving on 1/21/2025 – REF: Short-term S&P500 Chart by Marc Slavin (Click Here to Access Chart)
- Medium-term Chart: Bullish on 1/21/2025 – REF: Medium-term S&P500 Chart by Marc Slavin (Click Here to Access Chart)
- Market Timing Indicators – S&P500 Index as of 1/21/2025 – REF: S&P500 Charts (7 of them) by Joanne Klein’s Top 7 (Click Here to Access Updated Charts)
- A well-defined uptrend channel shown in green with S&P500 still on up trend. REF: Stockcharts
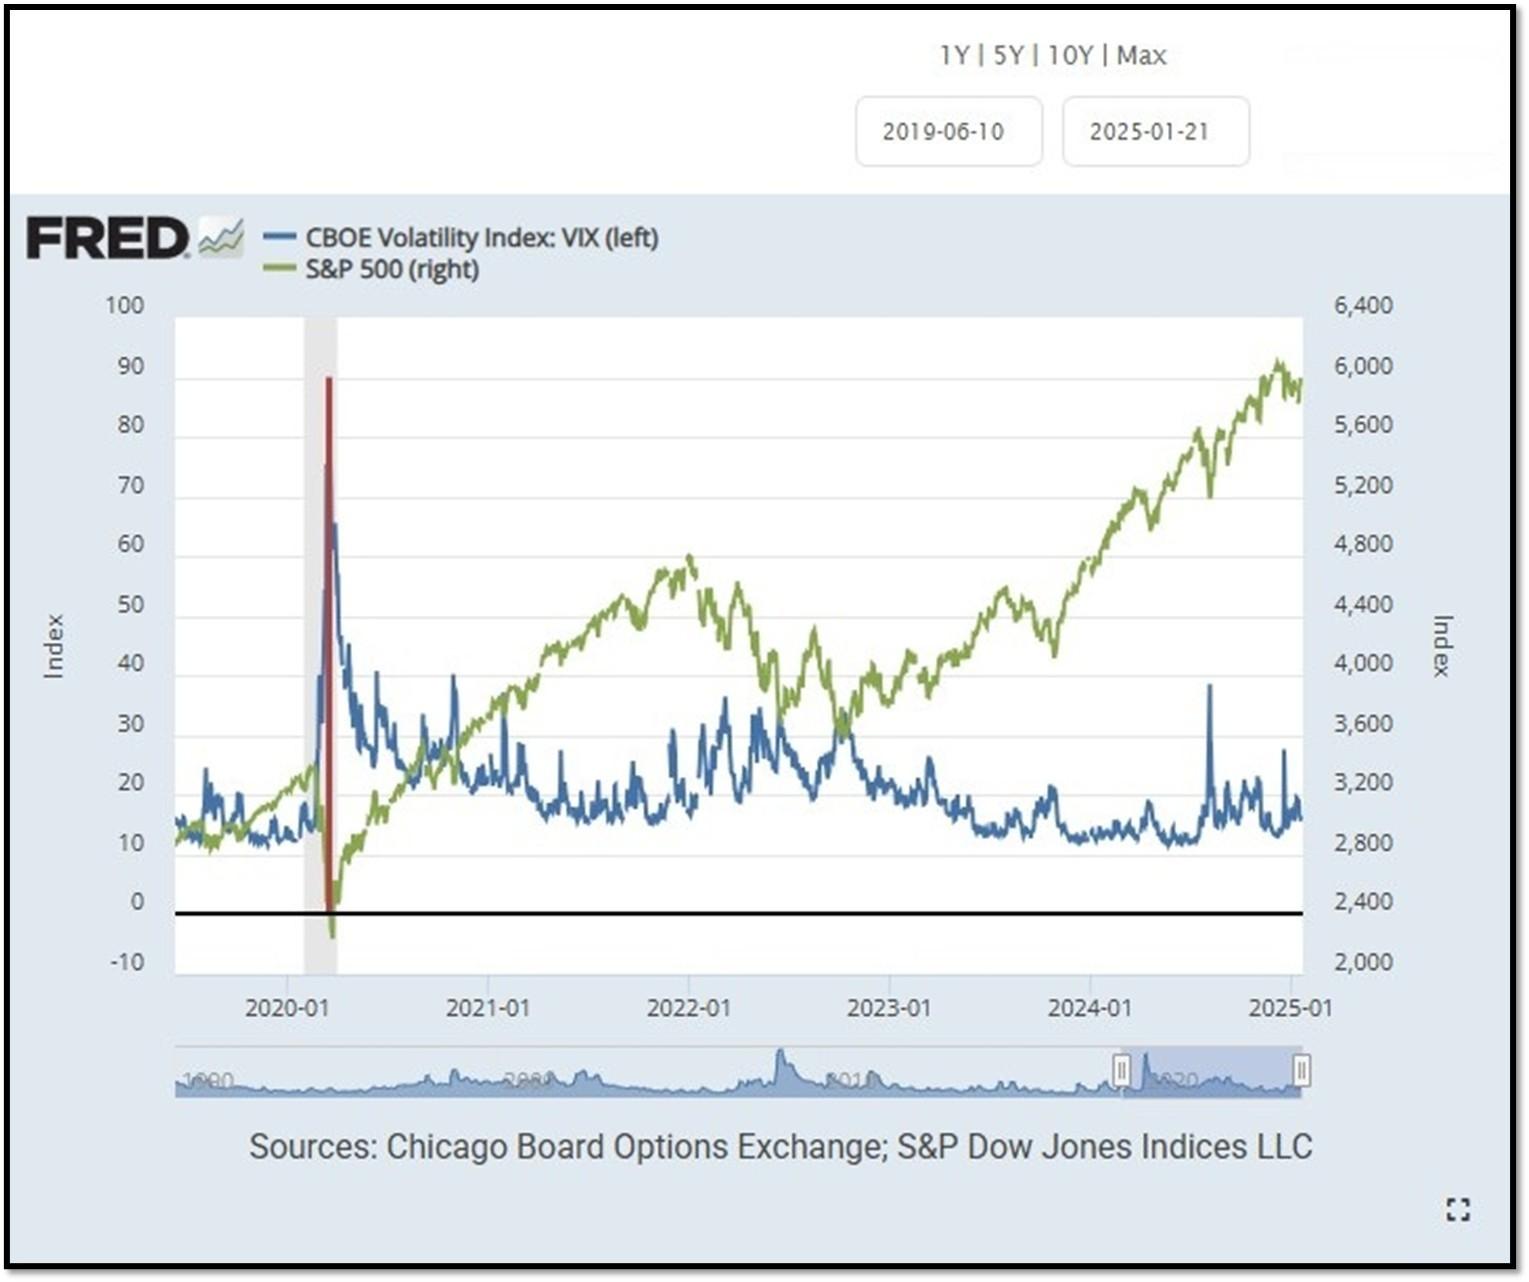
- S&P500 and CBOE Volatility Index (VIX) as of 1/21/2025. REF: FRED, Today’s Print
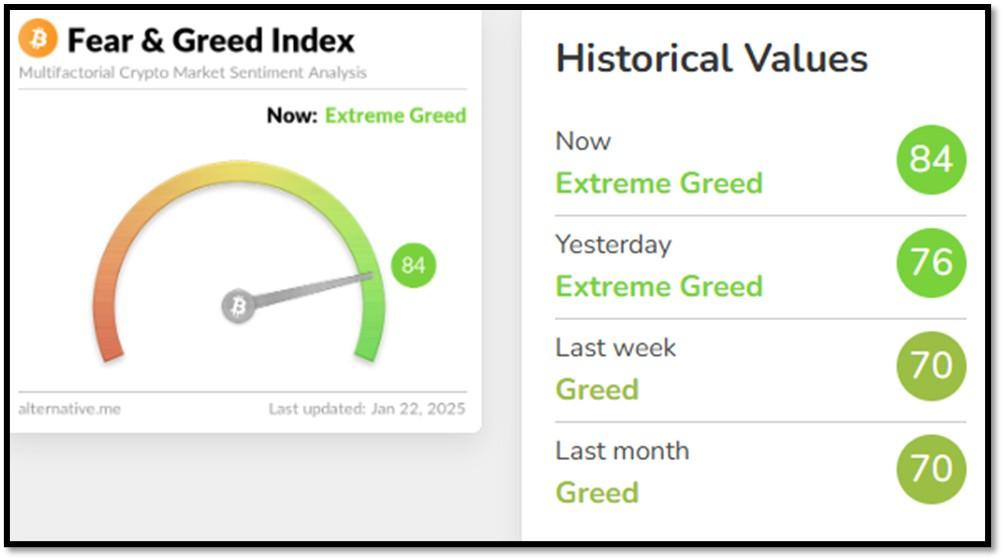
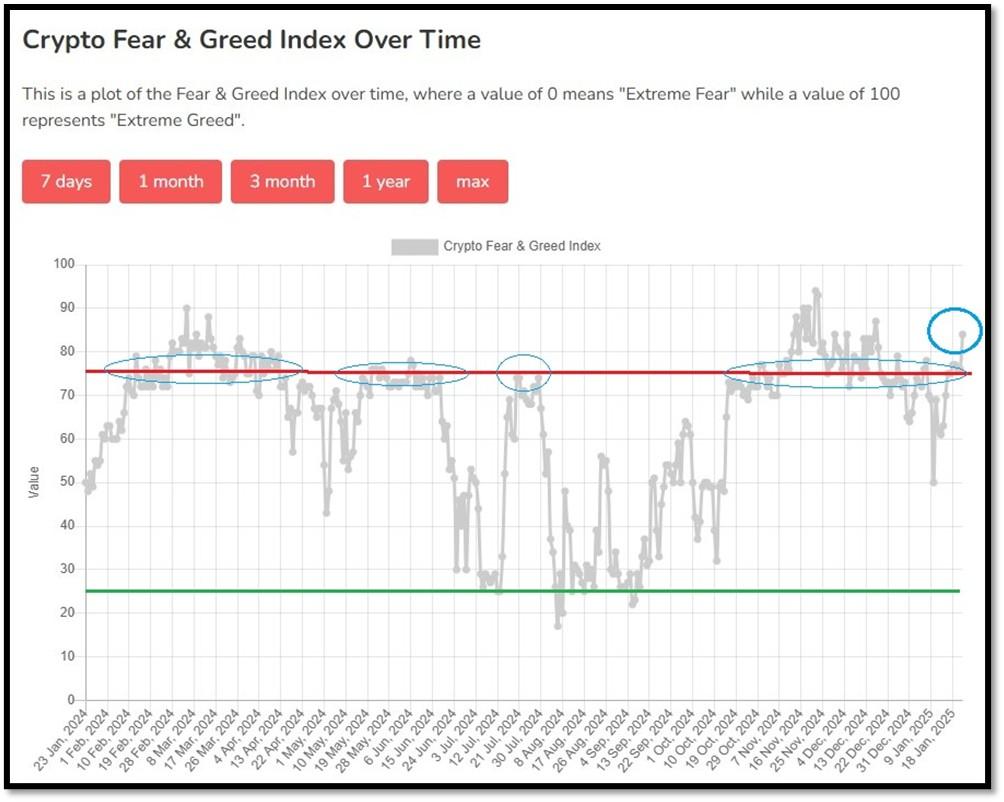
5M. Most recent read on the Crypto Fear & Greed Index with data as of 1/22/2025au is 84 (Extreme Greed). Last week’s data was 70 (Greed) (1-100). Fear & Greed Index – A Contrarian Data. The crypto market behavior is very emotional. People tend to get greedy when the market is rising which results in FOMO (Fear of missing out). Also, people often sell their coins in irrational reaction of seeing red numbers. With the Crypto Fear and Greed Index, the data try to help save investors from their own emotional overreactions. There are two simple assumptions:
- Extreme fear can be a sign that investors are too worried. That could be a buying opportunity.
- When Investors are getting too greedy, that means the market is due for a correction.
Therefore, the program for this index analyzes the current sentiment of the Bitcoin market and crunch the numbers into a simple meter from 0 to 100. Zero means “Extreme Fear”, while 100 means “Extreme Greed”. REF: Alternative.me, Today’sReading
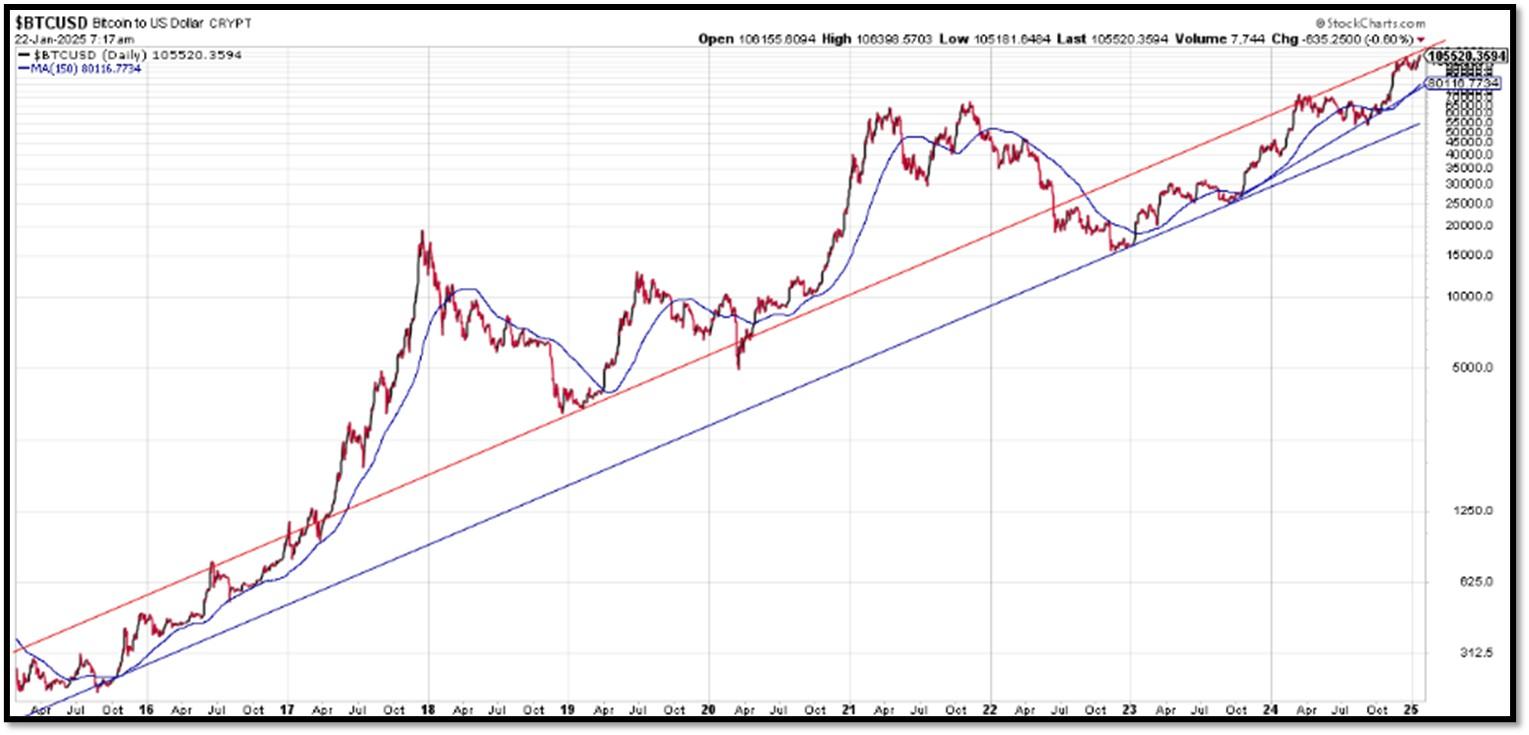
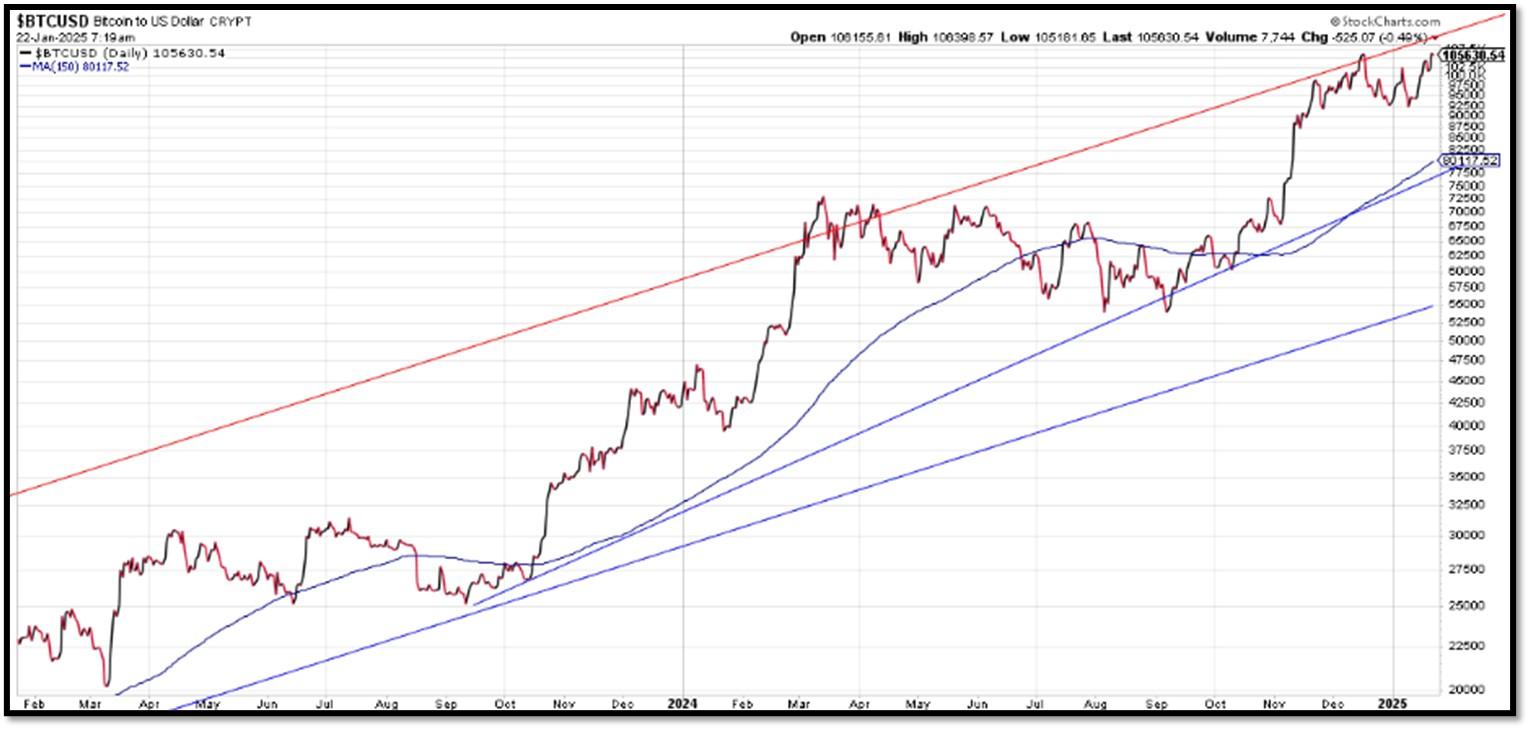
Bitcoin – 10-Year & 2-Year Charts. REF: Stockcharts10Y, Stockcharts2Y

Len writes much of his own content, and also shares helpful content from other trusted providers like Turner Financial Group (TFG).
The material contained herein is intended as a general market commentary, solely for informational purposes and is not intended to make an offer or solicitation for the sale or purchase of any securities. Such views are subject to change at any time without notice due to changes in market or economic conditions and may not necessarily come to pass. This information is not intended as a specific offer of investment services by Dedicated Financial and Turner Financial Group, Inc.
Dedicated Financial and Turner Financial Group, Inc., do not provide tax, legal or accounting advice. You should consult your own tax, legal and accounting advisors before engaging in any transaction.
Any hyperlinks in this document that connect to Web Sites maintained by third parties are provided for convenience only. Turner Financial Group, Inc. has not verified the accuracy of any information contained within the links and the provision of such links does not constitute a recommendation or endorsement of the company or the content by Dedicated Financial or Turner Financial Group, Inc. The prices/quotes/statistics referenced herein have been obtained from sources verified to be reliable for their accuracy or completeness and may be subject to change.
Past performance is no guarantee of future returns. Investing involves risk and possible loss of principal capital. The views and strategies described herein may not be suitable for all investors. To the extent referenced herein, real estate, hedge funds, and other private investments can present significant risks, including loss of the original amount invested. All indexes are unmanaged, and an individual cannot invest directly in an index. Index returns do not include fees or expenses.
Turner Financial Group, Inc. is an Investment Adviser registered with the United States Securities and Exchange Commission however, such registration does not imply a certain level of skill or training and no inference to the contrary should be made. Additional information about Turner Financial Group, Inc. is also available at www.adviserinfo.sec.gov. Advisory services are only offered to clients or prospective clients where Turner Financial Group, Inc. and its representatives are properly licensed or exempt from licensure. No advice may be rendered by Turner Financial Group, Inc. unless a client service agreement is in place.