- 1. In its January 2025 meeting, the Federal Reserve decided to keep the federal funds rate unchanged at the 4.25%-4.5% range, aligning with market expectations.
- 2. Historically, small-cap companies have demonstrated superior returns compared to most major asset classes over long periods.
- With the current macro-economic backdrop, below are areas we currently favor:
- 3. DeepSeek, a Chinese AI startup, has recently introduced its R1 model, which rivals leading AI language models in performance while utilizing significantly fewer resources.
- 4. World Watch
- 5. Quant & Technical Corner
1. In its January 2025 meeting, the Federal Reserve decided to keep the federal funds rate unchanged at the 4.25%-4.5% range, aligning with market expectations.
This pause follows a series of three rate cuts in 2024, which collectively reduced rates by a full percentage point. The decision reflects the central bank’s cautious approach as it balances economic growth, inflation, and labor market stability.
Policymakers noted that the U.S. economy continues to expand at a solid pace, with the unemployment rate stabilizing at historically low levels. The labor market remains strong, suggesting that businesses still have demand for workers despite higher borrowing costs. However, inflation remains a key concern. While prior statements from the Fed highlighted ongoing progress toward the 2% inflation target, the latest communication omitted such language, signaling that price pressures may be more persistent than previously anticipated. The Fed also acknowledged that the economic outlook remains uncertain, emphasizing its commitment to both sides of its dual mandate—promoting maximum employment and stable prices. This careful stance suggests that future rate decisions will be driven by incoming data, with the central bank remaining vigilant to both inflationary risks and potential slowdowns in economic activity. While investors and businesses had hoped for further rate cuts in 2025, the Fed’s latest decision underscores its commitment to a data-dependent approach in navigating a complex economic landscape.
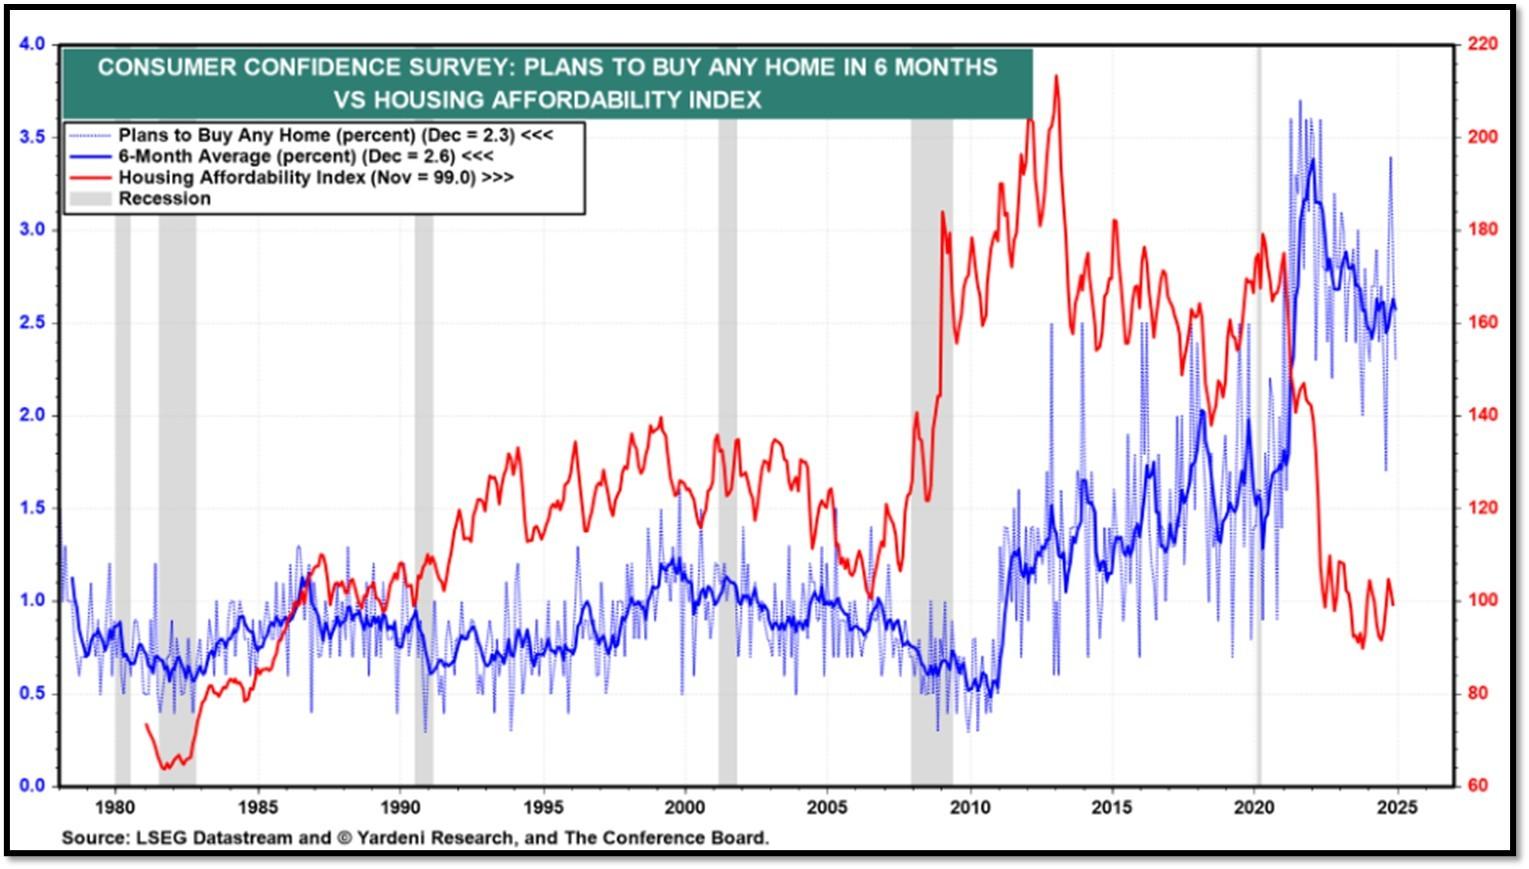
US consumer confidence declined for the second consecutive month in January. The Conference Board’s index fell to 104.1 from 109.5 in December, reflecting growing concerns about current economic conditions and future outlooks. Despite higher borrowing costs, retail sales increased by 0.4% in December, suggesting resilient consumer spending during the holiday season. REF: FOMC, DailyShot
2. Historically, small-cap companies have demonstrated superior returns compared to most major asset classes over long periods.
Studies have shown that small-cap stocks, as measured by indices such as the Russell 2000, have often outperformed large-cap stocks due to their higher growth potential and market inefficiencies. For example, between 1979 and 2020, small-cap stocks in the U.S. generated an average annual return of approximately 11.8%, compared to 10.2% for the S&P 500. Legendary small-cap companies like Walmart (WMT) and Amazon (AMZN) initially emerged as small businesses before evolving into industry giantsHowever, in recent decades, the rise of private equity (PE) and venture capital (VC) has significantly altered this dynamic. Historically, successful startups would seek public markets through initial public offerings (IPOs) to raise capital for expansion. Today, PE and VC firms provide ample funding, allowing promising companies to remain private for longer periods. This shift has deprived public small-cap markets of high-growth opportunities, contributing to their relative underperformance. The median age of companies at IPO increased from 7.8 years in the 1980s to approximately 12 years by 2020 (Ritter, 2021), underscoring this trend. As a result, many high-growth startups, such as Stripe and SpaceX, remain privately held, benefiting institutional investors while limiting access for public market participants. This structural shift has contributed to small-cap underperformance relative to past decades. Unless regulatory changes or market forces encourage earlier IPOs, small-cap investors may continue to see fewer high-growth opportunities in the public markets. Click onto picture below to access podcast. REF: Ibbotson, Ritter-IPO

With the current macro-economic backdrop, below are areas we currently favor:
- Fixed Income – Short-term Corporates (Low-Beta)
- Fixed Income – Corporates High Yield as Opportunistic Allocation (Low-Beta)
- Businesses that contribute to and benefit from AI & Automation (Market-Risk)
- Financials (Market-Risk)
- Industrials (Market-Risk)
- Small Cap & Mid Cap Stocks (Market-Risk)
- Biotechnology (Market-Risk)
- Gold (Market-Risk)
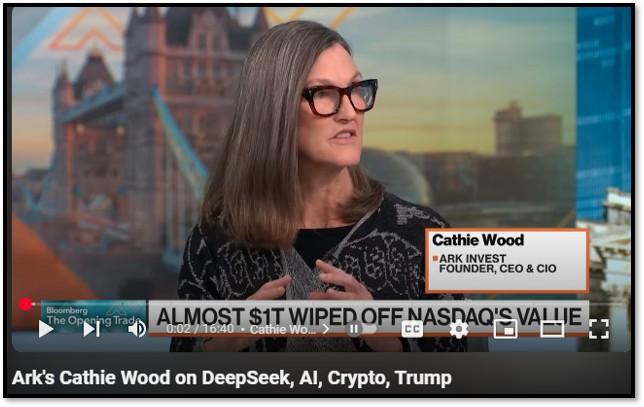
3. DeepSeek, a Chinese AI startup, has recently introduced its R1 model, which rivals leading AI language models in performance while utilizing significantly fewer resources.
This development has raised concerns about DeepSeek’s ability to meet potential surging demand and its implications for other AI large language models (LLMs). DeepSeek’s R1 model was developed at a fraction of the cost and computational power compared to its Western counterparts. While this cost-effectiveness is commendable, it may pose challenges in scaling production to meet increased demand. There have also been rumors that DeepSeek received free electricity for its R&D operations. The company’s reliance on a limited number of less advanced chips could hinder its ability to rapidly scale operations, potentially leading to supply constraints. China’s strict censorship policies pose a significant concern for DeepSeek users, particularly those outside China who expect AI models to provide unrestricted access to global information. The Chinese government imposes tight controls on online content, restricting discussions on sensitive topics such as human rights, democracy, and events like Tiananmen Square. Since DeepSeek is developed in China, it is subject to these regulations, which may limit its ability to generate unbiased or uncensored responses. Authorities around the world are currently investigating the potential risks of DeepSeek.
The company’s approach challenges the prevailing narrative that substantial investments in high-end hardware are essential for developing advanced AI models. This shift could lead to a re-evaluation of investment strategies among AI firms, potentially impacting the development and deployment of other LLMs. I believe AI itself has just been commoditized. While DeepSeek’s innovative approach offers a cost-effective alternative in AI development, its capacity to meet escalating demand remains uncertain. Additionally, its disruptive impact on the AI industry could pose challenges for other LLM developers as they navigate this evolving landscape. Click onto pictures below to access videos. REF: WSJ, CNBC, Bloomberg, ComputerWorld

Cathie Wood: Cost of AI training was already dropping 75% per year…
4. World Watch
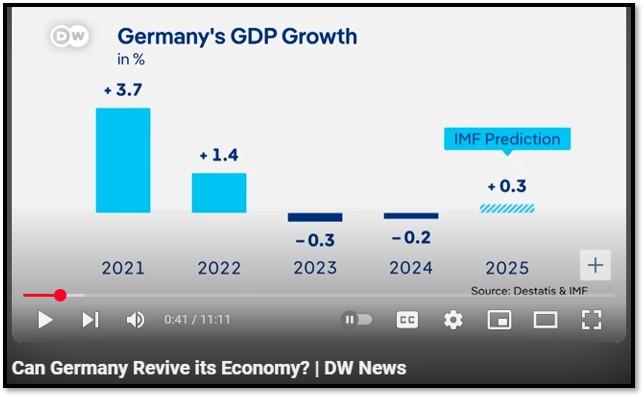
4A. Germany, long celebrated for its robust economic model driven by high-value exports, now faces mounting difficulties. The Wall Street Journal highlights that the country’s reliance on exports is being tested by shifts in global trade dynamics, particularly due to a slowdown in Chinese imports and increasing tariff threats from the United States.
For decades, Germany has thrived as an export powerhouse, with its industrial sector supplying high-quality automobiles, machinery, and chemicals worldwide. However, China, one of its largest trading partners, is experiencing economic deceleration, reducing its demand for German goods. At the same time, U.S. trade policies under President Biden’s administration have signaled a shift toward protectionism, potentially imposing higher tariffs on European imports. These factors put immense pressure on Germany’s manufacturing sector, which forms the backbone of its economy. Furthermore, Germany’s domestic market remains relatively weak, limiting its ability to offset declining exports with stronger internal demand. Energy costs, exacerbated by the war in Ukraine and the country’s transition away from nuclear and coal energy, have also made German industries less competitive globally. Click onto picture below to access video. REF: WSJ, DW
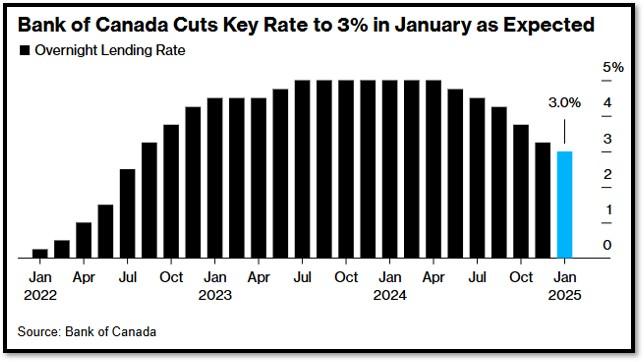
4B. On January 29, 2025, the Bank of Canada reduced its policy interest rate by 25 basis points, bringing it to 3%. This decision marks the central bank’s sixth consecutive rate cut since June 2024, reflecting ongoing efforts to stimulate economic activity amid evolving global trade dynamics. The rate reduction was largely anticipated by economists, given the prevailing economic conditions. Notably, the U.S. administration’s proposed 25% tariff on Canadian imports, set to take effect on February 1, has introduced significant uncertainty into Canada’s economic outlook. The Bank of Canada acknowledged that such tariffs could have a substantial negative impact on the economy, potentially leading to weaker GDP growth and higher prices. REF: Bloomberg
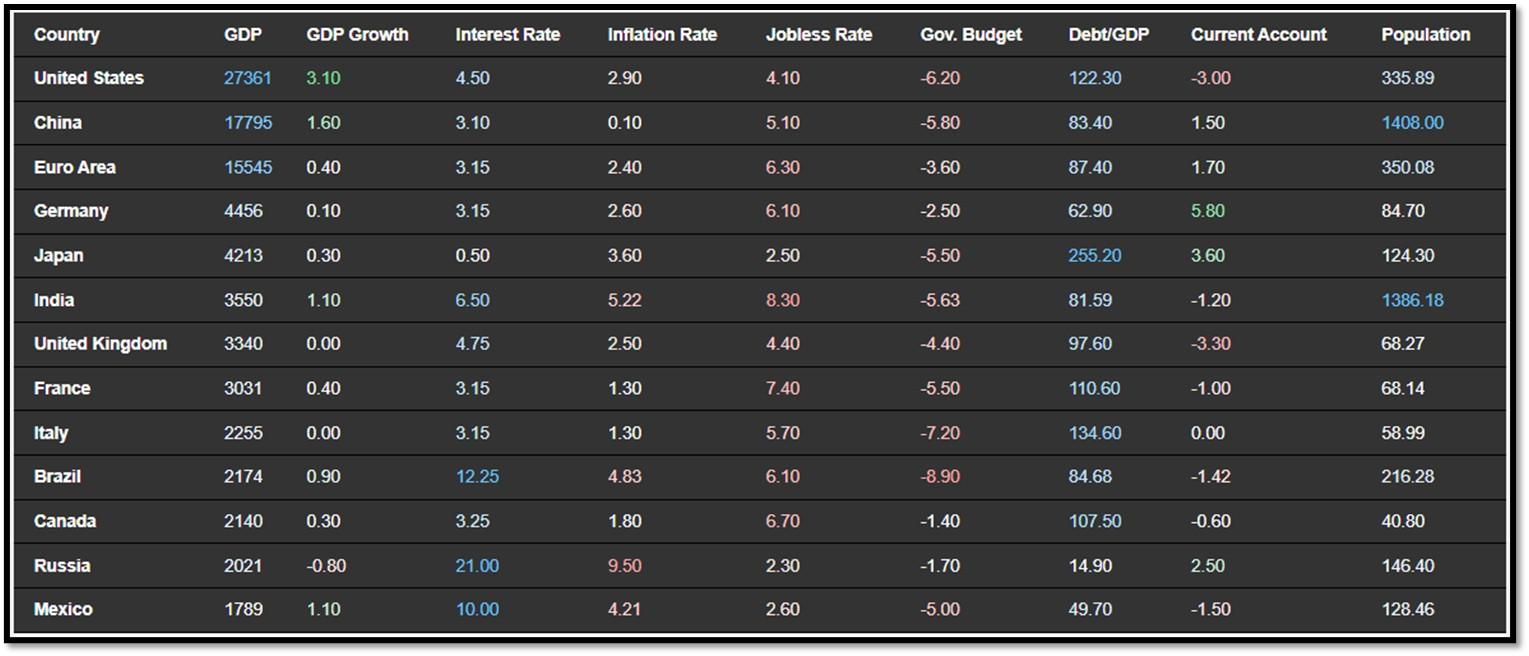
4C. Below is an updated snapshot of the current global state of economy according to TradingEconomics as of 1/27/2025. REF: TradingEconomics
- The Bank of Japan (BoJ) raised its key short-term interest rate by 25 basis points to 0.5%, the highest level in 17 years, in line with market consensus.
- The annual inflation rate in Japan jumped to 3.6% in December 2024 from 2.9% in the prior month, marking the highest reading since January 2023.
- Unemployment Rate in India increased to 8.30 percent in December from 8 percent in November of 2024.
- France’s consumer confidence indicator rose to 92 in January 2025, up from 89 in December and exceeding market forecasts of 90.
5. Quant & Technical Corner
Below is a selection of quantitative & technical data we monitor on a regular basis to help gauge the overall financial market conditions and the investment environment.
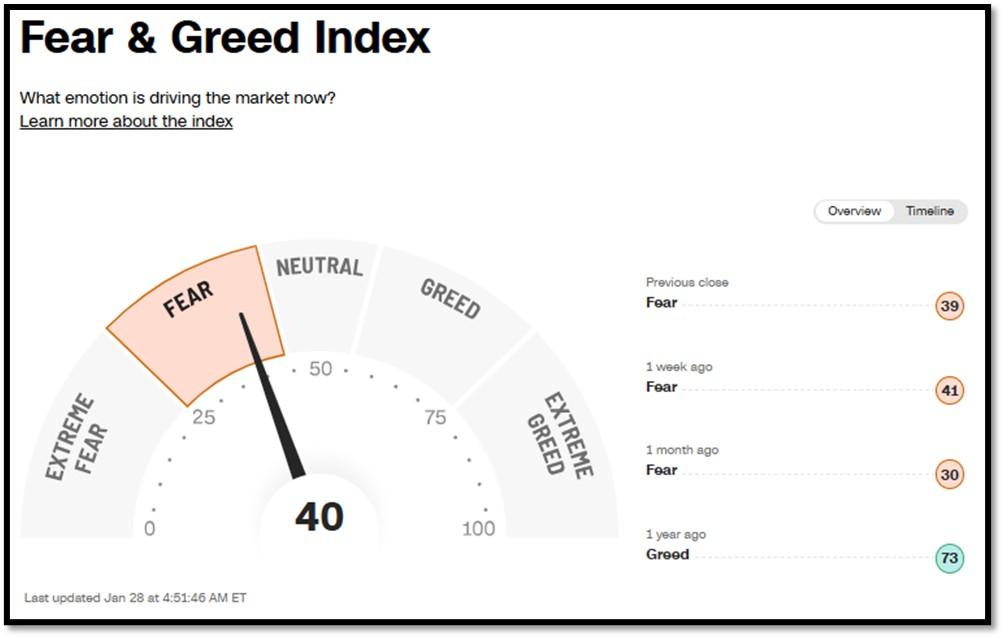
5A. Most recent read on the Fear & Greed Index with data as of 1/28/2024 – 4:51AM-ET is 40 (Fear). Last week’s data was 41 (Fear) (1-100). CNNMoney’s Fear & Greed index looks at 7 indicators (Stock Price Momentum, Stock Price Strength, Stock Price Breadth, Put and Call Options, Junk Bond Demand, Market Volatility, and Safe Haven Demand). Keep in mind this is a contrarian indicator! REF: Fear&Greed via CNNMoney

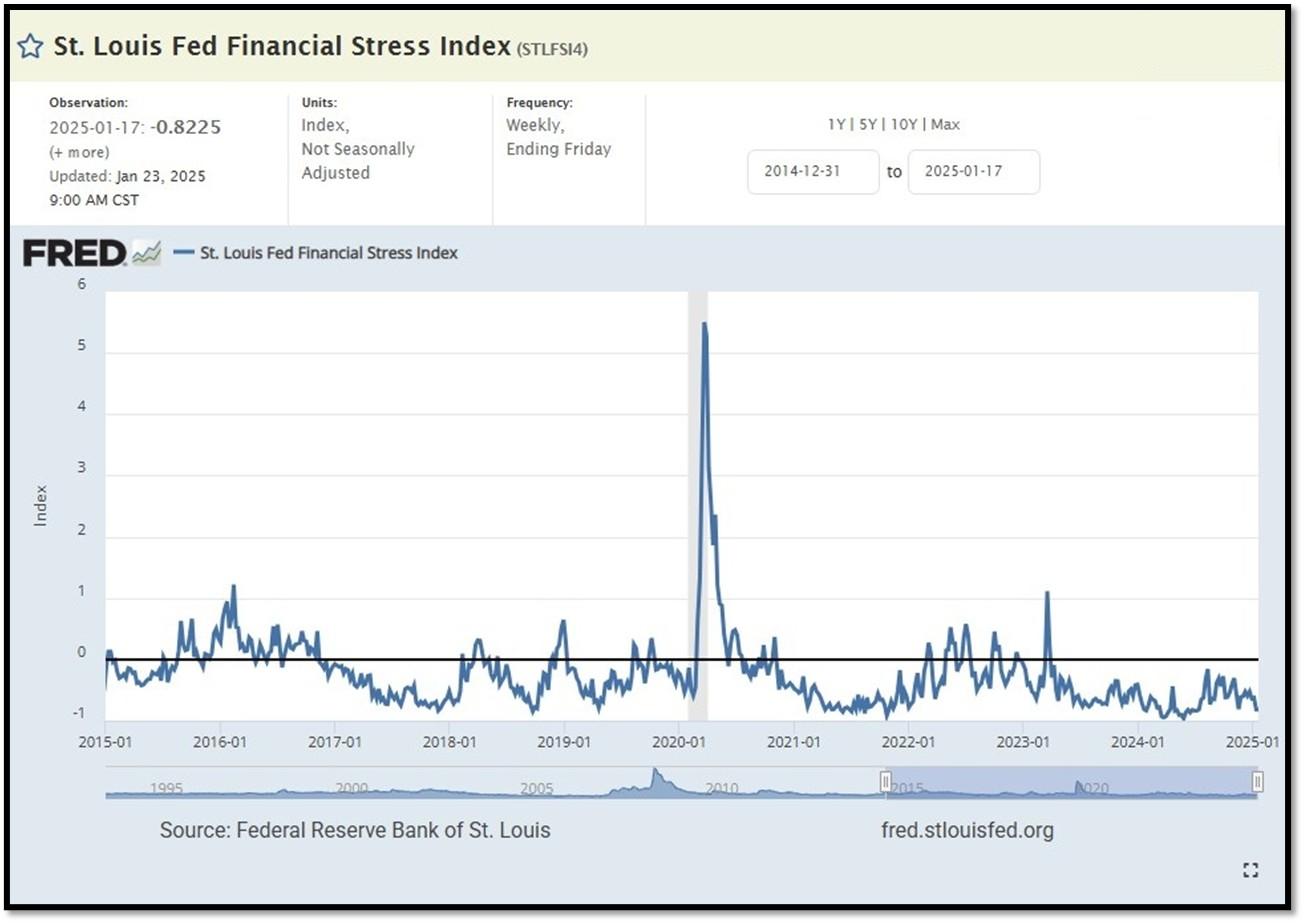
5B. St. Louis Fed Financial Stress Index’s (STLFSI4) most recent read is at –0.8225 as of January 23, 2025. A big spike up from previous readings reflecting the recent turmoil in the banking sector. Previous week’s data was -0.8199. This weekly index is not seasonally adjusted. The STLFSI4 measures the degree of financial stress in the markets and is constructed from 18 weekly data series: seven interest rate series, six yield spreads and five other indicators. Each of these variables captures some aspect of financial stress. Accordingly, as the level of financial stress in the economy changes, the data series are likely to move together. REF: St. Louis Fed
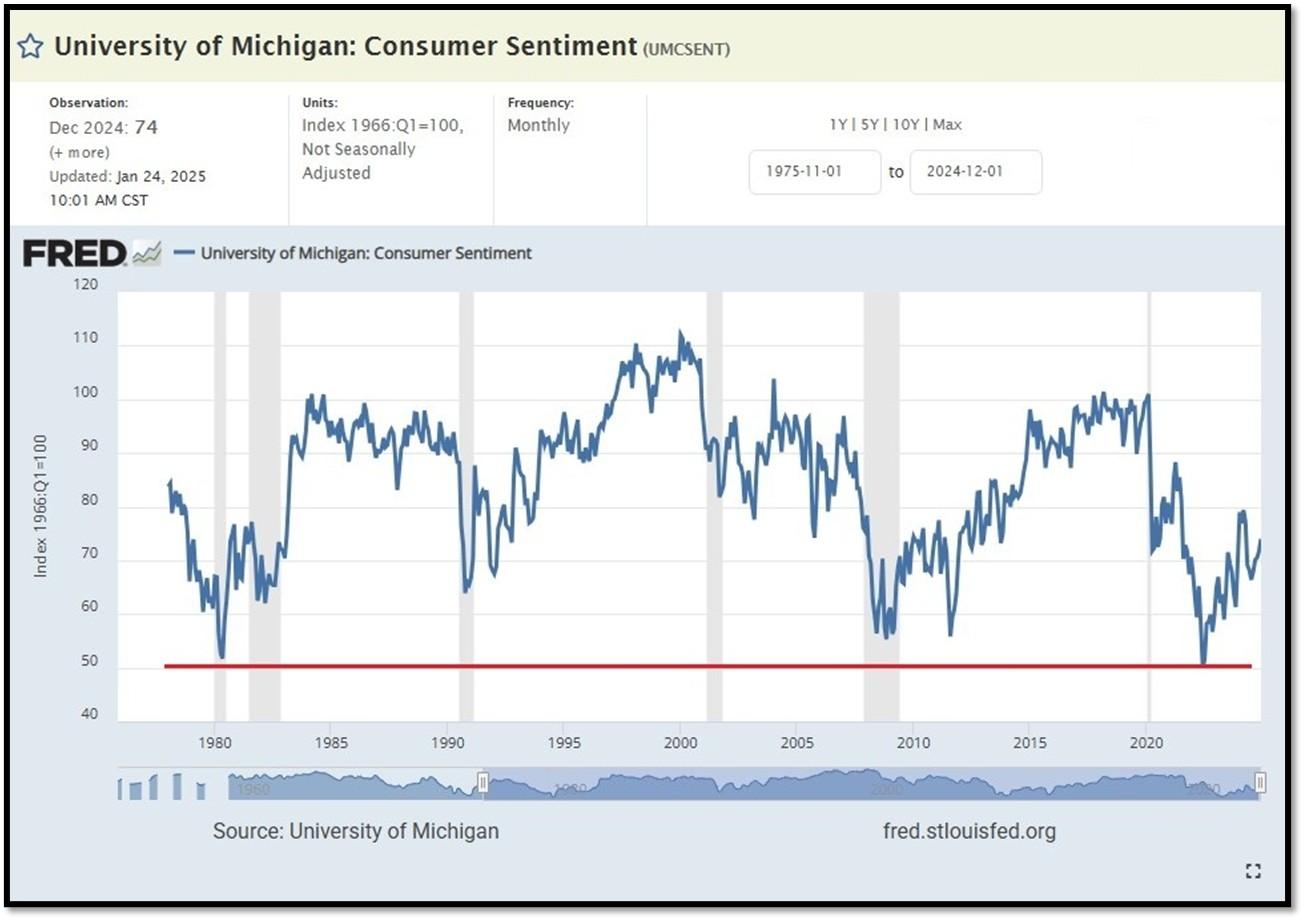
5C. University of Michigan, University of Michigan: Consumer Sentiment for September [UMCSENT] at 74, retrieved from FRED, Federal Reserve Bank of St. Louis, January 24, 2025. Back in June 2022, Consumer Sentiment hit a low point going back to April 1980. REF: UofM
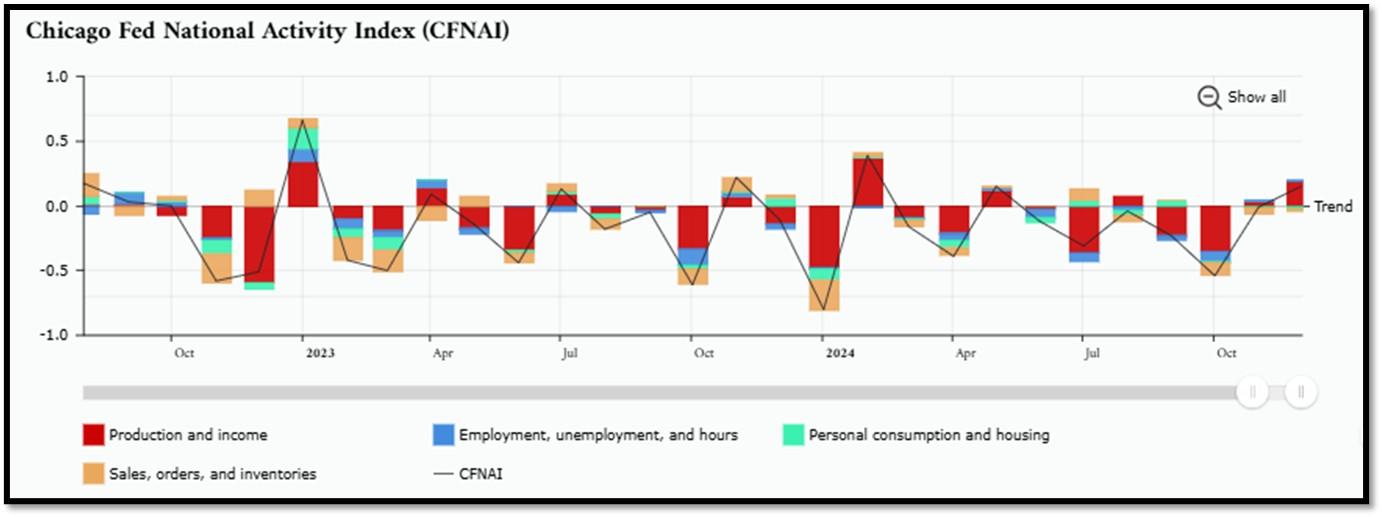
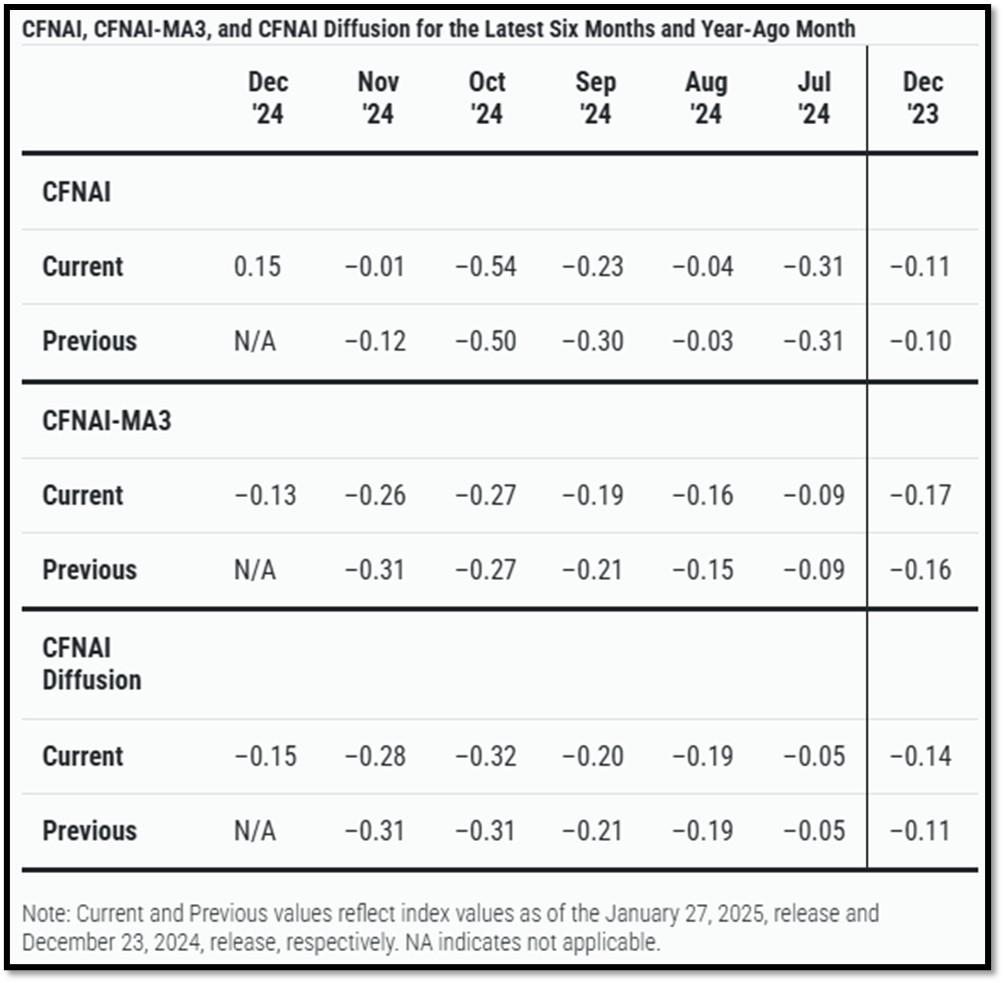
5D. The Chicago Fed National Activity Index (CFNAI) increased to +0.15 in December from –0.01 in November. Two of the four broad categories of indicators used to construct the index increased from November, and two categories made positive contributions in December. The index’s three-month moving average, CFNAI-MA3, increased to –0.13 in December from –0.26 in November. REF: ChicagoFed, December’s Report
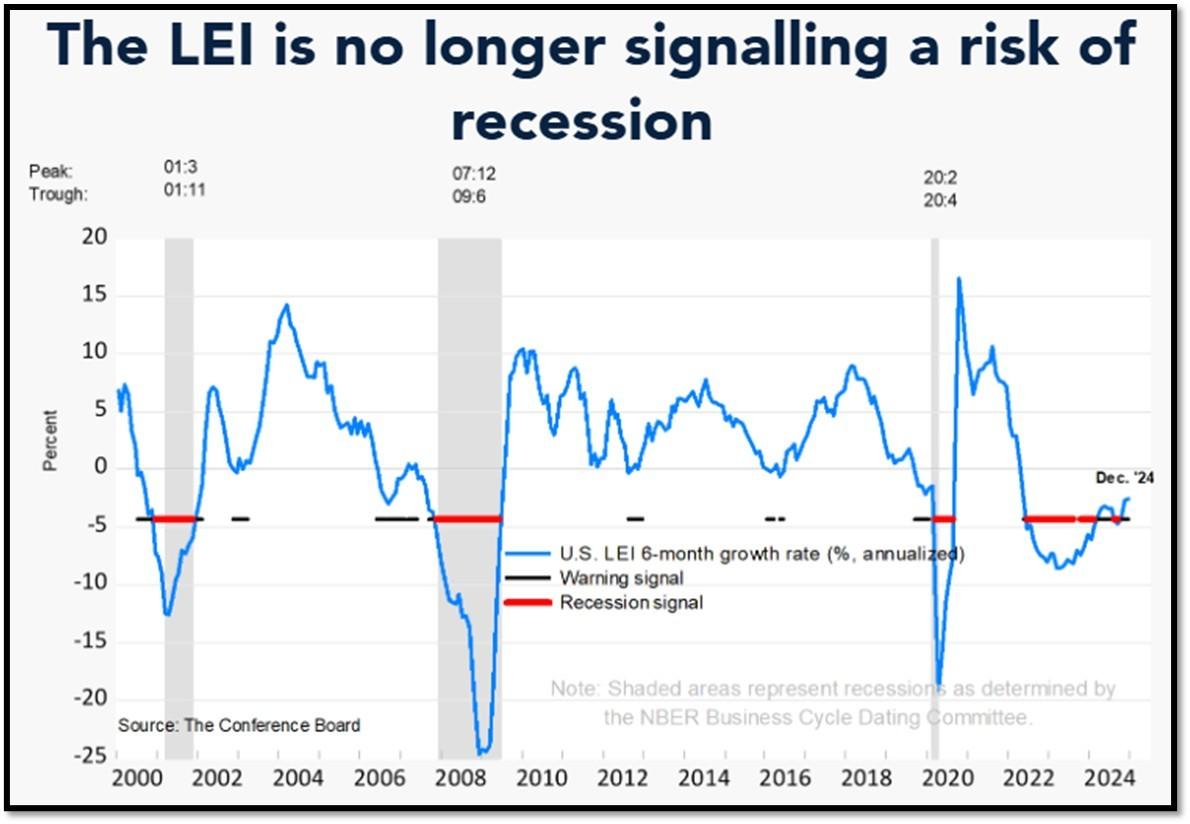
5E. (1/22/2025) The Conference Board Leading Economic Index (LEI) for the US inched down by 0.1% in December 2024 to 101.6 (2016=100), after an upwardly revised increase of 0.4% in November. The LEI declined by 1.3% over the second half of 2024, slightly less than its 1.7% decline over the first half of the last year. The composite economic indexes are the key elements in an analytic system designed to signal peaks and troughs in the business cycle. The indexes are constructed to summarize and reveal common turning points in the economy in a clearer and more convincing manner than any individual component. The CEI is highly correlated with real GDP. The LEI is a predictive variable that anticipates (or “leads”) turning points in the business cycle by around 7 months. Shaded areas denote recession periods or economic contractions. The dates above the shaded areas show the chronology of peaks and troughs in the business cycle. The ten components of The Conference Board Leading Economic Index® for the U.S. include: Average weekly hours in manufacturing; Average weekly initial claims for unemployment insurance; Manufacturers’ new orders for consumer goods and materials; ISM® Index of New Orders; Manufacturers’ new orders for nondefense capital goods excluding aircraft orders; Building permits for new private housing units; S&P 500® Index of Stock Prices; Leading Credit Index™; Interest rate spread (10-year Treasury bonds less federal funds rate); Average consumer expectations for business conditions. REF: ConferenceBoard, LEI Report for November (Released on 1/6/2025)
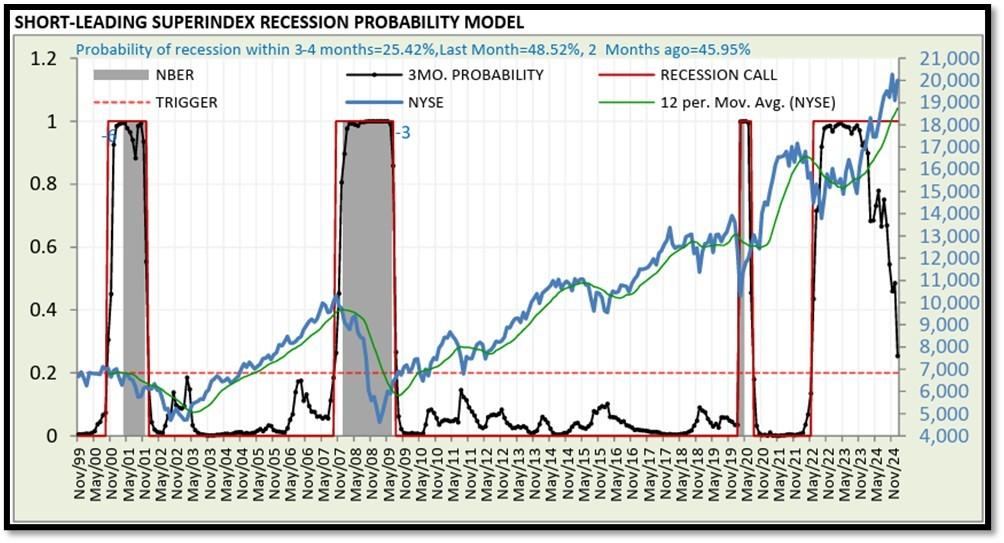
5F. Probability of U.S. falling into Recession within 3 to 4 months is currently at 25.42% (with data as of 01/26/2025 – Next Report 02/10/2025) according to RecessionAlert Research. Last release’s data was at 58.9%. This report is updated every two weeks. REF: RecessionAlertResearch
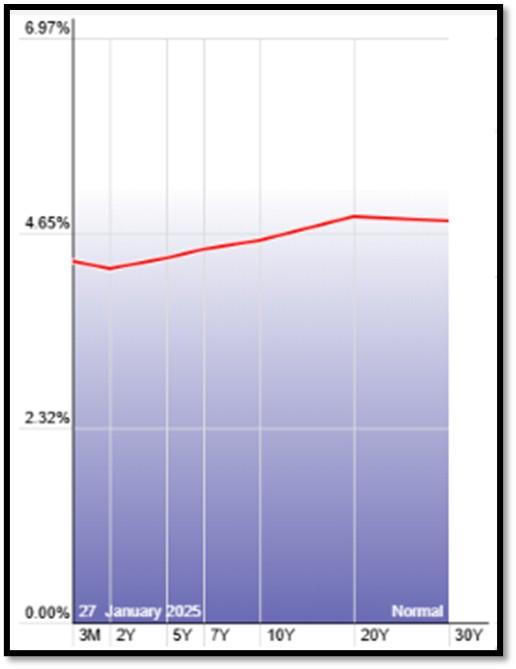
5G. Yield Curve as of 1/27/2025 is showing Normal. Spread on the 10-yr Treasury Yield (4.56%) minus yield on the 2-yr Treasury Yield (4.22%) is currently at 34 bps. REF: Stockcharts The yield curve—specifically, the spread between the interest rates on the ten-year Treasury note and the three-month Treasury bill—is a valuable forecasting tool. It is simple to use and significantly outperforms other financial and macroeconomic indicators in predicting recessions two to six quarters ahead. REF: NYFED
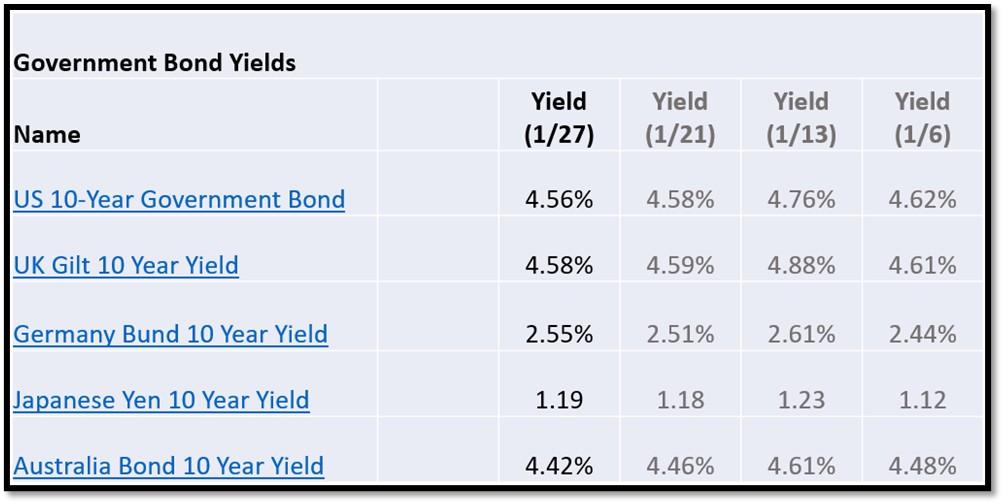
5H. Recent Yields in 10-Year Government Bonds. REF: Source is from Bloomberg.com, dated 1/27/2025, rates shown below are as of 1/27/2025, subject to change.
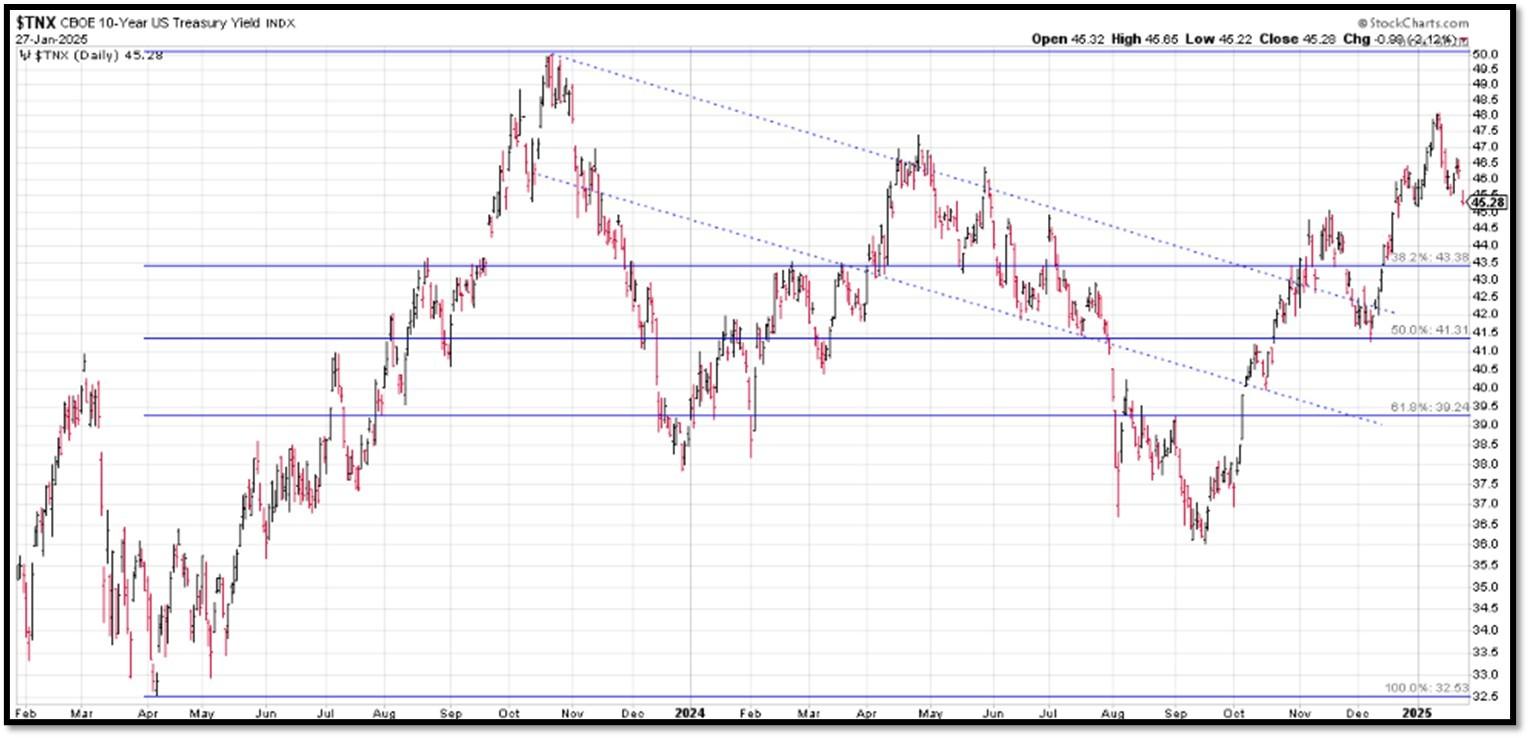
The 10-Year US Treasury Yield… REF: StockCharts1, StockCharts2

10-Year Real Interest Rate at 2.0674% as of 1/15/25. REF: REAINTRATREARAT10Y
Federal government Interest Payments increased $20B+ to $1.1166 Trillion as of Q3-2024. REF: FRED-A091RC1Q027SBEA
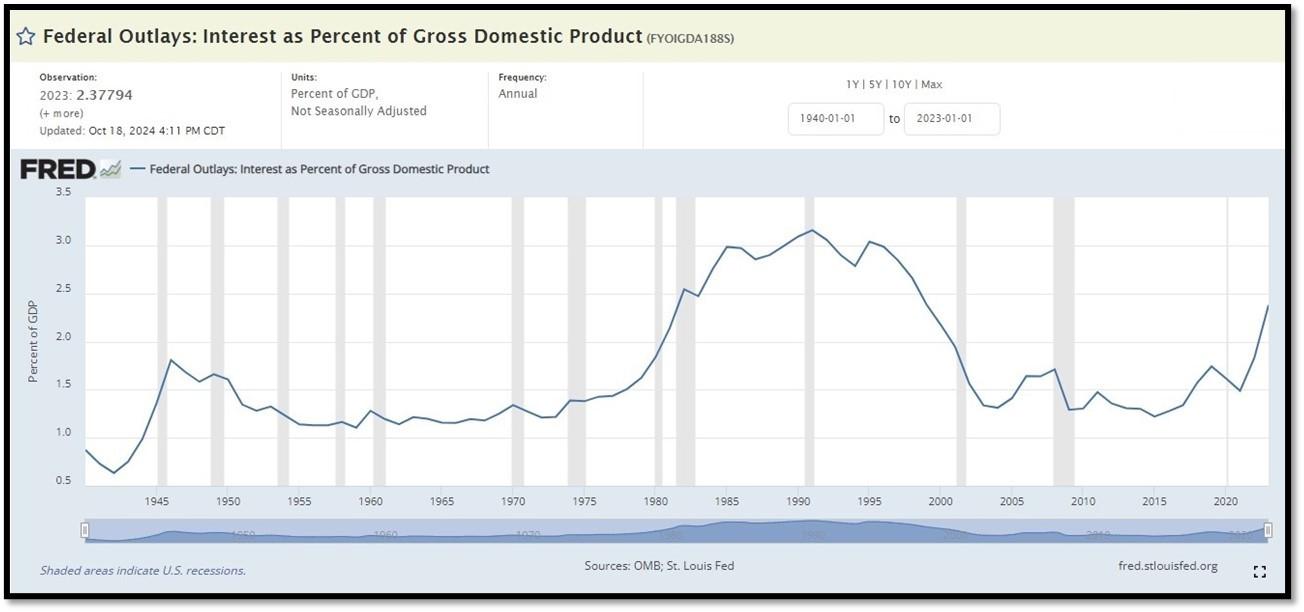
Interest payments as a percentage of GDP increased from 1.84853 in 2022 to 2.37794 as of 10/18/24. REF: FRED-FYOIGDA188S
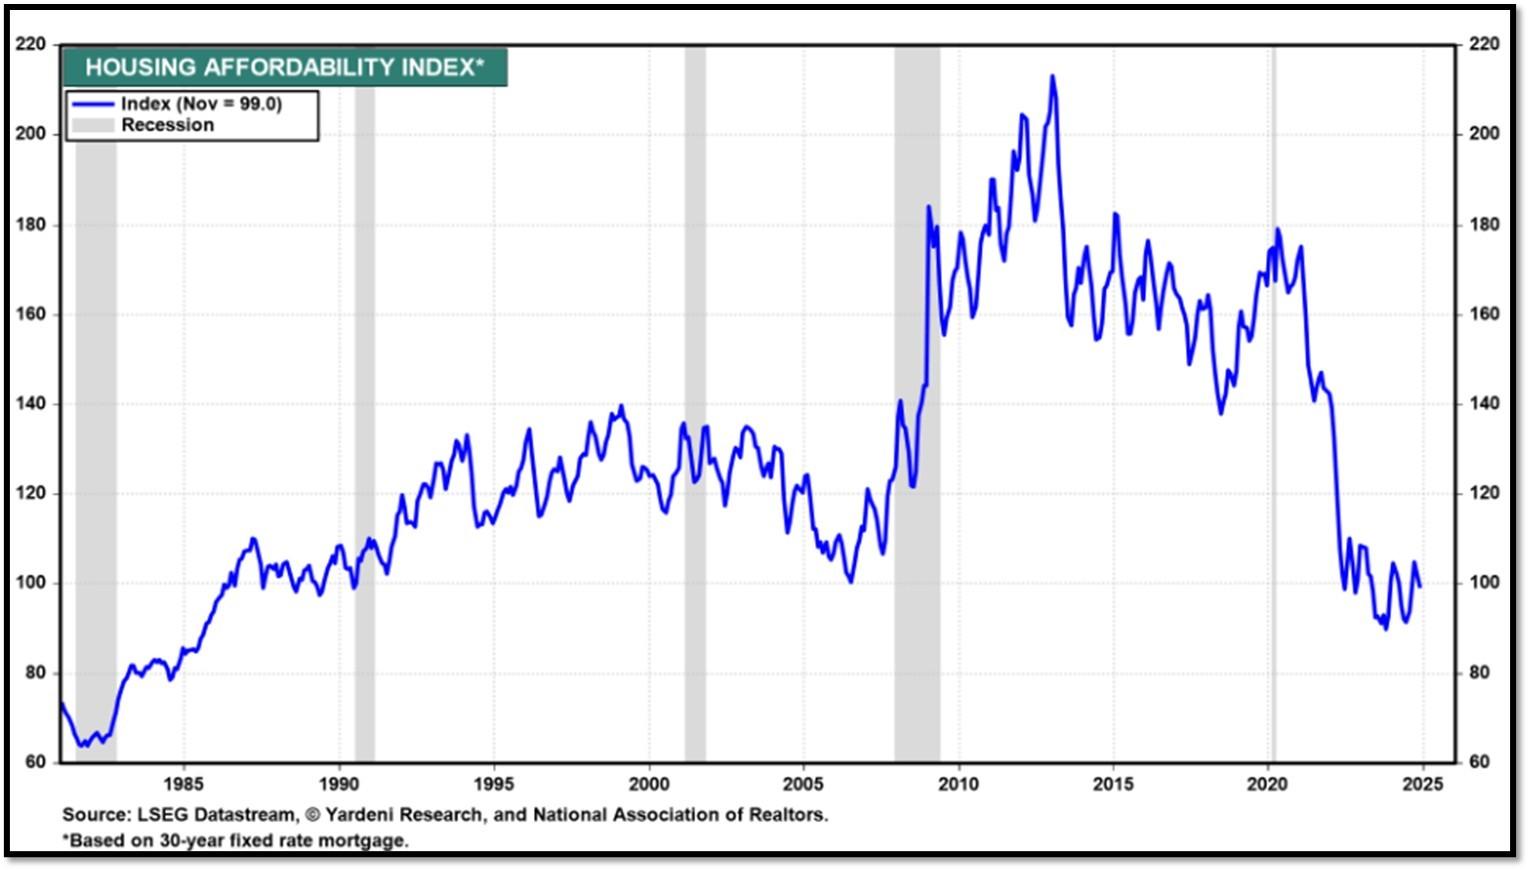
5I. (1/27/2025) Today’s National Average 30-Year Fixed Mortgage Rate is 7.07% (All Time High was 8.03% on 10/19/23). Last week’s data was 7.08%. This rate is the average 30-year fixed mortgage rates from several different surveys including Mortgage News Daily (daily index), Freddie Mac (weekly survey), Mortgage Bankers Association (weekly survey) and FHFA (monthly survey). REF: MortgageNewsDaily, Today’s Average Rate
The recent spike in the 30-year fixed-rate jumbo mortgage to 7.07%, compared to Freddie Mac’s rate at 6.96% and the Mortgage Bankers Association (MBA) rate at 6.75%, highlights key differences in the mortgage market. Jumbo mortgages, which exceed the conforming loan limits set by government agencies like Freddie Mac, typically carry higher interest rates because they are riskier for lenders. These loans are not backed by government entities, which increases the risk for lenders and, consequently, leads to higher rates. In contrast, Freddie Mac and MBA provide averages for conforming loans, which meet federal guidelines and have lower risk due to government backing, keeping their rates lower.
(1/13/25) Housing Affordability Index for Nov = 99 // Oct = 102.3 // Sep = 105.5 // Aug = 98.6 // July = 95 // June = 93.3 // May = 93.1 // April = 95.9 // March = 101.1 // February = 103.0. Data provided by Yardeni Research. REF: Yardeni
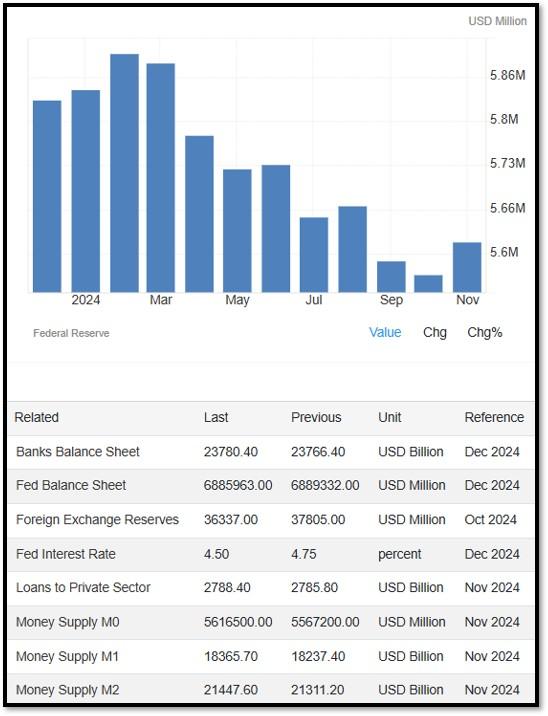
5J. Velocity of M2 Money Stock (M2V) with current read at 1.390 as of (Q3-2024 updated 12/19/2024). Previous quarter’s data was 1.389. The velocity of money is the frequency at which one unit of currency is used to purchase domestically- produced goods and services within a given time period. In other words, it is the number of times one dollar is spent to buy goods and services per unit of time. If the velocity of money is increasing, then more transactions are occurring between individuals in an economy. Current Money Stock (M2) report can be viewed in the reference link. REF: St.LouisFed-M2V
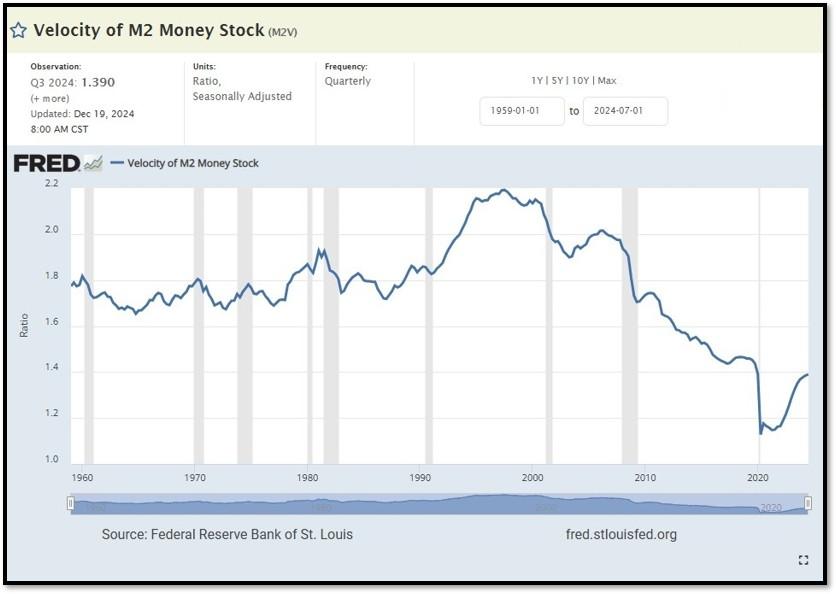
M2 consists of M1 plus (1) small-denomination time deposits (time deposits in amounts of less than $100,000) less IRA and Keogh balances at depository institutions; and (2) balances in retail MMFs less IRA and Keogh balances at MMFs. Seasonally adjusted M2 is constructed by summing savings deposits (before May 2020), small-denomination time deposits, and retail MMFs, each seasonally adjusted separately, and adding this result to seasonally adjusted M1. Board of Governors of the Federal Reserve System (US), M2 [M2SL], retrieved from FRED, Federal Reserve Bank of St. Louis; Updated on November 26, 2024. REF: St.LouisFed-M2
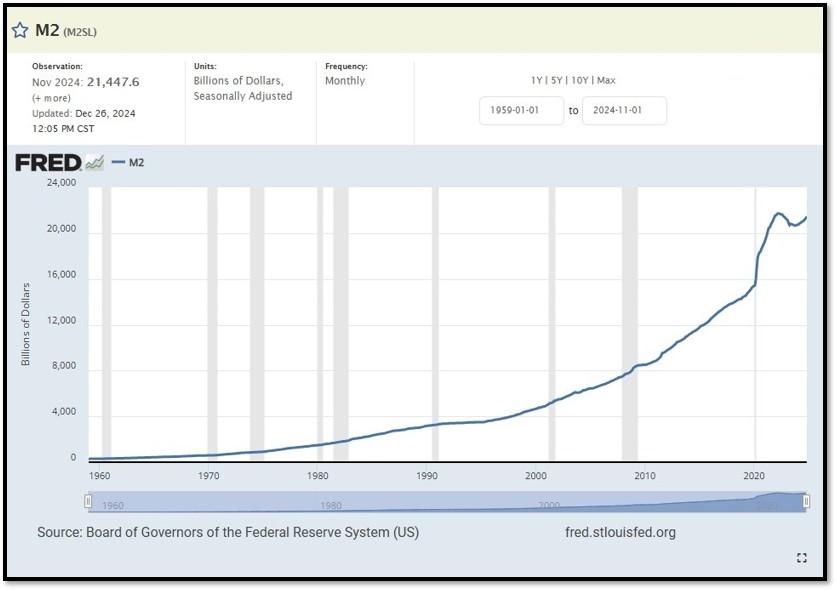
Money Supply M0 in the United States increased to 5,616,500 USD Million in November from 5,567,200 USD Million in October of 2024. Money Supply M0 in the United States averaged 1,160,672.82 USD Million from 1959 until 2024, reaching an all-time high of 6,413,100.00 USD Million in December of 2021 and a record low of 48,400.00 USD Million in February of 1961. REF: TradingEconomics, M0
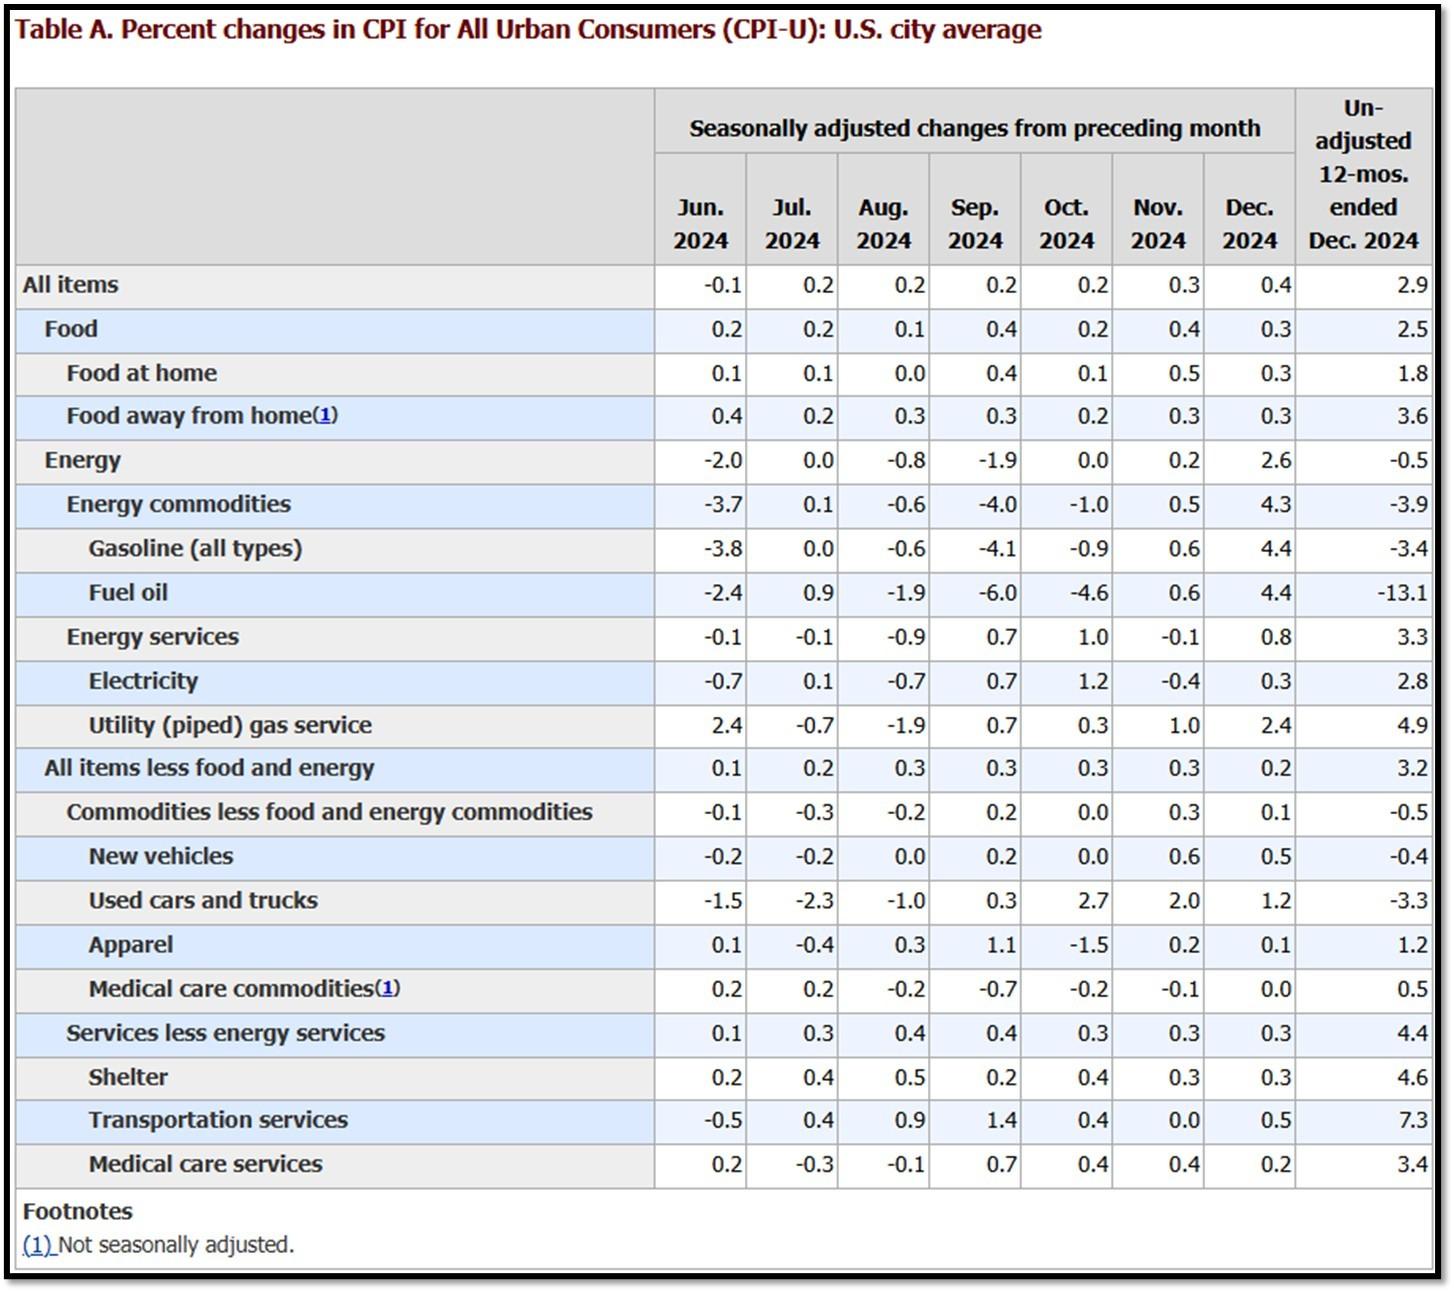
5K. In December, the Consumer Price Index for All Urban Consumers rose 0.4 percent, seasonally adjusted, and rose 2.9 percent over the last 12 months, not seasonally adjusted. The index for all items less food and energy increased 0.2 percent in December (SA); up 3.2 percent over the year (NSA). January 2025 CPI data are scheduled to be released on February 12, 2025, at 8:30AM-ET. REF: BLS, BLS.GOV
5L. Technical Analysis of the S&P500 Index. Click onto reference links below for images.
- Short-term Chart: Bearish to Topping on 1/27/2025 – REF: Short-term S&P500 Chart by Marc Slavin (Click Here to Access Chart)
- Medium-term Chart: Bullish on 1/27/2025 – REF: Medium-term S&P500 Chart by Marc Slavin (Click Here to Access Chart)
- Market Timing Indicators – S&P500 Index as of 1/27/2025 – REF: S&P500 Charts (7 of them) by Joanne Klein’s Top 7 (Click Here to Access Updated Charts)
- A well-defined uptrend channel shown in green with S&P500 still on up trend. REF: Stockcharts
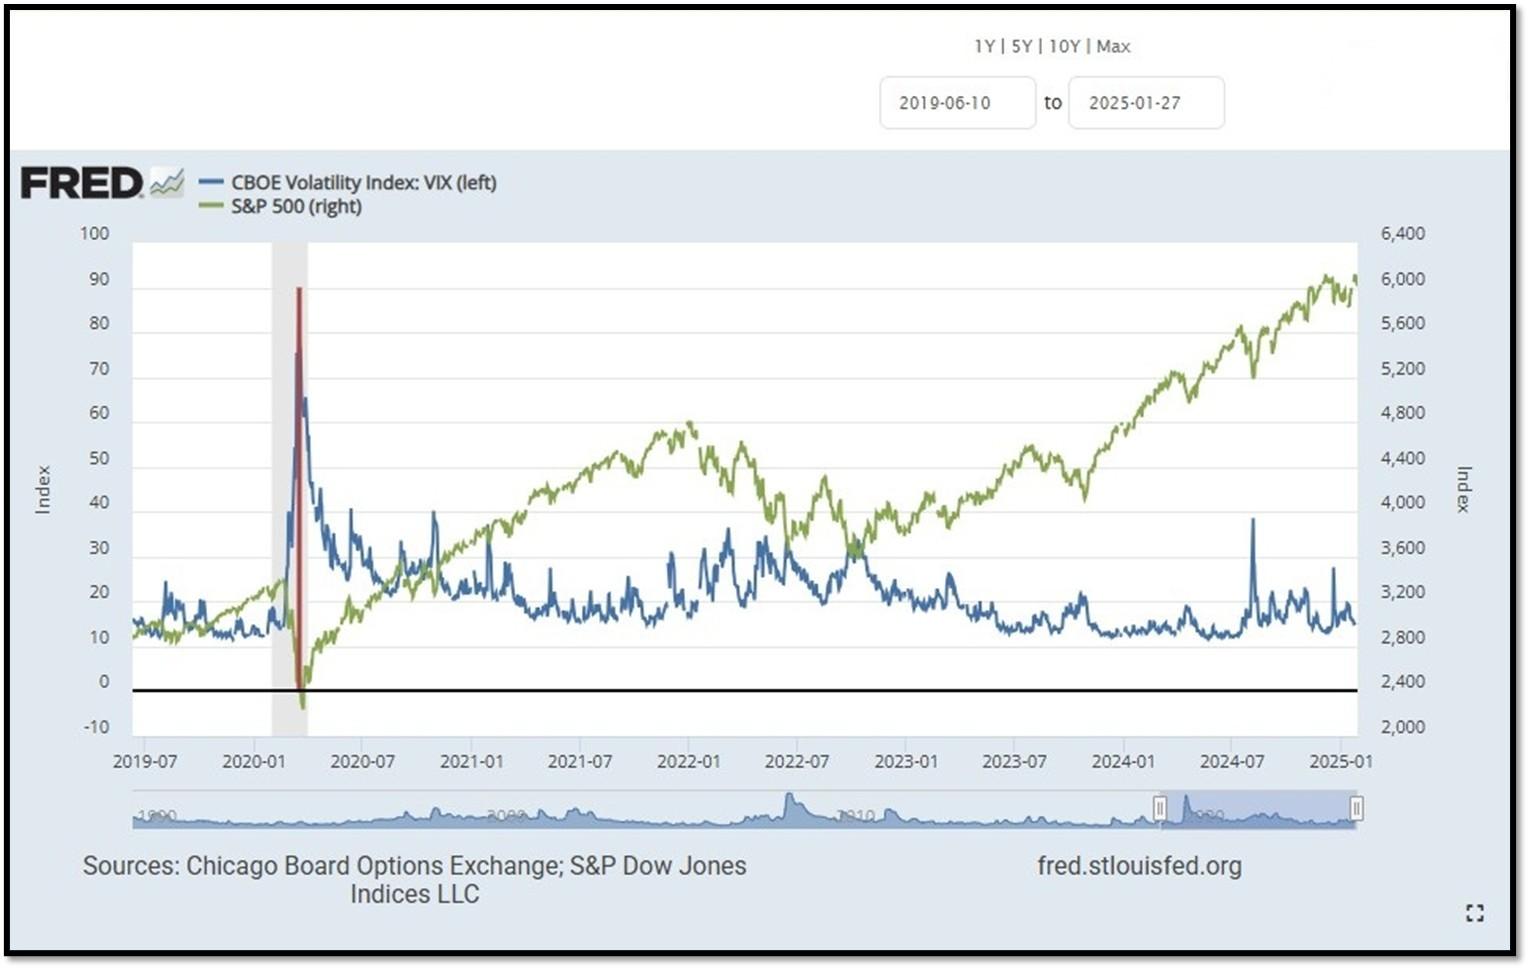
- S&P500 and CBOE Volatility Index (VIX) as of 1/27/2025. REF: FRED, Today’s Print
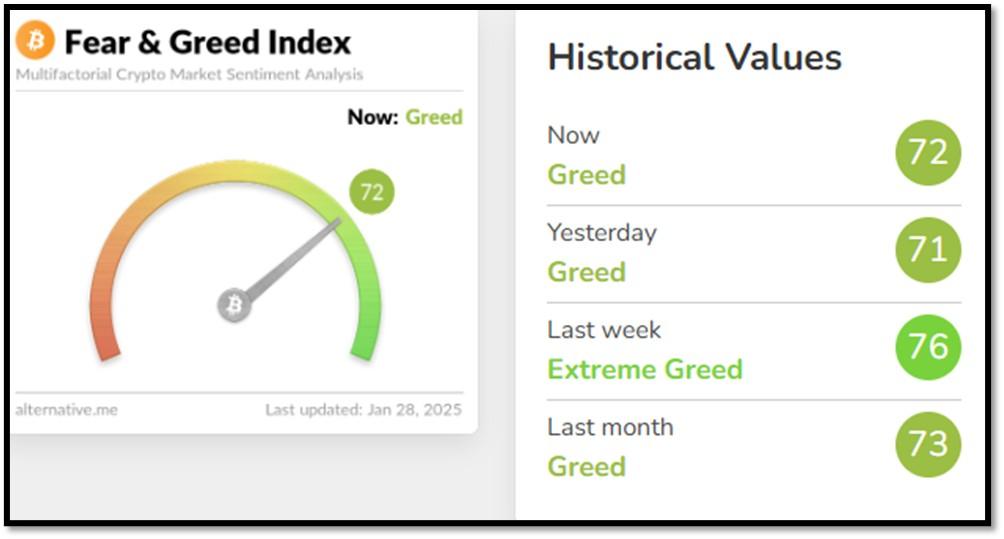
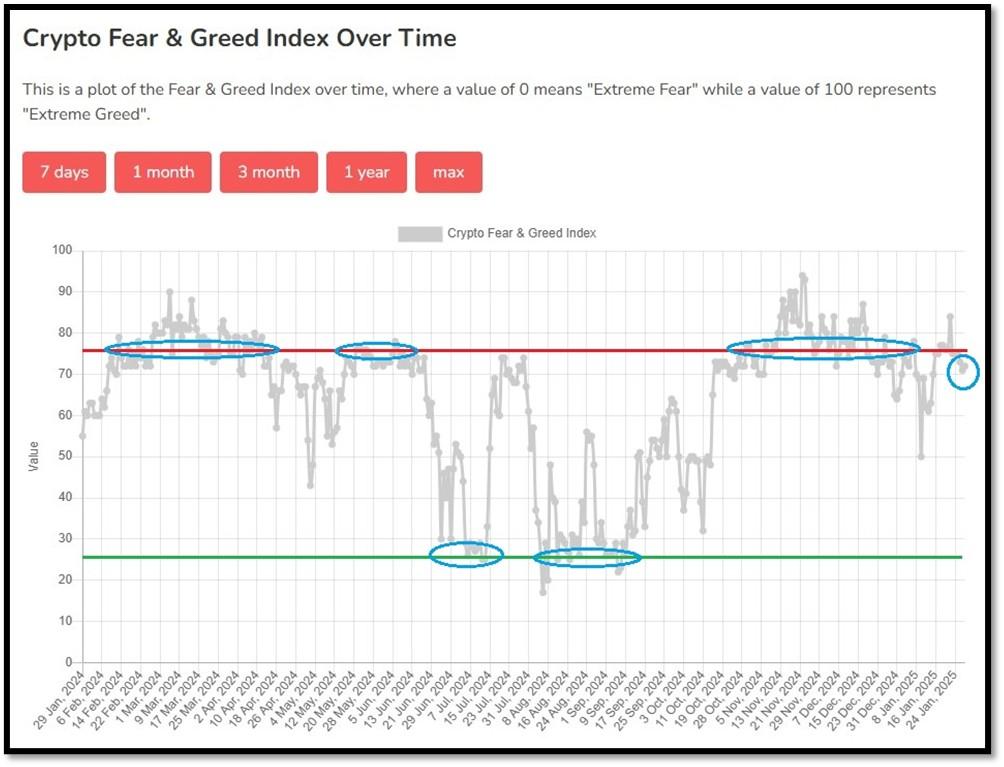
5M. Most recent read on the Crypto Fear & Greed Index with data as of 1/28/2025au is 72 (Greed). Last week’s data was 76 (Extreme Greed) (1-100). Fear & Greed Index – A Contrarian Data. The crypto market behavior is very emotional. People tend to get greedy when the market is rising which results in FOMO (Fear of missing out). Also, people often sell their coins in irrational reaction of seeing red numbers. With the Crypto Fear and Greed Index, the data try to help save investors from their own emotional overreactions. There are two simple assumptions:
- Extreme fear can be a sign that investors are too worried. That could be a buying opportunity.
- When Investors are getting too greedy, that means the market is due for a correction.
Therefore, the program for this index analyzes the current sentiment of the Bitcoin market and crunch the numbers into a simple meter from 0 to 100. Zero means “Extreme Fear”, while 100 means “Extreme Greed”. REF: Alternative.me, Today’sReading
Bitcoin – 10-Year & 2-Year Charts. REF: Stockcharts10Y, Stockcharts2Y
FOR INFORMATIONAL AND EDUCATIONAL USE ONLY – NOT INVESTMENT ADVICE – PLEASE SEE DISCLOSURES AT BOTTOM OF EMAIL.

Len writes much of his own content, and also shares helpful content from other trusted providers like Turner Financial Group (TFG).
The material contained herein is intended as a general market commentary, solely for informational purposes and is not intended to make an offer or solicitation for the sale or purchase of any securities. Such views are subject to change at any time without notice due to changes in market or economic conditions and may not necessarily come to pass. This information is not intended as a specific offer of investment services by Dedicated Financial and Turner Financial Group, Inc.
Dedicated Financial and Turner Financial Group, Inc., do not provide tax, legal or accounting advice. You should consult your own tax, legal and accounting advisors before engaging in any transaction.
Any hyperlinks in this document that connect to Web Sites maintained by third parties are provided for convenience only. Turner Financial Group, Inc. has not verified the accuracy of any information contained within the links and the provision of such links does not constitute a recommendation or endorsement of the company or the content by Dedicated Financial or Turner Financial Group, Inc. The prices/quotes/statistics referenced herein have been obtained from sources verified to be reliable for their accuracy or completeness and may be subject to change.
Past performance is no guarantee of future returns. Investing involves risk and possible loss of principal capital. The views and strategies described herein may not be suitable for all investors. To the extent referenced herein, real estate, hedge funds, and other private investments can present significant risks, including loss of the original amount invested. All indexes are unmanaged, and an individual cannot invest directly in an index. Index returns do not include fees or expenses.
Turner Financial Group, Inc. is an Investment Adviser registered with the United States Securities and Exchange Commission however, such registration does not imply a certain level of skill or training and no inference to the contrary should be made. Additional information about Turner Financial Group, Inc. is also available at www.adviserinfo.sec.gov. Advisory services are only offered to clients or prospective clients where Turner Financial Group, Inc. and its representatives are properly licensed or exempt from licensure. No advice may be rendered by Turner Financial Group, Inc. unless a client service agreement is in place.