

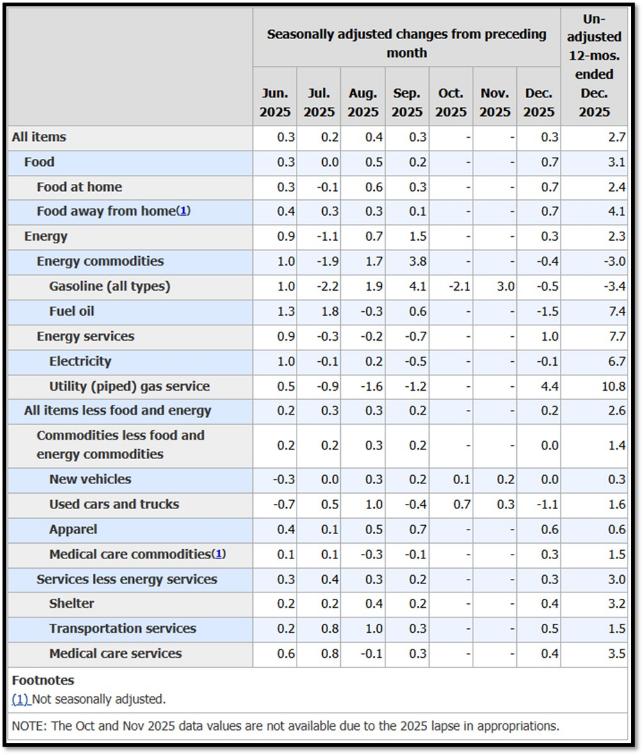
- 1. This week has been packed with key US economic indicators, starting with Tuesday’s December CPI release showing headline inflation rising 0.3% MoM (in line with consensus, up from 0.2% prior) and core CPI at 0.2% MoM (cooler than expected).
- 2. This Week’s Main Story Focuses on The Best of CES 2026. The Consumer Electronics Show 2026, held in Las Vegas in early January (1/6/26 to 1/9/26), was a showcase of futuristic innovation with heavy emphasis on AI integration, advanced robotics, brighter and more colorful TVs, foldable/rollable devices, and practical health/smart home tech.
- 3. The U.S. Federal Communications Commission (FCC) granted SpaceX authorization on January 9, 2026, to construct, deploy, and operate an additional 7,500 second-generation (Gen2) Starlink satellites in low-Earth orbit.
- 4. World Watch
- 4A. The latest wave of anti-government protests in Iran has been met with severe state repression, including an extensive internet and communications blackout designed to isolate demonstrators and control the narrative.
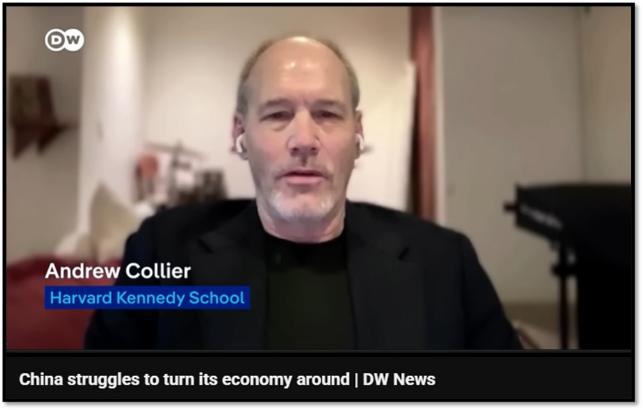
- 4B. China’s economy continues to struggle to find a sustainable growth path, even as official statistics show it remains the world’s second-largest economy. Recent hard data have painted a picture of sluggish domestic demand, weak retail sales, and stalled investment, particularly in the property sector that once powered much of China’s growth.
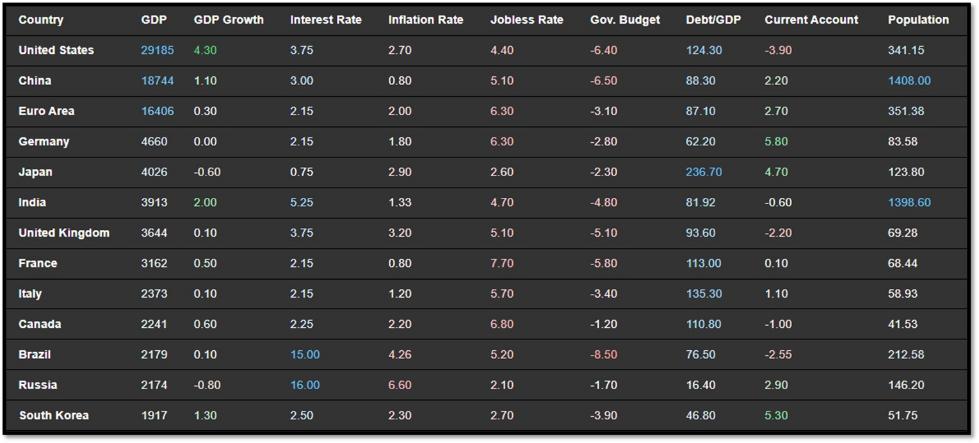
- 4C. An updated snapshot of the current global state of economy.
- 5. Quant & Technical Corner – A selection of quantitative & technical data we monitor on a regular basis to help gauge the overall financial market conditions and the investment environment.
1. This week has been packed with key US economic indicators, starting with Tuesday’s December CPI release showing headline inflation rising 0.3% MoM (in line with consensus, up from 0.2% prior) and core CPI at 0.2% MoM (cooler than expected).
Other notable releases included New Home Sales holding steady around 737K. Wednesday brought Industrial Production (December, forecast 0.1–0.2% MoM) and Capacity Utilization (75.9% to 76.0%), while upcoming data like Retail Sales, PPI (November), and Existing Home Sales (December) remain pending but are expected to influence Fed policy views amid cautious rate cut expectations into mid-2026.
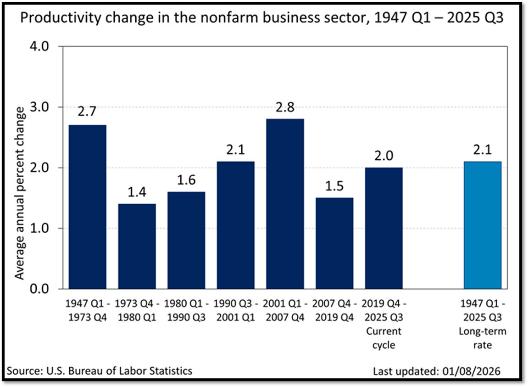
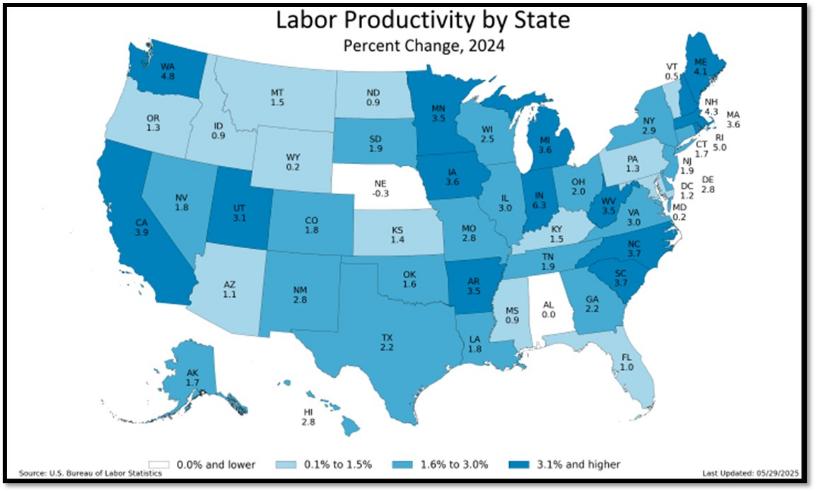
Meanwhile, the U.S. nonfarm business sector saw labor productivity surge +4.9% (annualized) in Q3 2025 (the fastest pace in nearly two years) building on a revised +4.1% in Q2. Output rose +5.4% while hours worked grew just +0.5%, driving unit labor costs down -1.9% despite +2.9% higher hourly compensation. Year-over-year, productivity was up +1.9%, putting the current cycle’s average at 2.0%, stronger than the prior cycle and closer to historical norms. I expect to see consistent gains in productivity data sets due to the current economic expansion in innovation (including but not limited to AI). REF: Briefing, BLS
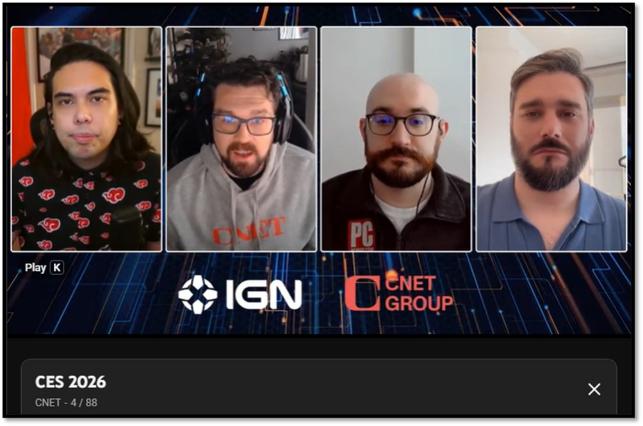
2. This Week’s Main Story Focuses on The Best of CES 2026. The Consumer Electronics Show 2026, held in Las Vegas in early January (1/6/26 to 1/9/26), was a showcase of futuristic innovation with heavy emphasis on AI integration, advanced robotics, brighter and more colorful TVs, foldable/rollable devices, and practical health/smart home tech.
CNET’s live coverage and expert judging (in partnership with PCMag, Mashable, ZDNET, and others) highlighted groundbreaking products through their official Best of CES awards across 22 categories, crowning the Samsung Galaxy Z TriFold as the overall Best of Show for its seamless phone-to-tablet hybrid design. Here are some standout Best of CES 2026 highlights from CNET’s coverage:
- Best Overall: Samsung Galaxy Z TriFold — A slim, futuristic foldable that unfolds into a practical 10-inch tablet-phone hybrid, blending portability with productivity.
- Best Age Tech: Tombot Jennie — A realistic robotic emotional support puppy launching in 2026, designed for dementia patients with lifelike movements, sensors, and companionship features.
- Best Robot: Boston Dynamics Atlas — Impressive humanoid robot with naturalistic walking and heavy-lifting capabilities, ready for real-world manufacturing deployment.
- Best TV-related picks — Samsung’s S95H OLED (35% brighter with anti-burn-in tech) and massive Micro RGB backlit models for superior color and glare-free viewing; LG’s ultra-thin W6 Wallpaper OLED with exceptional brightness.
The event underscored AI’s role in everyday life (from smart assistants to robotic helpers) while pushing boundaries in sustainability and mobility. Many concepts promise to shape consumer tech throughout 2026 and beyond. Click onto pictures below to access videos. REF: CES2026, CNET, Video

3. The U.S. Federal Communications Commission (FCC) granted SpaceX authorization on January 9, 2026, to construct, deploy, and operate an additional 7,500 second-generation (Gen2) Starlink satellites in low-Earth orbit.
This approval doubles the previously authorized Gen2 fleet from 7,500 to a total of 15,000 satellites, allowing modifications to orbital parameters and frequency usage for enhanced performance. The new satellites will support advanced features like direct-to-cell (DTC) connectivity, enabling seamless mobile phone integration for voice, text, and data services, particularly expanding outside the U.S. This builds on SpaceX’s ongoing Starlink rollout, which already has thousands of satellites providing global broadband internet to over 3 million subscribers.
The significance of this expansion lies in its potential to dramatically improve worldwide internet access, delivering gigabit speeds and low-latency connections to remote and underserved regions, thereby bridging the digital divide and supporting applications in education, healthcare, and emergency response. Implications include strengthening SpaceX’s competitive edge in the satellite broadband market against rivals like Amazon’s Project Kuiper, while accelerating innovations in space-based communications. However, it also raises concerns about orbital congestion, increased risk of space debris, potential interference with astronomical observations, and regulatory challenges regarding spectrum allocation and environmental impacts. Overall, this move positions Starlink for broader global dominance but underscores the need for sustainable space practices. REF: FCC, SatelliteToday, Starlink
Our clients get access to SpaceX currently via the following funds.
- ARK Venture Fund: https://www.ark-funds.com/funds/arkvx
- Baron Focus Growth Fund: https://www.baroncapitalgroup.com/product-detail/baron-focused-growth-fund-bfgix
- PrivateShares Fund: https://privatesharesfund.com/
NOTE: Not investment/tax advice or recommendations. Investors should carefully consider the investment objectives, risks, charges, and expenses before investing. For additional information about the securities mentioned above, please visit the respective security’s investor relations page(s) for additional information. Please read all materials carefully before investing.

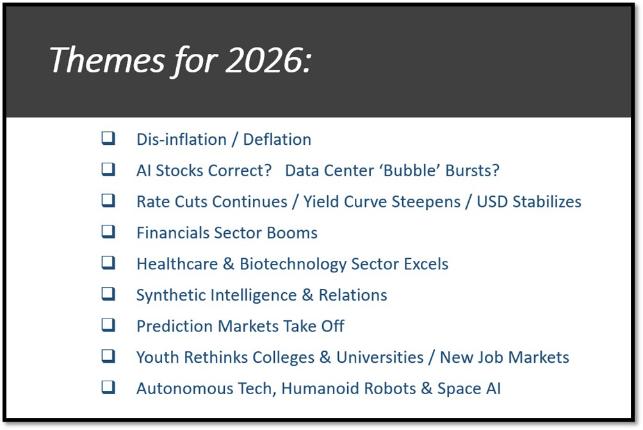
Below is a slide from my market update slide deck. Feel free to schedule a presentation for you and your audience.
4. World Watch
4A. The latest wave of anti-government protests in Iran has been met with severe state repression, including an extensive internet and communications blackout designed to isolate demonstrators and control the narrative.
Authorities have sharply curtailed domestic and international connectivity, disrupting messaging platforms, social media, and independent reporting, while security forces have responded with lethal force in multiple cities. Human rights groups report large-scale casualties, with estimates indicating that thousands of protesters may have been killed, far exceeding the toll of many prior unrest episodes. The breadth of the shutdown and the intensity of the crackdown underscore the regime’s growing reliance on coercion rather than accommodation as public dissent spreads.
What differentiates this protest movement from earlier uprisings is its structural and nationwide character. Rather than being sparked by a single incident, the demonstrations reflect accumulated economic stress, persistent inflation, unemployment, and declining living standards that cut across class, ethnic, and regional lines. Workers, merchants, students, and professionals have participated simultaneously, producing a more durable and less easily fragmented movement. The implications are significant: domestically, the protests expose deep legitimacy challenges for the ruling system and increase the risk of long-term instability; internationally, the scale of repression and information suppression heightens pressure on foreign governments to respond, potentially affecting sanctions policy, regional diplomacy, and Iran’s broader economic and geopolitical position. Click onto picture below to get the most recent video from DW. REF: WSJ, Bloomberg

4B. China’s economy continues to struggle to find a sustainable growth path, even as official statistics show it remains the world’s second-largest economy. Recent hard data have painted a picture of sluggish domestic demand, weak retail sales, and stalled investment, particularly in the property sector that once powered much of China’s growth.
In November 2025, industrial output grew at its slowest pace in over a year and retail sales were far below expectations, raising concerns that export strength alone cannot compensate for faltering internal economic momentum. Persistent property market weakness, with falling prices and declining new investment, has dampened household wealth and consumer confidence, making it harder for spending to drive growth. At the same time, investment in fixed assets and infrastructure has contracted, reflecting both cautious private sector sentiment and government efforts to rein in “involution” or counterproductive competition in key industries.
Economists such as Andrew Collier of the Harvard Kennedy School have pointed to deeper structural problems underlying these headline figures. Collier has highlighted how China’s economy has lost one of its principal engines of growth (the once-booming property sector) and is struggling to replace it with robust alternatives such as consumption or high-value services. The slowdown in real estate has left local governments with shrinking tax revenues, constrained private investment, and overcapacity in manufacturing that depresses prices and corporate profitability. Collier has also emphasized the impact of China’s debt dynamics, where state-directed credit continues to favor large, state-owned firms at the expense of private sector dynamism, exacerbating economic fragility and limiting the scope for broad-based recovery. Analysts argue that without meaningful shifts toward boosting consumption, easing overcapacity, and reforming structural imbalances, Beijing’s limited toolkit of stimulus measures will be insufficient to deliver a durable turnaround. Click onto picture below to access video. REF: DWNews
4C. An updated snapshot of the current global state of economy.
According to TradingEconomics as of 1/12/2026 (REF: TradingEconomics):
- The US unemployment rate edged down to 4.4% in December 2025, from a revised 4.5% in November, which had marked the highest level since October 2021.
- China’s annual inflation rate edged higher to 0.8% in December 2025 from 0.7% in the prior month, marking the highest level since February 2023 but falling short of market forecasts for 0.9%.
- Germany’s annual inflation rate fell to 1.8% in December 2025, down from 2.3% in November and below market expectations of 2.0%, according to preliminary data.
- The consumer price inflation rate in India rose to 1.33% in December of 2025 from 0.71% in the earlier month, extending the normalization from the record low of 0.25% in October but below the market consensus of 1.5%.
5. Quant & Technical Corner – A selection of quantitative & technical data we monitor on a regular basis to help gauge the overall financial market conditions and the investment environment.
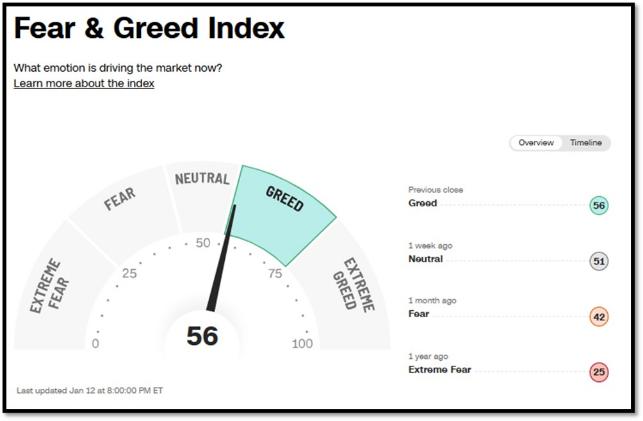
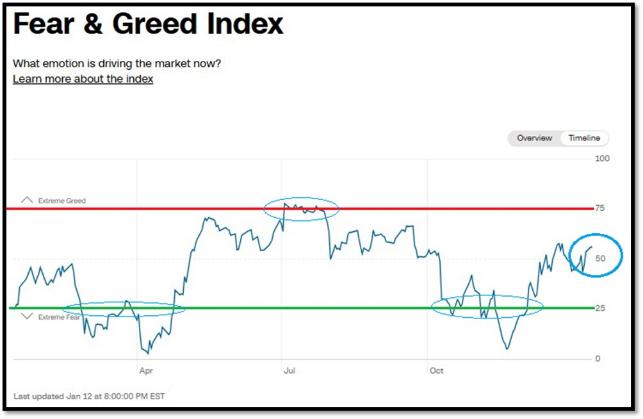
5A. Most recent read on the Fear & Greed Index with data as of 1/12/2026 – 8:00 PM-ET is 56 (Greed). Last week’s data was 51 (Neutral) (1-100). CNNMoney’s Fear & Greed index looks at 7 indicators (Stock Price Momentum, Stock Price Strength, Stock Price Breadth, Put and Call Options, Junk Bond Demand, Market Volatility, and Safe Haven Demand). Keep in mind this is a contrarian indicator! REF: Fear&Greed via CNNMoney
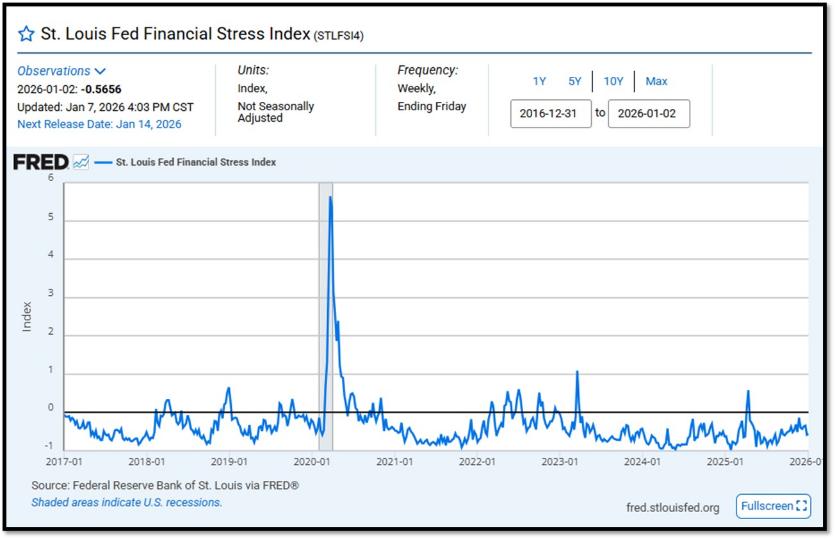
5B. St. Louis Fed Financial Stress Index’s (STLFSI4) most recent read is at –0.5656 as of January 7, 2025. Previous week’s data was -0.5822. A big spike up from previous readings reflecting the turmoil in the banking sector back in 2023. This weekly index is not seasonally adjusted. The STLFSI4 measures the degree of financial stress in the markets and is constructed from 18 weekly data series: seven interest rate series, six yield spreads and five other indicators. Each of these variables captures some aspect of financial stress. Accordingly, as the level of financial stress in the economy changes, the data series are likely to move together. REF: St. Louis Fed
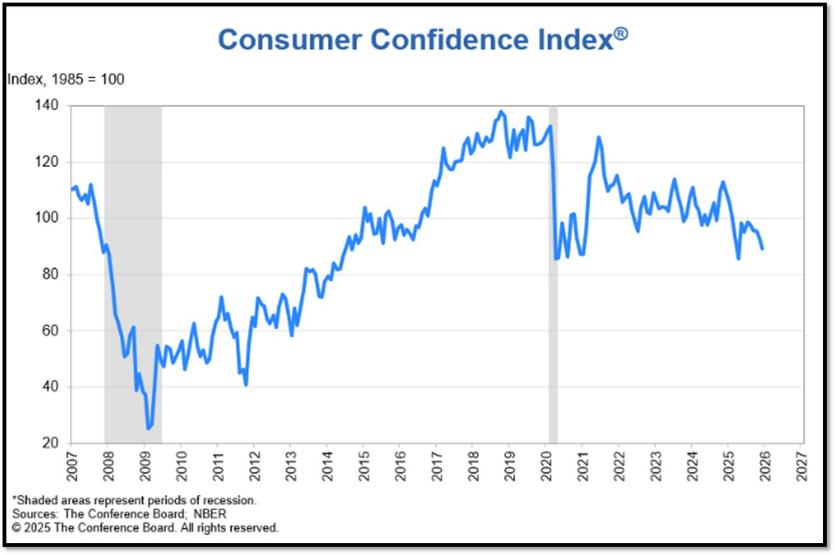
5C. “Despite an upward revision in November related to the end of the shutdown, consumer confidence fell again in December and remained well below this year’s January peak. Four of five components of the overall index fell, while one was at a level signaling notable weakness,” said Dana M Peterson, Chief Economist, The Conference Board. The Conference Board Consumer Confidence Index® declined by 3.8 points in December to 89.1 (1985=100), from 92.9 in November. REF: ConsumerConfidence
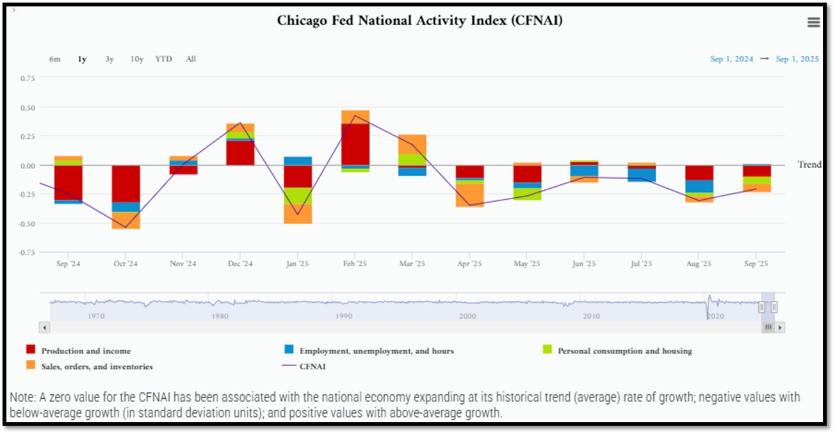
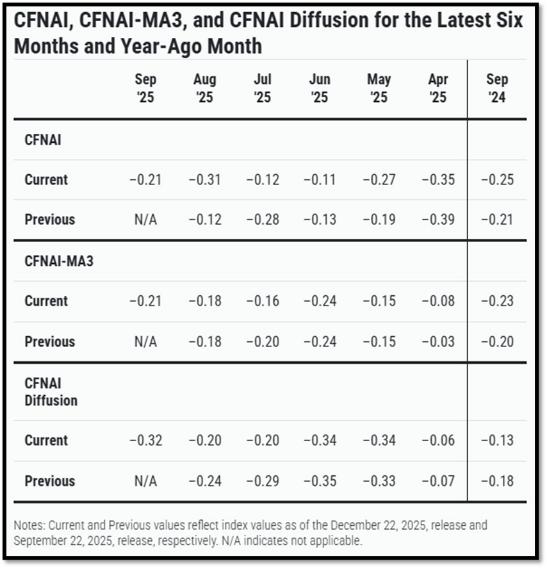
5D. The Chicago Fed National Activity Index (CFNAI) increased to –0.21 in September from –0.31 in August. Two of the four broad categories of indicators used to construct the index decreased from August, and three categories made negative contributions in September. The index’s three-month moving average, CFNAI-MA3, decreased to –0.21 in September from –0.18 in August. REF: ChicagoFed, September’s Report
5E. (12/9/2025) The Conference Board Leading Economic Index® (LEI) for the US declined by 0.3% in September 2025 to 98.3 (2016=100), after also declining by 0.3% in August (upwardly revised from an originally reported 0.5% decline). Overall, the LEI fell by 2.1% over the six months between March and September 2025, a faster rate of decline than its 1.3% contraction over the previous six-month period (September 2024 to March 2025). The composite economic indexes are the key elements in an analytic system designed to signal peaks and troughs in the business cycle. The indexes are constructed to summarize and reveal common turning points in the economy in a clearer and more convincing manner than any individual component. The CEI is highly correlated with real GDP. The LEI is a predictive variable that anticipates (or “leads”) turning points in the business cycle by around 7 months. Shaded areas denote recession periods or economic contractions. The dates above the shaded areas show the chronology of peaks and troughs in the business cycle. The ten components of The Conference Board Leading Economic Index® for the U.S. include: Average weekly hours in manufacturing; Average weekly initial claims for unemployment insurance; Manufacturers’ new orders for consumer goods and materials; ISM® Index of New Orders; Manufacturers’ new orders for nondefense capital goods excluding aircraft orders; Building permits for new private housing units; S&P 500® Index of Stock Prices; Leading Credit Index™; Interest rate spread (10-year Treasury bonds less federal funds rate); Average consumer expectations for business conditions. REF: ConferenceBoard, LEI Report for November (ReceesionAlert) (Released on 12/30/2025)
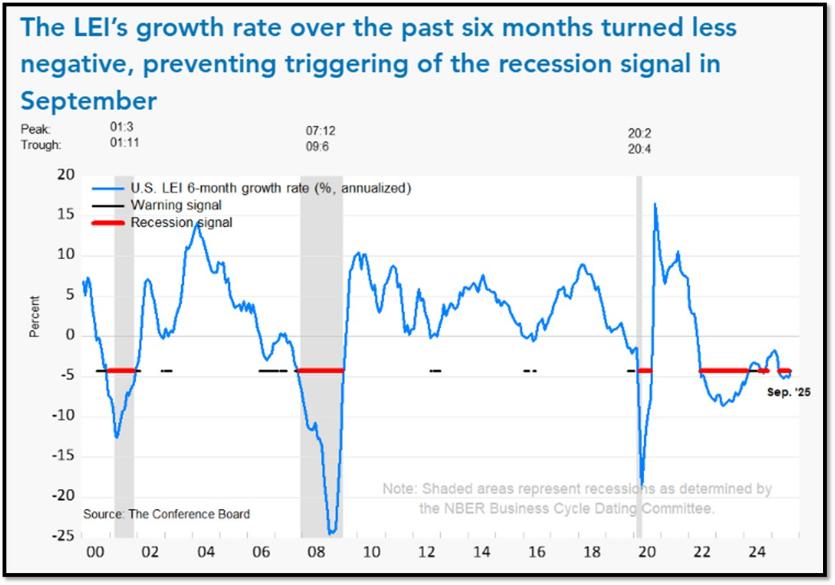
We have experienced a “rolling recession” since June 2022 and are only now emerging from it. However, authorities are not labeling it a recession due to high employment data from June 2022-2025.
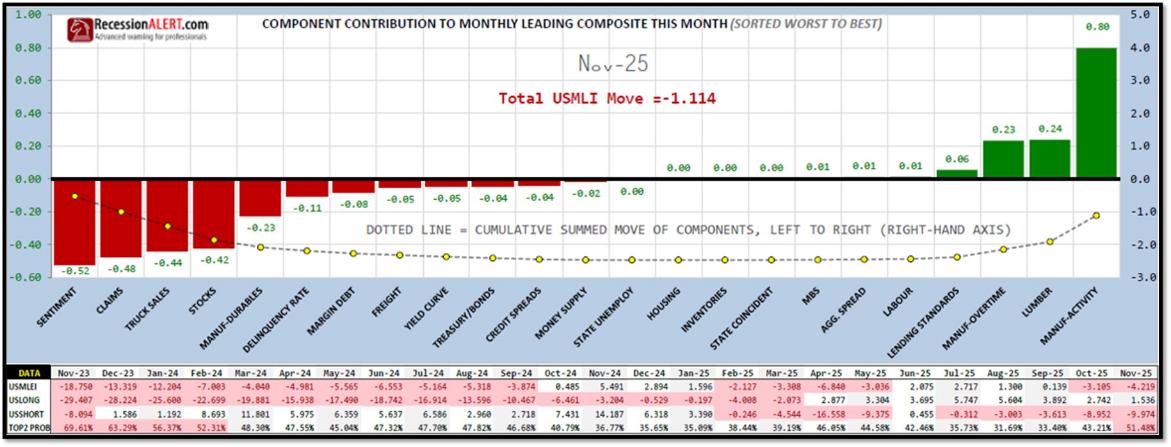
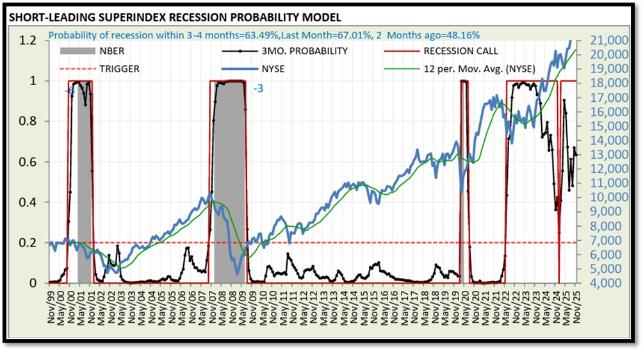
5F. Probability of U.S. falling into Recession within 3 to 4 months is currently at 63.49% (with data as of 12/01/2025 – Next Report 12/15/2025) according to RecessionAlert Research. Last release’s data was at 46.3%. This report is updated every two weeks. REF: RecessionAlertResearch
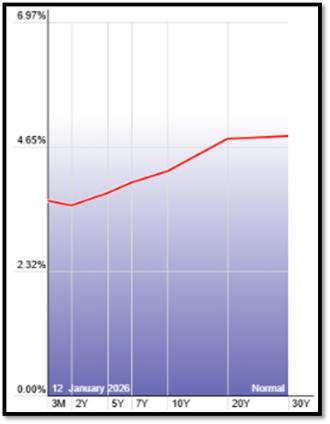
5G. Yield Curve as of 1/12/2026 is showing Normal. Spread on the 10-yr Treasury Yield (4.19%) minus yield on the 2-yr Treasury Yield (3.55%) is currently at 64bps. REF: Stockcharts The yield curve—specifically, the spread between the interest rates on the ten-year Treasury note and the three-month Treasury bill—is a valuable forecasting tool. It is simple to use and significantly outperforms other financial and macroeconomic indicators in predicting recessions two to six quarters ahead. REF: NYFED
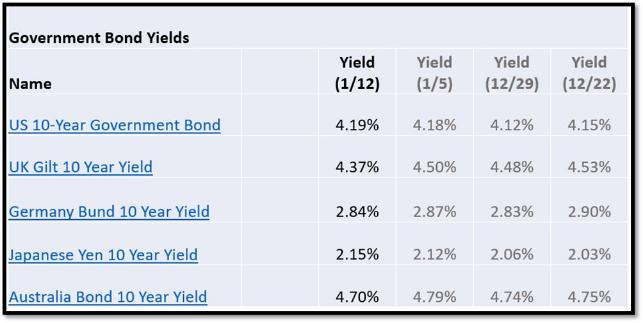
5H. Recent Yields in 10-Year Government Bonds. REF: Source is from Bloomberg.com, dated 1/12/2026, rates shown below are as of 1/12/2026, subject to change.
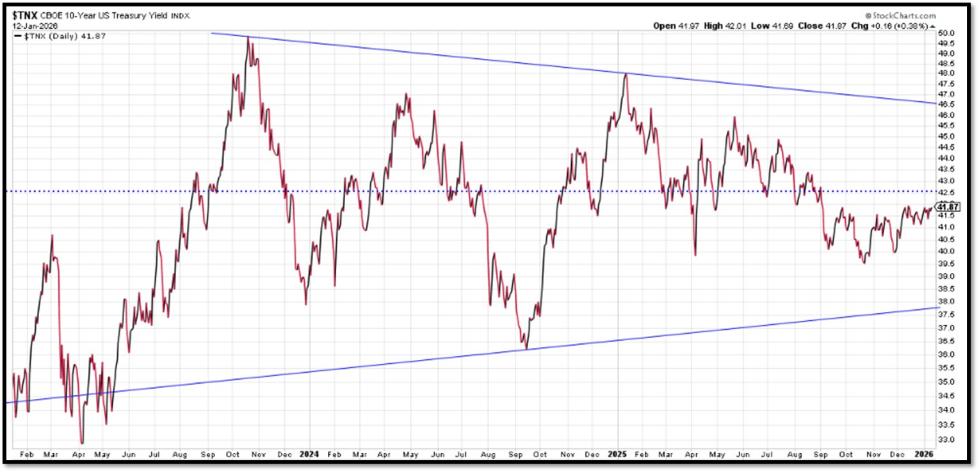
The 10-Year US Treasury Yield… The 10-Year Yield is indirectly related to inflation and prospect of the economy. I expect the 10-Year Yield to drop towards the support line. REF: StockCharts1
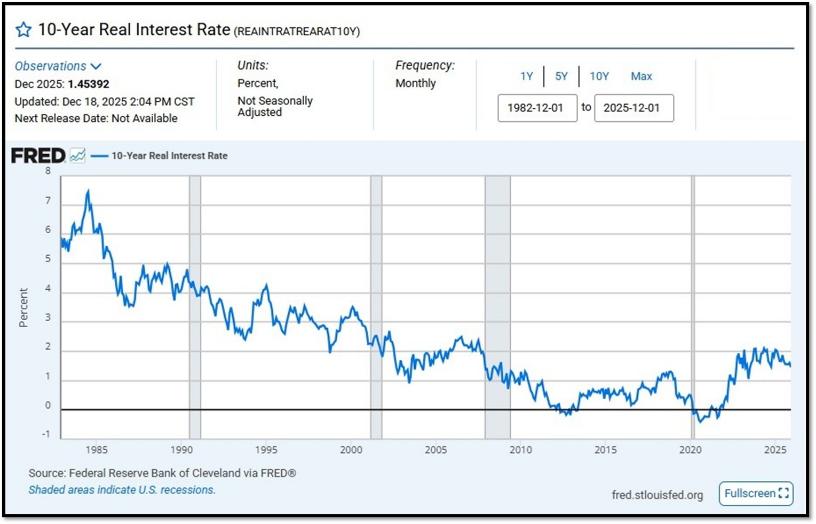
10-Year Real Interest Rate at 1.45392% as of 12/18/25. Last month’s data was 1.56911%. REF: REAINTRATREARAT10Y
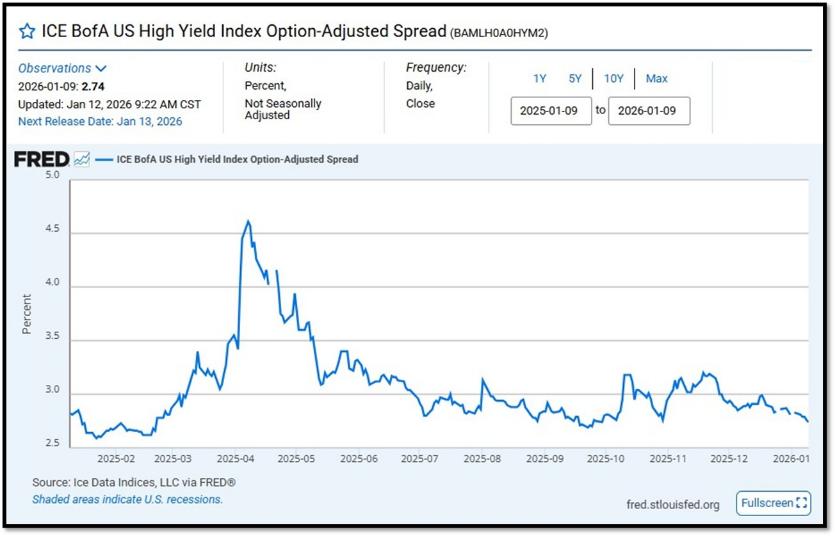
ICE BofA US High Yield Index Option-Adjusted Spread (BAMLH0A0HYM2) currently at 2.74 as of January 12, 2026. This is a key indicator of market sentiment, particularly regarding risk and economic health. At its core, the spread reflects the extra return investors demand to hold riskier corporate debt over safer government securities. High-yield bonds are issued by companies with lower credit ratings (below investment grade, like BB or lower), meaning they carry a higher chance of default. The spread compensates for this risk. When the spread is narrow—say, around 2.5% to 3%, as seen recently—it suggests investors are confident, willing to accept less extra yield because they perceive lower default risk or a strong economy. Narrow spreads often align with bullish markets, where cash is flowing, growth is steady, and fear is low. REF: FRED-BAMLH0A0HYM2
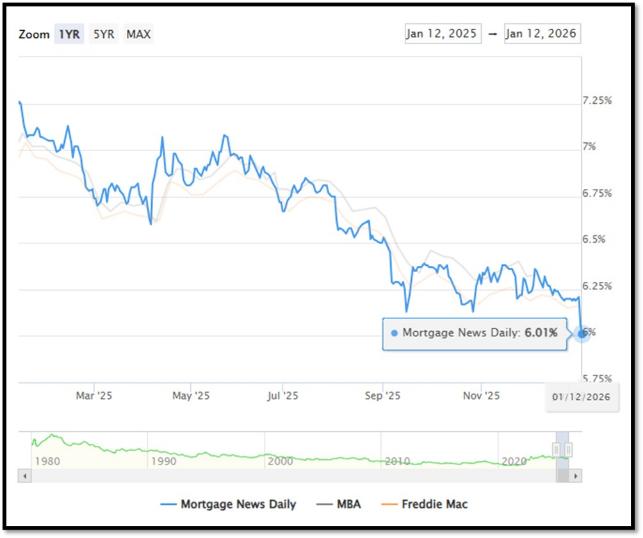
5I. (1/12/2026) Today’s National Average 30-Year Fixed Mortgage Rate is 6.01% (All Time High was 8.03% on 10/19/23). Last week’s data was 6.19%. This rate is the average 30-year fixed mortgage rates from several different surveys including Mortgage News Daily (daily index), Freddie Mac (weekly survey), Mortgage Bankers Association (weekly survey) and FHFA (monthly survey). REF: MortgageNewsDaily, Today’s Average Rate
The recent spike in the 30-year fixed-rate jumbo mortgage to 6.01%, compared to Freddie Mac’s rate at 6.16% and the Mortgage Bankers Association (MBA) rate at 6.33%, highlights key differences in the mortgage market. Jumbo mortgages, which exceed the conforming loan limits set by government agencies like Freddie Mac, typically carry higher interest rates because they are riskier for lenders. These loans are not backed by government entities, which increases the risk for lenders and, consequently, leads to higher rates. In contrast, Freddie Mac and MBA provide averages for conforming loans, which meet federal guidelines and have lower risk due to government backing, keeping their rates lower.
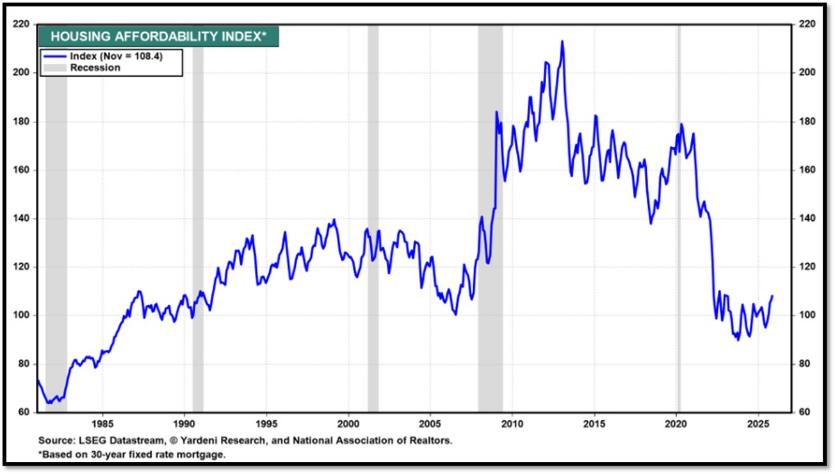
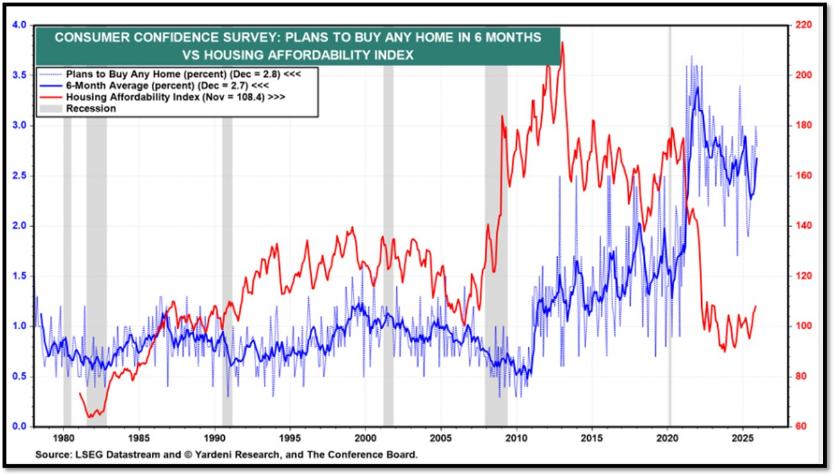
Housing Affordability Index for Nov = 108.4 // Oct = 106.2 // Sep = 104.5 // Aug = 100.5 // July = 98.8 // Jun = 94.4 // May = 97.2 // Apr = 101.0. Data provided by Yardeni Research. REF: Yardeni
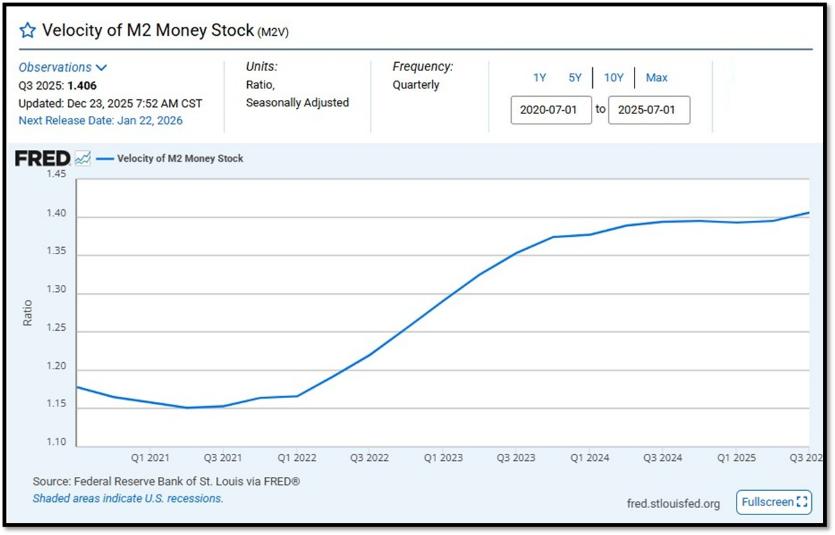
5J. Velocity of M2 Money Stock (M2V) with current read at 1.406 as of (Q3-2025 updated December 23, 2025). Previous quarter’s data was 1.392. The velocity of money is the frequency at which one unit of currency is used to purchase domestically- produced goods and services within a given time period. In other words, it is the number of times one dollar is spent to buy goods and services per unit of time. If the velocity of money is increasing, then more transactions are occurring between individuals in an economy. Current Money Stock (M2) report can be viewed in the reference link. REF: St.LouisFed-M2V
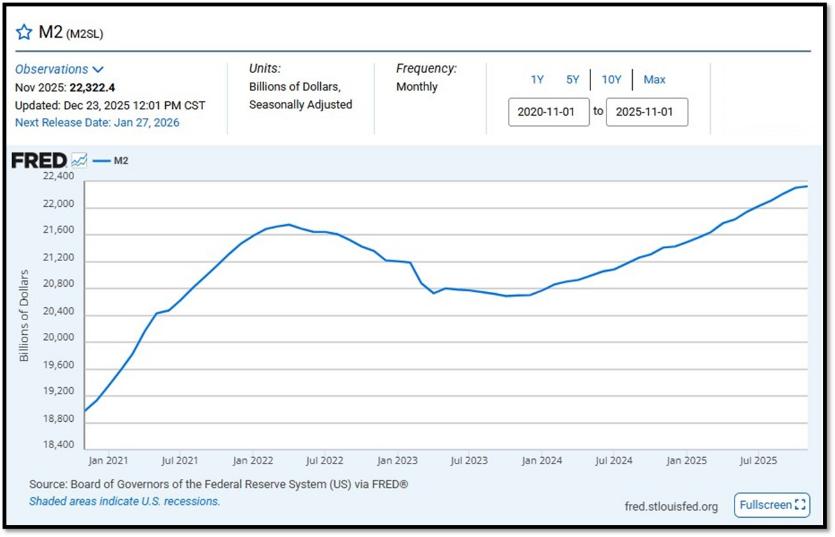
M2 consists of M1 plus (1) small-denomination time deposits (time deposits in amounts of less than $100,000) less IRA and Keogh balances at depository institutions; and (2) balances in retail MMFs less IRA and Keogh balances at MMFs. Seasonally adjusted M2 is constructed by summing savings deposits (before May 2020), small-denomination time deposits, and retail MMFs, each seasonally adjusted separately, and adding this result to seasonally adjusted M1. Board of Governors of the Federal Reserve System (US), M2 [M2SL], retrieved from FRED, Federal Reserve Bank of St. Louis; Updated on November 25, 2025. REF: St.LouisFed-M2
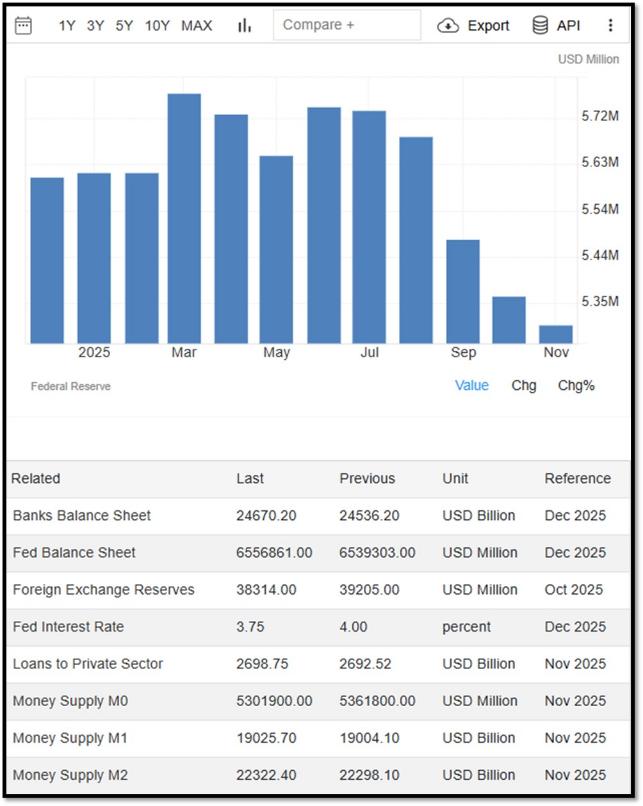
Money Supply M0 in the United States decreased to 5,301,900 USD Million in November from 5,361,800 USD Million in October of 2025. Money Supply M0 in the United States averaged 1,227,132.13 USD Million from 1959 until 2025, reaching an all-time high of 6,413,100.00 USD Million in December of 2021 and a record low of 48,400.00 USD Million in February of 1961.. REF: TradingEconomics, M0
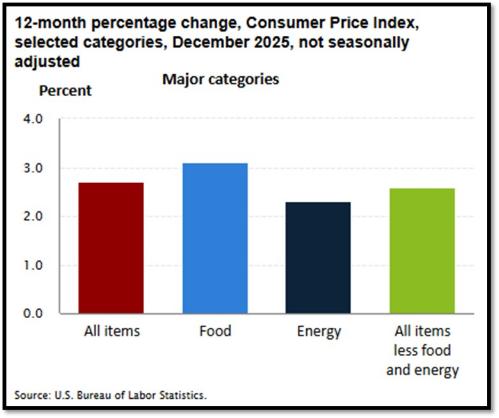
5K. In December, the Consumer Price Index for All Urban Consumers rose 0.3%, seasonally adjusted, and rose 2.7% over the last 12 months, not seasonally adjusted. The index for all items less food and energy increased 0.2% in December (SA); up 2.6% over the year (NSA). January 2026 CPI data are scheduled to be released on February 11, 2026, at 8:30 A.M. Eastern Time.. REF: BLS, BLS.GOV
5L. Technical Analysis of the S&P500 Index. Click onto reference links below for images.
- Short-term Chart: Trend Bullish on 1/12/2026 – REF: Short-term S&P500 Chart by Marc Slavin (Click Here to Access Chart)
- Medium-term Chart: Trend Bullish on 1/12/2026 – REF: Medium-term S&P500 Chart by Marc Slavin (Click Here to Access Chart)
- Market Timing Indicators – S&P500 Index as of 1/12/2026 – REF: S&P500 Charts (7 of them) by Joanne Klein’s Top 7 (Click Here to Access Updated Charts)
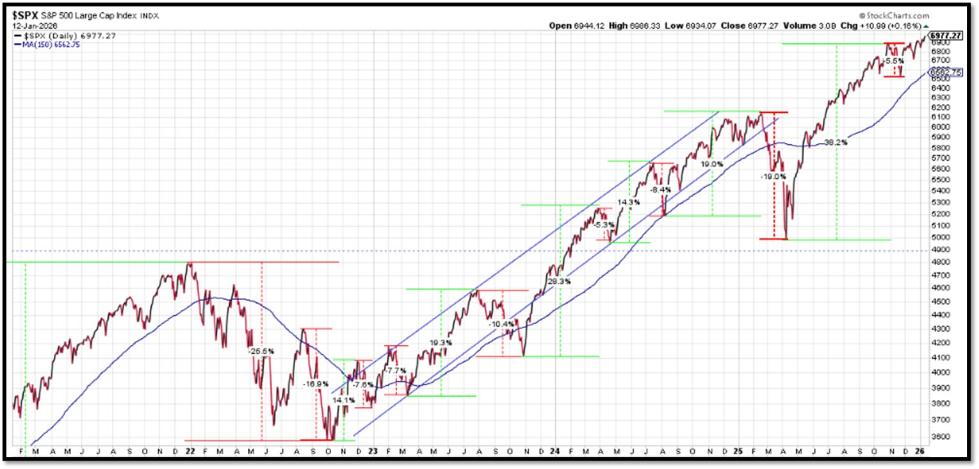
- The S&P500 is sitting near all-time-high levels, rebounding from two V-shaped recoveries. REF: Stockcharts
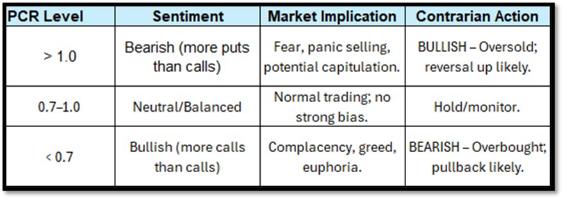
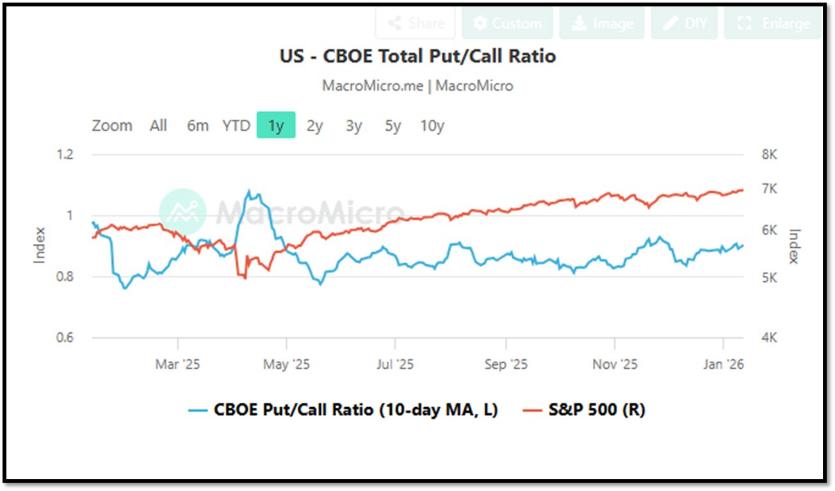
- CBOE Total Put/Call Ratio as of 1/12/2026. REF: MacroMicro
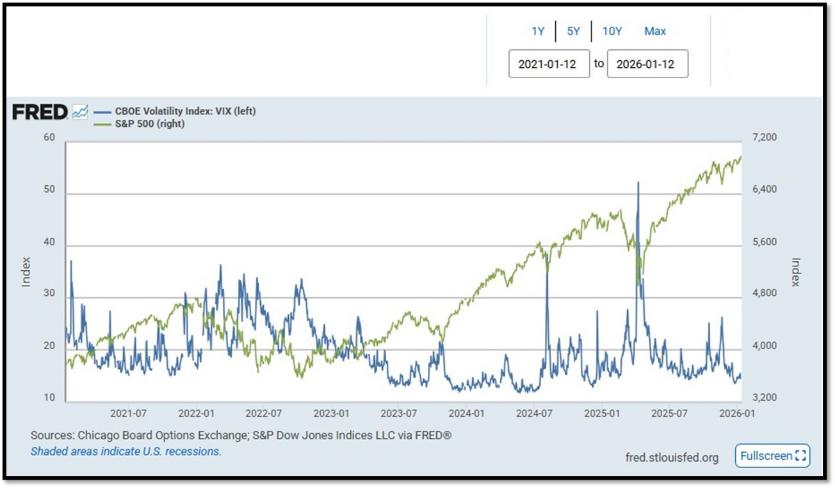
- S&P500 and CBOE Volatility Index (VIX) as of 1/12/2026. REF: FRED, Today’s Print
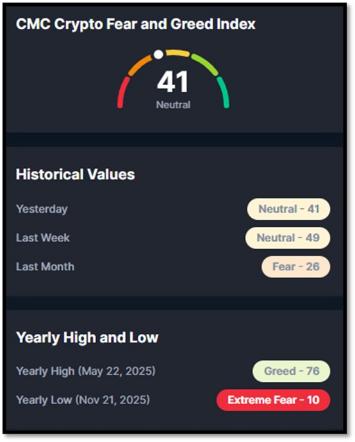
5M. Most recent read on the Crypto Fear & Greed Index with data as of 1/13/2026 is 41 (Neutral). Last week’s data was 49 (Neutral) (1-100). Fear & Greed Index – A Contrarian Data. The crypto market behavior is very emotional. People tend to get greedy when the market is rising which results in FOMO (Fear of missing out). Also, people often sell their coins in irrational reaction of seeing red numbers. With the Crypto Fear and Greed Index, the data try to help save investors from their own emotional overreactions. There are two simple assumptions:
- Extreme fear can be a sign that investors are too worried. That could be a buying opportunity.
- When Investors are getting too greedy, that means the market is due for a correction.
Therefore, the program for this index analyzes the current sentiment of the Bitcoin market and crunch the numbers into a simple meter from 0 to 100. Zero means “Extreme Fear”, while 100 means “Extreme Greed”. REF: Coinmarketcap.com, Today’sReading
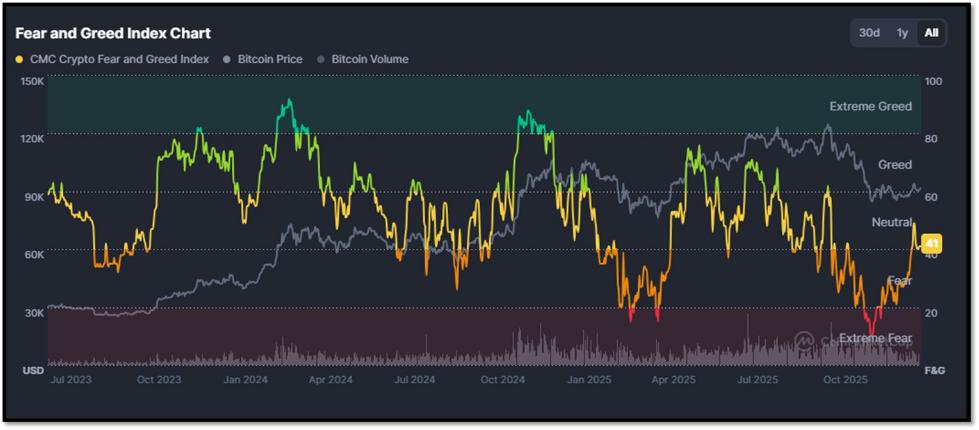
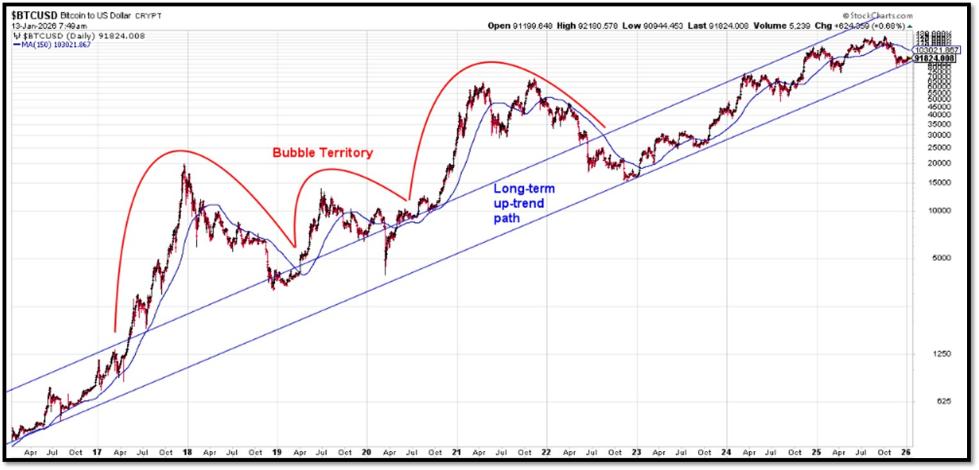
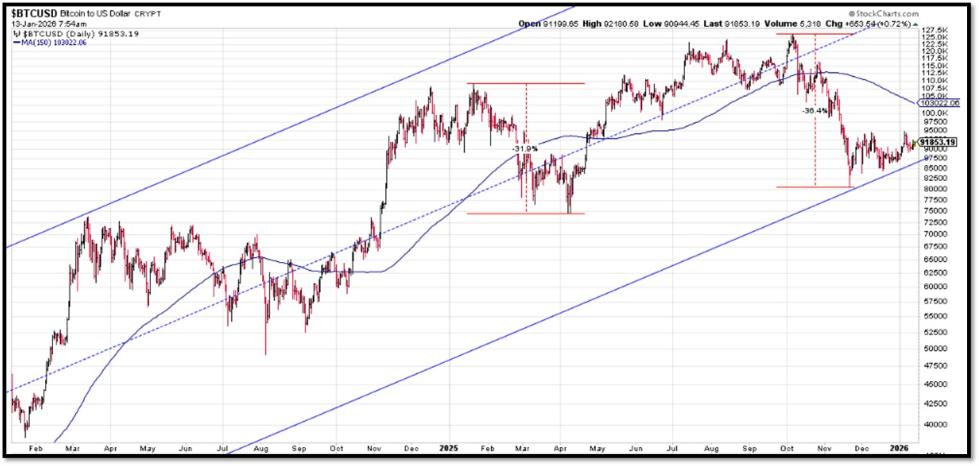
Bitcoin – 10-Year & 2-Year Charts. REF: Stockcharts10Y, Stockcharts2Y
From the desk of our Chief Investment Officer
As an investment professional with over twenty-six years of experience in the financial services industry, Andrew helps clients to protect, grow and transfer wealth during their lifetime with objective, unbiased, customized and efficient strategies.
Education, Professional Licenses Acquired & Affiliations
- Passed the Series 7, 63, 65 and 24 license examinations
- Currently holding Series 65 License
- BA in Economics – Boston University (Boston, MA) 1993
- Certificate in Commodities Trading – New York University (New York, NY) 1991
- Certificate in Financial Planning – New York University (New York, NY) April 2011
With extensive experience in the Financial Services Industry, Andrew Tang and Turner Financial Group provides disciplined wealth management with an intelligent caring approach to each and every client that compliments the Dedicated Financial offering.


Len writes much of his own content, and also shares helpful content from other trusted providers like Turner Financial Group (TFG).
The material contained herein is intended as a general market commentary, solely for informational purposes and is not intended to make an offer or solicitation for the sale or purchase of any securities. Such views are subject to change at any time without notice due to changes in market or economic conditions and may not necessarily come to pass. This information is not intended as a specific offer of investment services by Dedicated Financial and Turner Financial Group, Inc.
Dedicated Financial and Turner Financial Group, Inc., do not provide tax, legal or accounting advice. You should consult your own tax, legal and accounting advisors before engaging in any transaction.
Any hyperlinks in this document that connect to Web Sites maintained by third parties are provided for convenience only. Turner Financial Group, Inc. has not verified the accuracy of any information contained within the links and the provision of such links does not constitute a recommendation or endorsement of the company or the content by Dedicated Financial or Turner Financial Group, Inc. The prices/quotes/statistics referenced herein have been obtained from sources verified to be reliable for their accuracy or completeness and may be subject to change.
Past performance is no guarantee of future returns. Investing involves risk and possible loss of principal capital. The views and strategies described herein may not be suitable for all investors. To the extent referenced herein, real estate, hedge funds, and other private investments can present significant risks, including loss of the original amount invested. All indexes are unmanaged, and an individual cannot invest directly in an index. Index returns do not include fees or expenses.
Turner Financial Group, Inc. is an Investment Adviser registered with the United States Securities and Exchange Commission however, such registration does not imply a certain level of skill or training and no inference to the contrary should be made. Additional information about Turner Financial Group, Inc. is also available at www.adviserinfo.sec.gov. Advisory services are only offered to clients or prospective clients where Turner Financial Group, Inc. and its representatives are properly licensed or exempt from licensure. No advice may be rendered by Turner Financial Group, Inc. unless a client service agreement is in place.


